Supplemental Digital Content is available in the text
Keywords: authorship-weighted scheme, Google Maps, health insurance database, pubmed center, social
Abstract
Background:
Many researchers use the National Health Insurance Research Database (HIRD) to publish medical papers and gain exceptional outputs in academics. Whether they also obtain excellent citation metrics remains unclear.
Methods:
We searched the PubMed database (www.ncbi.nlm.nih.gov/pubmed) using the terms Taiwan and HIRD. We then downloaded 1997 articles published from 2012 to 2016. An authorship-weighted scheme (AWS) was applied to compute coauthor partial contributions from the article bylines. Both modified x-index and author impact factor (AIF) proved complementary to Hirsch's h-index for calculating individual research achievements (IRA). The metrics from 4684 authors were collected for comparison. Three hundred eligible authors with higher x-indexes were located and displayed on Google Maps dashboards. Ten separate clusters were identified using social network analysis (SNA) to highlight the research teams. The bootstrapping method was used to examine the differences in metrics among author clusters. The Kano model was applied to classify author IRAs into 3 parts.
Results:
The most productive author was Investigator#1 (Taichung City, Taiwan), who published 149 articles in 2015 and included 803 other members in his research teams. The Kano diagram results did not support his citation metrics beyond other clusters and individuals in IRAs.
Conclusion:
The AWS-based bibliometric metrics make individual weighted research evaluations possible and available for comparison. The study results of productive authors using HIRD did not support the view that higher citation metrics exist in specific disciplines.
Highlights
The viewpoint that productive authors using HIRD is not necessary with higher IRAs has been verified in this study.
The revised x-index was proposed in this study to reasonably and fairly assess author IRAs in comparison to the original x-index.
The authorship-weighted scheme (AWS) applied to evaluated IRAs with dashboards on Google Maps has been particularly illustrated and introduced in this study.
1. Introduction
Many authors have conducted retrospective, population-based cohort studies utilizing the National Health Insurance Research Database (HIRD).[1] The HIRD contains a disease group with records of patient treatments and prescriptions. Each patient was selected using frequency matching methods according to age, gender, and comorbidities without the study disease from the general population to form a control group.[2] Logistic regression analysis is commonly performed to predict the probabilities of disease risk.[3,4] Thus far, many articles have applied this method of analysis using HIRD with similar formatting in their research.
However, Hampson and Weaver[1] criticized these HIRD researchers for using what appears to be a template that is not hypothesis-driven for one study model, which is unhelpful to clinicians. This is because each paper described only two conditions that were associated with HIRD, often with no apparent connection to medical practice. Hampson and Weaver published one paper with criticisms bout CO poisoning[4] followed by four CO publications[5–8] based on the same research team using the same research model and database.[3–6] The most productive author was Chia-Hung Kao (Taiwan), who published 149 papers using HIRD in 2015.[2] We are intrigued to learn more about whether Dr. Kao and his research team members gained improved individual research achievements (IRA) using bibliometric indices for evaluation.
Two major difficulties we encountered in our study include the following:
-
(1)
coauthors with equal credits in an article byline are unreasonable; and
-
(2)
the Hirsch h-index[9] has less discrimination power due to the integer (ie, many of the same index value) making it difficult to differentiate the personal IRA.[10]
Many counting schemes have been proposed to quantify coauthor contributions[11] such as fractional counting[12–15] and authorship-weighted counting[15–17] as well as traditional full counting (where all authors contribute equally to a scientist's publication record, like with the use of the h-index). A feasible authorship-weighted scheme (AWS)[18] and the x-index[19] have been proposed to solve these problems.
We used the x-index and author impact factor (AIF)[20] indices to evaluate whether productive authors also achieve higher citation metrics. Three goals of our research were to investigate the differences in
-
(1)
author affiliation cities;
-
(2)
author research teams; and
-
(3)
author personal IRAs.
2. Methods
2.1. Data source
We searched the PubMed Center (www.ncbi.nlm.nih.gov/pubmed, PMC) using the terms Taiwan and the National Health Insurance Research Database on April 4, 2019. In total, we downloaded 1997 articles that were published from 2012 to 2016. The reasons we chose this particular 5-year time-period window were:
-
(1)
to make the AIF congruent with the 5-year journal impact factor provided by Thomson Reuters; and
-
(2)
to avoid showing relatively more fluctuations in 2 years.[20]
An author-made Microsoft Excel VBA (visual basic for application) module was used to analyze data using the web-crawler technique for matching the cited articles of a given journal indexed in PMC (see Supplemental Digital Content 1). All downloaded abstracts were based on the journal article type. The pre-requisite condition for a selected paper was having at least 1 author from Taiwan. All data used in this study were downloaded from PMC, which meant that the study did not require ethical approval according to the regulations promulgated by the Taiwan Ministry of Health and Welfare.
2.2. Two prerequisites used for evaluating author IRAs
An AWS was applied to weight coauthors’ contributions in article bylines[18] to improve the unreasonable phenomenon that forces all papers to have equal weight irrespective of the number of coauthors.[11] Accordingly, more importance was given to the first (primary) authors and the last (corresponding/supervisory) authors, while we assumed that the others (ie, the middle authors) made smaller contributions.[18]
Furthermore, the x-index  as determined by the maximum area rectangle that fits under the curves,[19] where ci is not less than 1.0. That is, the height of the maximum rectangle equals the number of citations ck to the kth most-cited publication when citations for all articles are in descending order. As such, the x-index generalizes the h-index[9] which is determined by the square area (ie, the number of publications equal to the citation point). However, the disadvantage of the x-index is the equal importance placed on the citations and publications. We, therefore, applied the Kano model[20] dividing IRAs into three areas of the excitement, the performance, and the basic requirement for a full interpretation of the x-index in comparison on a diagram.
The AIF is determined by the number of citations divided by the number of publications.[21] Both the AIF and the x-index were used to assess IRAs for authors and their research teams.
2.3. Differences in author affiliation cities
Whether the productive authors have higher IRAs in comparison to their counterparts was assessed using choropleth maps[22] to display the x-index and AIF based on affiliation cities. The legend for visualizing the difference in data distribution was particularly designed to do so.[23] The pyramid plot was complemental to the choropleth maps based on the x-index and AIF metrics.
2.4. Differences in author research teams
Social network analysis (SNA)[2,23–26] was performed using Pajek software[27] to partition clusters according to 2 criteria on the respective centrality degree:
-
(1)
production-based clusters [see Eq. (1)],[18,25] where author number = m based on the parameter γ from m-1 (ie, the first author) to 0 (i.e., the smallest contributing author); and
-
(2)
citation-based clusters [see Eq. (2), whereas Ci denotes article citations]. The latter highlights the citation achievements in comparison to the former ones among subnetworks (ie, research teams).
 |
We defined an author as a node (or an actor) that is connected to another counterpart at another node through the edge of a line.[25,26] Usually, a weight for a note was defined by the total number of connections related to other nodes (see Supplemental Digital Content 2).
The associated research teams were separated from each other (see Supplemental Digital Content 3). The relation weight on each connection for coauthors in an article byline was defined as the summation of the 2 authors via Eq. (1). That is, the author's weight was the summation of all relation weights. The citation-based author weight is additionally referred to that as Eq. (2). The larger ten clusters were illustrated and compared in metrics. The author with a bigger bubble was expected to have a higher citation, more publications, and a greater contribution to an article byline.
The bootstrapping method[28] was used to examine differences in metrics among author clusters. A total of 1000 median metrics were retrieved from random samples of 100 repetitions of mean values for each metric and cluster. Thus, the median and 95% confidence intervals (CI) were obtained to compare differences in metrics among author clusters by inspecting whether two 95% CI bands were not overlaid.
2.5. Differences in author personal IRAs
The scatter plot was created using the x-index (on the Y-axis), AIF (on the X-axis), and the h-index by bubble size. The clusters were colored according to the separations using SNA to partition from the previous section.
We examined whether the productive author (eg, Dr Kao[2] as Investigator#1) had an exceptional IRA on metrics as well. That is, whether any author whose IRA was superior to Dr Kao would be inspected in this study. We included the top 300 authors with excellent metrics in an author-made Excel module and then created a page of Hyper Text Mark-up Language used for Google Maps (see Supplemental Digital Content 2) to display the results. The Kano model[20] was applied to classify author IRAs into three parts, where citations in computing x-index are allowed to less than 1.0.
3. Results
3.1. Differences in author affiliation cities
The legends are shown on choropleth maps and include cutting points, cumulative frequency, and the count in each class. The affiliation city for Dr Kao (Investigator#1) was Taichung, ranking the x-index in first place in Figure 1, but failed using AIF in Figure 1, indicating that excellent achievements in publications cannot always refer to all types of IRA in metrics. The pyramind plot is shown in Figure 2 as a complemental interpretation of choropleth maps in Figure 1. We recommend that interested readers scan the QR-codes in Figure 1 to examine counties in detail on the choropleth maps.
Figure 1.
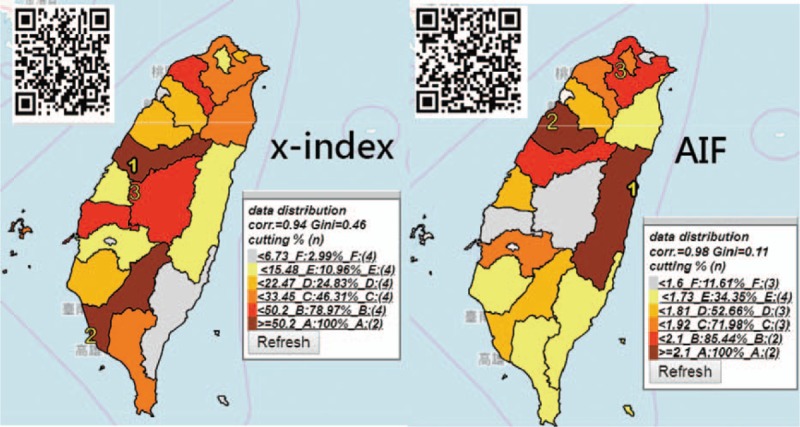
Difference in author affiliation cities compared on choropleth maps.
Figure 2.
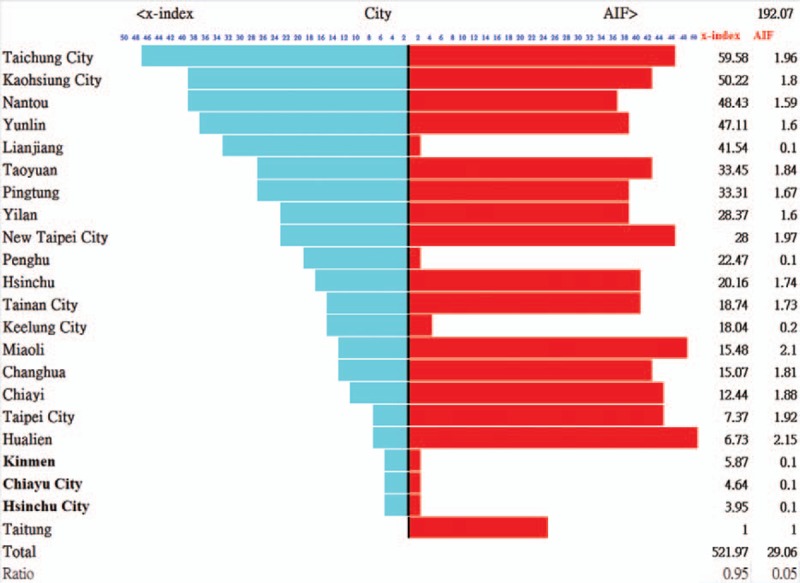
Lorenz curves and Gini coefficients to compare difference in data distribution.
3.2. Differences in author research teams
The top ten clusters based on publication were separated using SNA and displayed in Figure 3. The cluster with the biggest bubble (eg, the symbol 1) indicates the most productive achievement onto Investigator#1(Dr Kao), even if the author credits were weighted by the AWS (ie, Eq. (1)) because Investigator#1 (Dr Kao) frequently appeared as a corresponding author in the byline.
Figure 3.
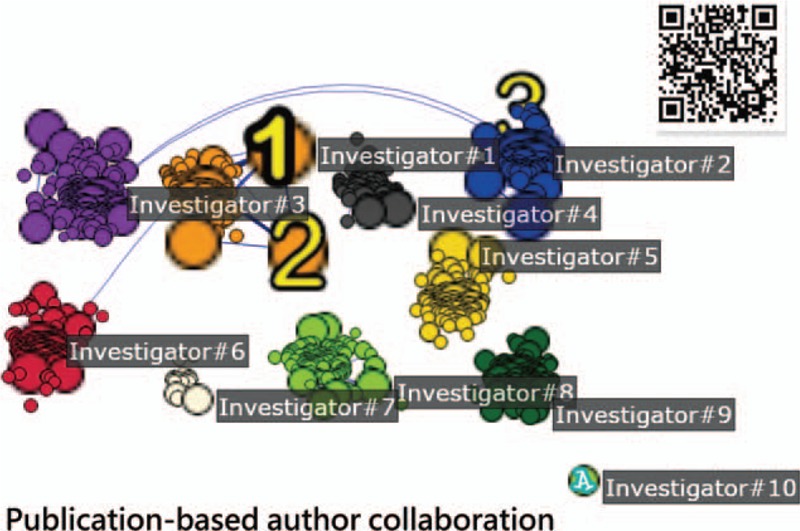
The top ten production based author clusters separated apart using social network analysis.
If citations were included in comparison using Eq. (2), Investigator#1 (Dr Kao) still ranks as the top author according to the criterion of centrality degree (see Fig. 4). This is because increased publications and author position in an article byline affect the centrality degree more than the citation of articles. In contrast, Investigator#10 (Dr Tseng), who is the single author in 28 articles, was cited 80 times in PMC (see the right-bottom side in Figs. 3 and 4) was significantly affected by the citations (eg, AIF = 2.86 = 80/28). Besides Investigator#10 (Dr Tseng), all other clusters have at least one connection (or coauthor) interrelated to others (see the lines in Figs. 3 and 4).
Figure 4.
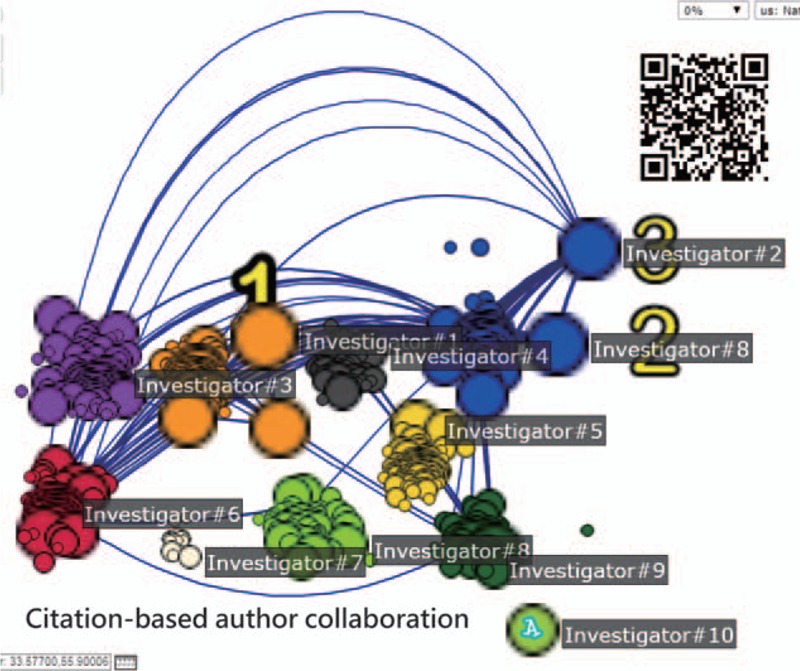
The top 10 citation based author clusters separated apart using social network analysis.
The result of the comparison of IRAs for research teams using metrics and the bootstrapping method is shown in Figure 5. We see that the cluster (n = 804) represented by Investigator#1 (Dr Kao) is only superior to the cluster of Investigator#9 (Dr Keller) (n = 25). No differences in metrics were found among other clusters in comparison to other clusters due to all 95% CI overlaid (ie, P < .05).
Figure 5.
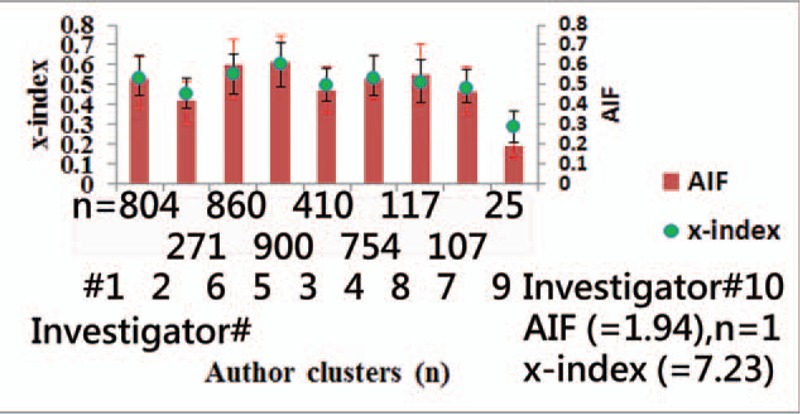
Comparison of research teams using metrics and the bootstring method.
3.3. Differences in author personal IRAs
The comparison of personal IRAs for authors using metrics on the scatter plot is presented in Figure 6. We see Investigator#1 (Dr Kao) located at the left-top side, indicating a lower AIF (=1.94), x-index (=7.23), and h-index (=1) compared to Investigator#10 (Dr Tseng) (on the right-top side in Fig. 6), with AIF (=2.86), x-index (=8.49), and h-index (=3). We ensured that the most productive author (Kao, Chia-Hung) had a relatively lower number of citations in publications using the Kano model[33] (see his publication in Fig. 7, where citations for each article are allowed to be less than 1.0). We suggest reviewing the authors’ publications and their metrics in more detail by scanning the QR-code in Figures 6 and 7.
Figure 6.
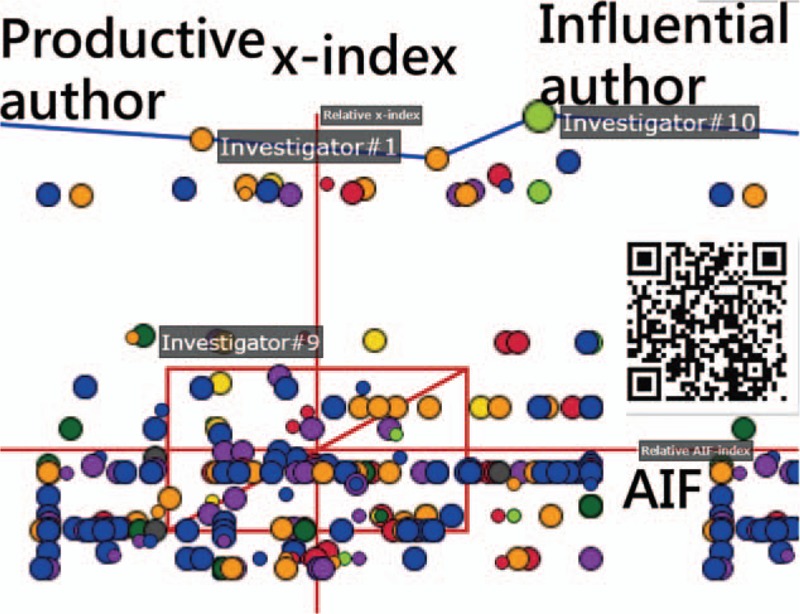
Comparison of person individual research achievements for authors using metrics on the scatter plot.
Figure 7.
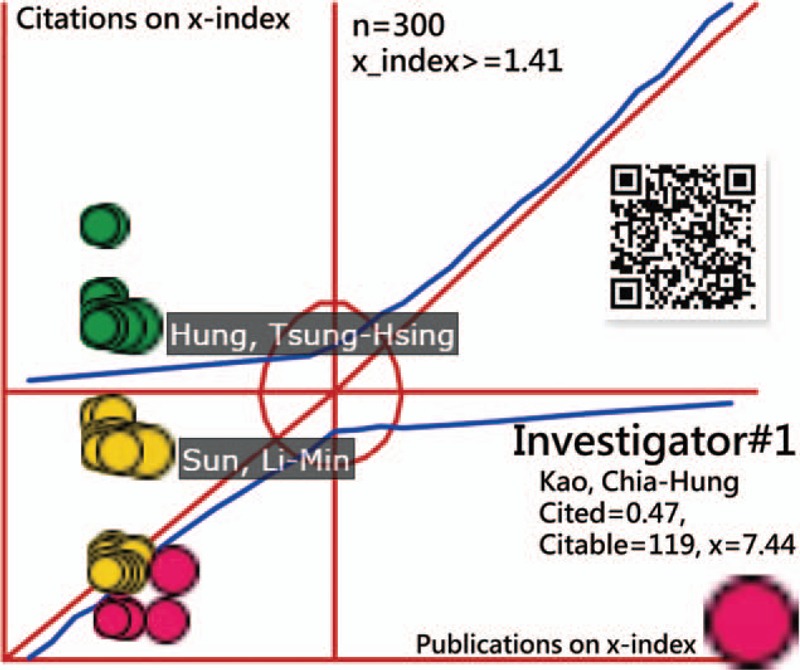
Person individual research achievements on the x-index on the Kano diagram.
4. Discussion
The results observed in Figures 5–7 show that the most productive authors do not always have parallel IRAs in citations because no evidence exists in bibliometric metrics beyond other clusters and individuals.
4.1. What does this knowledge add to what we already know?
Although the h-index,[9] a popular author-level metric, can measure both the productivity and citation impact of a scientist's publications, one of its shortcomings is the assumption of equal credits for all coauthors in an article.[29,30] In addition, academic nepotism exists, leading to conflicts of interest and even inappropriate (kin) authorship in biomedical publications.[31–34] Many AIF concepts have been proposed before.[20,35,36] Currently, besides our previous articles,[18,25,37] we are not aware of any empirical study that can solve the problem of quantifying coauthor contributions[30] in a specific discipline like HIRD in this study. With the AWS, we are thus able to disclose the results of whether productive authors earn equal IRAs in citations.
Three types of authors were illustrated in the references,[38,39] such as the perfect, the prolific, and the productive, as defined by the ratio of citations to the number of publications. Three parts of citation-originated excitement, one-dimensional performance, and productivity-originated requirement are apparently defined n Figure 7 under the Kano model.[20] Hampson and Weaver[1] criticized these productive HIRD researchers for using a template to publish articles. This study supports the findings mentioned above.
The h-index is strictly limited to both criteria of citations and publications in a monotonously increased trend using the square area(eg, the one-dimensional performance in Figure 7 under Kano model) to measure the comparison of the x-indexes using the height of the maximum rectangle  , leniently defined along with the 45-degree line.
4.2. What do these findings imply and what should be changed?
Using choropleth maps[22] makes it very difficult to distinguish proportional frequencies among different shades.[40,41] Two approaches (ie, ogive-based legends or proportional symbols) have been proposed for use on choropleth maps.[22,42,43] However, the distribution of the data regarding value disparities across classified classes has not been effectively nor entirely solved. Choropleth maps along with a bar chart for identifying the proportion of each entity is in need. Data distributed in classes should be reported in the literature in the future, such as dengue outbreaks,[44,45] disease hotspots,[46] and the Global Health Observatory maps on major health topics.[47]
We considered the relationships using SNA to display authors within and between clusters. Usually, it is hard to find a relationship between multiple entities such as diagnoses or diseases. We illustrated the SNA method (see Supplemental Digital Contents in detail), which can be applied to other bibliometric studies[48–52] in the future.
4.3. Strengths of this study
Traditional studies on author collaborations assumed that all coauthors contributed equal credits to articles. The most worthy feature is the general AWS, which is fully congruent with the category probability theory based on the Rasch Rating Scale Model (RSM).[53,54] Hence, Vavryčuk's combined weighted scheme[11] (or the harmonic credits[55]) is a special case of the general AWS we used in this study. We can adjust the parameters (ie, the base and power) to accommodate many types of situations or scenarios in practice, and we can draw the publication-based author collaborations (Fig. 3) and the citation-based ones (Fig. 4) precisely.
The second feature is the intrinsic dynamic character of the simple 5-year moving average AIFs or modified x-index, like the JCR locating journal impact factor every June, to examine the change in an author's IRA shown on a dashboard (eg, Fig. 6), which is closely related to decisions about faculty positions, contracts, salaries, or grant applications.[56,57] This is unlike the h-index, which is a growing measure taking into account the individual's whole career path.[11,21]
The third feature is the Google Maps metrics, which are suitable for use in many academic fields. We can narrow published articles down to a specific subject (eg, topic or discipline), area (eg, country), or journal, and then compute metrics for each author in comparison with each other. This is unlike the h-index, which may invalidate comparisons within different fields of research in one discipline.[14]
Notably, we transformed the coordinates from Pajek into Google Maps so that
-
(1)
all authors could be precisely located on Google Maps; and
-
(2)
all clusters could be gathered according to appropriate colors.
This has rarely been seen in previously published articles that show results with a dashboard on Google Maps.
Furthermore, we provide study data with Supplemental Digital Contents (ie, MP4 videos) that can be referred to for the operation and calculation of indices used in this study. Interested readers are invited to read them to learn more about the details relevant to this study.
4.4. Limitations and future study
Although the findings are based on the aforementioned analysis, several potential limitations still exist; these may encourage further research efforts. First, all data were extracted from the PubMed database. As such, some bias of understanding the most-cited authors may exist. This is because some authors having the same name or abbreviations are actually different people affiliated with different institutions. Therefore, the results of the author relationship analysis would be influenced by the accuracy of the indexing author.
Second, many algorithms have been used for SNA. We merely applied the algorithm of degree centrality, as seen in Figure 3. Any changes in the algorithm used in this study might present different patterns and judgment of the overall results.
Third, the data extracted from the PMC cannot be generalized to other major citation databases such as the Scientific Citation Index (Thomson Reuters, New York, NY, ) and Scopus (Elsevier, Amsterdam, the Netherlands). The phenomenon that the most productive author (eg, Investigator#1) using HIRD does not have higher IRAs is evident (see Fig. 7). However, we cannot guarantee that this phenomenon would similarly exist if applied to other databases.
Fourth, the most-cited authors are determined by the paper selections on PubMed. Whether the results regarding productive authors are necessary to earn the higher bibliometric indices still requires further inspection in the future.
Fifth, we demonstrated a general AWS for quantifying coauthor contributions and provided their metrics and publications in PMC using the zoom-in and zoom-out functionality on Google Maps. The parameters were arbitrarily set for calculating author weights in an exponentially descending order. Whether the metrics (ie, AIFs or x-indexes) can help editors (or, indeed, readers) understand who the most highly cited authors in a scientific discipline are (eg, HIRD) also needs to be verified in the future.
Sixth, the assumption of corresponding (or supervisory) authors being listed last might be challenged, especially in computing metrics. Any parameters changed from our proposed formula will affect the author's contribution weights and the resulting metrics. The parameters set to calculate weights in this study might accommodate the ordering of authors in the biomedical field (ie, the first author received the highest credit).[18,58] the corresponding author earned the next highest credit, and the other authors’ credits gradually decrease according to their position in the list).[59] We confirmed that Investigator#10 (on the right-top side in Fig. 6 and the isolated author at the right-bottom corner in Figs. 3 and 4) is the eminent HIRD author in Taiwan, no matter which parameters are assigned in the AWS. Investigator#10 is a very special case that causes all single-author articles (see Supplemental Digital Content 4) to be placed much higher in citations and publications.
4.5. Conclusion
The AWS-based bibliometric metrics make individual weighted research evaluations possible and available for comparison. The productive authors using HIRD do not support the viewpoint of having higher IRAs as well in a specific discipline. The metrics incorporated with SNA shown on Google Maps provide beneficial and illuminating insight into the relationship between citable and cited achievements for authors, and they can be replicated in the future.
Acknowledgments
We thank Enago (www.enago.tw) for the English language review of this manuscript. All authors declare no conflicts of interest.
Author contributions
Conceptualization: Wan-Ting Tsai Hsieh, Chien Tsai Wei.
Data curation: Wan-Ting Tsai Hsieh, Chien Tsai Wei.
Formal analysis: Chien Tsai Wei.
Funding acquisition: Wan-Ting Tsai Hsieh.
Project administration: Hung-Jung Lin.
Resources: Shu-Chun Kuo.
Supervision: Hung-Jung Lin.
Validation: Shu-Chun Kuo.
Visualization: Chien Tsai Wei.
Writing – original draft: Chien Tsai Wei.
Chien Tsai Wei orcid: 0000-0003-1329-0679.
CHIEN TSAI WEI orcid: 0000-0003-1329-0679.
Supplementary Material
Supplementary Material
Supplementary Material
Supplementary Material
Footnotes
Abbreviations: AIF = author impact factor, AWS = an authorship-weighted scheme, HIRD = Health Insurance Research Database, HTML = Hyper Text Mark-up Language, PMC = Pubmed Center, SNA = social network analysis, VBA = visual basic for application.
How to cite this article: Hsieh WT, Chien TW, Kuo SC, Lin HJ. Whether productive authors using the national health insurance database also achieve higher individual research metrics: A bibliometric study. Medicine. 2020;99:2(e18631).
All data were downloaded from the MEDLINE database at pubmed.com.
All data used in this study is available in SDC files.
The authors have no funding and conflicts of interests to disclose.
References
- [1].Hampson NB, Weaver LK. Carbon monoxide poisoning and risk for ischemic stroke. Eur J Intern Med 2016;31:e7. [DOI] [PubMed] [Google Scholar]
- [2].Chien TW, Chang Y, Wang HY. Understanding the productive author who published papers in medicine using the National Health Insurance Database: a systematic review and meta-analysis. Medicine (Baltimore) 2018;97:e9967. [DOI] [PMC free article] [PubMed] [Google Scholar]
- [3].Lin SY, Lin CL, Hsu WH, et al. Association of statin use and the risk of end-stage renal disease: a nationwide Asian population-based case-control study. Eur J Intern Med 2016;31:68–72. [DOI] [PubMed] [Google Scholar]
- [4].Lin CW, Chen WK, Hung DZ, et al. Association between ischemic stroke and carbon monoxide poisoning: a population-based retrospective cohort analysis. Eur J Intern Med 2016;29:65–70. [DOI] [PubMed] [Google Scholar]
- [5].Chung WS, Lin CL, Kao CH. Carbon monoxide poisoning and risk of deep vein thrombosis and pulmonary embolism: a nationwide retrospective cohort study. J EpidemiolCommunity Health 2015;69:557–62. [DOI] [PubMed] [Google Scholar]
- [6].Lee FY, Chen K, Lin CL, et al. Carbon monoxide poisoning and subsequent risk of cardiovascular disease: a nationwide population-based cohort study. Medicine 2015;94:1–8. [DOI] [PMC free article] [PubMed] [Google Scholar]
- [7].Lai CY, Chou MC, Lin CL, et al. Increased risk of Parkinson's disease in patients with carbon monoxide intoxication: a population-based cohort study. Medicine 2015;94:1–6. [DOI] [PMC free article] [PubMed] [Google Scholar]
- [8].Chen YG, Lin TY, Dai MS, et al. Risk of peripheral artery disease in patients with carbon monoxide poisoning: a population-based retrospective cohort study. Medicine 2015;94:1–6. [DOI] [PMC free article] [PubMed] [Google Scholar]
- [9].Hirsch JE. An index to quantify an individual's scientific research output. Proc Natl Acad Sci U S A 2005;102:16569–728. [DOI] [PMC free article] [PubMed] [Google Scholar]
- [10].Huang MH, Chi PS. A comparative analysis of the application of H-index, G-index, and A-index in institutional-level research evaluation. J Libr Inf Stud 2010;8:1–0. [Google Scholar]
- [11].Vavryčuk V. Fair ranking of researchers and research teams. PLoS One 2018;13:e0195509. [DOI] [PMC free article] [PubMed] [Google Scholar]
- [12].Batista PD, Campiteli MG, Kinouchi O, et al. Is it possible to compare researchers with different scientific interests? Scientometrics 2006;68:179–89. [Google Scholar]
- [13].Lindsey D. Production and citation measures in the sociology of science: the problem of multiple authorship. Soc Stud Sci 1980;10:145–62. [Google Scholar]
- [14].Lindsey D. Further evidence for adjusting for multiple authorship. Scientometrics 1982;4:389–95. [Google Scholar]
- [15].Egghe L, Rousseau R, Van Hooydonk G. Methods for accrediting publications to authors or countries: consequences for evaluation studies. J Am Soc Inform Sci 2000;51:145–57. [Google Scholar]
- [16].Tscharntke T, Hochberg ME, Rand TA, et al. Author sequence and credit for contributions in multiauthored publications. PLoS Biol 2007;5:e18. [DOI] [PMC free article] [PubMed] [Google Scholar]
- [17].Waltman L. A review of the literature on citation impact indicators. J Informetr 2015;10:365-91. [Google Scholar]
- [18].Chien TW, Chow JC, Chang Y, et al. Applying Gini coefficient to evaluate the author research domains associated with the ordering of author names: a bibliometric study. Medicine (Baltimore) 2018;97:e12418. [DOI] [PMC free article] [PubMed] [Google Scholar]
- [19].Fenner T, Harris M, Levene M, et al. A novel bibliometric index with a simple geometric interpretation. PLoS One 2018;13:e0200098. [DOI] [PMC free article] [PubMed] [Google Scholar]
- [20].Kano N, Seraku N, Takahashi F, et al. Attractive quality and must-be quality. J Jpn Soc Qual Control 1984;41:39–48. [Google Scholar]
- [21].Pan RK, Fortunato S. Author impact factor: tracking the dynamics of individual scientific impact. Sci Rep 2014;4:4880. [DOI] [PMC free article] [PubMed] [Google Scholar]
- [22].Chien TW, Wang HY, Hsu CF, et al. Choropleth map legend design for visualizing the most influential areas in article citation disparities: a bibliometric study. Medicine (Baltimore) 2019;98:e17527. [DOI] [PMC free article] [PubMed] [Google Scholar]
- [23].Zhang C, Yu Q, Fan Q, et al. Research collaboration in health management research communities. BMC Med Inform Decis Mak 2013;13:52. [DOI] [PMC free article] [PubMed] [Google Scholar]
- [24].Freeman LC. Centrality in social networks conceptual clarification. Soc Netw 1979;1:215–39. [Google Scholar]
- [25].Chien TW, Wang HY, Kan WC, et al. Whether article types of a scholarly journal are different in cited metrics using cluster analysis of MeSH terms to display: a bibliometric analysis. Medicine (Baltimore) 2019;98:e17631. [DOI] [PMC free article] [PubMed] [Google Scholar]
- [26].Otte E, Rousseau R. Social network analysis: a powerful strategy, also for the information sciences. J Inform Sci 2002;28:441–53. [Google Scholar]
- [27].Batagelj V, Mrvar A. Jünger M, Mutzel P. Pajek - analysis, and visualization of large networks. Graph Drawing Software. Berlin: Springer; 2003. 77–103. [Google Scholar]
- [28].Efron B. Bootstrap methods: another look at the jackknife. Ann Stat 1979;7:1–26. [Google Scholar]
- [29].Petersen AM, Fortunato S, Pan RK3, et al. Reputation and impact in academic careers. Proc Natl Acad Sci U S A 2014;111:15316–21. [DOI] [PMC free article] [PubMed] [Google Scholar]
- [30].Sekercioglu CH. Quantifying coauthor contributions. Science 2008;322:371. [DOI] [PubMed] [Google Scholar]
- [31].Rivera H. Inappropriate authorship and kinship in research evaluation. J Korean Med Sci 2018;33:e105. [DOI] [PMC free article] [PubMed] [Google Scholar]
- [32].Allesina S. Measuring nepotism through shared last names: the case of Italian academia. PLoS One 2011;6:e21160. [DOI] [PMC free article] [PubMed] [Google Scholar]
- [33].Prosperi M, Buchan I, Fanti I, et al. Kin of coauthorship in five decades of health science literature. Proc Natl Acad Sci USA 2016;113:8957–62. [DOI] [PMC free article] [PubMed] [Google Scholar]
- [34].Grilli J, Allesina S. Last name analysis of mobility, gender imbalance, and nepotism across academic systems. Proc Natl Acad Sci USA 2017;114:7600–5. [DOI] [PMC free article] [PubMed] [Google Scholar]
- [35].Loomba RS, Anderson RH. Are we allowing impact factor to have too much impact: the need to reassess the process of academic advancement in pediatric cardiology? Congenit Heart Dis 2018;13:163–6. [DOI] [PubMed] [Google Scholar]
- [36].Cordero-Villafáfila A, Ramos-Brieva JA. The evaluation of the individual impact factor of researchers and research centers using the RC algorithm. Rev Psiquiatr Salud Ment 2015;8:189–94. [DOI] [PubMed] [Google Scholar]
- [37].Chien TW, Wang HY, Chang Y, et al. Using Google Maps to display the pattern of coauthor collaborations on the topic of schizophrenia: a systematic review between 1937 and 2017. Schizophr Res 2019;204:206–13. [DOI] [PubMed] [Google Scholar]
- [38].Zhang CT. The e-index, complementing the h-index for excess citations.The e-index, complementing the h-index for excess citations. PLoS One 2009;4:e5429. [DOI] [PMC free article] [PubMed] [Google Scholar]
- [39].Zhang CT. The h’-Index, effectively improving the h-index based on the citation distribution. PLoS One 2013;8:e59912. [DOI] [PMC free article] [PubMed] [Google Scholar]
- [40].Shen L, Xiong B, Li W, et al. Visualizing collaboration characteristics and topic burst on international mobile health research: bibliometric analysis. JMIR Mhealth Uhealth 2018;6:e135. [DOI] [PMC free article] [PubMed] [Google Scholar]
- [41].Barcelona Field Studies Centre. Choropleth Map with Proportional Symbols. 2019. Available at: https://geographyfieldwork.com/DataPresentationMappingTechniques.htm [access date April 4, 2019]. [Google Scholar]
- [42].Cromley RG, Ye Y. Ogive-based legends for choropleth mapping. Cartogr Geogr Inform Sci 2006;33:257–68. [Google Scholar]
- [43].Elliott LJ, Blanchard JF, Beaudoin CM, et al. Geographical variations in the epidemiology of bacterial sexually transmitted infections in Manitoba, Canada. Sex Transm Infect 2002;78: Suppl 1: i139–44. [DOI] [PMC free article] [PubMed] [Google Scholar]
- [44].Chen WJ. Dengue outbreaks and the geographic distribution of dengue vectors in Taiwan: a 20-year epidemiological analysis. Biomed J 2018;41:283–9. [DOI] [PMC free article] [PubMed] [Google Scholar]
- [45].Lai WT, Chen CH, Hung H, et al. Recognizing spatial and temporal clustering patterns of dengue outbreaks in Taiwan. BMC Infect Dis 2018;18:256. [DOI] [PMC free article] [PubMed] [Google Scholar]
- [46].Soetens L, Hahné S, Wallinga J. Dot map cartograms for detection of infectious disease outbreaks: an application to Q fever, the Netherlands and pertussis, Germany. Euro Surveill 2017;22: pii: 30562. [DOI] [PMC free article] [PubMed] [Google Scholar]
- [47].WHO. Global Health Observatory Map Gallery. 2019. Available at: https://www.who.int/gho/map_gallery/en/ [access date April 1, 2019]. [Google Scholar]
- [48].Pu QH, Lyu Q, Liu H, et al. Bibliometric analysis of the top-cited articles on islet transplantation. Medicine (Baltimore) 2017;96:e8247. [DOI] [PMC free article] [PubMed] [Google Scholar]
- [49].Zhang K, Zhao J, Chu L, et al. China's growing contribution to sepsis research from 1984 to 2014: a bibliometric study. Medicine (Baltimore) 2017;96:e7275. [DOI] [PMC free article] [PubMed] [Google Scholar]
- [50].Miao Y, Liu R, Pu Y, et al. Trends in esophageal and esophagogastric junction cancer research from 2007 to 2016: a bibliometric analysis. Medicine (Baltimore) 2017;96:e6924. [DOI] [PMC free article] [PubMed] [Google Scholar]
- [51].Liao J, Wang J, Liu Y, et al. Modern researches on Blood Stasis syndrome 1989-2015: a bibliometric analysis. Medicine (Baltimore) 2016;95:e5533. [DOI] [PMC free article] [PubMed] [Google Scholar]
- [52].Wang Y, Wang Q, Zhu R, et al. Trends of spinal tuberculosis research (1994-2015): a bibliometric study. Medicine (Baltimore) 2016;95:e4923. [DOI] [PMC free article] [PubMed] [Google Scholar]
- [53].Andrich D. Relationships between the Thurstone and Rasch approaches to item scaling. Appl Psychol Meas 1978;2:449–60. [Google Scholar]
- [54].Chien TW, Shao Y. The most-cited Rasch scholars on Pubmed in 2018. Rasch Measur Trans 2019;32:1708–12. [Google Scholar]
- [55].Hagen NT. Harmonic allocation of authorship credit: source-level correction of bibliometric bias assures accurate publication and citation analysis. PLoS One 2008;3:e4021. [DOI] [PMC free article] [PubMed] [Google Scholar]
- [56].Paulus FM, Rademacher L, Schäfer TA, et al. Journal impact factor shapes scientists’ reward signal in the prospect of publication. PLoS One 2015;10:e0142537. [DOI] [PMC free article] [PubMed] [Google Scholar]
- [57].Lehmann S, Jackson AD, Lautrup BE. Measures for measures. Nature 2006;444:1003–4. [DOI] [PubMed] [Google Scholar]
- [58].Chien TW, Wang HY, Chang Y, et al. Using Google Maps to display the pattern of coauthor collaborations on the topic of schizophrenia: a systematic review between 1937 and 2017. Schizophr Res 2019;204:206–13. [DOI] [PubMed] [Google Scholar]
- [59].Petersen AM, Wang F, Stanley HE. Methods for measuring the citations and productivity of scientists across time and discipline. Phys Rev E Stat Nonlin Soft Matter Phys 2010;81(3 Pt 2):036114. [DOI] [PubMed] [Google Scholar]
Associated Data
This section collects any data citations, data availability statements, or supplementary materials included in this article.


