

Abstract
The magnitude and regional heterogeneity of airway obstructions in severe asthmatics is likely linked to insufficient drug delivery, as evidenced by the inability to mitigate exacerbations with inhaled aerosol medications. To understand the correlation between morphometric features, airflow distribution, and inhaled dosimetry, we perform dynamic computational simulations in two healthy and four asthmatic subjects. Models incorporate computed tomography-based and patient-specific central airway geometries and hyperpolarized 3He MRI-measured segmental ventilation defect percentages (SVDPs), implemented as resistance boundary conditions. Particles [diameters (dp) = 1, 3, and 5 μm] are simulated throughout inhalation, and we record their initial conditions, both spatially and temporally, with their fate in the lung. Predictions highlight that total central airway deposition is the same between the healthy subjects (26.6%, dp = 3 μm) but variable among the asthmatic subjects (ranging from 5.9% to 59.3%, dp = 3 μm). We found that by preferentially releasing the particles during times of fast or slow inhalation rates we enhance either central airway deposition percentages or peripheral particle delivery, respectively. These predictions highlight the potential to identify with simulations patients who may not receive adequate therapeutic dosages with inhaled aerosol medication and therefore identify patients who may benefit from alternative treatment strategies. Furthermore, by improving regional dose levels, we may be able to preferentially deliver drugs to the airways in need, reducing associated adverse side effects.
NEW & NOTEWORTHY Although it is evident that exacerbation mitigation is unsuccessful in some asthmatics, it remains unclear whether or not these patients receive adequate dosages of inhaled therapeutics. By coupling MRI and computed tomography data with patient-specific computational models, our predictions highlight the large intersubject variability, specifically in severe asthma.
Keywords: computational fluid dynamics, conducting airways, dosimetry, hyperpolarized 3He MRI, inhaled medications
INTRODUCTION
The central goals of asthma treatment are to maintain asthma control by reducing the number of asthma attacks (“exacerbations”) and to slow disease progression. Asthma exacerbations are characterized by acute airway constriction resulting in obstructed gas flow and are triggered by chronically inflamed airways and hyperresponsive airway smooth muscle (1). Standard care for mild to moderate asthmatic patients includes medications for 1) quick relief during an exacerbation and 2) long-term maintenance, both of which are typically delivered to the lung with an inhaler. A major limitation with current aerosol medications is that only 10–20% of the drug is delivered to the lungs (53); the rest either is lost to the extrathoracic airways or is exhaled. Combination maintenance therapy (e.g., inhaled corticosteroid in conjunction with long-acting β2 agonist) is a viable option for chronic persistent asthma patients (9). However, although this treatment is successful in controlling asthma flare-ups and disease progression for the majority of asthmatics, ~15% of subjects have symptoms that remain uncontrolled, necessitating systemic delivery via oral corticosteroid therapy (11). We speculate that the inability to deliver therapeutics to obstructed airways is a major contributing factor to the poor response to therapy experienced by some asthmatics. To overcome these challenges and to target specific airways in need of therapy, it is important to identify the variables that most influence total and regional deposition concentrations within healthy and asthmatic lungs.
Measurements of total and regional deposition have been performed in asthmatic subjects with gamma scintigraphy (12, 38), single-photon emission computed tomography (SPECT) (10, 26, 38), and positron emission tomography combined with computed tomography imaging (PET-CT) (18, 20, 21, 54, 54a). Gamma scintigraphy provides two-dimensional (2D) dynamic measures of total and regional deposition (e.g., central vs. peripheral airways). Applying this technology in 12 mild asthmatic patients, Newman et al. (38) found that total lung deposition of ciclesonide [mass median aerodynamic diameter (MMAD) = 1–2 μm] is highly variable between subjects, ranging from 40% to 70%. In addition, Newman et al. used SPECT to measure three-dimensional (3D) regional deposition in six shells of the lungs, spanning from the central to the peripheral lung, and found higher deposition fractions for peripheral shells, which contain both alveoli and small airways. In a dynamic PET-CT study on 14 bronchoconstricted asthmatics, Greenblatt et al. (18) found that over a third of variability in regional deposition for particles with diameters of 4.9 ± 1.8 μm [volume median diameter ± geometric standard deviation (GSD)] is linked to variability in specific ventilation and is dependent on respiration frequency. As speculated by Greenblatt et al., these data suggest that inhaled medications may not be delivered to poorly ventilated regions. Understanding the relationship between ventilation and deposition is imperative to develop new methods to treat asthmatics.
Although in vivo dosimetry imaging data provide key insights into total and regional deposition in healthy and asthmatic subjects, these methods are limited because of their cost and the need to expose subjects to ionizing radiation. Some of these experimental limitations may be augmented with respiratory computational fluid dynamics and particle transport (CFD-PT) simulations. Indeed, CFD-PT models may provide detailed information on ventilation maps (7) or regional dose concentrations and hot spots. Moreover, these models may be employed to investigate the influence of various parameters (e.g., particle size, inhalation flow rates) on gas and particle transport (30, 34), potentially reducing the number of experiments that need to be performed. In addition, CFD-PT can be used to predict gas distribution (42) and particle deposition, including aerosol targeting (8, 46). Some groups have shown good agreements between their CFD model predictions and data derived from in vivo studies (10, 30, 45, 55). Although CFD-PT simulations often require simplification of complex processes, CFD-PT is a powerful tool to investigate structural-functional abnormalities by combining imaging and modeling techniques, as demonstrated previously (3, 6, 7, 9, 25, 32). For example, De Backer et al. (10) compared computational model results with SPECT-CT data for six mild asthmatic subjects and found good agreement in terms of airflow distribution between the two (average of 3% difference).
Relatively few groups have focused on simulating transport in asthmatic lungs with CFD-PT simulations. Asthma has been modeled previously by virtually constricting idealized human airways (32, 57), showing that particle deposition increases in the proximity of the diseased airway. Furthermore, Longest et al. (32) showed that total deposition increased by a factor of 10 within an idealized asthmatic bifurcation model of a 4-yr-old child compared with the equivalent healthy model. In a patient-specific study, De Backer et al. (9) combined CT images at functional residual capacity (FRC) and total lung capacity (TLC) with CFD-PT models to predict regional doses for two different medications (fluticasone test 3.5 ± 1.6 µm, salmeterol test 3.6 ± 1.5 µm, fluticasone reference 3.4 ± 1.6 µm, salmeterol reference 3.5 ± 1.6 µm, MMAD ± GSD) in 16 asthmatic patients. From this analysis, De Backer et al. found that there were minimal differences between the effect of two medications in central airway volumes and resistances, likely because the particle sizes were similar. More recently, Choi et al. (6) found, for two healthy and asthmatic lungs, that both airway hydraulic diameter and airway circularity are inversely correlated with particle deposition. Although this work provides a first step toward realistic asthma modeling, the study was limited by modeling at steady state only and not incorporating functional imaging (e.g., MRI) into the models.
Here we perform CFD-PT simulations in healthy and asthmatic subjects to identify leading-order factors that influence aerosol deposition in disease. We previously developed a gas flow simulation framework featuring the ability to combine hyperpolarized (HP) 3He MRI, image-based conducting airway models, and numerical simulations to predict lung mechanics in healthy and asthmatic subjects (44). Here we extend this framework to study variability in particle deposition between healthy and asthmatic adults and to correlate findings with airflow characteristics and central airway morphometric features. To gain a better understanding of how particles may be targeted to various lung regions (e.g., central, peripheral, or specific lobes), we study the influence of particle injection conditions on deposition. The potential to improve therapeutic delivery is then demonstrated by altering these variables to direct particles into the central or peripheral regions or to deliver them into the lobe of interest. This work brings us closer to our ultimate goal of deeply understanding the variables that may improve aerosol delivery efficiency in asthma.
MATERIALS AND METHODS
To correlate total and regional particle deposition with asthma severity, we perform unsteady (dynamic) CFD-PT simulations in six human airways (2 healthy and 4 asthmatic) with the same patient-specific geometric models and HP 3He MRI-based boundary conditions that we previously created (44). The data employed were based on retrospective data from subjects selected from the University of Wisconsin-Madison Severe Asthma Research Program 3 cohort. The study was conducted in accordance with Health Insurance Portability and Accountability Act regulations and approved by the University of Wisconsin-Madison institutional review board. Subject demographics, including spirometry data, are provided in Table 1.
Table 1.
Subject demographics, spirometry results, segmental ventilation defect percentages, and asthma severity level classification
| Subject | Sex | Age, yr | BMI, kg/m2 | FRC, mL | FEV1,% predicted | FVC, % predicted | FEV1/FVC, % predicted | SVDP, % | Asthma Severity |
|---|---|---|---|---|---|---|---|---|---|
| HS1 | Female | 23 | 27.0 | 1,216 | 80.2 | 82.4 | 96.8 | 0.02 ± 0.10 | Healthy |
| HS2 | Female | 29 | 21.7 | 2,994 | 116.4 | 110.7 | 104.2 | 1.13 ± 1.55 | Healthy |
| AS1 | Female | 21 | 18.8 | 2,070 | 100.5 | 100.9 | 99.1 | 0.03 ± 0.09 | Mild |
| AS2 | Female | 53 | 27.5 | 2,441 | 88.3 | 92.9 | 95.2 | 0.43 ± 0.59 | Moderate |
| AS3 | Male | 31 | 28.2 | 2,046 | 55.6 | 84.7 | 65.4 | 4.30 ± 5.22 | Severe |
| AS4 | Female | 72 | 33.5 | 2,475 | 109.5 | 113.4 | 96.8 | 3.54 ± 5.98 | Severe |
Values are subject demographics, spirometry results (collected after bronchodilator), segmental ventilation defect percentages (SVDPs), and asthma severity level classification (2) for healthy subjects HS1 and HS2 and asthmatic subjects AS1–AS4. SVDP values are reported as means ± SD across all segments of each subject. % Predicted values are calculated based on age-, sex, and height-corrected standards (48). BMI, body mass index; FEV1, forced expiratory volume in 1 s; FRC, functional residual capacity; FVC, forced vital capacity.
Airflow and particle trajectories are computed by implementing our in silico pipeline (43, 45) with the subject-specific images of airway geometry and ventilation from CT and MRI, respectively (Fig. 1). Using this pipeline, we predict regional dosimetry within the conducting airways and correlate the deposition fractions to particles’ initial locations in both space and time. For our first attempt at targeting therapeutics to specific lung regions, we alter both the spatial and temporal particle release parameters to either enhance or reduce deposited particle concentrations.
Fig. 1.

Simulation pipeline: combination of experimental MRI and computed tomography image data with computational fluid dynamics (CFD) and particle transport simulations to predict airflow distribution and total and regional particle deposition in healthy (HS1 and HS2) and asthmatic (AS1–AS4) conducting airways. Segmental ventilation defect percentages (SVDPs) are calculated from the hyperpolarized (HP) 3He MR images and are used to parameterize the resistance boundary conditions (step 2). 3D, 3-dimensional. VMS, measured lung volume distal to segmental airway; VPS, predicted lung volume distal to segmental airway; VMVD, measured ventilation defected lung volume distal to segmental airway; VPVD, predicted ventilation defected lung volume distal to segmental airway; RNSS, prescribed resistance at each normal subsegmental feeding airway; RDSS, prescribed resistance at each diseased subsegmental feeding airway.
Subject-Specific Airway Geometries
3D subject-specific geometries are created with a 2D segmentation method (52) from FRC CT data with the open-source software SimVascular. Models are created at FRC (Table 1) to closely match the lung volume at which the HP 3He MR images were acquired (FRC + 14% TLC); lung volume must be similar between imaging data and computational modeling (23). To match the resolution of the data measured from the HP 3He MR images, each model is created to span from the trachea to one generation beyond the segmental airways (56), defined as the subsegmental airways. Each geometric model (except subject AS4) has ~38 terminal airways and up to 12 airway generations. It was impossible to resolve all of the subsegmental airways for subject AS4, likely because remodeled or mucus-plugged airways will “disappear” from the CT images (36), and therefore these missing airways are modeled as two parallel resistors (44).
Dynamic Airflow Simulations
We used an open-source finite element solver (52) to solve the unsteady 3D Navier–Stokes equations assuming incompressible and Newtonian fluid to calculate the air ( and ) velocities and pressures throughout inhalation. The flow solver features a stabilized Galerkin finite-element method with a custom linear solver that incorporates a combination of GMRES (a generalized minimal residual algorithm for solving nonsymmetric linear systems) and conjugate gradient methods (14) with a second-order generalized α-method for the time integration (52). Tetrahedral mesh elements were created with MeshSim (Simmetrix, Clifton Park, NY), featuring boundary layer refinements necessary for resolving near-wall flow gradients. Volumetric meshes for each subject have ~5–6 million cells with a maximum edge size of 400 μm. We use eight layers of boundary layer starting from 30 μm to resolve the viscous sublayer (based on our simulation parameters, the wall unit is 40 μm for y+ = 1).
We assume that the airways are rigid, and we set a no-slip boundary condition (BC) at the airway walls. A parabolic velocity profile BC is set on the trachea inlet, with the magnitude based on the chosen time-dependent flow rate. Here, we aim to model use of a pressurized metered dose inhaler (pMDI) and therefore employ the generic but realistic inhalation waveform first presented by Longest et al. (31) and Khajeh-Hosseini-Dalasm and Longest (24), given as
| (1) |
| (2) |
where Qmax is the peak inhalation flow rate (set to 61.4 L/min), is the time where Qmax occurs (set to 1.22 s), and T is the inspiration time (set to 4.86 s). Note that the flow linearly increases until and then sinusoidally returns back to zero (31).
As described in detail in Oakes et al. (44), we prescribe resistance BCs to each of the outlets. Here, the resistance BC models the relationship between peripheral pressure and flow rate, , where i dictates the airway number, spanning from 1 to ~38 outlets. An iterative approach is taken to determine Ri values for each subject and airway, by incorporating segmental volumes measured from the CT data sets and ventilation defects measured by hyperpolarized 3He MRI. The Ri values remained unchanged from our previous simulations (44); hence we make the underlying assumption that the peripheral resistance is independent of the inhaled gas and remains constant throughout inhalation.
Airflow Parameter Calculations
In our previous work (44), we reported pressure gradients, velocity fields, and global flow division and resistances for simulations performed at steady state, Q = 333.3 mL/s. As the results presented here are for unsteady respiration and we are ultimately interested in particle deposition, we examined more refined flow characteristics that may be linked to transport, specifically velocity streamlines, wall shear stress (WSS), and helicity. Resistances within the simulated airways are calculated by dividing the average pressure gradients (from the trachea to the outlets) by the inlet flow rate, averaged over the simulation time, . WSS is a measure of the velocity gradients near the wall and has been shown to correlate with deposition (42, 47). We calculate WSS as , where μ is the air viscosity, u is the air velocity, and n is the normal vector at the airway wall. Time-averaged wall shear stress (TAWSS) is the average of WSS over the total inhalation time, and is the average of TAWSS over the entire geometry.
The flow field will develop spirallike, or helical, flow structures because of asymmetric geometric features, including curved and irregularly shaped airways. Helicity quantifies the intensity of the helical flow structures and is maximized when vorticity (ω) and velocity are in the same direction. Here, we calculate helicity by the volumetric integral: , where V is the air volume. To compute the time-averaged helicity (TAH), we normalize the averaged H(t) by V.
Particle Transport Simulations
After the airflow simulations, we track particles with aerodynamic diameters (dp) of 1, 3, and 5 μm and unit density (ρp = 1 g/ml) dynamically throughout inspiration. The particles are released at the trachea inlet (~6 million particles) with a uniform spatial distribution. The particles’ release time is proportional to the local flow rate of the mesh cell that they originate from (45, 47). Individual particle trajectories are calculated by solving a force balance equation, taking into account gravity and inertia and assuming rigid, spherical particles. We ignore Brownian diffusion, since the dp of the particles are ≥1 μm.
We assume one-way coupling, meaning that particles cannot affect the airflow distribution because the volume fractions of the particles are much smaller than the carrier fluid; the particle volume fractions of pMDI aerosols are typically on the order of 1E-6 (39), satisfying conditions for a dilute system (13). By the same reasoning, we ignore any interaction between particles. Particles may either deposit on the airway walls or exit out one of the distal airways and thereby be delivered to the lung periphery. Once the distance between the center of the particle and the airway wall becomes less than or equal to its radius, the particle is considered to be deposited and it cannot reenter the flow field.
Deposition Parameter Calculations
To assess the relative importance of inertial forces acting on a particle, we compute the Stokes number for dp = 3 μm at the trachea, , where w is the average air speed at the trachea and Dc is the trachea diameter. We quantify deposition with global measures (percentage of deposited particles) and local indexes (element-based number concentrations, NP). Deposition percentages are calculated with respect to the number of inhaled particles, and regional concentrations are found by dividing the percentage of deposited particles by the total airway surface area of the corresponding region. To visualize deposition hot spots, we calculate the area-normalized number of deposited particles (, where Ne is the number of deposited particles within a surface element, ΣT is the total surface area of the 3D model, NT is the total number of deposited particles, and Σe is the element’s surface area). Here, NP provides a quantitative measure of local deposition, with larger values indicating more deposited particles relative to the airway’s surface area.
Correlation of Particles’ Initial Conditions with Deposition
The time and location at which particles enter the airways are important variables that may influence the fate of particles in the lung. We speculate that both the total and regional deposition patterns are dependent on these two parameters. Therefore, to identify times of enhanced deposition efficiency, particle deposition over inspiration is recorded and correlated with the aerosol bolus injection time. In addition, we associate the initial location of particles (at the start of inhalation and on the trachea face) to the airway wall that they ultimately deposit on.
The final aim of this work is to test the possibility of targeting particles regionally (e.g., conducting vs. peripheral and segmental levels). To do this, we manipulate the particles’ initial conditions to either enhance or reduce deposition within specific regions of the model. We choose to perform this analysis with only the 3-μm-diameter particles, reflecting the mean size of medication particles in pMDIs (9). On the basis of the conducting airway dosimetry results, we choose half of the models to enhance airway deposition and reduce the other half. Additionally, for one subject (AS3), we alter the location where the particles are seeded from the trachea inlet to improve delivery to the airways and distal regions of the lung that have the largest segmental ventilation defects.
RESULTS
Airflow Characteristics
The streamline patterns and velocity magnitudes vary between the subjects, especially among the asthmatic subjects, as highlighted in Fig. 2, where the streamlines are color coded based on their velocity magnitude, plotted at the time of mean flow rate during the deceleration phase of respiration (t = 3.6 s; see Fig. 5). We chose to plot the streamlines at the time of mean flow rate during deceleration rather than the acceleration phase in order to include the effects of peak flow (e.g., vortices). Similar to our previous simulations (44), we find that subject AS4 exhibits high velocity magnitudes within the distal airways, whereas the peak velocity in subject AS1 is located at the main left and right bronchi regions. Although subjects AS4 and AS3 are both severe asthmatics (Table 1), the velocity magnitudes are much smaller in subject AS3 compared with subject AS4, likely because AS4’s conducting airways are smaller than those of AS3 (44). Note that since subject AS4’s FRC lung volume is within the range of the other subjects (Table 1), we postulate that the smaller conducting airway diameters are likely a result of asthma-related airway remodeling and/or mucus plugging.
Fig. 2.

Streamlines are shown for each subject (asthmatic subjects AS1–AS4, A–D; healthy subjects HS1 and HS2, E and F) at the time of mean flow rate during flow deceleration (t = 3.6 s, Fig. 5), color coded based on the velocity (V) magnitude (mm/s). Time-averaged wall shear stress (, where u is the air velocity, n is the normal vector at the airway wall, and T is the total time of inhalation) for each subject, computed throughout inspiration, is also shown in each panel.
Fig. 5.

Cumulative % deposition (A) and % of particles depositing at each time point (B) plotted as a function of particle release time for subjects AS3, AS4, and HS1, The simulated flow rates (Eqs. 1 and 2) are shown in light gray in B.
Although the R3D values are similar in the healthy subjects (7.4E-3 ± 0.7E-3 cmH2O·mL−1·s), they range markedly among the asthmatic subjects (from 1.2E-3 to 31.9E-3 cmH2O·mL−1·s; Table 2). Total lung resistance (RL), calculated by adding R3D and the distal resistances together (44), is 12.1E-3, 21.5E-3, 8.5E-3, 35.9E-3, 10.6E-3, and 15.6E-3 cmH2O·mL−1·s for AS1–AS4 and HS1 and HS2, respectively. Lung resistance varies significantly among asthmatic subjects, as has been shown previously with the force oscillatory technique (33, 35). For example, Lutchen et al. measured RL in 12 asthmatic subjects and found that RL ranged between 2E-3 and 27E-3 cmH2O·mL−1·s during normal breathing frequencies (35), similar to the range we calculated here. As R3D is highly sensitive to changes in airway lumen size, it is reasonable that we observe a significant difference among the asthma subjects based on ventilation heterogeneity and associated airway geometry. Indeed, the airways of subject AS3 on average are 35% larger than those of subject AS4 (44). Differences in airway size explain the relatively low resistance of AS3 and high resistance of AS4. Note that although the R3D values averaged over inspiration (Table 3) are larger than those found for steady-state conditions (44), the relationship between the subjects is preserved.
Table 2.
Flow characteristics for the six subjects
| Subject | ReTrachea Mean | ReTrachea Peak | , m/s | , g/mm·s2 | TAH, m/s2 | R3D, cmH2O·mL−1·s |
|---|---|---|---|---|---|---|
| HS1 | 2,928 | 5,650 | 7.4 | 26.6 | 68.7 | 6.9E—3 |
| HS2 | 2,848 | 5,497 | 7.1 | 26.6 | 73.5 | 7.9E—3 |
| AS1 | 2,723 | 5,256 | 8.2 | 33.4 | 79.1 | 4.8E—3 |
| AS2 | 2,737 | 5,282 | 5.4 | 40.3 | 81.7 | 13.8E—3 |
| AS3 | 2,440 | 4,710 | 4.3 | 5.9 | 21.6 | 1.2E—3 |
| AS4 | 2,578 | 4,950 | 5.4 | 56.3 | 90.6 | 31.9E—3 |
Values are flow characteristics for the 6 subjects (healthy subjects HS1 and HS2 and asthmatic subjects AS1–AS4): mean and peak Reynolds number at the trachea inlet (ReTrachea), mean velocity during the peak of inhalation at the trachea inlet (), time-averaged wall shear stress, averaged over the 3-dimensional (3D) surfaces (), time-averaged helicity per unit volume (TAH), and resistance within the 3D airways (R3D = ΔP/QTrachea, where ΔP is pressure gradient and Q is flow rate).
Table 3.
Dosimetry for the six subjects
| Deposition, % |
Concentration, %/cm2
|
|||||||
|---|---|---|---|---|---|---|---|---|
| Subject | Stk 3 μm | Surface Area, cm2 | 1 μm | 3 μm | 5 μm | 1 μm | 3 μm | 5 μm |
| HS1 | 4.8E-3 | 107 | 4.4 | 26.6 | 68.7 | 0.04 | 0.25 | 0.64 |
| HS2 | 5.7E-3 | 125 | 4.4 | 26.6 | 73.5 | 0.04 | 0.21 | 0.59 |
| AS1 | 1.0E-2 | 121 | 5.6 | 33.4 | 79.1 | 0.05 | 0.28 | 0.65 |
| AS2 | 1.2E-3 | 116 | 7.8 | 40.3 | 81.7 | 0.07 | 0.35 | 0.71 |
| AS3 | 2.8E-3 | 183 | 2.6 | 5.9 | 21.6 | 0.01 | 0.03 | 0.12 |
| AS4 | 3.6E-3 | 105 | 8.7 | 56.3 | 90.6 | 0.08 | 0.54 | 0.86 |
Dosimetry for the 6 subjects (healthy subjects HS1 and HS2 and asthmatic subjects AS1–AS4): Stokes number for particle diameter = 3 μm (Stk), surface area of the 3-dimensional geometric models, and the total deposition and concentration (% deposition/surface area) for the 3 particle sizes simulated.
As evidenced by the velocity streamlines (Fig. 2), inhaled gas mixes as it travels deeper into the lung. With the exception of subject AS4, regions of high TAWSS are located at the carina, where the flow rapidly changes direction (Fig. 2). and TAH are highest in subject AS1 (Table 3), where the largest TAWSS values are seen at the left and right main bronchi, likely because of the small airway calibers in this subject (Fig. 2). Since subject AS3 has larger conductive airways compared with the others, it has the lowest and TAH (Table 3). For subjects AS2 and AS4 high-TAWSS regions are located at the terminal airways.
Particle Deposition
Impact of particle size on deposition.
As expected, the percentage and concentrations of deposited particles within the central airways increase with particle size for all subjects (Table 3), likely due to a combined effect of inertial and gravitational forces. Note that the Stk are relatively small (Table 3). As shown in Fig. 3, particles deposit at the bifurcation regions, where the air rapidly changes its course, and in the direction of gravity, highlighting the combined interplay of inertia and gravity, despite the small Stk. To test the relative impact of gravity on regional dosimetry, we altered the orientation of the model and found that, although total deposition did not change, regional deposition shifted to the new gravitational force-dependent side of the airway (data not shown).
Fig. 3.

Normalized number of deposited particles (3-μm diameter) for the 6 subjects (asthmatic subjects AS1–AS4, A–D; healthy subjects HS1 and HS2, E and F) for front (left) and back (right) sides. Total particle deposition is shown beside each model. Colors indicate the normalized particle deposition concentrations (%deposited/%area), defined as , where Ne is the number of deposited particles within a surface element, ∑T is the total surface area of the 3-dimensional model, NT is the total number of deposited particles, and ∑e is the element’s surface area. Note that we use a coarser surface mesh to visualize deposited particle concentrations than was employed for the finite-element simulations.
Total and regional dosimetry variability between subjects.
As shown in Table 3, total deposition within the central airways is similar between the healthy and mild/moderate asthmatic subjects; for dp = 1 μm: 5.6 ± 1.6%, for dp = 3 μm: 31.7 ±6.6%, and for dp = 5 μm: 75.8 ± 5.8%, mean ± SD percentages of deposition between the simulations. In contrast, deposition is lower in subject AS3 and higher in subject AS4, compared with both healthy and mild/moderate asthma subjects (AS3 3.0, 25.8, and 54.2 percentage points lower than the mean and AS4 3.1, 24.6, and 14.8 percentage points higher than the mean for dp = 1, 3, and 5 μm, respectively). Note that similar trends are found for the airway concentrations (Table 3), with the differences between subjects AS3 and AS4 intensified because of their respective differences in reconstructed airway surface areas.
Deposition hot spots for particles with dp = 3 μm are shown for both the front and back sides of the airways in Fig. 3. Regional deposition is further quantified in Fig. 4 by plotting the percentage of deposited particles on all the airways within each lobar region, with respect to the total deposition. We note that localized deposition is linked to geometric and airflow features (e.g., airway diameter and bifurcation angles) and therefore we observe regional differences in deposition between all subjects. Indeed, similar to our previous observations (47), we found that although total deposition is similar for healthy subjects, regional deposition is different (Fig. 4, E and F). For example, 27.6% (concentration of 0.45%/cm2) of particles deposited within the left superior lobe (lobe definitions are shown in Fig. 6) of subject HS1, whereas only 10.4% (concentration of 0.19%/cm2) deposited within the same lobe of subject HS2. This difference is probably caused by the larger bifurcation angle of subject HS1’s left superior lobe compared with subject HS2 (65° compared with 40°). Note that this large bifurcation angle results in more deposition due to inertial forces caused by sudden change in flow direction. In addition, higher TAWSS are seen at the left main bronchus that leads to the left superior lobe of HS1 compared with HS2 (Fig. 2), which likely enhances deposition in this region.
Fig. 4.

Percentage of total deposited particles (3-μm diameter) within each region of the airways for healthy (HS1 and HS2, E and F) and asthmatic (AS1–AS4, A–D) subjects. The lobe definitions are shown in Fig. 6.
Fig. 6.

Initial location (on the trachea face) of the 3-μm-diameter particles that deposited on the conducting airways of each lobar region (A–E: subject AS3; F–J: subject AS4). The colors display % (with respect to total lobar deposition) of deposited particles originating from the mesh element on the trachea inlet. Each panel represents conducting airway deposition within the specific lobe.
Although regional deposition within the right lung for the mild/moderate asthmatic subjects (AS1 and AS2) is similar (Fig. 4, A and B), NP is different (Fig. 3, A and B). This indicates that even when the total regional deposition is the same the distribution of deposited particles may vary. For subject AS1, high-concentration regions (high NP) are located around the main bifurcation. In contrast, for subject AS2 high-NP regions are located mainly within the distal airways. This is likely because subject AS1 has relatively smaller right and left main bronchi, resulting in high velocity magnitudes within the main bifurcation (Fig. 2A), causing the particles to deposit there because of inertial impaction within the main bronchi (Fig. 4A). In contrast, particles can travel to the more distal airways of subject AS2, because of the relatively larger main bronchi.
As for total deposition, regional deposition varies between the severe asthmatic subjects (AS3 and AS4; Fig. 4, C and D). For example, the majority of particles deposited in the left superior lobe of subject AS3, whereas most of the particles deposited in the right inferior lobe of subject AS4. Relatively (with respect to total deposition) fewer particles deposited within the main bronchi of subject AS4 compared with subject AS3 (Fig. 4), primarily because the majority of particles deposited within the smaller airways of AS4, because of the relatively higher flow speeds (Fig. 2) and shorter distances for particles to settle. Nonetheless, concentration levels of deposited particles are higher at the main carina in AS4 compared with AS3, likely linked to the helical flow structures and high TAWSS (Fig. 2D).
Impact of SVDP on particle fate.
Increasing the peripheral resistance of a segmental feeding airway limits the flow going to that segment and therefore will likely impact both peripheral delivery and deposition near regions of defected airways. To formally test this, we looked at deposition and delivery for our steady-state simulations (44) and found that applying the defect reduces the particle delivery to the defected region. For example, peripheral delivery is reduced by 19.5%, 9.7%, and 10.1% for the segments with 20%, 11%, and 11% SVDP, respectively (subject AS3). Similar results are found for subject AS4: delivery reduced by 14.1%, 10.7%, and 4.6% for the segments with 20%, 16.5%, and 9.9% SVDP, respectively. We also find that deposition on the regimental airway feeding a defected region reduces, although not as substantially.
Relationship between particle release time and deposition.
To improve our understanding of the influence of inhalation time on particle fate within the lung, we plot the cumulative deposition percentages (Fig. 5A) and relative deposition of particles with respect to the time of release (Fig. 5B) for dp = 3 μm. Here we choose to show this relationship for subjects AS3, AS4, and HS1, but similar observations are found for the other three subjects. Although total depositions for these three subjects are different (Table 3), they have similar transient deposition behaviors (Fig. 5), suggesting that this is not a subject-specific phenomenon and observed trends will likely hold true across multiple subjects. For all three subjects, the majority of deposition occurs for particles released near the peak of inhalation (1.2 s to 2.4 s). Again, this is likely because the higher flow velocities lead to more particle inertia, causing the particles to deposit in regions where the flow rapidly changes directions (e.g., in the bifurcation regions or when the airway curves).
Relationship between particle starting location and deposition.
To investigate the influence of the particles’ initial location on their regional deposition pattern, we correlate lobar deposition with the initial coordinates of the particle on the trachea inlet for the two severe asthmatic subjects (AS3 and AS4) in Fig. 6. Here, the colors represent the percentage of particles depositing in each lobar region, with respect to their initial starting location at the trachea inlet. There are noticeable correlations between particles’ starting location and their fate within the lung. For example, particles released at the middle right region of the trachea will likely deposit within the left inferior lobe (Fig. 6, A and F). Although most lobes have distinct starting locations, there is overlap between the particle’s initial location and deposition between the right middle and right interior lobes, especially for subject AS4 (Fig. 6, I and J). This is likely because the air mixes in the right inferior and right middle lobes of subject AS4, as shown in Fig. 2. Also, by looking at subject AS3’s streamlines in Fig. 2C we find high-inertia streamlines that go directly into the right inferior lobe (e.g., less mixing). The more distinct starting locations of the right inferior and right middle lobes (Fig. 6, D and E) are linked to these flow patterns.
Improvement of Particle Deposition Dosages
Based on our observations linking the particles’ initial conditions with total and regional deposition fractions, we decided to virtually test the possibility of targeting particles to specific locations in the lung. Indeed, the particles’ initial location may be used to improve regional deposition to the lobe of interest, whereas the release time of particles may be employed to either enhance or reduce total deposition within the conducting airways. By decreasing central airway deposition, we may give the particles a chance to bypass the conducting airways and therefore be delivered into the lung periphery.
Modified release time.
As shown in Table 3, deposition is lower in subjects HS1, HS2, and AS3 in comparison to the other subjects. To enhance conducting airway deposition for these subjects, we only release particles during times of peak flow speeds (between 1.2 s and 2.5 s). For subjects AS1, AS2, and AS4 we do the opposite, only releasing particles during the slower flow rate times (3.2 s and 4.5 s). Figure 7 shows the influence of altering the particle release time, where Fig. 7, left and right, highlight enhanced and reduced deposition, respectively. Based on the percent change, it appears that decreasing total deposition is easier than increasing deposition. There may be an upper limit in total deposition based on the flow rate and geometry since they are dominant variables (which we are not changing here). Importantly, by releasing the particles when the flow speeds are low, we can prevent them from depositing in the conducting airways, allowing them to penetrate deeper into the lung.
Fig. 7.
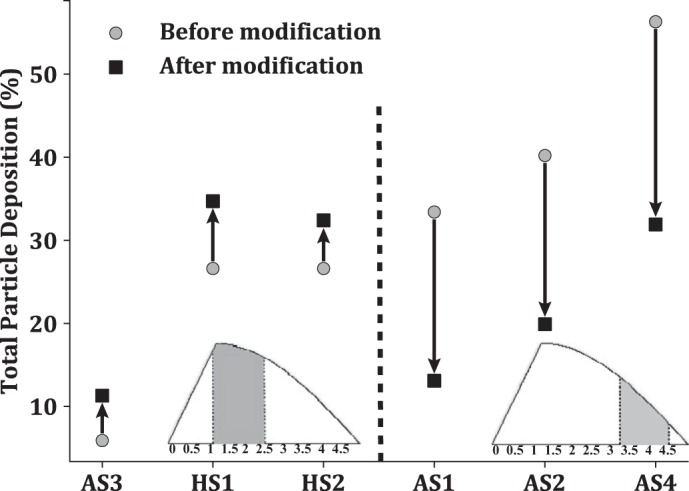
Changes in total deposition of 3-μm particles by modification of the particle release time (asthmatic subjects AS1–AS4, healthy subjects HS1 and HS2). Left: increase in particle deposition by releasing the particles only between 1.2 s and 2.5 s (gray area). Right: decrease in particle deposition once the particles are released only between 3.2 s and 4.5 s (gray area).
Modified initial location.
As shown in Table 1, AS3 presents with the highest ventilation defect burden. We choose to target particles to AS3’s middle right lobe, as this is where the ventilation defects are the largest; SVDP is 12.6%. As highlighted in Fig. 6, there is a clear link between the particles’ initial location and the lobe they deposit in. Leveraging this knowledge, we change the initial location of the 3-μm-diameter particles to deliver them more precisely to the right middle lobe. Figure 8 shows deposition within the airways leading to each lobe (Fig. 8A) and the particles delivered to the lung periphery (Fig. 8B), before and after the modifications. Regional particle delivery is thus the portion of particles that did not deposit in the conducting airway and instead are delivered to the lobar peripheral regions. By preferentially releasing the particles, the model predicts success in increasing regional deposition within the right middle lobe from 6% to 11% (Fig. 8A). Consequently, because of the overlap between the right inferior and right middle lobes (Fig. 6, D and E), there is also an increase in deposition within the right inferior lobe. Note that this redistribution of particle deposition was achieved at the expense of a decrease in particle deposition within the rest of the lung, with very few deposited particles within the left inferior lobe.
Fig. 8.
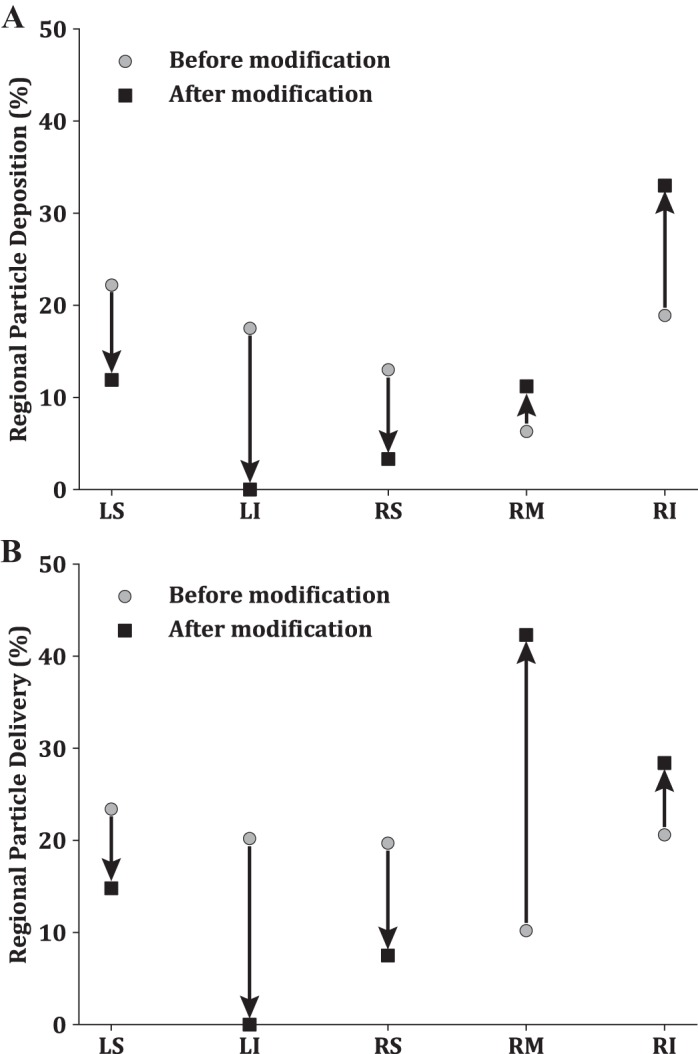
Regional deposition (A) and regional delivery (B) percentages for 3-μm-diameter particles of subject AS3 before and after modification of the initial location. LS, left superior lobe; LI, left inferior lobe; RS, right superior lobe; RM right middle lobe; RI, right inferior lobe.
DISCUSSION
Delivery of inhaled therapeutics in severe asthmatics is challenging, often resulting in uncontrolled symptoms and disease progression. As pathological airways are obstructed because of effects such as mucus plugging or airway remodeling, it can be nearly impossible to deliver aerosols to diseased airways. Therefore, in some cases it may be more effective to use alternative methods (e.g., oral medications or bronchial thermoplasty) to treat uncontrolled asthma. To begin to understand aerosol delivery effectiveness in asthmatics from a dosimetry perspective, we performed computational simulations during dynamic inhalation to assess the ability to deliver inhaled drugs and to explore the influence of particle release conditions on regional drug delivery. Our patient-specific simulations of aerosol dosimetry in healthy and asthmatic lungs suggest that 1) total and regional deposited particle concentrations vary across asthmatic subjects, particularly for severe asthmatics, 2) particle fate within the lung is dependent on when they are inhaled and where they are positioned on the trachea inlet, and 3) targeted delivery may be achieved by altering particle seeding parameters including time and location of release.
Advancements in imaging techniques, specifically MRI (15, 16), have enabled creation of detailed maps of ventilation defects (37), which may be leveraged to parameterize computer models (4, 33, 44). With in silico models, it is possible to virtually test various scenarios to better understand asthma pathology and to identify leading-order factors that impact deposited particle concentrations for patient-specific conditions. Asthma is a chronic airway disorder that results in heterogeneously distributed airway closure (from airway remodeling and/or mucus plugging) (51), and disease severity and pathological features are highly variable among asthmatic subjects (19). Despite this inter- and intrasubject variability, it is not typical to tailor treatment strategies for individual patients. Indeed, inadequate aerosol delivery to specific regions of the lung may be a contributing factor to persistent lung function decline in a subset of patients.
By correlating disease stage, SVDP, airway morphometry, lung mechanics, and airflow parameters with dosimetry concentrations, we find that total deposition is similar between the healthy subjects, whereas there is wide variability among the asthmatic subjects (Table 3). Specifically, total deposition varied significantly between the two severe asthma subjects, AS3 (5.9%) and AS4 (56.3%), for dp = 3 μm (Table 3). This variability quantitatively agrees with reported imaging studies of asthmatics (17). Subject AS4 has smaller hydrodynamic diameter with more elliptical airways (44), resulting in larger R3D and TAH—positively correlating with deposition. These observations agree with the recent study by Choi et al. (6), who also found that deposition inversely correlates with airway diameter in asthmatic subjects. Although regional differences in deposition are observed, we further note that dosimetry characteristics cannot yet be related to specific disease phenotypes, because of our limited number of subjects.
Heterogeneity in ventilation defects among asthmatics leads to patient-specific regional deposition concentrations. We speculate that this variability opens the door for patient-specific drug targeting, which may enable delivery of therapeutics to the lobe most affected by asthma (e.g., regions with large defects). To this end, we linked particles’ initial location, and the time frame over which they are inhaled, with total and regional dosimetry. We find that the fate of the particles depends on these two parameters, where regional deposition is most influenced by the starting location of the particle. For example, in Fig. 6D we show that deposited particle concentrations within the right middle lobe are linked to particles starting at the bottom left of the trachea inlet (red/green regions). This correlation suggests that particles should be released from this region if the right middle lobe is specifically being targeted. Indeed, we show in Fig. 8 that this is theoretically possible, as releasing particles within this region results in an increase in particle delivery (from 10% to 45%). Indeed, targeting is only feasible if there is a clear link between the initial and final positions of the particles. Targeting based on the starting location in subject AS4 may not be feasible, as distinct dosimetry regions are not apparent (Fig. 6, F–J), likely because of enhanced air mixing (Fig. 2), similar to observations elsewhere (40, 41). Admittedly, leveraging the spatial link between particle starting locations with delivery for next-generation inhaler design will be challenging; however, slight changes may make it possible to enhance deposition in defected regions and therefore should be further investigated.
Alternatively, it may be more feasible to enhance deposition by changing the time particles are inhaled. We found that the percentage of deposited particles is positively correlated with inhalation flow rate (Fig. 5), with the highest fraction of particles depositing at the time of peak flow rate. Depending on the therapeutic target site, it may be important to either enhance central airway deposition or bypass the central airways altogether, in order to reach the lung periphery. For subjects where central deposition is high (e.g., AS4), delivering particles to the lung periphery may be achieved by altering the time over which particles are inhaled. Demonstrating this concept, we show in Fig. 7 that total deposition may be increased or decreased by simply changing the time particles are released. This indicates that there is a potential to target medications to either the central or peripheral lung regions. Similar observations were found in a healthy adult model by Ostrovski et al., albeit for steady-state inhalation conditions (46). In practice, this targeting may be achieved by altering when the inhaler is activated, either by the patient or with the use of a time-release device. This method would be significantly easier to implement compared with altering the initial location of particles at the trachea inlet or mouth. With targeting, it may be possible to improve treatment by reducing the quantity of drug inhaled, alleviating dose-related side effects and possibly avoiding step-up to oral corticosteroid therapy.
Although adding patient-specific imaging data to computational modeling increases the accuracy of these types of simulations, there are still some inherent limitations. Since we discussed flow modeling limitations in detail in our previous study (44), we focus here on the specific limitations that would affect dosimetry. As the velocity profile at the trachea inlet is unknown, we choose to prescribe a parabolic velocity profile at the trachea inlet. Therefore, we did not account for the effects of the extrathoracic airways and the laryngeal high-speed jets that may change the flow and deposition patterns within the first few airway generations. However, previous studies have shown that these high-speed jets will likely dissipate before the main bifurcation and the turbulent levels vanish quickly, with low kinetic energy observed downstream of the main bifurcation even for a peak flow rate of 60 L/min (27, 28). Although we did not employ a turbulence model in this study, we are resolving some of the important features of turbulence (e.g., viscous sublayer) due to our adaptive boundary layer mesh approach. As airway remodeling in asthmatics is typically contained to the distal airways, we do not expect that incorporating the extrathoracic airways would change the flow field dramatically. However, including a more realistic inlet flow boundary condition would change the particle seeding parameters and will likely impact their trajectories. Because of the limited resolution of the CT images, we are unable to resolve airways distal to the 3D geometry with confidence. To overcome this limitation, we model the distal airways and tissue with a resistor connected to each terminal airway, enabling flow modeling. However, more sophisticated transport models (45) will need to be included to predict inhaled aerosol penetration depths.
Aerosol medications are typically delivered at the mouth, unless the subject is connected to a mechanical ventilator, and therefore the observed correlation of particles’ initial location and release time with deposition will change with delivery method. Indeed, the particles will likely redistribute and mix as they travel from the mouth into the lungs (40, 41). Furthermore, the glottis motion will likely influence the flow field and particle trajectories into the conducting airways (50). In addition, we simulate particle sizes individually, instead of inhaler-specific size distributions, and assume that the particles are rigid spheres and that their size and shape do not change once they enter the lung. Aerosol droplets will change in size as they pass through the humid lung, and this size change will influence where the particles are deposited, as shown in Longest and Tian (29). As our CT and MRI images were collected after bronchodilator use, it is impossible for us to assess how delivery is impacted during the normal state or at the time of an exacerbation. As the subject was in the supine position during image acquisitions, we cannot investigate the influence of the change in the volume between supine and upright orientations, which may impact both the flow and deposition patterns (5, 22). Finally, we did not account for mucus transport or cilia motion, which may contribute to deposition or to particle movement once deposited.
Conclusions
The magnitude and regional heterogeneity of obstructed airways in asthma likely result in insufficient drug delivery, as evidenced by the inability to mitigate exacerbations with inhaled therapies in severe asthmatics. Here we predict where particles deposit, from both a global and local perspective, in a subset of healthy and asthmatic subjects. Interestingly, we find that dosimetry varies among the subjects, with the largest differences found in the two severe asthmatic subjects. We speculate that this simulation tool may be helpful in identifying which asthmatic patients may benefit from alternative treatment delivery methods, as it may not be possible to achieve adequate dosage concentration levels by using an inhaler to provide therapeutic response. As we are only investigating deposited dose, we recognize that our models cannot yet predict dose effectiveness. Nonetheless, these results can pinpoint whether or not the airways are receiving the particles in the first place. To improve delivery fractions, we altered the seeding conditions of the particles and found that particle release time may improve regional drug delivery. Improving regional dose levels may help deliver drug to the regions in need as well as reduce the amount of drug needed and associated adverse side effects.
GRANTS
This work was supported by National Heart, Lung, and Blood Institute Grants R21 HL-140436-01, R01 HL-069116, R01 HL-080412, and U10 HL-109168; National Center for Advancing Translational Sciences Grant UL1 TR-000427; and National Center for Research Resources Grant S10 OD-016394 (Pulmonary Imaging Center).
DISCLOSURES
No conflicts of interest, financial or otherwise, are declared by the authors.
AUTHOR CONTRIBUTIONS
S.B.F. and J.M.O. conceived and designed research; K.P. performed experiments; K.P. and J.M.O. analyzed data; K.P., D.G.M., S.B.F., and J.M.O. interpreted results of experiments; K.P. prepared figures; K.P. and J.M.O. drafted manuscript; K.P., D.G.M., S.B.F., and J.M.O. edited and revised manuscript; K.P., D.G.M., S.B.F., and J.M.O. approved final version of manuscript.
ACKNOWLEDGMENTS
We thank Dr. Laura Nicolaou for fruitful discussions regarding the flow modeling.
REFERENCES
- 1.Akinbami LJ, Moorman JE, Bailey C, Zahran HS, King M, Johnson CA, Liu X. Trends in asthma prevalence, health care use, and mortality in the United States, 2001-2010. NCHS Data Brief 94: 1–8 2012. [PubMed] [Google Scholar]
- 2.Proceedings of the ATS workshop on refractory asthma: current understanding, recommendations, and unanswered questions. Am J Respir Crit Care Med 162: 2341–2351, 2000. doi: 10.1164/ajrccm.162.6.ats9-00. [DOI] [PubMed] [Google Scholar]
- 3.Burrowes KS, Doel T, Brightling C. Computational modeling of the obstructive lung diseases asthma and COPD. J Transl Med 12, Suppl 2: S5, 2014. doi: 10.1186/1479-5876-12-S2-S5. [DOI] [PMC free article] [PubMed] [Google Scholar]
- 4.Campana L, Kenyon J, Zhalehdoust-Sani S, Tzeng YS, Sun Y, Albert M, Lutchen KR. Probing airway conditions governing ventilation defects in asthma via hyperpolarized MRI image functional modeling. J Appl Physiol (1985) 106: 1293–1300, 2009. doi: 10.1152/japplphysiol.91428.2008. [DOI] [PMC free article] [PubMed] [Google Scholar]
- 5.Chan HF, Tawhai MH, Levin DL, Bartholmai BB, Clark AR. Supine to upright lung mechanics: do changes in lung shape influence lung tissue deformation? Conf Proc IEEE Eng Med Biol Soc 2014: 832–835, 2014. doi: 10.1109/EMBC.2014.6943720. [DOI] [PubMed] [Google Scholar]
- 6.Choi S, Miyawaki S, Lin CL. A feasible computational fluid dynamics study for relationships of structural and functional alterations with particle depositions in severe asthmatic lungs. Comput Math Methods Med 2018: 6564854, 2018. doi: 10.1155/2018/6564854. [DOI] [PMC free article] [PubMed] [Google Scholar]
- 7.Clark AR, Kumar H, Burrowes K. Capturing complexity in pulmonary system modelling. Proc Inst Mech Eng H 231: 355–368, 2017. doi: 10.1177/0954411916683221. [DOI] [PubMed] [Google Scholar]
- 8.Das P, Nof E, Amirav I, Kassinos SC, Sznitman J. Targeting inhaled aerosol delivery to upper airways in children: insight from computational fluid dynamics (CFD). PLoS One 13: e0207711, 2018. doi: 10.1371/journal.pone.0207711. [DOI] [PMC free article] [PubMed] [Google Scholar]
- 9.De Backer J, Van Holsbeke C, Vos W, Vinchurkar S, Dorinsky P, Rebello J, Mangale M, Hajian B, De Backer W. Assessment of lung deposition and analysis of the effect of fluticasone/salmeterol hydrofluoroalkane (HFA) pressurized metered dose inhaler (pMDI) in stable persistent asthma patients using functional respiratory imaging. Expert Rev Respir Med 10: 927–933, 2016. doi: 10.1080/17476348.2016.1192464. [DOI] [PubMed] [Google Scholar]
- 10.De Backer JW, Vos WG, Vinchurkar SC, Claes R, Drollmann A, Wulfrank D, Parizel PM, Germonpré P, De Backer W. Validation of computational fluid dynamics in CT-based airway models with SPECT/CT. Radiology 257: 854–862, 2010. doi: 10.1148/radiol.10100322. [DOI] [PubMed] [Google Scholar]
- 11.Denlinger LC, Phillips BR, Ramratnam S, Ross K, Bhakta NR, Cardet JC, Castro M, Peters SP, Phipatanakul W, Aujla S, Bacharier LB, Bleecker ER, Comhair SA, Coverstone A, DeBoer M, Erzurum SC, Fain SB, Fajt M, Fitzpatrick AM, Gaffin J, Gaston B, Hastie AT, Hawkins GA, Holguin F, Irani AM, Israel E, Levy BD, Ly N, Meyers DA, Moore WC, Myers R, Opina MT, Peters MC, Schiebler ML, Sorkness RL, Teague WG, Wenzel SE, Woodruff PG, Mauger DT, Fahy JV, Jarjour NN; National Heart, Lung, and Blood Institute’s Severe Asthma Research Program-3 Investigators . Inflammatory and comorbid features of patients with severe asthma and frequent exacerbations. Am J Respir Crit Care Med 195: 302–313, 2017. doi: 10.1164/rccm.201602-0419OC. [DOI] [PMC free article] [PubMed] [Google Scholar]
- 12.Ditcham W, Murdzoska J, Zhang G, Roller C, von Hollen D, Nikander K, Devadason SG. Lung deposition of 99mTc-radiolabeled albuterol delivered through a pressurized metered dose inhaler and spacer with facemask or mouthpiece in children with asthma. J Aerosol Med Pulm Drug Deliv 27, Suppl 1: S63–S75, 2014. doi: 10.1089/jamp.2014.1139. [DOI] [PubMed] [Google Scholar]
- 13.Elghobashi S. On predicting particle-laden turbulent flows. Appl Sci Res 52: 309–329, 1994. doi: 10.1007/BF00936835. [DOI] [Google Scholar]
- 14.Esmaily-Moghadam M, Bazilevs Y, Marsden AL. A new preconditioning technique for implicitly coupled multidomain simulations with applications to hemodynamics. Comput Mech 52: 1141–1152, 2013. doi: 10.1007/s00466-013-0868-1. [DOI] [Google Scholar]
- 15.Fain S, Schiebler ML, McCormack DG, Parraga G. Imaging of lung function using hyperpolarized helium-3 magnetic resonance imaging: review of current and emerging translational methods and applications. J Magn Reson Imaging 32: 1398–1408, 2010. doi: 10.1002/jmri.22375. [DOI] [PMC free article] [PubMed] [Google Scholar]
- 16.Fain SB, Sorkness RL. Using MRI to reveal (and resolve) the complexity of obstructive lung disease. Acad Radiol 23: 393–395, 2016. doi: 10.1016/j.acra.2016.01.007. [DOI] [PubMed] [Google Scholar]
- 17.Fleming J, Conway J, Majoral C, Katz I, Caillibotte G, Pichelin M, Montesantos S, Bennett M. Controlled, parametric, individualized, 2-D and 3-D imaging measurements of aerosol deposition in the respiratory tract of asthmatic human subjects for model validation. J Aerosol Med Pulm Drug Deliv 28: 432–451, 2015. doi: 10.1089/jamp.2014.1191. [DOI] [PubMed] [Google Scholar]
- 18.Greenblatt EE, Winkler T, Harris RS, Kelly VJ, Kone M, Venegas J. Analysis of three-dimensional aerosol deposition in pharmacologically relevant terms: beyond black or white ROIs. J Aerosol Med Pulm Drug Deliv 28: 116–129, 2015. doi: 10.1089/jamp.2013.1120. [DOI] [PMC free article] [PubMed] [Google Scholar]
- 19.Hahn AD, Cadman RV, Sorkness RL, Jarjour NN, Nagle SK, Fain SB. Redistribution of inhaled hyperpolarized 3He gas during breath-hold differs by asthma severity. J Appl Physiol (1985) 120: 526–536, 2016. doi: 10.1152/japplphysiol.00197.2015. [DOI] [PMC free article] [PubMed] [Google Scholar]
- 20.Harris RS, Fujii-Rios H, Winkler T, Musch G, Vidal Melo MF, Venegas JG. Ventilation defect formation in healthy and asthma subjects is determined by lung inflation. PLoS One 7: e53216, 2012. [Erratum in PLoS One 9: 10.1371/annotation/0dafbfa4-2289-40ec-9f21-35b24a9302c3, 2014.] doi: 10.1371/journal.pone.0053216. [DOI] [PMC free article] [PubMed] [Google Scholar]
- 21.Harris RS, Winkler T, Tgavalekos N, Musch G, Melo MF, Schroeder T, Chang Y, Venegas JG. Regional pulmonary perfusion, inflation, and ventilation defects in bronchoconstricted patients with asthma. Am J Respir Crit Care Med 174: 245–253, 2006. doi: 10.1164/rccm.200510-1634OC. [DOI] [PMC free article] [PubMed] [Google Scholar]
- 22.Kang W, Clark XA, Tawhai MH. Gravity outweighs the contribution of structure to passive ventilation- perfusion matching in the supine adult human lung. J Appl Physiol (1985) 124: 23–33, 2018. 10.1152/japplphysiol.00791.2016. [DOI] [PMC free article] [PubMed] [Google Scholar]
- 23.Katz I, Pichelin M, Montesantos S, Murdock A, Fromont S, Venegas J, Caillibotte G. The influence of lung volume during imaging on CFD within realistic airway models. Aerosol Sci Technol 51: 214–223, 2017. doi: 10.1080/02786826.2016.1254721. [DOI] [Google Scholar]
- 24.Khajeh-Hosseini-Dalasm N, Longest PW. Deposition of particles in the alveolar airways: inhalation and breath-hold with pharmaceutical aerosols. J Aerosol Sci 79: 15–30, 2015. doi: 10.1016/j.jaerosci.2014.09.003. [DOI] [PMC free article] [PubMed] [Google Scholar]
- 25.Kim M, Bordas R, Vos W, Hartley RA, Brightling CE, Kay D, Grau V, Burrowes KS. Dynamic flow characteristics in normal and asthmatic lungs. Int J Numer Methods Biomed Eng 31: 1–13, 2015. doi: 10.1002/cnm.2730. [DOI] [PubMed] [Google Scholar]
- 26.King GG, Harris B, Mahadev S. V/Q SPECT: utility for investigation of pulmonary physiology. Semin Nucl Med 40: 467–473, 2010. doi: 10.1053/j.semnuclmed.2010.07.006. [DOI] [PubMed] [Google Scholar]
- 27.Koullapis PG, Nicolaou L, Kassinos SC. In silico assessment of mouth-throat effects on regional deposition in the upper tracheobronchial airways. J Aerosol Sci 117: 164–188, 2018. doi: 10.1016/j.jaerosci.2017.12.001. [DOI] [Google Scholar]
- 28.Lin CL, Tawhai MH, McLennan G, Hoffman EA. Characteristics of the turbulent laryngeal jet and its effect on airflow in the human intra-thoracic airways. Respir Physiol Neurobiol 157: 295–309, 2007. doi: 10.1016/j.resp.2007.02.006. [DOI] [PMC free article] [PubMed] [Google Scholar]
- 29.Longest PW, Tian G. Development of a new technique for the efficient delivery of aerosolized medications to infants on mechanical ventilation. Pharm Res 32: 321–336, 2015. doi: 10.1007/s11095-014-1466-4. [DOI] [PMC free article] [PubMed] [Google Scholar]
- 30.Longest PW, Tian G, Khajeh-Hosseini-Dalasm N, Hindle M. Validating whole-airway CFD predictions of DPI aerosol deposition at multiple flow rates. J Aerosol Med Pulm Drug Deliv 29: 461–481, 2016. doi: 10.1089/jamp.2015.1281. [DOI] [PMC free article] [PubMed] [Google Scholar]
- 31.Longest PW, Tian G, Walenga RL, Hindle M. Comparing MDI and DPI aerosol deposition using in vitro experiments and a new stochastic individual path (SIP) model of the conducting airways. Pharm Res 29: 1670–1688, 2012. doi: 10.1007/s11095-012-0691-y. [DOI] [PubMed] [Google Scholar]
- 32.Longest PW, Vinchurkar S, Martonen T. Transport and deposition of respiratory aerosols in models of childhood asthma. J Aerosol Sci 37: 1234–1257, 2006. doi: 10.1016/j.jaerosci.2006.01.011. [DOI] [Google Scholar]
- 33.Lui JK, Lutchen KR. The role of heterogeneity in asthma: a structure-to-function perspective. Clin Transl Med 6: 29, 2017. doi: 10.1186/s40169-017-0159-0. [DOI] [PMC free article] [PubMed] [Google Scholar]
- 34.Luo HY, Liu Y. Particle deposition in a CT-scanned human lung airway. J Biomech 42: 1869–1876, 2009. doi: 10.1016/j.jbiomech.2009.05.004. [DOI] [PubMed] [Google Scholar]
- 35.Lutchen KR, Jensen A, Atileh H, Kaczka DW, Israel E, Suki B, Ingenito EP. Airway constriction pattern is a central component of asthma severity: the role of deep inspirations. Am J Respir Crit Care Med 164: 207–215, 2001. doi: 10.1164/ajrccm.164.2.2008119. [DOI] [PubMed] [Google Scholar]
- 36.Montesantos S, Katz I, Fleming J, Majoral C, Pichelin M, Dubau C, Piednoir B, Conway J, Texereau J, Caillibotte G. Airway morphology from high resolution computed tomography in healthy subjects and patients with moderate persistent asthma. Anat Rec (Hoboken) 296: 852–866, 2013. doi: 10.1002/ar.22695. [DOI] [PubMed] [Google Scholar]
- 37.Mummy DG, Kruger SJ, Zha W, Sorkness RL, Jarjour NN, Schiebler ML, Denlinger LC, Evans MD, Fain SB. Ventilation defect percent in helium-3 magnetic resonance imaging as a biomarker of severe outcomes in asthma. J Allergy Clin Immunol 141: 1140–1141.e4, 2018. doi: 10.1016/j.jaci.2017.10.016. [DOI] [PMC free article] [PubMed] [Google Scholar]
- 38.Newman S, Salmon A, Nave R, Drollmann A. High lung deposition of 99mTc-labeled ciclesonide administered via HFA-MDI to patients with asthma. Respir Med 100: 375–384, 2006. doi: 10.1016/j.rmed.2005.09.027. [DOI] [PubMed] [Google Scholar]
- 39.Newman SP. Principles of metered-dose inhaler design. Respir Care 50: 1177–1190, 2005. [PubMed] [Google Scholar]
- 40.Nicolaou L. Inertial and gravitational effects on aerosol deposition in the conducting airways. J Aerosol Sci 120: 32–51, 2018. doi: 10.1016/j.jaerosci.2018.03.003. [DOI] [Google Scholar]
- 41.Nicolaou L, Zaki TA. Characterization of aerosol Stokes number in 90° bends and idealized extrathoracic airways. J Aerosol Sci 102: 105–127, 2016. doi: 10.1016/j.jaerosci.2016.09.003. [DOI] [Google Scholar]
- 42.Oakes JM, Breen EC, Scadeng M, Tchantchou GS, Darquenne C. MRI-based measurements of aerosol deposition in the lung of healthy and elastase-treated rats. J Appl Physiol (1985) 116: 1561–1568, 2014. doi: 10.1152/japplphysiol.01165.2013. [DOI] [PMC free article] [PubMed] [Google Scholar]
- 43.Oakes JM, Marsden AL, Grandmont C, Shadden SC, Darquenne C, Vignon-Clementel IE. Airflow and particle deposition simulations in health and emphysema: from in vivo to in silico animal experiments. Ann Biomed Eng 42: 899–914, 2014. doi: 10.1007/s10439-013-0954-8. [DOI] [PMC free article] [PubMed] [Google Scholar]
- 44.Oakes JM, Mummy D, Poorbahrami K, Zha W, Fain SB. Patient-specific computational simulations of hyperpolarized 3He MRI ventilation defects in healthy and asthmatic subjects. IEEE Trans Biomed Eng 66: 1318–1327, 2019. doi: 10.1109/TBME.2018.2872845. [DOI] [PubMed] [Google Scholar]
- 45.Oakes JM, Shadden SC, Grandmont C, Vignon-Clementel IE. Aerosol transport throughout inspiration and expiration in the pulmonary airways. Int J Numer Methods Biomed Eng 33: e2847, 2017. doi: 10.1002/cnm.2847. [DOI] [PubMed] [Google Scholar]
- 46.Ostrovski Y, Dorfman S, Mezhericher M, Kassinos S, Sznitman J. Targeted Drug delivery to upper airways using a pulsed aerosol bolus and inhaled volume tracking method. Flow Turbul Combust 102: 73–87, 2019. doi: 10.1007/s10494-018-9927-1. [DOI] [PMC free article] [PubMed] [Google Scholar]
- 47.Poorbahrami K, Oakes JM. Regional flow and deposition variability in adult female lungs: A numerical simulation pilot study. Clin Biomech (Bristol, Avon) 66: 40–49, 2019. doi: 10.1016/j.clinbiomech.2017.12.014. [DOI] [PubMed] [Google Scholar]
- 48.Quanjer PH, Stanojevic S, Cole TJ, Baur X, Hall GL, Culver BH, Enright PL, Hankinson JL, Ip MS, Zheng J, Stocks J. Multi-ethnic reference values for spirometry for the 3-95-yr age range: the global lung function 2012 equations. Eur Respir J 40: 1324–1343, 2012. doi: 10.1183/09031936.00080312. [DOI] [PMC free article] [PubMed] [Google Scholar]
- 50.Scheinherr A, Bailly L, Boiron O, Lagier A, Legou T, Pichelin M, Caillibotte G, Giovanni A. Realistic glottal motion and airflow rate during human breathing. Med Eng Phys 37: 829–839, 2015. [Erratum in Med Eng Phys 38: 1035, 2016.] doi: 10.1016/j.medengphy.2015.05.014. [DOI] [PubMed] [Google Scholar]
- 51.Tzeng YS, Lutchen K, Albert M. The difference in ventilation heterogeneity between asthmatic and healthy subjects quantified using hyperpolarized 3He MRI. J Appl Physiol (1985) 106: 813–822, 2009. doi: 10.1152/japplphysiol.01133.2007. [DOI] [PubMed] [Google Scholar]
- 52.Updegrove A, Wilson NM, Merkow J, Lan H, Marsden AL, Shadden SC. SimVascular: an open source pipeline for cardiovascular simulation. Ann Biomed Eng 45: 525–541, 2017. doi: 10.1007/s10439-016-1762-8. [DOI] [PMC free article] [PubMed] [Google Scholar]
- 53.Usmani OS, Barnes PJ. Assessing and treating small airways disease in asthma and chronic obstructive pulmonary disease. Ann Med 44: 146–156, 2012. doi: 10.3109/07853890.2011.585656. [DOI] [PubMed] [Google Scholar]
- 54.Venegas JG, Schroeder T, Harris S, Winkler RT, Melo MF. The distribution of ventilation during bronchoconstriction is patchy and bimodal: a PET imaging study. Respir Physiol Neurobiol 148: 57–64, 2005. doi: 10.1016/j.resp.2005.05.023. [DOI] [PubMed] [Google Scholar]
- 54a.Venegas JG, Winkler T, Musch G, Vidal Melo MF, Layfield D, Tgavalekos N, Fischman AJ, Callahan RJ, Bellani G, Harris RS. Self-organized patchiness in asthma as a prelude to catastrophic shifts. Nature 434: 777–782, 2005. doi: 10.1038/nature03490. [DOI] [PubMed] [Google Scholar]
- 55.Vinchurkar S, De Backer LD, Vos W, Van Holsbeke CV, De Backer JD, De Backer WD. A case series on lung deposition analysis of inhaled medication using functional imaging based computational fluid dynamics in asthmatic patients: effect of upper airway morphology and comparison with in vivo data. Inhal Toxicol 24: 81–88, 2012. doi: 10.3109/08958378.2011.644351. [DOI] [PubMed] [Google Scholar]
- 56.Zha W, Niles DJ, Kruger SJ, Dardzinski BJ, Cadman RV, Mummy DG, Nagle SK, Fain SB. Semiautomated ventilation defect quantification in exercise-induced bronchoconstriction using hyperpolarized helium-3 magnetic resonance imaging: a repeatability study. Acad Radiol 23: 1104–1114, 2016. doi: 10.1016/j.acra.2016.04.005. [DOI] [PMC free article] [PubMed] [Google Scholar]
- 57.Zhang H, Papadakis G. Computational analysis of flow structure and particle deposition in a single asthmatic human airway bifurcation. J Biomech 43: 2453–2459, 2010. doi: 10.1016/j.jbiomech.2010.05.031. [DOI] [PubMed] [Google Scholar]