

Abstract
Background
Glycogen synthase kinase-3 (GSK3) is associated with various key biological processes and has been considered as an important therapeutic target for the treatment of many diseases. Great efforts have been made on the development of GSK3 inhibitors, especially ATP-competitive GSK3β inhibitor, but it is still a great challenge to develop selective GSK3β inhibitors because of the high sequence homology with other kinases.
Objective
In order to reveal the selectivity mechanisms of GSK3β inhibition at the molecular level, a series of ATP-competitive GSK3β inhibitor was analyzed by a systematic computational method, combining 3D-QSAR, molecular docking, molecular dynamic simulations and free energy calculations.
Methods
Firstly, 3D-QSAR with CoMFA was built to explore the general structure activity relationships. Secondly, CDOCKER and Flexible docking were employed to predicted the reasonable docking poses of all studied inhibitors. And then, both GSK3β and CDK2 complexes were selected to conduct molecular dynamics simulations. Finally, the free energy calculations were employed to find the key selective-residues.
Results
CoMFA model suggested the steric, hydrophobic fields play key roles in the bioactivities of inhibitors, and the binding mechanisms were well analyzed through molecular docking. The binding free energies predicted are in good agreement with the experimental bioactivities and the free energy calculations showed that the binding of GSK3β/inhibitors was mainly contributed from hydrogen bonding and hydrophobic interaction.
Conclusion
Some key residues for selective binding were highlighted, which may afford important guidance for the rational design of novel ATP-competitive GSK3β inhibitors.
Keywords: GSK3β ATP-competitive inhibitors, selective inhibitors, 3D-QSAR CoMFA, molecular docking, molecular dynamics simulation, free energy calculation
1. INTRODUCTION
Glycogen synthase kinase-3 (GSK3) is a ubiquitously expressed serine/threonine protein kinase implicated in the regulation of many physiological responses in mammalian cells by phosphorylating a variety of cytoplasmic and nuclear proteins, that modulates many fundamental signaling pathways including processes of glucose metabolism, Wnt signaling, abnormal excessive phosphorylation of tau protein
etc. [1, 2]. Moreover, the kinase GSK3 can be divided into GSK3α and GSK3β, which is inhibited by external phosphorylation of Ser21 in α isoform and Ser9 in β, respectively [3]. Since GSK3 has multifaceted roles in many signaling pathways, an elevation or relegation of its normal activity level is associated with several diseases, such as type-2 diabetes and Alzheimer’s disease. GSK3 has recently emerged as a potential therapeutic target [4-10].
In the past decades, GSK3β has received more attention and a number of GSK3β inhibitors have been designed and reported successively, and these inhibitors are mainly divided into two types: ATP competition and non-ATP competition inhibitors [11-14]. In the last couple years, significant effort has been devoted to the development of ATP competition GSK3β inhibitors, but so far, none of these inhibitors have advanced to clinical trials. There could be two reasons for this failure [15]: On the one hand, the two isoforms of GSK3 show 97% identical in sequence within the catalytic domain [11]; on the other hand, most ATP competitive GSK3β inhibitors potentially inhibit other kinases, especially CDK2 (Cyclin-dependent kinase) [11, 16, 17]. Therefore, it would be a great challenge to develop specific GSK3β inhibitors. Compared with traditional structure-activity relationship studies, computer-aided drug design (CADD) methods may provide systematic investigations on the selective GSK3β binding mechanism of the ATP competitive inhibitors at the molecular level [18-24]. As an important technology and tool for drug design, CADD, including quantitative structure-activity relationship (QSAR) analysis, molecular docking, molecular dynamics (MD) simulation and free energy calculations etc., has been widely used to design or discover novel GSK3β inhibitors [19, 25-27]. But the theoretical studies on the selectivity mechanisms of GSK3β through these simulation techniques are quite limited. Therefore in this study, a computational strategy, which combined 3D-QSAR, molecular docking, MD simulation, free energy calculations and decomposition, was employed to reveal the mechanisms of GSK3β binding selectivity. Our findings may provide some useful enlightenment for the development of high selective GSK3β inhibitors.
2. MATERIALS AND METHODS
2.1. 3D-QSAR
2.1.1. Data Set
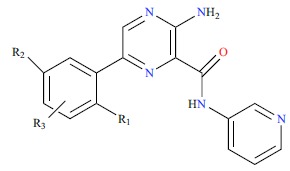
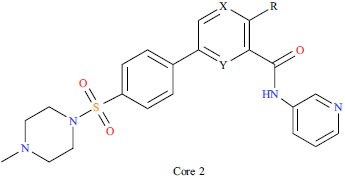
Thirty-one compounds were selected for the generation of CoMFA model based on the GSK3β inhibitory activity as reported (Table 1) [28]. Based on the diversity and activity range of molecular structure, the whole data set was divided into training set containing 24 compounds for 3D-QSAR model generation and testing set containing 7 compounds for model checking through the Generate Training and Test Data module of Discovery Studio 3.5 (DS3.5). In this process, Split method is modified to random, and the ratio of the training set to the test set is approximately 3:1. All the inhibitors were sketched by sybyl-x2.0, and the energy minimization procedure was used in sybyl-x2.0 to achieve stable conformations and the parameters were set as follows: all molecular charges using Tripos force field loading Pullman method, and the biggest iterations were set to 10000, energy gradient will be limited to 0.005 kcal/(mol·Å), other parameters as the default values. The related IC50 values were converted to PIC50 values (-log IC50) as the response variable for QSAR studies, the structures and PIC50 experimental values of all compounds are shown in Table 1 (the test set molecules labeled with asterisk). Then, two alignment protocols were respectively built: the first approach was based on the guidelines provided by Sybyl, the compounds of the training and test sets were superimposed with the common skeleton [21] (Fig. S1a (829.9KB, pdf) ) of the Cpd25, which was selected as the template molecule with the highest active, and the superimposed model is shown in Fig. S1b; another approach was based on the conformational poses from molecular docking, and the superimposed model is shown in Fig. (S2f (829.9KB, pdf) ).
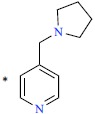
Table 1. The structures and experimental activities of GSK3β inhibitors. (Positions other than para substitution of R3 are indicated explicitly in the table by ortho or meta, Where the R3 group of the Cpd8 is in the meta position of R2, the R3 group of Cpd9 is in the ortho position of R2).
 | ||||||||||
| No. | R1 | R2 | R3 | IC50/(nm) | PIC50 | |||||
|---|---|---|---|---|---|---|---|---|---|---|
| 5 | H | H | H | 41 | 7.387 | |||||
| 8 | H | H | 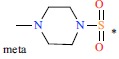 |
74 | 7.131 | |||||
| 9 | H | H | 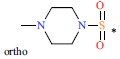 |
300 | 6.523 | |||||
| 10 | F | H | 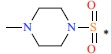 |
1.3 | 9.114 | |||||
| 11 | CH3 | H |  |
0.46 | 9.337 | |||||
| 12 | CF3 | H |  |
1.1 | 8.959 | |||||
| 13 | CH3 | CH3 |  |
1.5 | 8.824 | |||||
| 14 | H | F |  |
9 | 8.046 | |||||
| 15 | H | CH3 |  |
6.3 | 8.201 | |||||
| 16 | H | H |  |
2 | 8.699 | |||||
| *17 | H | H |  |
18 | 7.745 | |||||
| *18 | H | H |  |
4.9 | 8.31 | |||||
| No. | R1 | R2 | R3 | IC50/(nm) | PIC50 | |||||
| *19 | H | H |  |
4.4 | 8.357 | |||||
| 20 | H | H |  |
0.4 | 9.398 | |||||
| 21 | H | H |  |
12 | 7.921 | |||||
| 22 | H | H |  |
0.67 | 9.174 | |||||
| *23 | H | H |  |
20 | 7.699 | |||||
| *24 | H | H |  |
8.4 | 8.076 | |||||
| 37 | H | H |  |
3.1 | 8.509 | |||||
| 38 | H | H |  |
16 | 7.796 | |||||
 | ||||||||||
| No. | R | X | Y | IC50/(nm) | PIC50 | |||||
| 27 | NH2 | C | C | 120 | 6.921 | |||||
| 28 | NH2 | N | C | 64 | 7.194 | |||||
| 41 | H | N | N | 370 | 6.432 | |||||
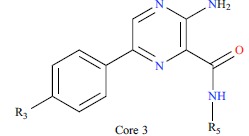 | ||||||||||
| No. | R3 | R5 | IC50/(nm) | PIC50 | ||||||
| 25 | 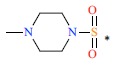 |
 |
0.22 | 9.658 | ||||||
| 26 |  |
 |
0.48 | 9.319 | ||||||
| 44 |  |
 |
12 | 7.921 | ||||||
| 45 |  |
 |
690 | 6.161 | ||||||
| 46 |  |
 |
0.99 | 9.004 | ||||||
| 49 |  |
 |
74 | 7.131 | ||||||
| *50 |  |
 |
90 | 7.046 | ||||||
| *51 |  |
 |
22 | 7.658 | ||||||
* The test set molecules.
2.1.2. CoMFA Model Building
In the CoMFA analyses, the following CoMFA fields were evaluated: traditional steric and electrostatic fields, H-bond donor and acceptor fields, indicator steric and electrostatic fields. Partial least squared (PLS), which is a kind of multiple linear regression, was used to construct a 3D-QSAR model with the link between the biological activity and molecular description. In order to get a more accurate and test the reliability of the model, then leave-one-out (LOO) cross-validation method was adopted to get the statistical parameters including conventional correlation coefficient (r2), standard error of estimate (SEE) and F-test values, the optimum principal component number (N) and the coefficient of cross validation (q2). When the q2 > 0.5, r2 > 0.9, the model has significant statistical criteria (other related values, F value > 100, SEE as small as possible). After internal validation, the test set was used for external validation to evaluate the ability of model prediction. Subsequently, the biological activities of test set compounds were predicted by the CoMFA mode and the predictive ability was expressed by the predictive correlation coefficient (R2test).
2.2. Molecular Docking
2.2.1. Preparation of Inhibitors and Protein
The four crystal structures of GSK3β (PDB entry: 4ACC, 4ACD, 4ACG, 4ACH) [28] were used as the initial receptor for molecular docking protocol. Preparation of protein macromolecules and small ligands is required before molecular docking. First, the protein was prepared by the prepare protein module in DS3.5 with the default parameter, the prepared proteins would be added polar hydrogen, removed water molecules, repaired the broken chain and added the CHARMm field. And then, all inhibitors were processed using the prepare ligands module in DS3.5 all ligands were protonated and generated a series of conformations to facilitate better docking.
2.2.2. Setting of Molecular Docking Parameters
Two docking protocols, CDOCKER (CD) and Flexible docking (FD), were employed to predict the binding mode between GSK3β and the inhibitors. CD, a semi-flexible docking, is a relatively accurate docking method. In this process, Top Hits are modified to 10, and Use Full potential is modified to False, as well as the default active pocket radius and the active pocket radius of 5 Å size. FD is a flexible docking method and allows greater realism than other docking formalisms in that flexibility of the ligand and receptor side-chains is permitted during the docking procedure. In FD study, the amino acids in the range of 4 Å around the original ligand were defined as active residues, and then, the Maximum Number of Generate protein conformations was set to 100, the Generate Ligand Conformation method was set as fast and the Max Hits to save was set to 3. The remaining parameters were set as default.
2.3. Molecular Dynamics Simulation
Four complexes (PDB: 4ACC, 4ACG, 4ACH, 4ACM) [28] were used as the initial structures of MD simulation by the SANDER program in Amber14 [29]. Then, the general Amber force field (gaff) [30] was used for the ligands and the Amber ff03 force field [31] was used for the proteins. The semi-empirical AM1 method in GAUSSIAN09 [32] was used to optimize small molecule inhibitors, partial of the atomic charge is obtained by using the RESP (restrained electrostatic potential) fitting technique to calculate the electrostatic potential at the HF/6-31G* level. The tleap module in AMBER14 was used to generate the topological structure and parameter files of the proteins and ligands studied. Each system was neutralized with Na+ ions, meanwhile, immersed in a rectangular box filled with TIP3P water molecules at a distance of 10 Å from any solute atom. The Particle Mesh Ewald (PME) scheme was used to deal with the long range electrostatics, in the range of 10 Å for van der Waals interactions.
Before the MD simulation, there are three steps to minimize the energy of each system using the SANDER program [33, 34]. First of all, under the condition of the principal carbon constraint (50 kcal /mol/Å2), 1000 minimization cycles (500 fastest descent cycles and 500 conjugate gradients) were performed. Secondly, 1000 cycles of minimizations with a weaker harmonic potential (10 kcal/mol/Å2) were carried out. Finally, in the absence of any constraints, the entire system is covered by 5000 minimum cycles (1000 steepest descent cycles and 4000 conjugate gradient cycles). During the MD simulation stage, each system is gradually heated gradually from 0 to 300K over 50 ps in the NPT ensemble. and then performed a 50-ps MD simulation in NPT ensemble with a temperature of 300 K and pressure 1 atm. At last, a 30 ns NPT MD simulation was performed, using the SHAKE algorithm to bind all the bonds involving hydrogen and the time step was set to 2.0 fs. Coordinates were saved every 10 ps [35].
2.4. MM/GBSA Free Energy Calculations and Decomposition
Each system is the combination of free energy calculation (ΔGbind) by MM/GBSA method, the following Equation (1) [36-39].
ΔGbind = Gcomplex - Gprotein - Gligand
= ΔH + Δ Gsolvation - TΔS (1)
= ΔEMM + ΔGGB + ΔGSA - TΔS
The binding free energy of GSK3β and inhibitors was calculated by MM/GBSA method. In this method, the structure of a frame system is extracted every 10 ps from the last 10 ns MD simulation trajectory of the composite for free energy calculation. Where ΔGcomplex, ΔGprotein and ΔGligand are the free energies of the complex, protein and inhibitor respectively. The free energy of gas phase (ΔEMM) can be divided into electrostatic free energy (ΔGele) and van der Waals free energy (ΔGvdw), and the free energy of solvation (ΔGsol) can be divided into polar solvent free energy (ΔGGB) and non-polar solvent free energy (ΔGSA). The contribution of polar solvent free energy to solvent free energy can be calculated by Generalized Born. In the calculation, the dielectric constant of solute and the permittivity of solvent are set to 1 and 80 respectively. The contact surface area of solvent was calculated by LCPO method.
The binding free energy was decomposed using the GBSA (Generalized Born/Surface Area) method, which decomposed the binding free energy of ligand-binding receptors into the contributions of the backbone atoms and side chain atoms of each residue. Equation (2) shows that proteins interact with small molecules in four different ways [17, 37, 40-45].
ΔGinhibitor-residue = ΔEvdw + ΔGele + ΔGGB + ΔGSA (2)
3. RESULTS AND DISCUSSION
3.1. 3D-QSAR Results Analysis
3.1.1. CoMFA Model Analysis
The CoMFA model based on superposition was used for the prediction of a series of pyrazine inhibitors in the following study. Five models based on the traditional (electrostatic and steric) fields and the “Advanced CoMFA” module containing H-bond fields and indicator fields were both investigated [46]. The results of these CoMFA models were summarized in Table 2. It is remarkable that CoMFA(1) and CoMFA(3) show better results than the other models, the q2 values are 0.594 and 0.510, respectively. And then, the bioactivities of the compounds in the testing set were predicted by these models, and the predictive correlation coefficients (R2test) were all calculated to evaluate the accuracies of these models. Meanwhile, the root mean-square error (RMSE) of all inhibitors were calculated, respectively. As shown in Table 2, although CoMFA(1) and CoMFA(3) both show satisfactory results (q2 > 0.5), CoMFA(1) contains the best predictive ability (R2test = 0.756). Therefore, CoMFA(1) was chosen to the following analysis. The CoMFA(1) model demonstrated a q2 value of 0.594, with optimal principal of components 5. PLS analysis provided conventional r2 value of 0.975, SEE value of 0.189, and F value of 140.387, which indicated that the model contained a good predictive ability (q2 > 0.5 and r2 > 0.9). In CoMFA model, the contributions of steric and electrostatic fields were 64.7% and 35.3% respectively, it suggested that the steric field contributed most to the GSK3β inhibitory activity. In addition, the experimental PIC50 and predicted PIC50 of all inhibitors are shown in Table S1 (829.9KB, pdf) and the predicted correlation coefficient (R2) between them are illustrated in Fig. (1a). (R2training = 0.975 and R2test = 0.756), these results suggested that the developed CoMFA model has a robust predictive capability for subsequent QSAR analysis.
Table 2. Statistical results of the CoMFA models.
| CoMFA(1) | CoMFA(2) | CoMFA(3) | CoMFA(4) | CoMFA(5) | |
|---|---|---|---|---|---|
| q2 | 0.594 | 0.157 | 0.510 | 0.359 | 0.267 |
| r2 | 0.975 | 0.630 | 0.938 | 0.978 | 0.964 |
| SEE | 0.189 | 0.670 | 0.290 | 0.177 | 0.220 |
| F | 140.347 | 18.108 | 71.819 | 160.441 | 128.241 |
| Components | 5 | 2 | 4 | 5 | 4 |
| Steric | 0.647 | - | - | 0.278 | - |
| Electrostatic | 0.353 | - | - | 0.230 | - |
| Steric (indicator) | - | - | 0.612 | - | 0.280 |
| Electrostatic (indicator) | - | - | 0.388 | - | 0.202 |
| H-bond acceptor | - | 0.605 | - | 0.340 | 0.350 |
| H-bond donor | - | 0.395 | - | 0.152 | 0.168 |
| R2test | 0.756 | 0.418 | 0.412 | 0.467 | 0.477 |
| aRMSE | 0.337 | 0.640 | 0.313 | 0.274 | 0.271 |
aRMSE (root mean-square error) =
Fig. (1).
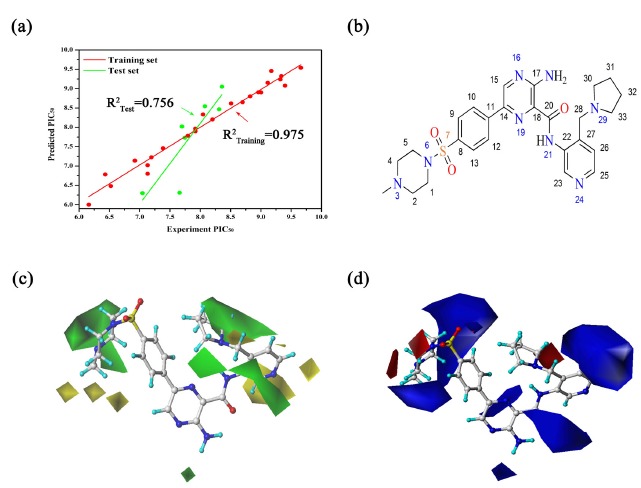
(a) Plots of predicted PIC50 values versus experimental PIC50 values for the CoMFA models (training set colored in red and test set colored in green); (b) the structure of Cpd25; (c) steric contour maps; (d) electrostetic contour maps.
3.1.2. Analysis of CoMFA Model Contour Maps
The contour maps of CoMFA model can directly reflect the effects of steric and electrostatic field parameters on the activity of compounds, and further guide the rational design of compounds. In the contour maps of the steric field, the yellow area indicates that the introduction of larger groups will reduce the activity, while the green area indicates that the introduction of larger groups will increase the activity of compounds. While in the electrostatic field, the red region represents that the introduction of negative groups can improve the activity of compounds, and the blue region represents that the introduction of positive groups can improve the activity of compounds. In order to facilitate the analysis and discussion of the CoMFA model equipotential diagram, Cpd25 (Fig. 1b), with the highest inhibitory activity, is displayed in the maps to aid in visualization.
The steric fields of CoMFA are shown in Fig. (1c), a large green contour was mapped near 3 and 4 positions of piperazine ring, indicating that this area was suitable for the introduction of bulky groups substituents. For example, Cpd18 (PIC50 = 8.310) had a bulkier substituent (methylpiperazinyl group) at position 3, and that significantly increased the activity compared to Cpd8 (PIC50 = 7.131) or Cpd9 (PIC50 = 6.523). Similarly, one large green area in the 30th and 31st attachments suggest that the introduction of large volume substituents nearby has a great improvement in biological activity. For example, Cpd25 (PIC50 = 9.658) has a higher activity than Cpd26 (PIC50 = 9.319) because of the introduction of 4-pyrrolidin-2-plpyridine group at R5 substitution. Finally,although there is just a small green contour between the 16 and 17 sites, a bulky group still would improve the biological activity, like Cpd27 (PIC50 = 6.921), along with the introduction of a polyatomic cycloalkyl group, showed higher inhibition than Cpd41 (PIC50 = 6.432). On the contrary, three small yellow contours surrounding carbon terminal of the site 3 indicated that a bulky group at this position would decrease the potency. By checking the analogues, it could be observed that Cpd20 (PIC50 = 9.398) had higher activity than Cpd18 (PIC50 = 8.310) substituted with bulky methyl groups at 6-position. Meanwhile, there are several yellow areas around the 21-nitrogen-connected pyridine, in the case of Cpd46 (PIC50 = 9.004), the activity is significantly higher than that of Cpd44 (PIC50 = 7.921), Cpd45 (PIC50 = 6.161) and Cpd49 (PIC50 = 7.131). The above statement also can be confirmed by Cpd25, due to the introduction of the large substituted cyclopentane in the green region at R5 substituent (Table 1), the activity of Cpd25 was significantly improved.
The electrostatic fields of CoMFA is shown in Fig. (1d). one small red contour appears near 3 and 4 positions, suggested their affinity to electron-withdrawing substituents. If these positions were replaced by electron donating groups, it would result in a decrease of inhibitory activity. For example, when Cpd22 (PIC50 = 9.174) introduced oxygen atoms at 3 positions, the biological activity increased by about 7 times compared with Cpd18 (PIC50 = 8.310). By contrast, a large blue area was covered around the piperazine ring, indicating that the introduction of electropositive groups was a benefit to biological activity. For example, the activity of Cpd18 is significantly higher than that of Cpd21 (PIC50 = 7.921), because N-methylpiperazinyl sulfonyl is more positive than sulfonamide. There are red region and larger blue region near position 7, suggesting that the area of electrical factors is more complex, which needs specific analysis. For Cpd25, position 8 was substituted by piperazine sulfonyl group, and it is clearly observed from Fig. (1d) that the electro negativity of sulfonyl is in the red areas, while the location of the piperazine ring in the blue area, observed to have increased activity. In addition, there is one small blue region between 16 and 17 sites, which indicated that the introduction of a positive group in the vicinity was profitable to the enhancement of biological activity. For example, Cpd28 bearing electro-withdrawing groups at position 17 displayed distinct improvements in potency which compared with Cpd41. Between Cpd25 and 26 located the blue area, such as Cpd46 (PIC50 = 9.004) whose activity was significantly higher than the Cpd49 (PIC50 = 7.131).
3.2. Molecular Docking Analysis
3.2.1. Comparison of Two Docking Methods
Molecular docking studies are widely used as a method of predicting the potential binding mechanisms between the bioactive compound and the protein [17, 47]. Firstly, in order to investigate the “docking power” [48, 49] of all crystal structures of GSK3β, the ligands extracted from four crystal structures were re-docked into the corresponding GSK3β proteins. And the RMSD (root mean square deviation) values between the re-docked complex and the initial crystal structure was calculated to compare. As illustrated in Fig. (S2a (829.9KB, pdf) -d (829.9KB, pdf) ), the docking pose of Cpd18 superimposed onto the crystal structure better than the other complexes (RMSD = 0.93 Å, Fig. S2b (829.9KB, pdf) ), thus Cpd18 was selected to perform the next docking protocols. Secondly, to verify the accuracy of two docking protocols, the crystal structure of 4ACD coupled with Cpd18 was re-docked by FD, and as shown in Fig. (S2e (829.9KB, pdf) ), the FD docked pose of Cpd18 superimposed better (RMSD = 0.56 Å) than CD (RMSD = 0.93 Å), it implicated that FD would perform well for this system. On the other hand, the correlation coefficients (r2) of both docking protocols were evaluated to detect the relationship between the observed experimental values (PIC50) against the predicted docking scores of the protein-ligand complexes. As shown in Figs. (2a and b), the predicted scores obtained by FD show greater liner correlation (r2 = 0.588) than CD docking (r2 = 0.333), which means the flexibility of protein is crucial for binding between GSK3β and the inhibitors. The overall results proved that FD more accurate than CD for the next analysis.
Fig. (2).
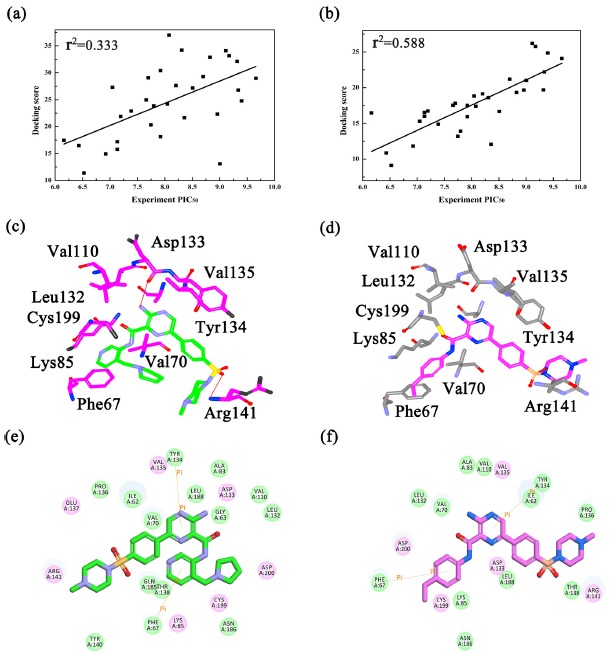
(a) The correlations between the experimental PIC50 and the docking scores by (a) CDOCKER and (b) Flexible Docking; Flexible docking model of (c) Cpd25 and (d) Cpd45 in the active site of GSK3β; 2D presentations of the interactions between GSK3β and (e) Cpd25; (f) Cpd45.
3.2.2. Analysis of Docking Results
Based on the above docking results, the discussion was mainly focused on the FD re-docked complexes. Fig. (S2f (829.9KB, pdf) ) shows the alignments of all docked structures in the binding site of GSK3β, and all the docked molecules share similar binding modes. In order to evaluate the effects of different molecular alignments on CoMFA model [50], the FD docking poses of all the inhibitors (Fig. S2f (829.9KB, pdf) ) were constructed using CoMFA models with different fields, and the results are summarized in Table S2 (829.9KB, pdf) . Some models showed the good q2 values, such as CoMFA (1) = 0.561, CoMFA(5) = 0.556, but it is disappointing that all of them exhibited poor predictive abilities (Table S2 (829.9KB, pdf) ). Be that as it may, these docking poses still provide valuable information for exploring the structure-activity relationship between GSK3β and the inhibitors. In the case of Cpd25 and Cpd45 (Figs. 2c and d), the docking results revealed that Cpd25 and Cpd45 bound to the same position of GSK3β and the residues Phe67, Ala83, Lys85, Val110, Leu132, Asp133, Tyr134, Val135, Arg141, Cys199 constructed the ATP pocket almost surrounded by both inhibitors. Meanwhile, Fig. (2c) showed that Cpd25 formed two hydrogen bonds (H-bond) with Asp133 and Arg141, while these H-bonds lost between GSK3β and Cpd45, these H-bond interactions could keep strong affinity to GSK3β and that is consistent with the large difference of bioactivities between them. The pyridine ring and piperazine ring of Cpd25 and 45, respectively formed π-π stacking and π-cation interactions with Phe67, Tyr134 (Figs. 2e and f). The above results indicate that the H-bonds and π-cation interactions play important roles in maintaining the stability of binding interactions between the ligand and GSK3β [17]. In addition, the structure of GSK3β minor changes adapts to different inhibitors. For example, compared with Cpd25 (Figs. 2e and f), when interacting with Cpd45, several residues, including Phe67, Val70, Asp133 and Arg141, showed major conformational changes to adapt the structure of Cpd45. This further shows the importance of the flexibility of GSK3β for inhibitor-target recognition.
3.3. Molecular Dynamics Simulation
3.3.1. Binding Free Energy Calculations
In order to evaluate the dynamic binding process of the studied inhibitors and rationality of the simulated complex system, the RMSD variation of the complex structure with respect to the initial structure skeleton atoms during the simulation process was calculated and the results are shown in Fig. (S3 (829.9KB, pdf) ). The plots showed that all studied systems reached equilibrium within 10 ns, with an average about 1.5Å RMSD fluctuation. Based on the MD simulations, to explore the most favorable binding mechanism of the studied complex, the binding free energies for the four inhibitors were calculated and the results are summarized in Table 3. Simultaneously, non-polarity bond was significantly stronger than that of the polarity bond of all the studied inhibitors. Van der Waals force and electrostatic terms are quite favorable for inhibitor binding to GSK3β, while the polar solvation term is unfavorable for binding in all four complexes. Non-polar contribution (Δvdw + ΔSA) of 4ACG/Cpd25 (-88.400 kcal•mol-1) is significantly stronger than that of 4ACC/Cpd23 (-51.480 kcal•mol-1), 4ACH/Cpd51 (-74.300 kcal•mol-1) and 4ACM/Cpd23 (-54.020 kcal•mol-1), which agreed with the GSK3β inhibitory activities assayed in vitro.
Table 3. MM/GBSA energy components and binding free energies (ΔGpred) versus experimental data.
| Complex | ΔEvdw | ΔEele | ΔGSA | ΔGGB | ΔGPred | PIC50 |
|---|---|---|---|---|---|---|
| 4ACC/23 | -47.19 ± 0.95 | -34.43 ± 0.32 | -4.29 ± 0.17 | 47.16 ± 0.57 | -38.75 ± 0.02 | 7.699 |
| 4ACG/25 | -57.40 ± 0.48 | -31.00 ± 0.32 | -5.00 ± 0.24 | 46.37 ± 0.33 | -47.03 ± 0.12 | 9.658 |
| 4ACH/51 | -48.84 ± 0.47 | -25.46 ± 0.49 | -4.39 ± 0.28 | 43.20 ± 0.44 | -35.49 ± 0.01 | 7.658 |
| 4ACM/23 | -49.65 ± 0.14 | -29.14 ± 1.65 | -4.37 ± 0.21 | 50.66 ± 0.29 | -32.52 ± 0.46 | 7.432 |
3.3.2. Analysis of the Inhibitors Binding Mechanism
For the sake of quantitatively identify the contribution of each residue to inhibitors, the total binding free energies for four complexes were further decomposed into individual residue contributions. The comparison of the inhibitor-residues energy difference is illustrated in Figs. (3, 4 and S4 (829.9KB, pdf) ). As Fig. (3) appears at a first glance, all three complexes share several similar interaction patterns with the active site residues, such as Val70, Asp133, Tyr134, Val135, Arg141 of GSK3β, their contributions to ΔGpred are all lower than -2.0 kcal•mol-1 (Figs. (3a-c), respectively). Obviously, the majority of these residues are all hydrophobic amino acids, that makes the non-polar interactions become the dominating force for the inhibitor binding. Meanwhile, some of the other residues that give rise to the difference in their bioactivities which are summarized in Figs. (3a-c), such as Ile62, Lys85. Then, in order to explore the detail effects of different substituents, the comparison of the inhibitor-receptor for three groups (4ACC/Cpd23 and 4ACG/Cpd25, 4ACH/Cpd51 and 4ACG/Cpd25, 4ACC/Cpd23 and 4ACM/ Cpd23) were illustrated in Fig. (3).
Fig. (3).
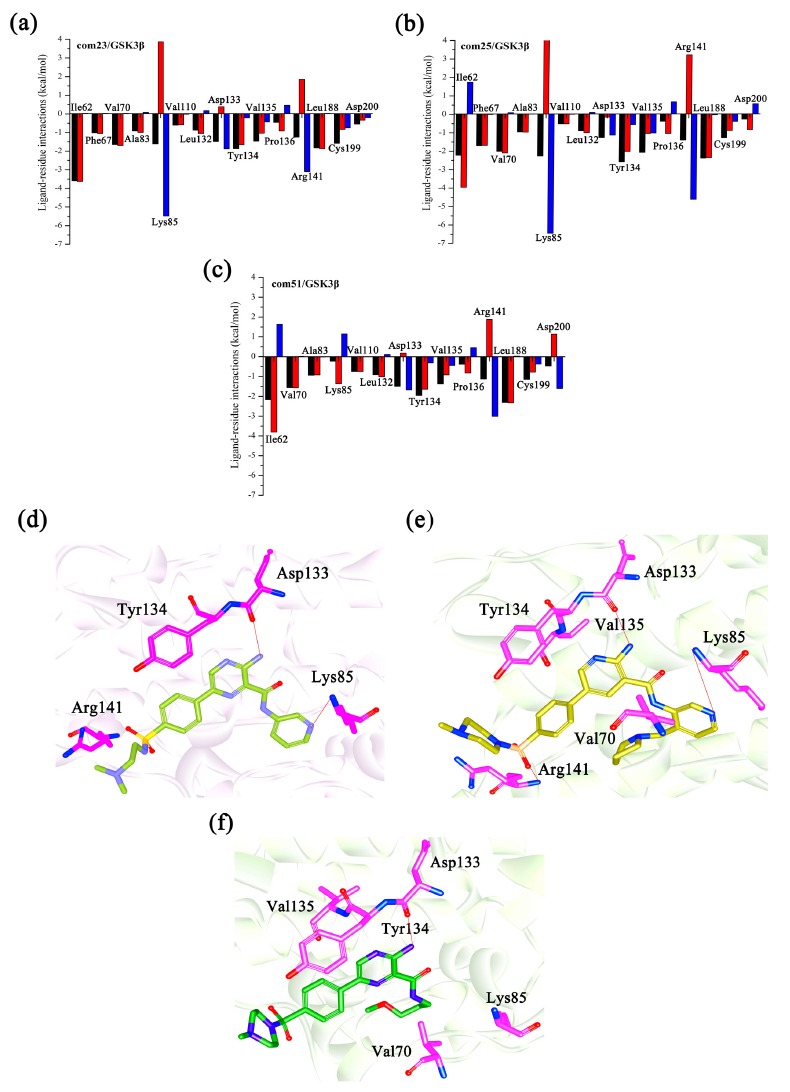
The changes of inhibitor-residue spectrum for (a) GSK3β/Cpd23; (b) GSK3β/Cpd25; (c) the GSK3β/ Cpd51 (The black columns represent the total binding free energy, the red columns represent the non-polar energy (Δvdw + ΔSA) and the blue columns represent the polar energy (Δele + ΔGB); the binding mode of (d) GSK3β/Cpd23; (e) GSK3β/Cpd25; (f) GSK3β/Cpd51.
Fig. (4).
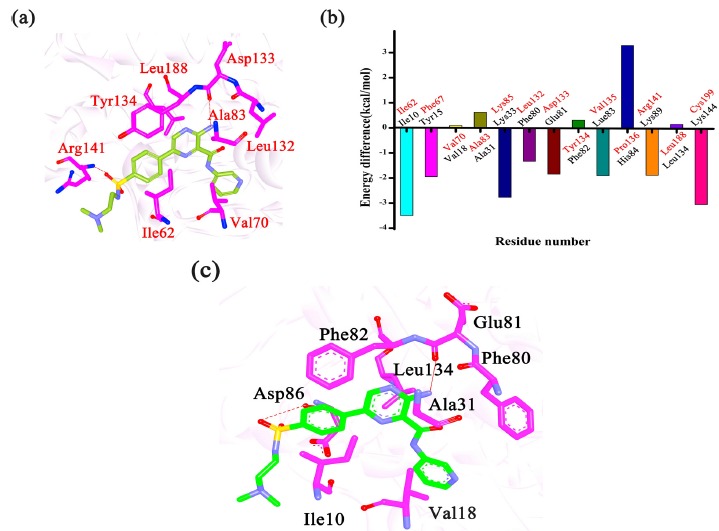
(a) The binding mode of GSK3β/Cpd23; (b) the negative value of (Δvdw + Δele) represents a favorable contribution for GSK3β and the positive value of (Δvdw + Δele) represents a favorable contribution for CDK2; (c) the binding mode of CDK2/Cpd23.
Compared to Cpd23, modifications at two sites were found in Cpd25, the ethylene diamine group at the 6-position (Fig. 1b) in Cpd23 was replaced by N-methylpiperazinyl-sulfonyl group, and the hydrogen atom at the 28-position in Cpd23 was replaced by an methylprrolidinyl group. These changes enhance the activity from 20 nM (Cpd23) to 0.220 nM (Cpd25). As illustrated in Table 3, the energy contribution of van der Waals interactions for Cpd25 is -57.400 kcal•mol-1 and that for Cpd23 is -47.190 kcal•mol-1, it shows that the van der Waals interactions are important for the inhibitors binding. Followed by Figs. (3a and b), it is easy to observe that Lys85 and Arg141 are significant for the interactions both Cpd23 and Cpd25. Meanwhile, the energy contribution of Lys85 for Cpd25 is -2.270 kcal•mol-1, which is more favorable than that of Cpd23 (-1.610 kcal•mol-1), the Arg141 works in a similar way. The difference in the contributions of Lys85 and Arg141 for Cpd23 and Cpd25 is mainly caused by the strong van der Waals interactions, which leads to a closer contact between the sulfonyl group of Cpd25 and Arg141 than that the corresponding Lys85 of Cpd23 (Fig. 3d). As displayed in Figs. (3a and b), both Cpd23 and Cpd25 formed favorable interactions with Tyr134. However, the energy contribution of Tyr134 in the 4ACC/Cpd23 complex (-1.870 kcal•mol-1) is lower than that in the 4ACG/Cpd25 complex (-2.590 kcal•mol-1). Tyr134 formed hydrophobic interaction with Cpd25, while that interaction lost in Cpd23 system. According to the previous molecular docking analysis, pyridine ring formed the key H-bond interactions with residue Lys85 in the GSK3β active site. Therefore, Lys85 is a critical residue for inhibitor binding to GSK3β.
Besides, Cpd51 also was chosen to compare with Cpd25. The difference of structure between Cpd25 and Cpd51 just lie in the groups at the 22-position (Fig. 1b). Cpd25 contained a 4-pyrrolidin-2-plpyridine group at 22-position while Cpd51 had a methyl propyl ether group (Table 1). However, Cpd25 showed better inhibitory activity (IC50 = 0.220 nM) than Cpd51 (IC50 = 22 nM). The reason for the difference mainly depends on the various contributions formed by several key residues, including Lys85, Tyr134 and Val135. The modification at the 22-position enhanced the inhibitors interaction with the residue Lys85. The energy difference of Val134 between Cpd25 and Cpd51 is 0.630 kcal•mol-1 (Fig. 3b and c), and it is primarily contributed from the differences between the van der Waals interactions (-2.450 kcal•mol-1 and -2.080 kcal•mol-1, respectively). As illustrated in Figs. (3c and d), the 2-Phenylpiperazine group in Cpd25 and Cpd51 was close to Val134 and therefore they both formed strong interactions with Val134. The interactions between the inhibitors and Tyr135 are similar to the above discussion. However, Val70 share more favorable contributions to the binding affinity of Cpd25 than that of Cpd51. This can also be explained by the position of the pyrrolidine of Cpd25 in Fig. (3e). Overall, we can draw the conclusion that a large group at the 22-position would enhance the ligand-protein interactions, which is consistent with 3D-QSAR result discussed above.
In addition, to explore the selectivity mechanism between GSK3β and CDK2, two complexes 4ACC and 4ACM, containing the same inhibitor (Cpd23) were investigated. Table 3 showed that predicted binding free energy for 4ACC/Cpd23 is weaker than that for 4ACM/ Cpd23, suggesting that Cpd23 formed stronger interactions with GSK3β than CDK2, which is consistent with the experimental data. To better understand the distinction in the binding affinity between 4ACC/Cpd23 and 4ACM/Cpd23, the data from the binding energy decomposition analysis also should be considered. According to Figs. (4a-c), the residues Ile62/Ile10, Val70/Val18, Ala83/Ala31, Leu132/Phe80, Tyr134/Phe82, Leu188/Leu134, share strong contributions to the interactions between GSK3β and CDK2. It is interesting to observe that all these important residues are hydrophobic, which all can form strong van der Waals interactions with the inhibitors. Among these residues, Ile62/Ile10 are more essential to determine the difference in the binding affinity of both two complexes. The van der Waals interaction between Cpd23 and Ile62 (-3.160 kcal•mol-1) is more favorable than that between Cpd23 and Ile10 (-2.390 kcal•mol-1). The enhanced van der Waals interactions between Ile62/Ile10 and Cpd23 are mainly caused by the change position of the 2-(dimethylaminoethyl)-ethylamino. Besides, the Cpd23 can form H-bonds with the Asp133 and Arg141 of GSK3β and the H-bonds also could be observed between Cpd23 and Glu81 and Asp86 of CDK2. But the H-bond formed by Asp133 of GSK3β (-1.500 kcal•mol-1) stronger than that of Glu81/CDK2 (-0.590 kcal•mol-1). Meanwhile, both of the polar and non-polar interactions between Cpd23 and Arg141 (-1.260 kcal•mol-1) are stronger than those between Cpd23 and Asp86 (-0.380 kcal•mol-1). Overall, Ile62/Ile10, Asp133/Glu81 and Arg141/Asp86 are more essential to determine the difference of the binding affinity of both complexes. In a word, Ile62, Asp133, Arg141 may be the key residues for GSK3β selectivity inhibition.
CONCLUSION
In this work, a computational analysis, integrating 3D-QSAR, molecular docking and molecular dynamics simulation was conducted to explore the specific binding mechanisms of GSK3β ATP competition inhibitors. The CoMFA model with high liner correlation R2Pred provides reliable predictive ability and the three-dimensional isopotential maps delicately revealed the structure-activity relationships. The results of molecular docking show that the introduction of the flexibility of GSK3β may significantly improve the accuracy of prediction and FD provides appropriate binding modes of the inhibitors. And then, MD simulations were performed to deeply understand the dynamic binding mode between GSK3β/ligand complexes and some key residues for improving the affinities to GSK3β were identified. At last, the inhibitor specificity between GSK3β and CDK2 is determined by the additive contributions of multiple amino acids, such as Ile62, Asp133 and Arg141. In conclusion, all the above results provide useful information to understand the mechanism of inhibitor binding and specificity and may provide useful information for the rational design of novel and selective GSK3β ATP competition inhibitors.
ACKNOWLEDGEMENTS
Declared none.
ETHICS APPROVAL AND CONSENT TO PARTICIPATE
Not applicable.
HUMAN AND ANIMAL RIGHTS
No Animals/Humans were used for studies that are the basis of this research.
CONSENT FOR PUBLICATION
Not applicable.
AVAILABILITY OF DATA AND MATERIALS
The data that support the findings of this study are available from the corresponding author, [Jingyu Zhu], upon reasonable request.
FUNDING
None.
CONFLICT OF INTEREST
The authors declare no conflict of interest, financial or otherwise.
SUPPLEMENTARY MATERIAL
Supplementary material is available on the publisher’s website along with the published article.
REFERENCES
- 1.Hu X.L., Guo C., Hou J.Q., Feng J.H., Zhang X.Q., Xiong F., Ye W.C., Wang H. Stereoisomers of Schisandrin B are potent ATP competitive GSK-3beta inhibitors with neuroprotective effects against Alzheimer’s disease: Stereochemistry and biological activity. ACS Chem. Neurosci. 2019;10(2):996–1007. doi: 10.1021/acschemneuro.8b00252. [DOI] [PubMed] [Google Scholar]
- 2.Frame S., Cohen P. GSK3 takes centre stage more than 20 years after its discovery. Biochem. J. 2001;359(Pt 1):1–16. doi: 10.1042/bj3590001. [DOI] [PMC free article] [PubMed] [Google Scholar]
- 3.Pandey M.K., DeGrado T.R. Glycogen synthase kinase-3 (GSK-3)-targeted therapy and imaging. Theranostics. 2016;6(4):571–593. doi: 10.7150/thno.14334. [DOI] [PMC free article] [PubMed] [Google Scholar]
- 4.Cohen P., Frame S. The renaissance of GSK3. Nat. Rev. Mol. Cell Biol. 2001;2(10):769–776. doi: 10.1038/35096075. [DOI] [PubMed] [Google Scholar]
- 5.Diehl J.A., Cheng M., Roussel M.F., Sherr C.J. Glycogen synthase kinase-3beta regulates cyclin D1 proteolysis and subcellular localization. Genes Dev. 1998;12(22):3499–3511. doi: 10.1101/gad.12.22.3499. [DOI] [PMC free article] [PubMed] [Google Scholar]
- 6.Zhang M., Zhang P., Liu Y., Zhou Y. GSK3 inhibitor AR-A014418 promotes osteogenic differentiation of human adipose-derived stem cells via ERK and mTORC2/Akt signaling pathway. Biochem. Biophys. Res. Commun. 2017;490(2):182–188. doi: 10.1016/j.bbrc.2017.06.018. [DOI] [PubMed] [Google Scholar]
- 7.Maqbool M., Hoda N. GSK3 inhibitors in the therapeutic development of diabetes, cancer and neurodegeneration: Past, present and future. Curr. Pharm. Des. 2017;23(29):4332–4350. doi: 10.2174/1381612823666170714141450. [DOI] [PubMed] [Google Scholar]
- 8.Abdul A.U.R.M., De Silva B., Gary R.K. The GSK3 kinase inhibitor lithium produces unexpected hyperphosphorylation of β-catenin, a GSK3 substrate, in human glioblastoma cells. Biol. Open. 2018;7(1):bio030874. doi: 10.1242/bio.030874. [DOI] [PMC free article] [PubMed] [Google Scholar]
- 9.Cohen P., Goedert M. GSK3 inhibitors: Development and therapeutic potential. Nat. Rev. Drug Discov. 2004;3(6):479–487. doi: 10.1038/nrd1415. [DOI] [PubMed] [Google Scholar]
- 10.Penas C., Mishra J.K., Wood S.D., Schürer S.C., Roush W.R., Ayad N.G. GSK3 inhibitors stabilize Wee1 and reduce cerebellar granule cell progenitor proliferation. Cell Cycle. 2015;14(3):417–424. doi: 10.4161/15384101.2014.974439. [DOI] [PMC free article] [PubMed] [Google Scholar]
- 11.Force T., Woodgett J.R. Unique and overlapping functions of GSK-3 isoforms in cell differentiation and proliferation and cardiovascular development. J. Biol. Chem. 2009;284(15):9643–9647. doi: 10.1074/jbc.R800077200. [DOI] [PMC free article] [PubMed] [Google Scholar]
- 12.Dey A., Hao S., Wosiski-Kuhn M., Stranahan A.M. Glucocorticoid-mediated activation of GSK3β promotes tau phosphorylation and impairs memory in type 2 diabetes. Neurobiol. Aging. 2017;57:75–83. doi: 10.1016/j.neurobiolaging.2017.05.010. [DOI] [PMC free article] [PubMed] [Google Scholar]
- 13.Swinney Z.T., Haubrich B.A., Xia S., Ramesha C., Gomez S.R., Guyett P., Mensa-Wilmot K., Swinney D.C. A four-point screening method for assessing molecular mechanism of action (MMOA) identifies tideglusib as a time-dependent inhibitor of trypanosoma brucei GSK3beta. PLoS Negl. Trop. Dis. 2016;10(3):e0004506. doi: 10.1371/journal.pntd.0004506. [DOI] [PMC free article] [PubMed] [Google Scholar]
- 14.Saura C., Roda D., Roselló S., Oliveira M., Macarulla T., Pérez-Fidalgo J.A., Morales-Barrera R., Sanchis-García J.M., Musib L., Budha N., Zhu J., Nannini M., Chan W.Y., Sanabria Bohórquez S.M., Meng R.D., Lin K., Yan Y., Patel P., Baselga J., Tabernero J., Cervantes A. A first-in-human phase I study of the ATP-competitive AKT inhibitor ipatasertib demonstrates robust and safe targeting of AKT in patients with solid tumors. Cancer Discov. 2017;7(1):102–113. doi: 10.1158/2159-8290.CD-16-0512. [DOI] [PMC free article] [PubMed] [Google Scholar]
- 15.Wagman A.S., Johnson K.W., Bussiere D.E. Discovery and development of GSK3 inhibitors for the treatment of type 2 diabetes. Curr. Pharm. Des. 2004;10(10):1105–1137. doi: 10.2174/1381612043452668. [DOI] [PubMed] [Google Scholar]
- 16.Martinez A., Castro A., Dorronsoro I., Alonso M. Glycogen synthase kinase 3 (GSK-3) inhibitors as new promising drugs for diabetes, neurodegeneration, cancer, and inflammation. Med. Res. Rev. 2002;22(4):373–384. doi: 10.1002/med.10011. [DOI] [PubMed] [Google Scholar]
- 17.Zhao S., Zhu J., Xu L., Jin J. Theoretical studies on the selective mechanisms of GSK3β and CDK2 by molecular dynamics simulations and free energy calculations. Chem. Biol. Drug Des. 2017;89(6):846–855. doi: 10.1111/cbdd.12907. [DOI] [PubMed] [Google Scholar]
- 18.Arfeen M., Bharatam P.V. Design of glycogen synthase kinase-3 inhibitors: An overview on recent advancements. Curr. Pharm. Des. 2013;19(26):4755–4775. doi: 10.2174/1381612811319260007. [DOI] [PubMed] [Google Scholar]
- 19.García I., Fall Y., Gómez G. QSAR, docking, and CoMFA studies of GSK3 inhibitors. Curr. Pharm. Des. 2010;16(24):2666–2675. doi: 10.2174/138161210792389225. [DOI] [PubMed] [Google Scholar]
- 20.Patil R., Sawant S. Molecular dynamics guided receptor independent 4D QSAR studies of substituted coumarins as anticancer agents. Curr Comput Aided Drug Des. 2015;11(1):39–50. doi: 10.2174/1573409911666150617113933. [DOI] [PubMed] [Google Scholar]
- 21.Yang Y., Qin J., Liu H., Yao X. Molecular dynamics simulation, free energy calculation and structure-based 3D-QSAR studies of B-RAF kinase inhibitors. J. Chem. Inf. Model. 2011;51(3):680–692. doi: 10.1021/ci100427j. [DOI] [PubMed] [Google Scholar]
- 22.Yu H., Fang Y., Lu X., Liu Y., Zhang H. Combined 3D-QSAR, molecular docking, molecular dynamics simulation, and binding free energy calculation studies on the 5-hydroxy-2H-pyridazin-3-one derivatives as HCV NS5B polymerase inhibitors. Chem. Biol. Drug Des. 2014;83(1):89–105. doi: 10.1111/cbdd.12203. [DOI] [PubMed] [Google Scholar]
- 23.Balasubramanian P.K., Balupuri A., Kang H.Y., Cho S.J. Receptor-guided 3D-QSAR studies, molecular dynamics simulation and free energy calculations of Btk kinase inhibitors. BMC Syst. Biol. 2017;11(Suppl. 2):6. doi: 10.1186/s12918-017-0385-5. [DOI] [PMC free article] [PubMed] [Google Scholar]
- 24.Chaudhari H.K., Pahelkar A.R. 2018.
- 25.Fu G., Liu S., Nan X., Dale O.R., Zhao Z., Chen Y., Wilkins D.E., Manly S.P., Cutler S.J., Doerksen R.J. Quantitative structure-activity relationship analysis and a combined ligand-based/structure-based virtual screening study for Glycogen Synthase Kinase-3. Mol. Inform. 2014;33(9):627–640. doi: 10.1002/minf.201400045. [DOI] [PubMed] [Google Scholar]
- 26.Akhtar M., Bharatam P.V. 3D-QSAR and molecular docking studies on 3-anilino-4-arylmaleimide derivatives as glycogen synthase kinase-3β inhibitors. Chem. Biol. Drug Des. 2012;79(4):560–571. doi: 10.1111/j.1747-0285.2011.01291.x. [DOI] [PubMed] [Google Scholar]
- 27.Quesada-Romero L., Caballero J. Docking and quantitative structure-activity relationship of oxadiazole derivates as inhibitors of GSK3β. Mol. Divers. 2014;18(1):149–159. doi: 10.1007/s11030-013-9483-5. [DOI] [PubMed] [Google Scholar]
- 28.Berg S., Bergh M., Hellberg S., Högdin K., Lo-Alfredsson Y., Söderman P., von Berg S., Weigelt T., Ormö M., Xue Y., Tucker J., Neelissen J., Jerning E., Nilsson Y., Bhat R. Discovery of novel potent and highly selective glycogen synthase kinase-3β (GSK3β) inhibitors for Alzheimer’s disease: design, synthesis, and characterization of pyrazines. J. Med. Chem. 2012;55(21):9107–9119. doi: 10.1021/jm201724m. [DOI] [PubMed] [Google Scholar]
- 29.Case D.A., Cheatham T.E., III, Darden T., Gohlke H., Luo R., Merz K.M., Jr, Onufriev A., Simmerling C., Wang B., Woods R.J. The Amber biomolecular simulation programs. J. Comput. Chem. 2005;26(16):1668–1688. doi: 10.1002/jcc.20290. [DOI] [PMC free article] [PubMed] [Google Scholar]
- 30.Wang J., Wolf R.M., Caldwell J.W., Kollman P.A., Case D.A. Development and testing of a general amber force field. J. Comput. Chem. 2004;25(9):1157–1174. doi: 10.1002/jcc.20035. [DOI] [PubMed] [Google Scholar]
- 31.Duan Y., Wu C., Chowdhury S., Lee M.C., Xiong G., Zhang W., Yang R., Cieplak P., Luo R., Lee T., Caldwell J., Wang J., Kollman P. A point-charge force field for molecular mechanics simulations of proteins based on condensed-phase quantum mechanical calculations. J. Comput. Chem. 2003;24(16):1999–2012. doi: 10.1002/jcc.10349. [DOI] [PubMed] [Google Scholar]
- 32.Pedersen M., Klarlund M., Jacobsen S., Svendsen A.J., Frisch M. Validity of rheumatoid arthritis diagnoses in the Danish National Patient Registry. Eur. J. Epidemiol. 2004;19(12):1097–1103. doi: 10.1007/s10654-004-1025-0. [DOI] [PubMed] [Google Scholar]
- 33.Pan P., Yu H., Liu Q., Kong X., Chen H., Chen J., Liu Q., Li D., Kang Y., Sun H., Zhou W., Tian S., Cui S., Zhu F., Li Y., Huang Y., Hou T. Combating drug-resistant mutants of anaplastic lymphoma kinase with potent and selective type-I(1/2) inhibitors by stabilizing unique DFG-shifted loop conformation. ACS Cent. Sci. 2017;3(11):1208–1220. doi: 10.1021/acscentsci.7b00419. [DOI] [PMC free article] [PubMed] [Google Scholar]
- 34.Sun H., Duan L., Chen F., Liu H., Wang Z., Pan P., Zhu F., Zhang J.Z.H., Hou T. Assessing the performance of MM/PBSA and MM/GBSA methods. 7. Entropy effects on the performance of end-point binding free energy calculation approaches. Phys. Chem. Chem. Phys. 2018;20(21):14450–14460. doi: 10.1039/C7CP07623A. [DOI] [PubMed] [Google Scholar]
- 35.Zhu J., Li K., Xu L., Jin J. Insight into the selective mechanism of phosphoinositide 3-kinase gamma with benzothiazole and thiazolopiperidine gamma-specific inhibitors by in silico approaches. Chem. Biol. Drug Des. 2018 doi: 10.1111/cbdd.13469. [DOI] [PubMed] [Google Scholar]
- 36.Hou T., Wang J., Li Y., Wang W. Assessing the performance of the MM/PBSA and MM/GBSA methods. 1. The accuracy of binding free energy calculations based on molecular dynamics simulations. J. Chem. Inf. Model. 2011;51(1):69–82. doi: 10.1021/ci100275a. [DOI] [PMC free article] [PubMed] [Google Scholar]
- 37.Gohlke H., Kiel C., Case D.A. Insights into protein-protein binding by binding free energy calculation and free energy decomposition for the Ras-Raf and Ras-RalGDS complexes. J. Mol. Biol. 2003;330(4):891–913. doi: 10.1016/S0022-2836(03)00610-7. [DOI] [PubMed] [Google Scholar]
- 38.Hou T., Li Y., Wang W. Prediction of peptides binding to the PKA RIIalpha subunit using a hierarchical strategy. Bioinformatics. 2011;27(13):1814–1821. doi: 10.1093/bioinformatics/btr294. [DOI] [PMC free article] [PubMed] [Google Scholar]
- 39.Sun H., Li Y., Shen M., Tian S., Xu L., Pan P., Guan Y., Hou T. Assessing the performance of MM/PBSA and MM/GBSA methods. 5. Improved docking performance using high solute dielectric constant MM/GBSA and MM/PBSA rescoring. Phys. Chem. Chem. Phys. 2014;16(40):22035–22045. doi: 10.1039/C4CP03179B. [DOI] [PubMed] [Google Scholar]
- 40.Chen F., Sun H., Wang J., Zhu F., Liu H., Wang Z., Lei T., Li Y., Hou T. Assessing the performance of MM/PBSA and MM/GBSA methods. Predicting binding free energies and poses of protein-RNA complexes. RNA. 2018;24(9):1183–1194. doi: 10.1261/rna.065896.118. [DOI] [PMC free article] [PubMed] [Google Scholar]
- 41.Zhang C., Hou T., Feng Z., Li Y. Structure-based development of antagonists for chemokine receptor CXCR4. Curr Comput Aided Drug Des. 2013;9(1):60–75. doi: 10.2174/1573409911309010006. [DOI] [PubMed] [Google Scholar]
- 42.Xu L., Kong R., Zhu J., Sun H., Chang S. Unraveling the conformational determinants of LARP7 and 7SK small nuclear RNA by theoretical approaches. Mol. Biosyst. 2016;12(8):2613–2621. doi: 10.1039/C6MB00252H. [DOI] [PubMed] [Google Scholar]
- 43.Liu N., Zhou W., Guo Y., Wang J., Fu W., Sun H., Li D., Duan M., Hou T. Molecular dynamics simulations revealed the regulation of ligands to the interactions between androgen receptor and its coactivator. J. Chem. Inf. Model. 2018;58(8):1652–1661. doi: 10.1021/acs.jcim.8b00283. [DOI] [PMC free article] [PubMed] [Google Scholar]
- 44.Shen M., Zhou S., Li Y., Li D., Hou T. Theoretical study on the interaction of pyrrolopyrimidine derivatives as LIMK2 inhibitors: Insight into structure-based inhibitor design. Mol. Biosyst. 2013;9(10):2435–2446. doi: 10.1039/c3mb70168a. [DOI] [PubMed] [Google Scholar]
- 45.Shen M., Zhou S., Li Y., Pan P., Zhang L., Hou T. Discovery and optimization of triazine derivatives as ROCK1 inhibitors: Molecular docking, molecular dynamics simulations and free energy calculations. Mol. Biosyst. 2013;9(3):361–374. doi: 10.1039/c2mb25408e. [DOI] [PubMed] [Google Scholar]
- 46.Zhu J., Li Y., Yu H., Zhang L., Mao X., Hou T. Insight into the structural requirements of narlaprevir-type inhibitors of NS3/NS4A protease based on HQSAR and molecular field analyses. Comb. Chem. High Throughput Screen. 2012;15(6):439–450. doi: 10.2174/138620712800563918. [DOI] [PubMed] [Google Scholar]
- 47.Zhu J., Pan P., Li Y., Wang M., Li D., Cao B., Mao X., Hou T. Theoretical studies on beta and delta isoform-specific binding mechanisms of phosphoinositide 3-kinase inhibitors. Mol. Biosyst. 2014;10(3):454–466. doi: 10.1039/C3MB70314B. [DOI] [PubMed] [Google Scholar]
- 48.Tian S., Sun H., Pan P., Li D., Zhen X., Li Y., Hou T. Assessing an ensemble docking-based virtual screening strategy for kinase targets by considering protein flexibility. J. Chem. Inf. Model. 2014;54(10):2664–2679. doi: 10.1021/ci500414b. [DOI] [PubMed] [Google Scholar]
- 49.Tian S., Sun H., Li Y., Pan P., Li D., Hou T. Development and evaluation of an integrated virtual screening strategy by combining molecular docking and pharmacophore searching based on multiple protein structures. J. Chem. Inf. Model. 2013;53(10):2743–2756. doi: 10.1021/ci400382r. [DOI] [PubMed] [Google Scholar]
- 50.AbdulHameed. M.D.; Hamza, A.; Liu, J.; Zhan, C.G. Combined 3D-QSAR modeling and molecular docking study on indolinone derivatives as inhibitors of 3-phosphoinositide-dependent protein kinase-1. J. Chem. Inf. Model. 2008;48(9):1760–1772. doi: 10.1021/ci800147v. [DOI] [PubMed] [Google Scholar]
Associated Data
This section collects any data citations, data availability statements, or supplementary materials included in this article.
Supplementary Materials
Supplementary material is available on the publisher’s website along with the published article.
Data Availability Statement
The data that support the findings of this study are available from the corresponding author, [Jingyu Zhu], upon reasonable request.