

Abstract
Background
Our previous infodemiological study was performed by manually mining health-effect data associated with electronic cigarettes (ECs) from online forums. Manual mining is time consuming and limits the number of posts that can be retrieved.
Objective
Our goal in this study was to automatically extract and analyze a large number (>41,000) of online forum posts related to the health effects associated with EC use between 2008 and 2015.
Methods
Data were annotated with medical concepts from the Unified Medical Language System using a modified version of the MetaMap tool. Of over 1.4 million posts, 41,216 were used to analyze symptoms (undiagnosed conditions) and disorders (physician-diagnosed terminology) associated with EC use. For each post, sentiment (positive, negative, and neutral) was also assigned.
Results
Symptom and disorder data were categorized into 12 organ systems or anatomical regions. Most posts on symptoms and disorders contained negative sentiment, and affected systems were similar across all years. Health effects were reported most often in the neurological, mouth and throat, and respiratory systems. The most frequently reported symptoms and disorders were headache (n=939), coughing (n=852), malaise (n=468), asthma (n=916), dehydration (n=803), and pharyngitis (n=565). In addition, users often reported linked symptoms (eg, coughing and headache).
Conclusions
Online forums are a valuable repository of data that can be used to identify positive and negative health effects associated with EC use. By automating extraction of online information, we obtained more data than in our prior study, identified new symptoms and disorders associated with EC use, determined which systems are most frequently adversely affected, identified specific symptoms and disorders most commonly reported, and tracked health effects over 7 years.
Keywords: electronic cigarettes; vaping epidemic; vaping-associated pulmonary illness; e-cigarettes; electronic nicotine delivery devices; health effects; nicotine; symptoms; disorders; pulmonary disease; pneumonia; headaches; content analysis; text classification; e-cigarette, or vaping, product use associated lung injury
Introduction
Background
At the time of their introduction 10 years ago, there was little information on the health effects associated with electronic cigarettes (ECs); nevertheless, they were often considered safer than conventional cigarettes because they do not burn tobacco and therefore produce aerosols with fewer chemicals. Since their introduction, a wide range of studies concerning the health effects associated with ECs have been conducted using various approaches that include online informatics and survey studies [1-6], short-term physiological assessments of EC use on human health [7,8], and in vitro and in vivo cytotoxicity studies [9-15]. Although these studies are limited mainly to acute exposures, they often suggest that EC use is not harm free [16]. Summaries of the health effect data and case report information on ECs can be found in 2 recent reviews [17,18].
Infodemiological approaches, which mine data from the internet and social media, have yielded new information such as EC topography and the effects of EC use on human health [1,19-22]. For example, in a previous study, we mined internet data on EC puffing topography and showed that puff duration is about twice as long for EC users than conventional smokers [22]. In addition, topography is highly variable among EC users, who generally intake much larger volumes of aerosol than cigarette smokers [23]. In our prior infodemiological study, we mined information manually from major EC online health forums and identified numerous negative and some positive health effects that users attributed to ECs [1]. This was a useful approach; however, manual mining methods are labor intensive, limit the number of posts that can be reasonably extracted and analyzed, and are not practical for examining large amounts of data over time.
Objectives
The objective of this study was to use automated computer methods to mine an online forum and extract a large set of posts dealing with the effects of EC use on human health. These data were analyzed to identify the symptoms (undiagnosed conditions) and disorders (physician-diagnosed terminology) associated with EC use. Data were analyzed over a 7-year period, and the sentiment in each post (positive, negative, and neutral) was determined.
Methods
Datasets
We collected data posted between January 2008 and July 2015 on a large EC discussion forum. Data from 2008 and 2015 were each collected for approximately 6 months. We analyzed the layout of the website and built a crawler in Java using the Java library jsoup [24], which is designed to extract and parse information from HTML pages. The posts were collected from 7 subforums. The total number of discussion threads was 2330 and the total number of posts was 1,450,896. As the primary goal of this study was to evaluate the health effects produced by ECs, we focused on those posts that belonged to the 7 health subforums, which contained 41,216 posts. We emphasize that all collected data are publicly available, including discussion threads and users’ information. Figure 1 shows the overall pipeline used for our analysis.
Figure 1.
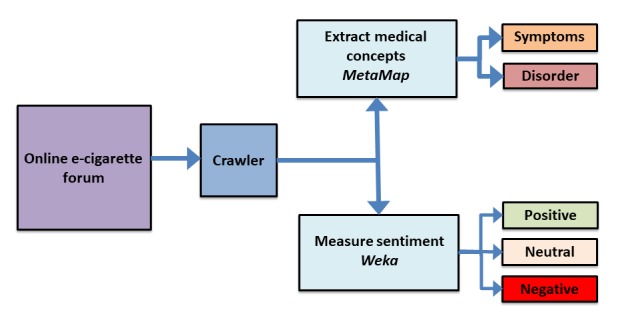
Online forum data pipeline showing processing, post sorting, and classification workflow.
Medical Concepts
We used a modified version of the MetaMap tool [25] to annotate each post with a set of medical concepts from the Unified Medical Language System (UMLS). UMLS is a repository of a large number of biomedical controlled vocabularies [26]. In UMLS, there are 15 high-level semantic groups, which were created to help reduce complexity by grouping the semantic types [27]. In this work, we analyzed 2 semantic types, sign or symptoms and disorder or syndrome, which belong to the Symptoms and Disorders semantic groups. Each concept in UMLS can be assigned to multiple semantic types, but only to 1 semantic group [27]. As MetaMap was built to annotate the natural language text in biomedical academic publications, it is not very effective out-of-the-box on social media posts, as it successfully maps the medical terms most of the time, and not the descriptive or nonmedical terms [28]. To improve the tool’s mapping efficiency, we manually examined and removed misclassified UMLS concepts generated by MetaMap by performing the following steps:
For the 2 semantic types (symptoms and disorders), we ordered the concepts by their frequencies.
We analyzed the different terms mapped to each concept.
-
We removed the misclassified concepts from our results. Examples of misclassified concepts include:
mod, which refers to vape mods, was mapped to Type 2 diabetes mellitus (C0011860)
ect, which is a type of vape mod, was mapped to Benign Rolandic epilepsy (C2363129)
pic was mapped to Punctate inner choroidopathy (C0730321)
For each semantic type, we reported the most frequent disorders and symptoms overall and by year.
Sentiment
To measure the positive and negative health effects produced by EC use, we used a supervised learning classifier (Random Forest) on a set of manually labeled posts to predict the sentiment for unseen posts. We randomly selected 1080 posts, which were labeled independently by 3 of the authors as the following:
Negative: if a post clearly contained a health effect or unpleasant experience or complaint that co-occurred with the use of EC.
Positive: if a post clearly mentioned a health improvement or a recovery from previous health effects when switching from smoking analogs to EC.
Neutral: if a post did not express any sentiment.
Our interpretation of positive and negative is different from typical sentiment classifications, and mainly focuses on health-related effects. We first asked the labelers to categorize 400 posts, and then we measured the intercoder reliability between the labelers. Using ReCal [29], an online tool to calculate the reliability for the masses, the agreement was 80.53% using the Average Pairwise Percent Agreement measure. Owing to the high agreement, the rest of the posts were split evenly among the labelers to categorize. Table 1 shows the class distribution of our sample data with examples for each class; 44.7% (179/400) of posts were labeled as negative, 38.5% (154/400) as neutral, and 16.7% (67/400) as positive.
Table 1.
Sample data summary.
| Class | Posts, n | Example |
| Positive | 180 | “I’ve only been vaping for 2 1/2 weeks, but I’ve already noticed a big difference in my lungs (after 20+ years of smoking). For example, I had a chest cold when I started, and in the past, once a cold moved into my chest it took a couple of months to get rid of it. ...E-cigs are pretty darn amazing, IMHO.” [sic] |
| Neutral | 416 | “I dont [sic] think there are any tests since flavoring were not meant to be inhaled [sic]. I think we are taking our chances untill [sic] some evidence comes out...” |
| Negative | 484 | “Hi Everyone, I have been using e-cigarrette [sic] for the past 2 months and very disappointed [sic] that I have to stop, reason being my teeth, gums are sensitive and my tooth cracked yesterday, I have to have a crown fitted.8-o [sic]. I think that the nicotine is seriously not good for the mouth. My husband and work collegue [sic] have also reported sore gums, little sores in the mouth…” |
Using Weka machine-learning toolkit v. 3.8.1 [30], we first filtered our sample data after many experiments using StringToWordVector class filter, which filters strings into N-grams using WordTokenizer class, with the following settings: (1) convert all words to lower case, (2) remove stop words, (3) stem words using Weka built-in stemmer, (4) keep only terms that appear at least twice, and (5) retain unigram, bigram, and trigram. We then split the sample data as follows: (1) 962 posts for the training test and (2) 118 posts for the test set. We then trained our data using the Random Forest classifier; however, the classifier’s initial accuracy was not satisfactory.
To improve the classifier’s accuracy, we needed to address a well-known issue in our sample data, which is the imbalanced class distribution [31]. The Positive class, as seen in Table 1, only covers 16.7% (67/400) of the data, whereas the Neutral class covers 38.50% (154/400) and the Negative class covers 44.7% (179/400). Thus, we oversampled the Positive class by duplicating the posts which were labeled Positive in the training set only. Table 2 shows the new class distribution for the training set, namely Training (extended). Another approach we used to improve the accuracy is annotating all the posts in the sample data with the ancestors of the medical concepts mentioned in the posts. For example, if pneumonia is mentioned in a post, then we append with Disorder of lung.
Table 2.
Training data summary (N=400).
| Class | Training, n (%) | Training (extended), n (%) |
| Positive | 67 (16.75) | 112 (28.0) |
| Neutral | 154 (38.50) | 136 (34.0) |
| Negative | 179 (44.75) | 152 (38.0) |
After using the new training set, the classifier’s accuracy increased from 66.95% to 75.42%. Table 3 reports for each class 3 different measures, including precision, recall, and F-measure. As seen in the table, the classifier is most accurate on the Negative class (F-measure=0.79), followed by Positive and Neutral classes.
Table 3.
Test data classification accuracy (N=118).
| Class | Precision | Recall | F-measure | Posts, n |
| Positive | 0.73 | 0.72 | 0.74 | 21 |
| Neutral | 0.67 | 0.77 | 0.71 | 39 |
| Negative | 0.84 | 0.74 | 0.79 | 58 |
| Average | 0.76 | 0.75 | 0.76 | 118 |
Data Categorization and Analysis
All health-related effects (symptoms and disorders) data reported by EC users in posts were collected iteratively and sorted into Microsoft Excel spreadsheets. The symptoms and disorders were further grouped according to the organ system and anatomical region, which we defined as systems previously [1]. When a symptom could have been associated with more than 1 system, the health effect was assigned to the system for which it had the strongest fit (eg, improved sense of taste was assigned to sensory but could have been mouth/throat). Frequency distributions for the overall grouped data in each system for symptoms and disorders were plotted using GraphPad Prism (GraphPad, San Diego). In addition, the sentiment for each post was grouped according to their positive, neutral, and negative sentiment as described in the Methods section.
Results
Overall Frequency of Reported Symptoms and Disorders Classified by System or Anatomical Region
The 41,216 posts we collected spanned the years from 2008 to 2015 (2008 and 2015 were half years). We analyzed the frequency of reports for various symptoms and disorders by consolidating the reported health effects into structural or physiological systems (eg, sore throat was classified into mouth and throat; Figure 2). The 5 systems that had the most reports for symptoms were neurological (n=3623), respiratory (n=1995), digestive (n=1637), mouth and throat (n=1390), and integumentary (n=853; Figure 2). The top 5 systems for disorders were respiratory (n=2972), mouth and throat (n=1986), neurological (n=1143), integumentary (n=1123), and immune (n=739; Figure 2). For both symptoms and disorders, a majority of the posts were associated with negative sentiment across all systems (Figure 2).
Figure 2.
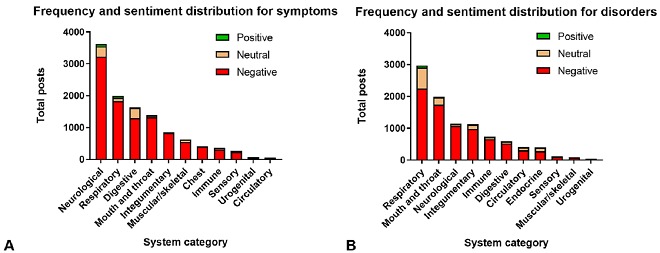
Frequency distribution of reported symptom (A) and disorder (B) posts grouped into their systems or anatomical regions. The frequency of positive, neutral, and negative posts is shown for symptoms (A) and for disorders (B).
Symptom and Disorder Frequency and Sentiment Distribution Over Time
After examining overall frequency distribution for all posts, we grouped the posts according to their years for analysis in their symptom or disorder categories. Across all years for both symptoms and disorders, we found the frequency distribution of reports per year. In addition, the posts for symptoms and disorders were categorized according to sentiment (positive, negative, and neutral), and their frequency per year was summarized in stacked bar graphs for each year (Figure 3).
Figure 3.
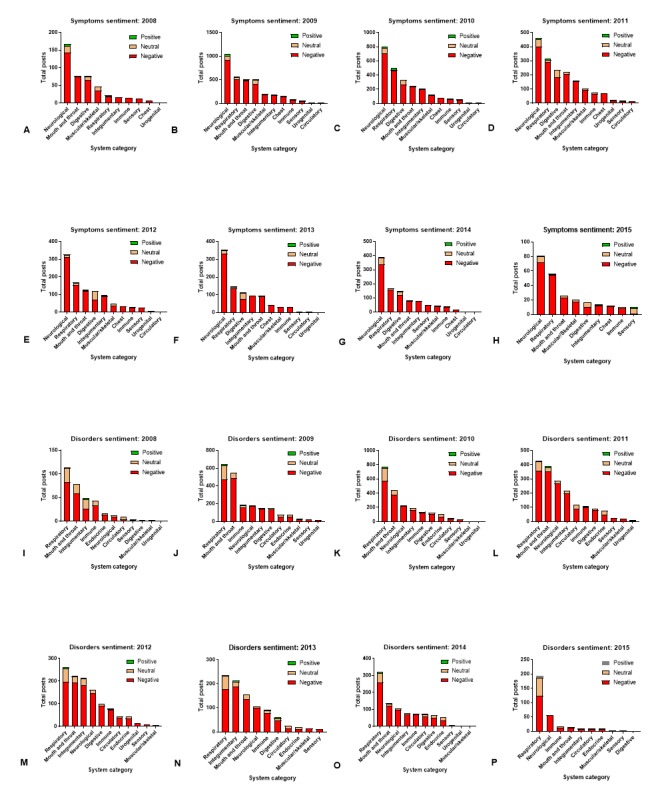
The frequency distribution of positive, neutral, and negative sentiment was assigned for reported symptoms (A-H) and disorders (I-P).
For the symptoms, the posts with the most reports were consistently found in the neurological, respiratory, digestive, integumentary, and mouth and throat systems. For all years except 2008, the neurological and respiratory systems were the top 2 systems. The digestive, integumentary, and mouth and throat alternated in some years, but were generally in the top 5 systems with the most posts in each of the years.
Similarly, the posts containing disorders associated with EC use had similar results for their top 5 system categories across the 7 years of reporting. The 2 top systems reported between 2008 and 2012 were the respiratory and mouth/throat. Alternating in the top 5 disorders were the integumentary, neurological, and immune systems.
Negative sentiment was associated with most symptoms and disorders in each system or anatomical region (Figure 3), with some increases reported in positive health effects in 2015 for the disorders (Figure 3). It should also be noted that we only have partial reporting for 2015 because data collection was terminated by the EC forum.
Specific Symptoms and Disorders in Systems With the Most Reports
Heat maps were made by plotting the frequency with which individual symptoms/disorders occurred for all 41,216 posts (Figures 4 and 5; Multimedia Appendices 1 and 2). Symptoms with fewer than 2 posts are listed in Multimedia Appendix 3. The total number of negative and positive posts for each symptom or disorder is shown on a log scale ranging from high (red) to low (blue). White represents a zero-post frequency. Numerous negative symptoms were reported for each system. Typically, about 16.52% (6807/41,216) of the symptoms were reported frequently (red), while the majority often occurred in fewer than 100 posts (blue to purple). In the neurological system, the most common symptoms included: headaches (n=939), fatigue/tired/malaise (n=468), nausea (n=290), dizziness (n=183), and lightheadedness (n=113; Figure 4). In the respiratory system, the negative effects included: coughing (n=852), wheezing (n=298), dyspnea (n=235), and excessively deep breathing (n=112). The most reported symptoms in the digestive system were: heartburn (n=327), cramping (n=303), flatus (n=176), and constipation (n=113). In the mouth/throat and integumentary systems, common symptoms were: pain in throat (n=643), harsh voice quality (n=175), pharyngeal dryness (n=147), itching skin (n=565), and dry skin (n=121; Figure 4). Other commonly reported symptoms involved aching and chest pains as well as immune symptoms related to the cold and flu.
Figure 4.
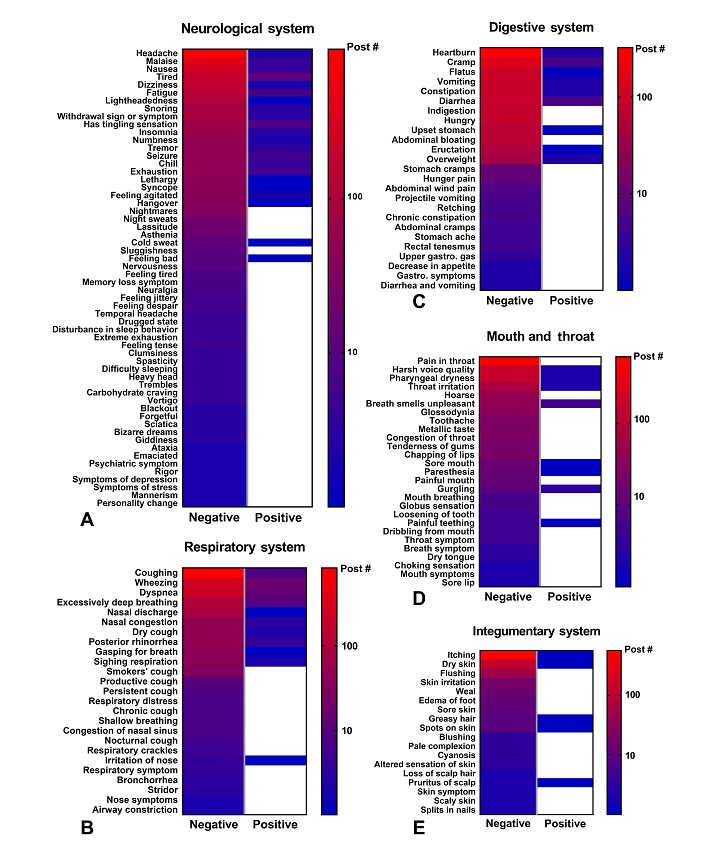
Heat map of specific symptoms reported in the neurological, respiratory, digestive, mouth and throat, and integumentary systems. The total number of posts for each symptom is shown on a log scale ranging from high (red) to low (blue).
Figure 5.
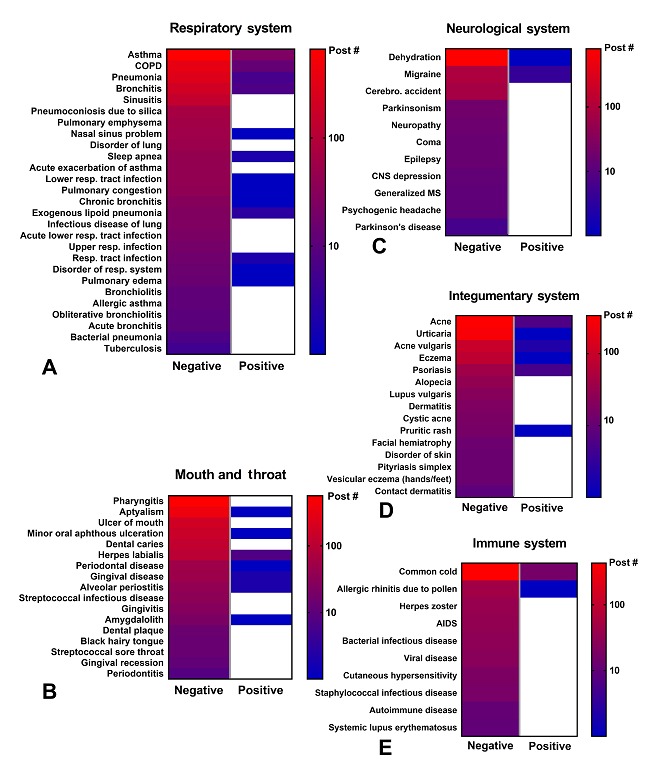
Heat map of specific disorders reported in the respiratory, mouth and throat, neurological, integumentary, and immune systems. The total number of posts for each disorder is shown on a log scale ranging from high (red) to low (blue).
Although positive symptoms were not frequently reported in this online forum, those reports that were posted most often dealt with improvements in the neurological (n=77), respiratory (n=60), digestive (n=19), and mouth and throat (n=18) systems (Figure 4). In the neurological system, these include improvement in tiredness (n=12) and insomnia (n=8). For respiratory system, these symptoms included improvements in wheezing (n=17), dyspnea (n=14), and coughing (n=8). In the digestive and mouth and throat systems, improvements were found in cramp (n=5) and halitosis (n=5). Other systems and anatomical regions had fewer than 10 total positive reports.
For each system/anatomical region, there were 1 to 3 top disorders. In the respiratory system, the most common disorders were asthma (n=916), chronic obstructive pulmonary disorder (COPD; n=471), pneumonia (n=367), and bronchitis (n=232; Figure 5). In mouth and throat, the most common disorders were pharyngitis (n=565), aptyalism (n=377), and ulcer of mouth (n=207). The most reported disorders in the neurological system were dehydration (n=403) and migraine (n=103). Most disorders were reported in the respiratory, mouth and throat, neurological, integumentary, and immune systems (Figure 5), whereas the remaining systems had fewer reported disorders (Multimedia Appendix 2).
To compare the frequency with which different symptoms/disorders appeared across different systems, frequency distribution graphs were created (Figures 6 and 7). Graphs show only those symptoms/disorders with over 100 posts (Figures 6 and 7). These data were sorted by negative sentiment as negative effects were most commonly reported and were of most interest. In total, 25 symptoms and 22 disorders had over 100 posts. The 5 top symptoms in the 41,216 posts were: headache, coughing, pain in throat, itching, and malaise (Figure 6). The top 5 disorders in the dataset were dehydration, asthma, pharyngitis, common cold, and aptyalism (Figure 7). These symptoms and disorders are the most commonly reported conditions in our dataset.
Figure 6.
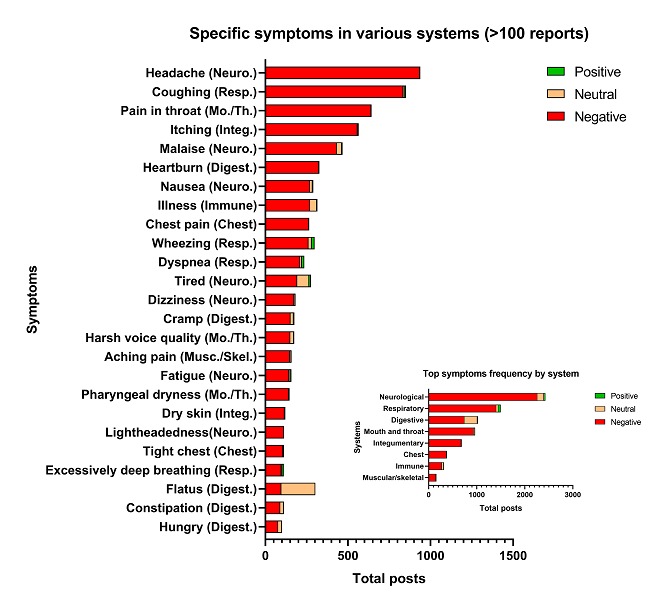
Frequency distribution of specific symptoms with over 100 posts and frequency distribution of their systems or anatomical regions (inset). Digest.: digestive; Integ.: integumentary; Mo./Th.: mouth and throat; Musc./Skel.: muscular/skeletal; Neuro.: neurological; Resp.: respiratory.
Figure 7.
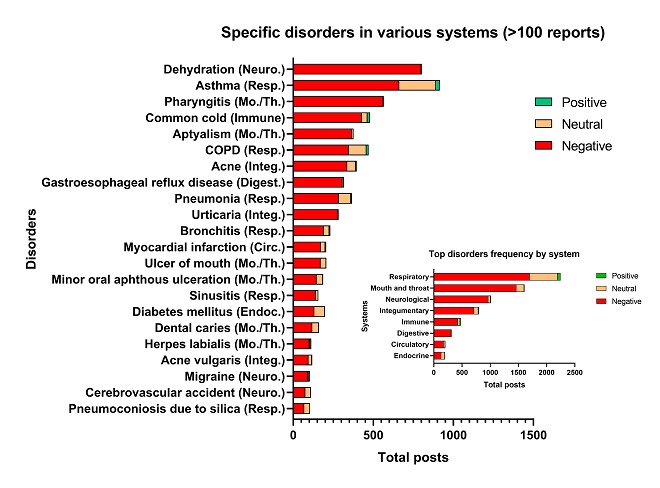
Frequency distribution of specific disorders with over 100 posts and frequency distribution of their systems or anatomical regions (inset). Neuro.: neurological; Resp.: respiratory; Mo./Th.: mouth and throat; Integ.: integumentary; Digest.: digestive; Circ.: circulatory; Endoc.: endocrine.
Identification of Frequently Reported Paired Symptoms
A total of 46 paired symptoms were frequently reported (Figure 8; Multimedia Appendix 4). Those with over 30 reports included a combination of neurological-neurological symptoms (eg, nausea and headache), respiratory-respiratory symptoms (eg, wheezing and coughing), and/or neurological-respiratory-mouth and throat symptoms (eg, pain in throat and headache; coughing and headache). The results in the top symptom pairings reflect the abundance of symptoms reported in their respective categories. As for those pairings occurring in less than 30 posts, various combinations of neurological, respiratory, integumentary, and digestive related symptoms.
Figure 8.
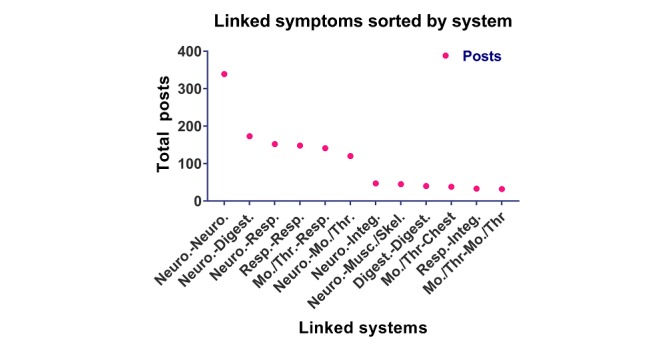
Graph showing frequency with which symptoms in various systems were linked. Digest.: digestive; Integ.: integumentary; Mo./Th.: mouth and throat; Musc./Skel.: muscular/skeletal; Neuro.: neurological; Resp.: respiratory.
Discussion
Principal Findings
The internet is a dynamic resource containing information that can be mined to learn about the health effects associated with EC use. In our previous study, we manually mined 632 posts from 3 online EC forums to identify both positive and negative health effects reported by EC users [1]. Manual mining of such information is time consuming, labor intense, and limited by the number of posts that can be realistically evaluated. To take additional advantage of the internet as a repository of EC-related health information, we developed an automated method that was used to extract over 1 million posts from an EC forum. These posts were then filtered to yield over 41,000 health-related posts for detailed analysis. By automating the extraction process, we collected 100 times more posts for analysis and tracked responses over 7 years, an option that would be too time consuming to perform manually. The data showed a variety of positive and negative symptoms/disorders, demonstrating that the internet is a valuable resource for acquiring new data related to EC usage and their associated health effects.
The results from this study are in overall good agreement with our prior publication [1]. In both studies, the neurological and respiratory systems were most often reported to have adverse effects associated with EC use. Both studies reported similar positive and negative health effects in various systems, and within all systems, a small number of self-reported symptoms and disorders occurred at high frequency (Figures 6 and 7). However, with the power of automated mining, we were also able to (1) identify numerous symptoms and disorders, many of which were not previously reported, along with their frequencies; (2) report new data in the disorders category for each system; (3) identify those symptoms/disorders that users have reported most frequently which will be of interest to health care providers treating patients using EC products; (4) show that health effects were similar over a 7-year period; (5) evaluate positive and negative sentiments for symptoms and disorders; (6) evaluate symptoms that are linked to each other; and (7) identify top symptoms (eg, wheezing) and disorders (eg, asthma, COPD, and pharyngitis) that are associated with inflammation. In addition, some symptoms (eg, headache and nausea) and disorders (eg, pneumonia) that occurred with the highest frequency in the neurological and respiratory system have also appeared in a number of case reports in the EC literature [17,32-35]. Also, in agreement with our prior study, some reported health outcomes attributed to EC use were positive [1]. These included reduction in symptoms such as coughing and wheezing and disorders such as asthma, COPD, and common cold. It is very likely that there were real health benefits for some individuals, especially for those switching from conventional to EC use, and this is supported by other publications [36-38].
There are numerous reports on the health effects of EC, many of which are in agreement with our data. In the neurological system, the most commonly reported adverse symptoms we observed included headache, fatigue, nausea, dizziness, and seizures, which have also been reported in human studies [39-42]. Headaches have been reported to the Food and Drug Administration (FDA) by EC users [43], they were a common side effect in various surveys and online studies [4,44-46] and were reported in human studies in which participants used different EC devices and refill fluids with varying nicotine concentrations [47-49]. In 1 case report, an adult male experienced severe headaches/migraines and seizures for 1 week before being diagnosed with reversible cerebral vasoconstriction syndrome related to EC use [32], and in a second case, an adolescent female developed persistent daily headaches after a single EC use [50]. Nausea and dehydration were commonly reported symptoms and disorders of the neurological system. These symptoms have been associated with headache and fatigue/tiredness [51-54]. In our study, headache and nausea were frequently reported together, demonstrating that symptoms associated with EC use may be linked. The frequency distribution showing symptoms and disorders with over 100 posts also revealed that digestive symptoms such as heartburn and circulatory disorders such as myocardial infarction were highly reported. Digestive symptoms related to EC use have not been previously focused on and may be important to pay attention to, and disorders such as myocardial infarction associated with EC have recently received more attention from epidemiology studies [55].
For the respiratory system, the most frequently reported symptoms included coughing, wheezing, and dyspnea, and the top paired respiratory symptoms were coughing-wheezing. In the national Population Assessment of Tobacco Health (PATH) and in some human surveys, EC use was associated with increased wheezing (an important potential risk factor for respiratory disease) [56-59]. In our study, the top disorders were asthma, COPD, pneumonia, bronchitis, and sinusitis, which have a common theme of inflammation. Human studies and surveys have shown that adolescents and adults associated chronic bronchitis symptoms (eg, cough, phlegm, or dyspnea) with EC use [57,58]. Epidemiological studies have linked EC use to both COPD and asthma [56], and the PATH study showed that dual use of EC and conventional cigarettes aggravated this risk [56]. Frequently reported respiratory disorders in our study such as pneumonia and bronchitis have appeared in several EC case reports, most of which deal with lung inflammation and pneumonia-linked incidents [34,35,60,61]. Some of the patients in these case reports had no preexisting health conditions but presented with coughing, wheezing, and dyspnea. They typically recovered from their respiratory disorders after discontinuing EC use.
The circulatory, mouth/throat, chest, integumentary, and immunological systems were also affected by EC use in our study. Symptoms such as pain in throat, dry skin, pounding heart, and chest pain have been reported in survey/human EC studies [62]. Myocardial infarction, which was a top disorder for the circulatory system in our data, has been described in a case report after the patient used an EC with high nicotine [63]. A link between EC use and myocardial infarction was also found in a recent national survey adjusted for conventional smoking and other risk factors [55]. EC users are potentially susceptible to periodontal disease and increased plaque formation, which could lead to dental caries (also reported in our paper) [64]. Other reported disorders in our study, such as common cold and diabetes mellitus, are immunologically based, and multiple studies have shown EC aerosol exposure can induce inflammatory response [65]. Mice exposed to EC aerosol have impaired pulmonary viral and bacterial clearance ability that can lead to increased bacterial resistance, implying that EC users are more susceptible to cold and flu, a common complaint in our online studies. Experimental studies have further demonstrated that EC aerosol exposure can result in oxidative stress [13,66,67], suggesting chronic use could trigger inflammation, leading to progressive inflammatory disorders in the respiratory system.
Electronic Cigarette Aerosol Chemicals That May Produce Adverse Health Effects
EC refill fluids and aerosols are complex mixtures that contain flavor chemicals, solvents, nicotine, and metals that could contribute to adverse health effects (Table 4). Although most flavor chemicals in EC are generally regarded as safe (GRAS) for ingestion, their inhalation safety has usually not been established [68]. Some EC products contain high concentrations of flavor chemicals that exceed the National Institute of Occupational Safety and Health limits [69-75] and the concentrations normally used in consumer products [71,72]. Many EC flavor chemicals are classified as irritants [72] and are cytotoxic when tested in vitro at concentrations below those in EC products [71,72]. Cinnamaldehyde, which is used in refill fluids including those that do not have cinnamon in their name [10], is highly cytotoxic in the 3-(4,5-dimethylthiazol-2-yl) -2,5-diphenyltetrazolium bromide [10,69] and impaired respiratory response in immunological assays [76-78] and in vivo assays. In cell, animal, and human studies, EC flavor chemicals (eg, citrus/fruit and chocolate) caused an increase in reactive oxygen species leading to tissue and DNA damage and inflammation [67], which could in turn lead to mutations and disease progression. Some flavor chemicals, such as alcohols and phenols, can dilate blood vessels and cause headache, nausea, and fatigue. Prolonged inhalation of flavor chemicals, such as benzaldehyde, ethyl butanoate, diacetyl and its derivatives (2,3-pentadione, acetoin), triacetin, and limonene can elicit headaches, dizziness, and/or respiratory symptoms. Diacetyl (2,3-butanedione), a diketone associated with respiratory symptoms (wheezing and shortness of breath) and bronchiolitis obliterans, is in some EC refill fluids and can form as a reaction product during aerosolization [70,74]. Additional reaction products that form in EC aerosols (eg, aldehydes, acetals, and oxides) can be harmful to humans and elicit various symptoms, including pain.
Table 4.
Examples of chemical components in electronic cigarettes that may cause major symptoms/disorders with reference citations of studies.
| Symptom/disorder | System | Flavor chemicals (study) | Metals (study) | PGa/VGb/byproducts (study) | Nicotine (study) |
| Headache | Neurological | [79,80] | [81-83] | [51,52,84,85] | [86-88] |
| Fatigue/malaise | Neurological | [89] | [90] | —c | — |
| Dizziness | Neurological | [91] | [92,93] | — | [94] |
| Nausea | Neurological | [79,80] | [92] | [85,95] | [87,96] |
| Dehydration | Neurological | — | — | [52,84] | [97] |
| Coughing | Respiratory | [91,98-100] | [62] | [101,102] | — |
| Wheezing | Respiratory | [57,99] | [103] | [104] | — |
| Dyspnea | Respiratory | [99] | [105,106] | [107] | [108] |
| Asthma | Respiratory | [99,109] | [92,103,104] | [110] | — |
| COPDd | Respiratory | [111] | [92] | [110] | — |
| Pneumonia | Respiratory | — | [103] | — | — |
| Bronchitis | Respiratory | [111,112] | [113] | — | — |
| Sinusitis | Respiratory | [79,114] | [115] | [114] | — |
| Pain in throat | Mouth and throat | — | — | [101] | [87] |
| Dental caries | Mouth and throat | [116] | [117] | — | [118] |
| Itching/urticaria | Integumentary | — | [119-121] | [122] | [123] |
| Dry skin | Integumentary | — | — | [124] | — |
| Acne | Integumentary | — | [125] | — | [126,127] |
| Heartburn | Digestive | — | — | — | [128] |
| Cramp | Digestive | — | [129] | — | — |
aPG: propylene glycol.
bVG: vegetable glycerin.
cLack of evidence in referenced literature.
dCOPD: chronic obstructive pulmonary disorder.
Elements/metals (eg, aluminum, copper, cadmium, chromium, iron, nickel, silicon, lead, cobalt, and zinc) have been identified in EC aerosols [130,131]. In studies not involving ECs, these elements/metals have been linked to neurological (headache, nausea, and dizziness) and respiratory (eg, coughing, wheezing, shortness of breath, and bronchial/pulmonary irritations impairment) symptoms [132]. A positive correlation has been reported between human EC use and internal concentrations of nickel and chromium [133]. We found pneumoconiosis due to silica frequently reported by users, which could be caused by silica particles in EC aerosols [130]. Inhalation of silicon particles can elicit cough, inflammation, and lung fibrosis [134]. Although there is not a consensus on whether element/metal concentrations in EC aerosols are high enough to produce these effects [135], some evidence suggests that they could be a factor [130,136]. A female patient with no history of allergic disease tested positive for nickel allergy after being diagnosed with dermatitis caused by corrosion of the EC device [119]. Some of the top symptoms and disorders in our study also relate to inflammation of the skin (eg, itching and eczema), and this may be attributed to direct exposure and allergic reactions to EC products [119,120].
Propylene glycol and glycerin, 2 solvents in EC aerosols, are generally considered safe for ingestion; however, they are known respiratory tract and integumentary irritants [137]. When heated, propylene glycol can produce toxic aldehyde reaction products, such as acetaldehyde and formaldehyde [138], which can cause cellular and tissue damage in the body [67]. Inhalation of aldehyde fumes can cause dizziness, nausea, and headaches in humans [113], and formaldehyde can cause coughing, wheezing, pneumonia, bronchitis, and neurological and cardiovascular symptoms (eg, headaches, nausea, heart palpitations) [139]. Inhalation of propylene glycol mists can elicit both neurological and respiratory symptoms, such as nausea, wheezing, shortness of breath, and cough [101,140] and can exacerbate asthma [101,140]. Propylene glycol and glycerin produce 15 different aerobic thermal degradation products through hydrogen abstraction, oxidation, and cleavage reactions [138]. Several of these (eg, formaldehyde, formic acid, acetaldehyde, and acrolein) are carcinogens or have genotoxic potential [141,142]. Some of these byproducts are hemiacetals (such as formic acid and formaldehyde), which equilibrate and persist in the aerosols inhaled by the users.
Nicotine, a major component in most EC fluids, has various neurological, respiratory, digestive, mouth/throat, and circulatory system effects that overlap the symptoms/disorders observed in our study. Most cases of EC nicotine poisonings result from oral ingestion or intravenous injection [17] and are characterized by symptoms such as vomiting, nausea, dizziness, headaches, and more severe effects that can lead to death. The side effects of nicotine inhalation include headache, nausea, mouth/throat pain, cough, and heartburn [143]. Some users in our study may have been weaning themselves off nicotine or using devices with poor nicotine delivery leading to nicotine withdrawal, which could produce symptoms such as dizziness and anxiety [144]. Nicotine can trigger a dose-dependent loss of the endothelial barrier which has been shown to rapidly increase lung inflammation and oxidative stress in mice [15]. Nicotine in EC aerosols can induce glucose deprivation in the brain, which could lead to enhanced ischemic brain injury and or stroke risk. In addition, EC refill fluids may contain free-base nicotine (a form more addictive) [145], which can lead to greater deposition in the mouth and throat and upper respiratory tract [146].
Recently, an e-cigarette, or vaping, product use associated lung injury (EVALI) epidemic has been identified by the Centers for Disease Control and Prevention (CDC) [147]. As of December 2019, at least 2409 cases of lung injury have been reported to the CDC from 50 states, the District of Columbia, and 2 US territories [147]. In addition, 52 deaths associated with vaping were confirmed by 26 states and the District of Columbia [147]. Some of the commonly reported symptoms in presenting patients included chest pain, shortness of breath, cough, nausea, vomiting, diarrhea, fever, chills, fatigue/malaise, and headache [148-150], all of which are reported in this study. In addition to lung-related disease, some case reports included neurological and gastrointestinal symptoms [148,150], which overlap those found in our study.
The sudden uptick in health-related symptoms and conditions related to vaping comes at least 10 years after the products have gained widespread popularity in the United States, including the rise in popularity of JUUL and marijuana (THC) vape products. Our data show that many of the symptoms characterizing the current patients have been reported online for at least 7 years, suggesting that cases similar to those in the current epidemic have existed previously and been unreported or not linked to vaping. Our data further suggest that this epidemic will continue to grow given the many reports of symptoms characteristic of EVALI on the internet. The specific causes of the reported health effects are not yet known, but it is important to continue vigilant reporting of cases, tracking symptoms, and ongoing research on the health effects related to EC use to understand and contain the vaping epidemic.
Limitations
Our data may underestimate positive health effects, which EC users are less likely to post on online forums. The factors causing the symptoms and disorders reported by EC users could be complex and will require further investigations. Demographic data on the study population were not extractable. It is not known if any individuals were dual users or if they had preexisting health conditions that may have affected their response to EC.
Conclusions
This study is the first to use automated methods to analyze posts on an EC website over a span of 7 years and to identify the symptoms and disorders most frequently reported online by EC users. We demonstrate the value of using automated methods to acquire and analyze large datasets thereby increasing the power of infodemiological analyses. In addition, from our dataset, we identified a condensed list of symptoms and disorders and ranked them according to post frequency. These symptoms and disorders reported in our study may be of interest to physicians and health care providers who are treating patients using EC and could potentially be reported more frequently by EC users. Moreover, informative data were collected from a large population of EC vapers irrespective of their EC products and individual topographies and was not limited to a small selection of EC products or human subjects, as is often the case with experimental studies and case reports. Data collected using our automated method contribute to the growing body of knowledge linking EC use to adverse health effects, mainly in the mouth and throat and the neurological, respiratory, digestive, and integumentary systems. Our study identified hundreds of negative effects that were not previously described in case reports and peer-reviewed literature. The results from our study are in good agreement with previous surveys, human studies, and case reports. Although many of the symptoms that were reported with high frequency are not life-threatening (eg, headache, coughing, heartburn, sore throat), they can be disabling and reduce the quality of life. Of particular concern are the respiratory disorders that appeared with high frequency, such as asthma, COPD, pneumonia, and bronchitis, which not only severely impact the quality of life but may also be life threatening. Our data support the idea that EC use is not free of adverse health effects and that it is important to continue tracking the health of EC users. Advances in internet data mining provide a novel method for monitoring the health of EC users over time. Infodemiological data gathered on EC users will be valuable to physicians, regulatory agencies, and the users themselves.
Acknowledgments
The research reported in this publication was partially supported by the National Institute of Drug Addiction, National Institute of Environmental Health Sciences, and the FDA Center for Tobacco Products (CTP) Grant #s R01DA036493 and R01ES029741 (CTP) to PT. MH was supported in part by a Cornelius Hopper Fellowship and Predoctoral Dissertation Fellowship from the Tobacco-Related Research Program of California (Grant # 28DT-0009). The funders had no role in study design, data collection and analysis, decision to publish, or preparation of the manuscript. The authors are grateful to Malcolm Tran, Jacqueline Wong, and Avni Parekh for their help in organizing and sorting the data. They would like to thank Kevin Huang for his help with the manuscript and references and Dr Duc Nguyen for reading the manuscript.
Abbreviations
- CDC
Centers for Disease Control and Prevention
- COPD
chronic obstructive pulmonary disorder
- CTP
Center for Tobacco Products
- EC
electronic cigarette
- FDA
Food and Drug Administration
- PATH
Population Assessment of Tobacco Health
- UMLS
Unified Medical Language System
- VAPI
vaping-associated pulmonary illness
Appendix
Supplementary Figure 1: Heat map of symptoms less frequently reported in forums along with their associated systems. The total number of posts for each symptom is shown on a log scale.
Supplementary Figure 2: Heat map of disorders less frequently reported in forums along with their associated systems. The total number of posts for each disorder is shown on a log scale.
Supplementary Table 1: Listing of all symptoms not included in heat map.
Supplementary Table 2: Listing of all linked symptoms by frequency.
Footnotes
Conflicts of Interest: None declared.
References
- 1.Hua M, Alfi M, Talbot P. Health-related effects reported by electronic cigarette users in online forums. J Med Internet Res. 2013 Apr 8;15(4):e59. doi: 10.2196/jmir.2324. https://www.jmir.org/2013/4/e59/ [DOI] [PMC free article] [PubMed] [Google Scholar]
- 2.Polosa R, Morjaria JB, Caponnetto P, Campagna D, Russo C, Alamo A, Amaradio M, Fisichella A. Effectiveness and tolerability of electronic cigarette in real-life: a 24-month prospective observational study. Intern Emerg Med. 2014 Aug;9(5):537–46. doi: 10.1007/s11739-013-0977-z. [DOI] [PubMed] [Google Scholar]
- 3.Ayers JW, Leas EC, Allem J, Benton A, Dredze M, Althouse BM, Cruz TB, Unger JB. Why do people use electronic nicotine delivery systems (electronic cigarettes)? A content analysis of Twitter, 2012-2015. PLoS One. 2017;12(3):e0170702. doi: 10.1371/journal.pone.0170702. http://dx.plos.org/10.1371/journal.pone.0170702. [DOI] [PMC free article] [PubMed] [Google Scholar]
- 4.Li Q, Zhan Y, Wang L, Leischow SJ, Zeng DD. Analysis of symptoms and their potential associations with e-liquids' components: a social media study. BMC Public Health. 2016 Jul 30;16:674. doi: 10.1186/s12889-016-3326-0. https://bmcpublichealth.biomedcentral.com/articles/10.1186/s12889-016-3326-0. [DOI] [PMC free article] [PubMed] [Google Scholar]
- 5.Soule EK, Nasim A, Rosas S. Adverse effects of electronic cigarette use: a concept mapping approach. Nicotine Tob Res. 2016 May;18(5):678–85. doi: 10.1093/ntr/ntv246. http://europepmc.org/abstract/MED/26563262. [DOI] [PMC free article] [PubMed] [Google Scholar]
- 6.Chen Z, Zeng DD. Mining online e-liquid reviews for opinion polarities about e-liquid features. BMC Public Health. 2017 Jul 7;17(1):633. doi: 10.1186/s12889-017-4533-z. https://bmcpublichealth.biomedcentral.com/articles/10.1186/s12889-017-4533-z. [DOI] [PMC free article] [PubMed] [Google Scholar]
- 7.Vardavas CI, Anagnostopoulos N, Kougias M, Evangelopoulou V, Connolly GN, Behrakis PK. Short-term pulmonary effects of using an electronic cigarette: impact on respiratory flow resistance, impedance, and exhaled nitric oxide. Chest. 2012 Jun;141(6):1400–6. doi: 10.1378/chest.11-2443. [DOI] [PubMed] [Google Scholar]
- 8.Moheimani RS, Bhetraratana M, Yin F, Peters KM, Gornbein J, Araujo JA, Middlekauff HR. Increased cardiac sympathetic activity and oxidative stress in habitual electronic cigarette users: implications for cardiovascular risk. JAMA Cardiol. 2017 Mar 1;2(3):278–84. doi: 10.1001/jamacardio.2016.5303. http://europepmc.org/abstract/MED/28146259. [DOI] [PMC free article] [PubMed] [Google Scholar]
- 9.Bahl V, Lin S, Xu N, Davis B, Wang Y, Talbot P. Comparison of electronic cigarette refill fluid cytotoxicity using embryonic and adult models. Reprod Toxicol. 2012 Dec;34(4):529–37. doi: 10.1016/j.reprotox.2012.08.001. [DOI] [PubMed] [Google Scholar]
- 10.Behar RZ, Davis B, Wang Y, Bahl V, Lin S, Talbot P. Identification of toxicants in cinnamon-flavored electronic cigarette refill fluids. Toxicol In Vitro. 2014 Mar;28(2):198–208. doi: 10.1016/j.tiv.2013.10.006. [DOI] [PubMed] [Google Scholar]
- 11.Behar RZ, Davis B, Bahl V, Lin S, Talbot P. Commentary in response to the letter from Farsalinos et al. regarding our publication entitled: 'identification of toxicants in cinnamon-flavored electronic cigarette refill fluids'. Toxicol In Vitro. 2014 Dec;28(8):1521–2. doi: 10.1016/j.tiv.2014.07.001. [DOI] [PubMed] [Google Scholar]
- 12.Yu V, Rahimy M, Korrapati A, Xuan Y, Zou AE, Krishnan AR, Tsui T, Aguilera JA, Advani S, Alexander LE, Brumund KT, Wang-Rodriguez J, Ongkeko WM. Electronic cigarettes induce DNA strand breaks and cell death independently of nicotine in cell lines. Oral Oncol. 2016 Jan;52:58–65. doi: 10.1016/j.oraloncology.2015.10.018. http://europepmc.org/abstract/MED/26547127. [DOI] [PMC free article] [PubMed] [Google Scholar]
- 13.Lerner CA, Sundar IK, Yao H, Gerloff J, Ossip DJ, McIntosh S, Robinson R, Rahman I. Vapors produced by electronic cigarettes and e-juices with flavorings induce toxicity, oxidative stress, and inflammatory response in lung epithelial cells and in mouse lung. PLoS One. 2015;10(2):e0116732. doi: 10.1371/journal.pone.0116732. http://dx.plos.org/10.1371/journal.pone.0116732. [DOI] [PMC free article] [PubMed] [Google Scholar]
- 14.Sussan TE, Gajghate S, Thimmulappa RK, Ma J, Kim J, Sudini K, Consolini N, Cormier SA, Lomnicki S, Hasan F, Pekosz A, Biswal S. Exposure to electronic cigarettes impairs pulmonary anti-bacterial and anti-viral defenses in a mouse model. PLoS One. 2015;10(2):e0116861. doi: 10.1371/journal.pone.0116861. http://dx.plos.org/10.1371/journal.pone.0116861. [DOI] [PMC free article] [PubMed] [Google Scholar]
- 15.Schweitzer KS, Chen SX, Law S, Van Demark M, Poirier C, Justice MJ, Hubbard WC, Kim ES, Lai X, Wang M, Kranz WD, Carroll CJ, Ray BD, Bittman R, Goodpaster J, Petrache I. Endothelial disruptive proinflammatory effects of nicotine and e-cigarette vapor exposures. Am J Physiol Lung Cell Mol Physiol. 2015 Jul 15;309(2):L175–87. doi: 10.1152/ajplung.00411.2014. http://www.physiology.org/doi/full/10.1152/ajplung.00411.2014?url_ver=Z39.88-2003&rfr_id=ori:rid:crossref.org&rfr_dat=cr_pub%3dpubmed. [DOI] [PMC free article] [PubMed] [Google Scholar]
- 16.Drummond MB, Upson D. Electronic cigarettes. Potential harms and benefits. Ann Am Thorac Soc. 2014 Feb;11(2):236–42. doi: 10.1513/AnnalsATS.201311-391FR. http://europepmc.org/abstract/MED/24575993. [DOI] [PMC free article] [PubMed] [Google Scholar]
- 17.Hua M, Talbot P. Potential health effects of electronic cigarettes: a systematic review of case reports. Prev Med Rep. 2016 Dec;4:169–78. doi: 10.1016/j.pmedr.2016.06.002. https://linkinghub.elsevier.com/retrieve/pii/S2211-3355(16)30052-3. [DOI] [PMC free article] [PubMed] [Google Scholar]
- 18.Pisinger C, Døssing M. A systematic review of health effects of electronic cigarettes. Prev Med. 2014 Dec;69:248–60. doi: 10.1016/j.ypmed.2014.10.009. https://linkinghub.elsevier.com/retrieve/pii/S0091-7435(14)00373-9. [DOI] [PubMed] [Google Scholar]
- 19.Eysenbach G. Infodemiology: The epidemiology of (mis)information. Am J Med. 2002 Dec 15;113(9):763–5. doi: 10.1016/s0002-9343(02)01473-0. [DOI] [PubMed] [Google Scholar]
- 20.Eysenbach G. Infodemiology and infoveillance: framework for an emerging set of public health informatics methods to analyze search, communication and publication behavior on the Internet. J Med Internet Res. 2009 Mar 27;11(1):e11. doi: 10.2196/jmir.1157. https://www.jmir.org/2009/1/e11/ [DOI] [PMC free article] [PubMed] [Google Scholar]
- 21.Eysenbach G. Infodemiology and infoveillance tracking online health information and cyberbehavior for public health. Am J Prev Med. 2011 May;40(5 Suppl 2):S154–8. doi: 10.1016/j.amepre.2011.02.006. [DOI] [PubMed] [Google Scholar]
- 22.Hua M, Yip H, Talbot P. Mining data on usage of electronic nicotine delivery systems (ENDS) from YouTube videos. Tob Control. 2013 Mar;22(2):103–6. doi: 10.1136/tobaccocontrol-2011-050226. [DOI] [PubMed] [Google Scholar]
- 23.Behar RZ, Hua M, Talbot P. Puffing topography and nicotine intake of electronic cigarette users. PLoS One. 2015;10(2):e0117222. doi: 10.1371/journal.pone.0117222. http://dx.plos.org/10.1371/journal.pone.0117222. [DOI] [PMC free article] [PubMed] [Google Scholar]
- 24.Hedley J. jsoup Java HTML Parser, with best of DOM, CSS, and jquery. 2009. [2019-02-07]. https://jsoup.org/
- 25.Aronson AR. Effective mapping of biomedical text to the UMLS Metathesaurus: the MetaMap program. Proc AMIA Symp. 2001:17–21. http://europepmc.org/abstract/MED/11825149. [PMC free article] [PubMed] [Google Scholar]
- 26.Bodenreider O. The Unified Medical Language System (UMLS): integrating biomedical terminology. Nucleic Acids Res. 2004 Jan 1;32(Database issue):D267–70. doi: 10.1093/nar/gkh061. http://europepmc.org/abstract/MED/14681409. [DOI] [PMC free article] [PubMed] [Google Scholar]
- 27.Bodenreider O, McCray AT. Exploring semantic groups through visual approaches. J Biomed Inform. 2003 Dec;36(6):414–32. doi: 10.1016/j.jbi.2003.11.002. https://linkinghub.elsevier.com/retrieve/pii/S1532046403001163. [DOI] [PMC free article] [PubMed] [Google Scholar]
- 28.Denecke K, Soltani N. Where Humans Meet Machines: Innovative Solutions for Knotty Natural-Language Problems. New York: Springer; 2013. [Google Scholar]
- 29.Freelon D. dfreelon. 2017. [2017-11-02]. ReCal: reliability calculation for the masses. http://dfreelon.org/utils/recalfront/
- 30.Frank E, Hall MA, Witten IH. The WEKA Workbench in Data Mining: Practical Machine Learning Tools and Techniques. Fourth Edition. San Francisco: Morgan Kaufmann Publishers; 2016. [Google Scholar]
- 31.Sun Y, Wong AK, Kamel MS. Classification of imbalanced data: a review. Int J Patt Recogn Artif Intell. 2011;23(4):687–719. doi: 10.1142/s0218001409007326. [DOI] [Google Scholar]
- 32.Vannier S, Ronziere T, Ferre JC, Lassalle V, Verin M. Reversible cerebral vasoconstriction syndrome triggered by an electronic cigarette: case report. Eur J Neurol. 2015 May;22(5):e64–5. doi: 10.1111/ene.12657. [DOI] [PubMed] [Google Scholar]
- 33.McCauley L, Markin C, Hosmer D. An unexpected consequence of electronic cigarette use. Chest. 2012 Apr;141(4):1110–3. doi: 10.1378/chest.11-1334. [DOI] [PubMed] [Google Scholar]
- 34.Khan MS, Khateeb F, Akhtar J, Khan Z, Lal A, Kholodovych V, Hammersley J. Organizing pneumonia related to electronic cigarette use: a case report and review of literature. Clin Respir J. 2018 Mar;12(3):1295–9. doi: 10.1111/crj.12775. [DOI] [PubMed] [Google Scholar]
- 35.Viswam D, Trotter S, Burge PS, Walters GI. Respiratory failure caused by lipoid pneumonia from vaping e-cigarettes. BMJ Case Rep. 2018 Jul 6;2018:pii: bcr-2018-224350. doi: 10.1136/bcr-2018-224350. [DOI] [PMC free article] [PubMed] [Google Scholar]
- 36.Dawkins L, Turner J, Crowe E. Nicotine derived from the electronic cigarette improves time-based prospective memory in abstinent smokers. Psychopharmacology (Berl) 2013 Jun;227(3):377–84. doi: 10.1007/s00213-013-2983-2. [DOI] [PubMed] [Google Scholar]
- 37.Dawkins L, Turner J, Hasna S, Soar K. The electronic-cigarette: effects on desire to smoke, withdrawal symptoms and cognition. Addict Behav. 2012 Aug;37(8):970–3. doi: 10.1016/j.addbeh.2012.03.004. [DOI] [PubMed] [Google Scholar]
- 38.Berg CJ, Barr DB, Stratton E, Escoffery C, Kegler M. Attitudes toward e-cigarettes, reasons for initiating e-cigarette use, and changes in smoking behavior after initiation: a pilot longitudinal study of regular cigarette smokers. Open J Prev Med. 2014 Oct;4(10):789–800. doi: 10.4236/ojpm.2014.410089. http://europepmc.org/abstract/MED/25621193. [DOI] [PMC free article] [PubMed] [Google Scholar]
- 39.Motooka Y, Matsui T, Slaton RM, Umetsu R, Fukuda A, Naganuma M, Hasegawa S, Sasaoka S, Hatahira H, Iguchi K, Nakamura M. Adverse events of smoking cessation treatments (nicotine replacement therapy and non-nicotine prescription medication) and electronic cigarettes in the Food and Drug Administration Adverse Event Reporting System, 2004-2016. SAGE Open Med. 2018;6:2050312118777953. doi: 10.1177/2050312118777953. http://europepmc.org/abstract/MED/29844912. [DOI] [PMC free article] [PubMed] [Google Scholar]
- 40.Food and Drug Administration. 2019. [2019-11-20]. Some E-cigarette Users Are Having Seizures, Most Reports Involving Youth and Young Adults. https://www.fda.gov/tobacco-products/ctp-newsroom/some-e-cigarette-users-are-having-seizures-most-reports-involving-youth-and-young-adults.
- 41.Meo SA, Al Asiri SA. Effects of electronic cigarette smoking on human health. Eur Rev Med Pharmacol Sci. 2014;18(21):3315–9. http://www.europeanreview.org/article/8033. [PubMed] [Google Scholar]
- 42.Zvolensky MJ, Garey L, Mayorga NA, Peraza N, Rogers AH, Ditre JW, Orr MF. Pain severity and anxiety sensitivity interplay among exclusive and dual electronic cigarette users. J Stud Alcohol Drugs. 2019 Mar;80(2):211–9. doi: 10.15288/jsad.2019.80.211. [DOI] [PubMed] [Google Scholar]
- 43.Chen IL. FDA summary of adverse events on electronic cigarettes. Nicotine Tob Res. 2013 Feb;15(2):615–6. doi: 10.1093/ntr/nts145. [DOI] [PubMed] [Google Scholar]
- 44.Baweja R, Curci KM, Yingst J, Veldheer S, Hrabovsky S, Wilson SJ, Nichols TT, Eissenberg T, Foulds J. Views of experienced electronic cigarette users. Addict Res Theory. 2016;24(1):80–8. doi: 10.3109/16066359.2015.1077947. http://europepmc.org/abstract/MED/29176939. [DOI] [PMC free article] [PubMed] [Google Scholar]
- 45.Volesky KD, Maki A, Scherf C, Watson LM, Cassol E, Villeneuve PJ. Characteristics of e-cigarette users and their perceptions of the benefits, harms and risks of e-cigarette use: survey results from a convenience sample in Ottawa, Canada. Health Promot Chronic Dis Prev Can. 2016 Jul;36(7):130–8. doi: 10.24095/hpcdp.36.7.02. doi: 10.24095/hpcdp.36.7.02. [DOI] [PMC free article] [PubMed] [Google Scholar]
- 46.Mohamed MH, Rahman A, Jamshed S, Mahmood S. Effectiveness and safety of electronic cigarettes among sole and dual user vapers in Kuantan and Pekan, Malaysia: a six-month observational study. BMC Public Health. 2018 Aug 20;18(1):1028. doi: 10.1186/s12889-018-5951-2. https://bmcpublichealth.biomedcentral.com/articles/10.1186/s12889-018-5951-2. [DOI] [PMC free article] [PubMed] [Google Scholar]
- 47.Caponnetto P, Campagna D, Cibella F, Morjaria JB, Caruso M, Russo C, Polosa R. EffiCiency and Safety of an eLectronic cigAreTte (ECLAT) as tobacco cigarettes substitute: a prospective 12-month randomized control design study. PLoS One. 2013;8(6):e66317. doi: 10.1371/journal.pone.0066317. http://dx.plos.org/10.1371/journal.pone.0066317. [DOI] [PMC free article] [PubMed] [Google Scholar]
- 48.Cravo AS, Bush J, Sharma G, Savioz R, Martin C, Craige S, Walele T. A randomised, parallel group study to evaluate the safety profile of an electronic vapour product over 12 weeks. Regul Toxicol Pharmacol. 2016 Nov 15;81(Suppl 1):S1–14. doi: 10.1016/j.yrtph.2016.10.003. https://linkinghub.elsevier.com/retrieve/pii/S0273-2300(16)30293-8. [DOI] [PubMed] [Google Scholar]
- 49.Cooper M, Harrell MB, Perry CL. A qualitative approach to understanding real-world electronic cigarette use: implications for measurement and regulation. Prev Chronic Dis. 2016 Jan 14;13:E07. doi: 10.5888/pcd13.150502. https://www.cdc.gov/pcd/issues/2016/15_0502.htm. [DOI] [PMC free article] [PubMed] [Google Scholar]
- 50.Csere A, Sahai-Srivastava S. The Development of New Daily Persistent Headache after Electronic Cigarette Use in an Adolescent. Proceedings of the American Headache Society 57th Annual Scientific Meeting; AHS'15; June 18-21, 2015; Washington, DC. 2015. [Google Scholar]
- 51.OECD SIDS OECD's Work on Co-operating in the Investigation. 2002. [2018-06-02]. Screening information data set (SIDS): SIDS initial assessment report for SIAM 14; glycerol: CAS no: 56-81-5. https://hpvchemicals.oecd.org/ui/handler.axd?id=4b0a2d87-3183-40d4-84f5-0e118c647b19.
- 52.Cosmetic Ingredient Review. 2014. [2018-02-01]. Safety Assessment of Glycerin as Used in Cosmetics: Draft Report for Panel Review. https://www.cir-safety.org/sites/default/files/glycerin.pdf.
- 53.Venable JR, McClimans CD, Flake RE, Dimick DB. A fertility study of male employees engaged in the manufacture of glycerine. J Occup Med. 1980 Feb;22(2):87–91. doi: 10.1097/00043764-198002000-00005. [DOI] [PubMed] [Google Scholar]
- 54.National Academies of Sciences, Engineering, and Medicine . Public Health Consequences of E-Cigarettes. Washington, DC: The National Academies Press; 2018. [PubMed] [Google Scholar]
- 55.Alzahrani T, Pena I, Temesgen N, Glantz SA. Association between electronic cigarette use and myocardial infarction. Am J Prev Med. 2018 Oct;55(4):455–61. doi: 10.1016/j.amepre.2018.05.004. http://europepmc.org/abstract/MED/30166079. [DOI] [PMC free article] [PubMed] [Google Scholar]
- 56.Li D, Sundar IK, McIntosh S, Ossip DJ, Goniewicz ML, O'Connor RJ, Rahman I. Association of smoking and electronic cigarette use with wheezing and related respiratory symptoms in adults: cross-sectional results from the Population Assessment of Tobacco and Health (PATH) study, wave 2. Tob Control. 2019 Feb 13; doi: 10.1136/tobaccocontrol-2018-054694. [DOI] [PMC free article] [PubMed] [Google Scholar]
- 57.McConnell R, Barrington-Trimis JL, Wang K, Urman R, Hong H, Unger J, Samet J, Leventhal A, Berhane K. Electronic cigarette use and respiratory symptoms in adolescents. Am J Respir Crit Care Med. 2017 Apr 15;195(8):1043–9. doi: 10.1164/rccm.201604-0804OC. http://europepmc.org/abstract/MED/27806211. [DOI] [PMC free article] [PubMed] [Google Scholar]
- 58.Hedman L, Backman H, Stridsman C, Bosson JA, Lundbäck M, Lindberg A, Rönmark E, Ekerljung L. Association of electronic cigarette use with smoking habits, demographic factors, and respiratory symptoms. JAMA Netw Open. 2018 Jul 6;1(3):e180789. doi: 10.1001/jamanetworkopen.2018.0789. http://europepmc.org/abstract/MED/30646032. [DOI] [PMC free article] [PubMed] [Google Scholar]
- 59.Moazed F, Calfee CS. The canary in the coal mine is coughing: electronic cigarettes and respiratory symptoms in adolescents. Am J Respir Crit Care Med. 2017 Apr 15;195(8):974–6. doi: 10.1164/rccm.201611-2259ED. http://europepmc.org/abstract/MED/28409686. [DOI] [PMC free article] [PubMed] [Google Scholar]
- 60.Agustin M, Yamamoto M, Cabrera F, Eusebio R. Diffuse alveolar hemorrhage induced by vaping. Case Rep Pulmonol. 2018;2018:9724530. doi: 10.1155/2018/9724530. doi: 10.1155/2018/9724530. [DOI] [PMC free article] [PubMed] [Google Scholar]
- 61.Shields PG, Berman M, Brasky TM, Freudenheim JL, Mathe E, McElroy JP, Song M, Wewers MD. A review of pulmonary toxicity of electronic cigarettes in the context of smoking: a focus on inflammation. Cancer Epidemiol Biomarkers Prev. 2017 Aug;26(8):1175–91. doi: 10.1158/1055-9965.EPI-17-0358. http://cebp.aacrjournals.org/cgi/pmidlookup?view=long&pmid=28642230. [DOI] [PMC free article] [PubMed] [Google Scholar]
- 62.Tang L. Pain Associated with the Use of Electronic Cigarettes. IntechOpen. 2019 doi: 10.5772/intechopen.85481. https://www.intechopen.com/online-first/pain-associated-with-the-use-of-electronic-cigarettes. [DOI] [Google Scholar]
- 63.Kivrak T, Sunbul M, Durmus E, Dervisova R, Sari I, Yesildag O. Acute myocardial infarction due to liquid nicotine in a young man. Ther Adv Cardiovasc Dis. 2014 Feb;8(1):32–4. doi: 10.1177/1753944713515765. [DOI] [PubMed] [Google Scholar]
- 64.Javed F, Kellesarian SV, Sundar IK, Romanos GE, Rahman I. Recent updates on electronic cigarette aerosol and inhaled nicotine effects on periodontal and pulmonary tissues. Oral Dis. 2017 Nov;23(8):1052–7. doi: 10.1111/odi.12652. http://europepmc.org/abstract/MED/28168771. [DOI] [PMC free article] [PubMed] [Google Scholar]
- 65.Kaur G, Pinkston R, Mclemore B, Dorsey WC, Batra S. Immunological and toxicological risk assessment of e-cigarettes. Eur Respir Rev. 2018 Mar 31;27(147):pii: 170119. doi: 10.1183/16000617.0119-2017. http://err.ersjournals.com/cgi/pmidlookup?view=long&pmid=29491036. [DOI] [PMC free article] [PubMed] [Google Scholar]
- 66.Anderson C, Majeste A, Hanus J, Wang S. E-cigarette aerosol exposure induces reactive oxygen species, DNA damage, and cell death in vascular endothelial cells. Toxicol Sci. 2016 Dec;154(2):332–40. doi: 10.1093/toxsci/kfw166. [DOI] [PubMed] [Google Scholar]
- 67.Muthumalage T, Prinz M, Ansah KO, Gerloff J, Sundar IK, Rahman I. Inflammatory and oxidative responses induced by exposure to commonly used e-cigarette flavoring chemicals and flavored e-liquids without nicotine. Front Physiol. 2017;8:1130. doi: 10.3389/fphys.2017.01130. doi: 10.3389/fphys.2017.01130. [DOI] [PMC free article] [PubMed] [Google Scholar]
- 68.Hallagan JB, Hall RL. Under the conditions of intended use - New developments in the FEMA GRAS program and the safety assessment of flavor ingredients. Food Chem Toxicol. 2009 Feb;47(2):267–78. doi: 10.1016/j.fct.2008.11.011. [DOI] [PubMed] [Google Scholar]
- 69.Behar RZ, Wang Y, Talbot P. Comparing the cytotoxicity of electronic cigarette fluids, aerosols and solvents. Tob Control. 2018 May;27(3):325–33. doi: 10.1136/tobaccocontrol-2016-053472. http://europepmc.org/abstract/MED/28596276. [DOI] [PMC free article] [PubMed] [Google Scholar]
- 70.Behar RZ, Luo W, McWhirter KJ, Pankow JF, Talbot P. Analytical and toxicological evaluation of flavor chemicals in electronic cigarette refill fluids. Sci Rep. 2018 May 29;8(1):8288. doi: 10.1038/s41598-018-25575-6. doi: 10.1038/s41598-018-25575-6. [DOI] [PMC free article] [PubMed] [Google Scholar]
- 71.Omaiye EE, McWhirter KJ, Luo W, Tierney PA, Pankow JF, Talbot P. High concentrations of flavor chemicals are present in electronic cigarette refill fluids. Sci Rep. 2019 Feb 21;9(1):2468. doi: 10.1038/s41598-019-39550-2. doi: 10.1038/s41598-019-39550-2. [DOI] [PMC free article] [PubMed] [Google Scholar]
- 72.Hua M, Omaiye EE, Luo W, McWhirter KJ, Pankow JF, Talbot P. Identification of cytotoxic flavor chemicals in top-selling electronic cigarette refill fluids. Sci Rep. 2019 Feb 26;9(1):2782. doi: 10.1038/s41598-019-38978-w. doi: 10.1038/s41598-019-38978-w. [DOI] [PMC free article] [PubMed] [Google Scholar]
- 73.Farsalinos KE, Kistler KA, Gillman G, Voudris V. Evaluation of electronic cigarette liquids and aerosol for the presence of selected inhalation toxins. Nicotine Tob Res. 2015 Feb;17(2):168–74. doi: 10.1093/ntr/ntu176. http://europepmc.org/abstract/MED/25180080. [DOI] [PMC free article] [PubMed] [Google Scholar]
- 74.Varlet V, Farsalinos K, Augsburger M, Thomas A, Etter J. Toxicity assessment of refill liquids for electronic cigarettes. Int J Environ Res Public Health. 2015 Apr 30;12(5):4796–815. doi: 10.3390/ijerph120504796. http://www.mdpi.com/resolver?pii=ijerph120504796. [DOI] [PMC free article] [PubMed] [Google Scholar]
- 75.Allen JG, Flanigan SS, LeBlanc M, Vallarino J, MacNaughton P, Stewart JH, Christiani DC. Flavoring chemicals in e-cigarettes: diacetyl, 2, 3-pentanedione, and acetoin in a sample of 51 products, including fruit-, candy-, and cocktail-flavored e-cigarettes. Environ Health Perspect. 2016 Jun;124(6):733–9. doi: 10.1289/ehp.1510185. https://ehp.niehs.nih.gov/doi/full/10.1289/ehp.1510185?url_ver=Z39.88-2003&rfr_id=ori:rid:crossref.org&rfr_dat=cr_pub%3dpubmed. [DOI] [PMC free article] [PubMed] [Google Scholar]
- 76.Clapp PW, Pawlak EA, Lackey JT, Keating JE, Reeber SL, Glish GL, Jaspers I. Flavored e-cigarette liquids and cinnamaldehyde impair respiratory innate immune cell function. Am J Physiol Lung Cell Mol Physiol. 2017 Aug 1;313(2):L278–92. doi: 10.1152/ajplung.00452.2016. http://www.physiology.org/doi/full/10.1152/ajplung.00452.2016?url_ver=Z39.88-2003&rfr_id=ori:rid:crossref.org&rfr_dat=cr_pub%3dpubmed. [DOI] [PMC free article] [PubMed] [Google Scholar]
- 77.Clapp PW, Jaspers I. Electronic cigarettes: their constituents and potential links to asthma. Curr Allergy Asthma Rep. 2017 Oct 5;17(11):79. doi: 10.1007/s11882-017-0747-5. http://europepmc.org/abstract/MED/28983782. [DOI] [PMC free article] [PubMed] [Google Scholar]
- 78.Clapp PW, Lavrich KS, van Heusden CA, Lazarowski ER, Carson JL, Jaspers I. Cinnamaldehyde in flavored e-cigarette liquids temporarily suppresses bronchial epithelial cell ciliary motility by dysregulation of mitochondrial function. Am J Physiol Lung Cell Mol Physiol. 2019 Mar 1;316(3):L470–86. doi: 10.1152/ajplung.00304.2018. [DOI] [PMC free article] [PubMed] [Google Scholar]
- 79.Ni Y, Zhang G, Kokot S. Simultaneous spectrophotometric determination of maltol, ethyl maltol, vanillin and ethyl vanillin in foods by multivariate calibration and artificial neural networks. Food Chem. 2005;89(3):465–73. doi: 10.1016/j.foodchem.2004.05.037. [DOI] [Google Scholar]
- 80.Yue Y, Liu J, Yao M, Yao X, Fan J, Ji H. The investigation of the binding behavior between ethyl maltol and human serum albumin by multi-spectroscopic methods and molecular docking. Spectrochim Acta A Mol Biomol Spectrosc. 2012 Oct;96:316–23. doi: 10.1016/j.saa.2012.05.041. [DOI] [PubMed] [Google Scholar]
- 81.Gonullu H, Gonullu E, Karadas S, Arslan M, Kalemci O, Aycan A, Sayin R, Demir H. The levels of trace elements and heavy metals in patients with acute migraine headache. J Pak Med Assoc. 2015 Jul;65(7):694–7. http://jpma.org.pk/full_article-text.php?article_id=7394. [PubMed] [Google Scholar]
- 82.Agency for Toxic Substances and Disease Registry (ATSDR) Atlanta, GA: US Department of Health and Human Services, Public Health Service; 2004. Sep, [2019-07-25]. Toxicological profile for Copper. https://www.atsdr.cdc.gov/toxprofiles/tp132.pdf. [Google Scholar]
- 83.Brodkin E, Copes R, Mattman A, Kennedy J, Kling R, Yassi A. Lead and mercury exposures: interpretation and action. Can Med Assoc J. 2007 Jan 2;176(1):59–63. doi: 10.1503/cmaj.060790. http://www.cmaj.ca/cgi/pmidlookup?view=long&pmid=17200393. [DOI] [PMC free article] [PubMed] [Google Scholar]
- 84.OECD's Work on Co-operating in the Investigation. 2001. [2019-11-20]. Screening information data set (SIDS): SIDS initial assessment profile for SIAM 11; Dipropylene glycol (mixed isomers and dominant isomer). https://hpvchemicals.oecd.org/ui/handler.axd?id=40da06b1-a855-4c0c-bc21-bbc856dca725.
- 85.NJ Health. 2009. [2019-07-25]. Hazardous Substances Fact Sheet: Propylene Glycol. http://nj.gov/health/eoh/rtkweb/documents/fs/3595.pdf.
- 86.Centers for Disease Control and Prevention. 2018. NIOSH: Nicotine. https://www.cdc.gov/niosh/npg/npgd0446.html.
- 87.Mishra A, Chaturvedi P, Datta S, Sinukumar S, Joshi P, Garg A. Harmful effects of nicotine. Indian J Med Paediatr Oncol. 2015;36(1):24–31. doi: 10.4103/0971-5851.151771. http://www.ijmpo.org/article.asp?issn=0971-5851;year=2015;volume=36;issue=1;spage=24;epage=31;aulast=Mishra. [DOI] [PMC free article] [PubMed] [Google Scholar]
- 88.Taylor FR. Tobacco, nicotine, and headache. Headache. 2015;55(7):1028–44. doi: 10.1111/head.12620. [DOI] [PubMed] [Google Scholar]
- 89.Ash M, Ash I. Handbook of Green Chemicals. Second Edition. New York, NY: Synapse Information Resources Inc; 2006. [Google Scholar]
- 90.Assi MA, Hezmee MN, Haron AW, Sabri MY, Rajion MA. The detrimental effects of lead on human and animal health. Vet World. 2016 Jun;9(6):660–71. doi: 10.14202/vetworld.2016.660-671. http://europepmc.org/abstract/MED/27397992. [DOI] [PMC free article] [PubMed] [Google Scholar]
- 91.NJ Health. 2009. [2019-07-25]. Hazardous Substances Fact Sheet: Benzaldehyde. https://nj.gov/health/eoh/rtkweb/documents/fs/0196.pdf.
- 92.Environmental XPRT. 2010. [2019-07-25]. Overview of Airborne metals regulations, exposure limits, health effects, and contemporary research case study. https://www.environmental-expert.com/articles/overview-of-airborne-metals-regulations-exposure-limits-health-effects-and-contemporary-research-cas-450906.
- 93.Jaishankar M, Tseten T, Anbalagan N, Mathew BB, Beeregowda KN. Toxicity, mechanism and health effects of some heavy metals. Interdiscip Toxicol. 2014 Jun;7(2):60–72. doi: 10.2478/intox-2014-0009. http://europepmc.org/abstract/MED/26109881. [DOI] [PMC free article] [PubMed] [Google Scholar]
- 94.Centers for Disease Control and Prevention. 2018. [2019-07-25]. NIOSH: Nicotine: Systemic Agent. https://www.cdc.gov/niosh/ershdb/emergencyresponsecard_29750028.html.
- 95.Agency for Toxic Substances and Disease Registry. 2014. [2019-07-25]. Medical Management Guidelines for Phenol. https://www.atsdr.cdc.gov/mmg/mmg.asp?id=144&tid=27#bookmark05.
- 96.Callahan-Lyon P. Electronic cigarettes: human health effects. Tob Control. 2014 May;23(Suppl 2):ii36–40. doi: 10.1136/tobaccocontrol-2013-051470. http://tobaccocontrol.bmj.com/cgi/pmidlookup?view=long&pmid=24732161. [DOI] [PMC free article] [PubMed] [Google Scholar]
- 97.Pesta DH, Angadi SS, Burtscher M, Roberts CK. The effects of caffeine, nicotine, ethanol, and tetrahydrocannabinol on exercise performance. Nutr Metab (Lond) 2013 Dec 13;10(1):71. doi: 10.1186/1743-7075-10-71. https://nutritionandmetabolism.biomedcentral.com/articles/10.1186/1743-7075-10-71. [DOI] [PMC free article] [PubMed] [Google Scholar]
- 98.NJ Health. 1998. [2019-11-20]. Hazardous Substances Fact Sheet: ethyl butyrate. http://nj.gov/health/eoh/rtkweb/documents/fs/0862.pdf.
- 99.Park RM, Gilbert SJ. Pulmonary impairment and risk assessment in a diacetyl-exposed population: microwave popcorn workers. J Occup Environ Med. 2018 Jun;60(6):496–506. doi: 10.1097/JOM.0000000000001303. http://europepmc.org/abstract/MED/29443707. [DOI] [PMC free article] [PubMed] [Google Scholar]
- 100.Toxnet. 2015. [2019-07-25]. Triacetin. https://toxnet.nlm.nih.gov/cgi-bin/sis/search/a?dbs+hsdb:@term+@DOCNO+585.
- 101.Wieslander G, Norbäck D, Lindgren T. Experimental exposure to propylene glycol mist in aviation emergency training: acute ocular and respiratory effects. Occup Environ Med. 2001 Oct;58(10):649–55. doi: 10.1136/oem.58.10.649. http://oem.bmj.com/cgi/pmidlookup?view=long&pmid=11555686. [DOI] [PMC free article] [PubMed] [Google Scholar]
- 102.Dicpinigaitis PV. Effect of tobacco and electronic cigarette use on cough reflex sensitivity. Pulm Pharmacol Ther. 2017 Dec;47:45–8. doi: 10.1016/j.pupt.2017.01.013. [DOI] [PubMed] [Google Scholar]
- 103.Nemery B. Metal toxicity and the respiratory tract. Eur Respir J. 1990 Feb;3(2):202–19. [PubMed] [Google Scholar]
- 104.Boulay ME, Henry C, Bossé Y, Boulet LP, Morissette MC. Acute effects of nicotine-free and flavour-free electronic cigarette use on lung functions in healthy and asthmatic individuals. Respir Res. 2017 Feb 10;18(1):33. doi: 10.1186/s12931-017-0518-9. https://respiratory-research.biomedcentral.com/articles/10.1186/s12931-017-0518-9. [DOI] [PMC free article] [PubMed] [Google Scholar]
- 105.Cooper RG. Zinc toxicology following particulate inhalation. Indian J Occup Environ Med. 2008 Apr;12(1):10–3. doi: 10.4103/0019-5278.40809. http://www.ijoem.com/article.asp?issn=0019-5278;year=2008;volume=12;issue=1;spage=10;epage=13;aulast=Cooper. [DOI] [PMC free article] [PubMed] [Google Scholar]
- 106.United States Environmental Protection Agency. 2000. [2019-07-25]. Selenium Compounds. https://www.epa.gov/sites/production/files/2016-09/documents/selenium-compounds.pdf.
- 107.Norbäck D, Wieslander G, Edling C. Occupational exposure to volatile organic compounds (VOCs), and other air pollutants from the indoor application of water-based paints. Ann Occ Hyg. 1995;39(6):783–94. doi: 10.1016/0003-4878(95)00034-8. [DOI] [Google Scholar]
- 108.Paik JH, Kang S, Durey A, Kim JH, Kim AJ. Symptomatic bradycardia due to nicotine intoxication. Rev Bras Ter Intensiva. 2018 Mar;30(1):121–6. doi: 10.5935/0103-507x.20180018. http://www.scielo.br/scielo.php?script=sci_arttext&pid=S0103-507X2018000100121&lng=en&nrm=iso&tlng=en. [DOI] [PMC free article] [PubMed] [Google Scholar]
- 109.Quirce S, Fernández-Nieto M, del Pozo V, Sastre B, Sastre J. Occupational asthma and rhinitis caused by eugenol in a hairdresser. Allergy. 2008 Jan;63(1):137–8. doi: 10.1111/j.1398-9995.2007.01525.x. [DOI] [PubMed] [Google Scholar]
- 110.Bein K, Leikauf GD. Acrolein - a pulmonary hazard. Mol Nutr Food Res. 2011 Sep;55(9):1342–60. doi: 10.1002/mnfr.201100279. [DOI] [PubMed] [Google Scholar]
- 111.Centers for Disease Control and Prevention. 2017. [2019-07-25]. Flavorings-related lung disease. https://www.cdc.gov/niosh/topics/flavorings/exposure.html.
- 112.Sisson JH. Alcohol and airways function in health and disease. Alcohol. 2007 Aug;41(5):293–307. doi: 10.1016/j.alcohol.2007.06.003. http://europepmc.org/abstract/MED/17764883. [DOI] [PMC free article] [PubMed] [Google Scholar]
- 113.Gorguner M, Akgun M. Acute inhalation injury. Eurasian J Med. 2010 Apr;42(1):28–35. doi: 10.5152/eajm.2010.09. http://europepmc.org/abstract/MED/25610115. [DOI] [PMC free article] [PubMed] [Google Scholar]
- 114.Chang CC, Incaudo GA, Gershwin ME. Diseases of the Sinuses: A Comprehensive Textbook of Diagnosis and Treatment. New York, NY: Springer-Verlag; 2014. [Google Scholar]
- 115.Sunderman FW. Nasal toxicity, carcinogenicity, and olfactory uptake of metals. Ann Clin Lab Sci. 2001 Jan;31(1):3–24. [PubMed] [Google Scholar]
- 116.Kim SA, Smith S, Beauchamp C, Song Y, Chiang M, Giuseppetti A, Frukhtbeyn S, Shaffer I, Wilhide J, Routkevitch D, Ondov JM, Kim JJ. Cariogenic potential of sweet flavors in electronic-cigarette liquids. PLoS One. 2018;13(9):e0203717. doi: 10.1371/journal.pone.0203717. http://dx.plos.org/10.1371/journal.pone.0203717. [DOI] [PMC free article] [PubMed] [Google Scholar]
- 117.Wychowanski P, Malkiewicz K. Evaluation of metal ion concentration in hard tissues of teeth in residents of Central Poland. Biomed Res Int. 2017;2017:6419709. doi: 10.1155/2017/6419709. doi: 10.1155/2017/6419709. [DOI] [PMC free article] [PubMed] [Google Scholar]
- 118.Liu S, Wu T, Zhou X, Zhang B, Huo S, Yang Y, Zhang K, Cheng L, Xu X, Li M. Nicotine is a risk factor for dental caries: an study. J Dent Sci. 2018 Mar;13(1):30–6. doi: 10.1016/j.jds.2017.09.006. https://linkinghub.elsevier.com/retrieve/pii/S1991-7902(18)30032-1. [DOI] [PMC free article] [PubMed] [Google Scholar]
- 119.Maridet C, Atge B, Amici J, Taïeb A, Milpied B. The electronic cigarette: the new source of nickel contact allergy of the 21st century? Contact Dermatitis. 2015 Jul;73(1):49–50. doi: 10.1111/cod.12373. [DOI] [PubMed] [Google Scholar]
- 120.Shim TN, Kosztyuova T. Allergic contact dermatitis to electronic cigarette. Dermatitis. 2018;29(2):94–5. doi: 10.1097/DER.0000000000000337. [DOI] [PubMed] [Google Scholar]
- 121.Nguyen TT, Higashi T, Kambayashi Y, Anyenda EO, Michigami Y, Hara J, Fujimura M, Tsujiguchi H, Kitaoka M, Asakura H, Hori D, Hibino Y, Konoshita T, Nakamura H. A longitudinal study of association between heavy metals and itchy eyes, coughing in chronic cough patients: related with non-immunoglobulin E mediated mechanism. Int J Environ Res Public Health. 2016 Jan 7;13(1):pii: E110. doi: 10.3390/ijerph13010110. http://www.mdpi.com/resolver?pii=ijerph13010110. [DOI] [PMC free article] [PubMed] [Google Scholar]
- 122.Andersen KE, Storrs FJ. [Skin irritation caused by propylene glycols] Hautarzt. 1982 Jan;33(1):12–4. [PubMed] [Google Scholar]
- 123.Lee IW, Ahn SK, Choi EH, Lee SH. Urticarial reaction following the inhalation of nicotine in tobacco smoke. Br J Dermatol. 1998 Mar;138(3):486–8. doi: 10.1046/j.1365-2133.1998.02130.x. [DOI] [PubMed] [Google Scholar]
- 124.Agency for Toxic Substances and Disease Registry. Atlanta, GA: US Department of Health and Human Services, Public Health Service; 2015. [2019-11-20]. Public Health Statement for Propylene Glycol. https://www.atsdr.cdc.gov/toxprofiles/tp189-c1-b.pdf. [Google Scholar]
- 125.Sarici G, Cinar S, Armutcu F, Altinyazar C, Koca R, Tekin NS. Oxidative stress in acne vulgaris. J Eur Acad Dermatol Venereol. 2010 Jul;24(7):763–7. doi: 10.1111/j.1468-3083.2009.03505.x. [DOI] [PubMed] [Google Scholar]
- 126.Mills CM, Peters TJ, Finlay AY. Does smoking influence acne? Clin Exp Dermatol. 1993 Mar;18(2):100–1. doi: 10.1111/j.1365-2230.1993.tb00986.x. [DOI] [PubMed] [Google Scholar]
- 127.Misery L. Nicotine effects on skin: are they positive or negative? Exp Dermatol. 2004 Nov;13(11):665–70. doi: 10.1111/j.0906-6705.2004.00274.x. [DOI] [PubMed] [Google Scholar]
- 128.Wait M. WebMD. 2014. [2019-07-25]. Why Tobacco Use May Make Heartburn Worse. https://www.webmd.com/heartburn-gerd/features/heartburn-tobacco-connection.
- 129.Mueller PD, Benowitz NL. Toxicologic causes of acute abdominal disorders. Emerg Med Clin North Am. 1989 Aug;7(3):667–82. [PubMed] [Google Scholar]
- 130.Williams M, Villarreal A, Bozhilov K, Lin S, Talbot P. Metal and silicate particles including nanoparticles are present in electronic cigarette cartomizer fluid and aerosol. PLoS One. 2013;8(3):e57987. doi: 10.1371/journal.pone.0057987. http://dx.plos.org/10.1371/journal.pone.0057987. [DOI] [PMC free article] [PubMed] [Google Scholar]
- 131.Olmedo P, Goessler W, Tanda S, Grau-Perez M, Jarmul S, Aherrera A, Chen R, Hilpert M, Cohen JE, Navas-Acien A, Rule AM. Metal concentrations in e-cigarette liquid and aerosol samples: the contribution of metallic coils. Environ Health Perspect. 2018 Feb 21;126(2):027010. doi: 10.1289/EHP2175. https://ehp.niehs.nih.gov/doi/full/10.1289/EHP2175?url_ver=Z39.88-2003&rfr_id=ori:rid:crossref.org&rfr_dat=cr_pub%3dpubmed. [DOI] [PMC free article] [PubMed] [Google Scholar]
- 132.Geiger A, Cooper J. Overview of Airborne Metals: Regulations, Exposure Limits, Health Effects, and Contemporary Research. Portland, OR: Cooper Environmental Services; 2010. [Google Scholar]
- 133.Aherrera A, Olmedo P, Grau-Perez M, Tanda S, Goessler W, Jarmul S, Chen R, Cohen JE, Rule AM, Navas-Acien A. The association of e-cigarette use with exposure to nickel and chromium: a preliminary study of non-invasive biomarkers. Environ Res. 2017 Nov;159:313–20. doi: 10.1016/j.envres.2017.08.014. [DOI] [PubMed] [Google Scholar]
- 134.Sato T, Shimosato T, Klinman DM. Silicosis and lung cancer: current perspectives. Lung Cancer (Auckl) 2018;9:91–101. doi: 10.2147/LCTT.S156376. doi: 10.2147/LCTT.S156376. [DOI] [PMC free article] [PubMed] [Google Scholar]
- 135.Palazzolo DL. Electronic cigarettes and vaping: a new challenge in clinical medicine and public health. A literature review. Front Public Health. 2013 Nov 18;1:56. doi: 10.3389/fpubh.2013.00056. doi: 10.3389/fpubh.2013.00056. [DOI] [PMC free article] [PubMed] [Google Scholar]
- 136.Hess CA, Olmedo P, Navas-Acien A, Goessler W, Cohen JE, Rule AM. E-cigarettes as a source of toxic and potentially carcinogenic metals. Environ Res. 2017 Jan;152:221–5. doi: 10.1016/j.envres.2016.09.026. http://europepmc.org/abstract/MED/27810679. [DOI] [PMC free article] [PubMed] [Google Scholar]
- 137.Dalton P, Soreth B, Maute C, Novaleski C, Banton M. Lack of respiratory and ocular effects following acute propylene glycol exposure in healthy humans. Inhal Toxicol. 2018 Feb;30(3):124–32. doi: 10.1080/08958378.2018.1470207. [DOI] [PubMed] [Google Scholar]
- 138.Jensen RP, Strongin RM, Peyton DH. Solvent chemistry in the electronic cigarette reaction vessel. Sci Rep. 2017 Feb 14;7:42549. doi: 10.1038/srep42549. doi: 10.1038/srep42549. [DOI] [PMC free article] [PubMed] [Google Scholar]
- 139.Occupational Safety and Health Administration. [2019-11-20]. 1910.1048 App C - Medical surveillance - Formaldehyde. https://www.osha.gov/laws-regs/regulations/standardnumber/1910/1910.1048AppC.
- 140.Cotta KI, Stephen CD, Mohammad NU. A review on the safety of inhalation of propylene glycol in e-cigarettes. Glob J Pharm Pharm Sci. 2017;2(2):1–2. doi: 10.19080/gjpps.2017.02.555584. [DOI] [Google Scholar]
- 141.Watson AY, Bates RR, Kennedy D. Air Pollution, the Automobile, and Public Health. Washington, DC: National Academies Press; 1988. Health effects of aldehydes and alcohols in mobile source emissions. [PubMed] [Google Scholar]
- 142.Kawanishi M, Matsuda T, Yagi T. Genotoxicity of formaldehyde: molecular basis of DNA damage and mutation. Front Environ Sci. 2014;2:36. doi: 10.3389/fenvs.2014.00036. [DOI] [Google Scholar]
- 143.Drugs. 2019. [2019-07-17]. Nicotine Side Effects. https://www.drugs.com/sfx/nicotine-side-effects.html#moreResources.
- 144.McLaughlin I, Dani JA, de Biasi M. Nicotine withdrawal. Curr Top Behav Neurosci. 2015;24:99–123. doi: 10.1007/978-3-319-13482-6_4. http://europepmc.org/abstract/MED/25638335. [DOI] [PMC free article] [PubMed] [Google Scholar]
- 145.Duell AK, Pankow JF, Peyton DH. Free-Base Nicotine Determination in Electronic Cigarette Liquids by 1H NMR Spectroscopy. Chem Res Toxicol. 2018 Jun 18;31(6):431–4. doi: 10.1021/acs.chemrestox.8b00097. http://europepmc.org/abstract/MED/29775302. [DOI] [PMC free article] [PubMed] [Google Scholar]
- 146.Henningfield J, Pankow J, Garrett B. Ammonia and other chemical base tobacco additives and cigarette nicotine delivery: issues and research needs. Nicotine Tob Res. 2004 Apr;6(2):199–205. doi: 10.1080/1462220042000202472. [DOI] [PubMed] [Google Scholar]
- 147.Center for Disease Control and Prevention. 2019. Nov 10, [2019-11-10]. Outbreak of Lung Injury Associated with the Use of E-Cigarette, or Vaping, Products. https://www.cdc.gov/tobacco/basic_information/e-cigarettes/severe-lung-disease.html.
- 148.Layden JE, Ghinai I, Pray I, Kimball A, Layer M, Tenforde M, Navon L, Hoots B, Salvatore PP, Elderbrook M, Haupt T, Kanne J, Patel MT, Saathoff-Huber L, King BA, Schier JG, Mikosz CA, Meiman J. Pulmonary Illness Related to E-Cigarette Use in Illinois and Wisconsin - Preliminary Report. N Engl J Med. 2019 Sep 6; doi: 10.1056/NEJMoa1911614. [DOI] [PubMed] [Google Scholar]
- 149.Davidson K, Brancato A, Heetderks P, Mansour W, Matheis E, Nario M, Rajagopalan S, Underhill B, Wininger J, Fox D. Outbreak of Electronic-Cigarette-Associated Acute Lipoid Pneumonia - North Carolina, July-August 2019. MMWR Morb Mortal Wkly Rep. 2019 Sep 13;68(36):784–6. doi: 10.15585/mmwr.mm6836e1. doi: 10.15585/mmwr.mm6836e1. [DOI] [PMC free article] [PubMed] [Google Scholar]
- 150.Henry TS, Kanne JP, Kligerman SJ. Imaging of vaping-associated lung disease. N Engl J Med. 2019 Oct 10;381(15):1486–7. doi: 10.1056/NEJMc1911995. [DOI] [PubMed] [Google Scholar]
Associated Data
This section collects any data citations, data availability statements, or supplementary materials included in this article.
Supplementary Materials
Supplementary Figure 1: Heat map of symptoms less frequently reported in forums along with their associated systems. The total number of posts for each symptom is shown on a log scale.
Supplementary Figure 2: Heat map of disorders less frequently reported in forums along with their associated systems. The total number of posts for each disorder is shown on a log scale.
Supplementary Table 1: Listing of all symptoms not included in heat map.
Supplementary Table 2: Listing of all linked symptoms by frequency.