

Summary
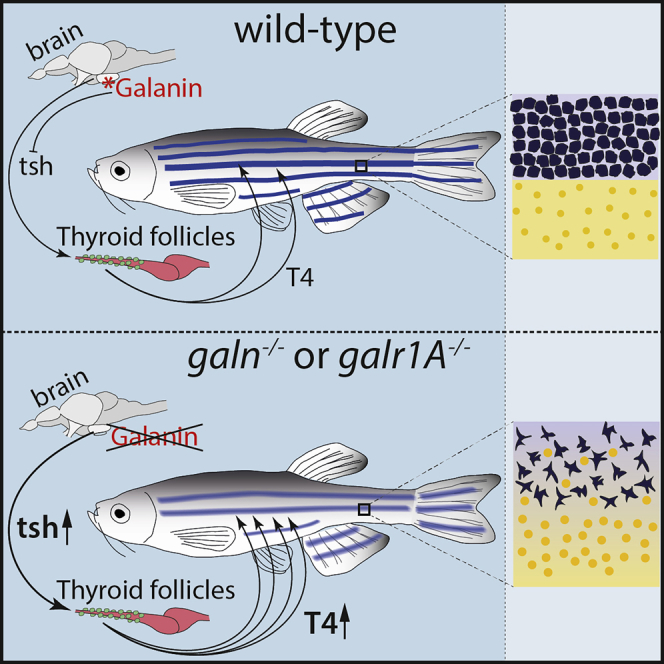
Color patterns are prominent features of many animals and are of high evolutionary relevance. In basal vertebrates, color patterns are composed of specialized pigment cells that arrange in multilayered mosaics in the skin. Zebrafish (Danio rerio), the preeminent model system for vertebrate color pattern formation, allows genetic screens as powerful approaches to identify novel functions in a complex biological system. Adult zebrafish display a series of blue and golden horizontal stripes, composed of black melanophores, silvery or blue iridophores, and yellow xanthophores. This stereotyped pattern is generated by self-organization involving direct cell contacts between all three types of pigment cells mediated by integral membrane proteins [1, 2, 3, 4, 5]. Here, we show that neuropeptide signaling impairs the striped pattern in a global manner. Mutations in the genes coding either for galanin receptor 1A (npm/galr1A) or for its ligand galanin (galn) result in fewer stripes, a pale appearance, and the mixing of cell types, thus resembling mutants with thyroid hypertrophy [6]. Zebrafish chimeras obtained by transplantations of npm/galr1A mutant blastula cells indicate that mutant pigment cells of all three types can contribute to a normal striped pattern in the appropriate host. However, loss of galr1A expression in a specific region of the brain is sufficient to cause the mutant phenotype in an otherwise wild-type fish. Increased thyroid hormone levels in mutant fish suggest that galanin signaling through Galr1A in the pituitary is an upstream regulator of the thyroid hormone pathway, which in turn promotes precise interactions of pigment cells during color pattern formation.
Keywords: color pattern formation, zebrafish, thyroid hormone, chimeras, galanin receptor 1A, galanin, neuropeptide signaling, melanophores, iridophores, xanthophores
Graphical Abstract
Highlights
-
•
Zebrafish stripes are generated by three types of self-organizing pigment cells
-
•
Galanin signaling through Galr1A impairs zebrafish stripe formation globally
-
•
Galr1A function in a specific brain region is required for pigment cell interactions
-
•
Galanin signaling functions to downregulate thyroid hormone levels
Eskova et al. show that the neuropeptide galanin functions in the zebrafish brain to regulate peripheral thyroid hormone levels. Mutations in either galanin or galr1A, one of its receptors, lead to elevated levels of T4 thyroid hormone resulting in an easily visible pigmentation phenotype due to impaired interactions between the pigment cells.
Results and Discussion
Stripe Formation in Zebrafish Is Mediated by Cell Autonomous as Well as Extrinsic Functions
The neuropeptide galanin is implicated in a wide range of seemingly unrelated functions in vertebrates, including energy metabolism and sleep homeostasis, food uptake, cognitive functions, and behavior [7]. These processes are all regulated multifactorially, and the precise role of galanin is difficult to ascertain. Here, we describe a function of galanin signaling via galanin receptor 1A in the zebrafish brain with a clear readout in a mutant color pattern of the adult fish.
In zebrafish, a large collection of mutants and an elaborate tool kit resulted in a rather deep understanding of the cellular and genetic bases of the intricate and protracted process of color pattern formation [8, 9]. Different receptor-ligand pairs regulate specification, proliferation, and maintenance of each pigment cell type [10, 11, 12, 13, 14, 15]. Interactions between the three different pigment cell types adjust the cell shapes of xanthophores and iridophores specific for the light and dark stripes and control the width of the stripes [1, 16, 17]. The precise superposition of the different pigment cells is a crucial hallmark of the pattern. These heterotypic interactions are mediated by integral membrane proteins such as adhesion molecules, a potassium channel, and gap junction components (connexins) [2, 3, 5, 18, 19]. These factors act cell-autonomously in pigment cells, as revealed in chimeras produced by blastula transplantations.
Extrinsic regulators of stripe formation include the horizontal myoseptum as a general anatomical pre-pattern crucial for the orientation of the stripes [1]. In addition, a small number of genes have been identified, which are presumably expressed in the tissues immediately adjacent to the pigment cells influencing their interactions. The zinc-finger protein basonuclin 2 (bnc2, encoded by bonaparte) affects iridophore and xanthophore survival and is detected in the hypodermis and along the myoseptae [20]. Dominant alleles of aquaporin3a (mau) affecting the pore permeability cause a spotted pattern when expressed in the tissue surrounding the pigment cells [21]. Mutations in idefix, which codes for the enzyme spermidine synthase, affect stripe width, presumably because spermidine acts as a cofactor for gap junctions and other channels [22]. In these instances, the mutant pigment cells are able to contribute to a normal pattern when placed into a wild-type environment in chimeric animals.
Three endocrine pathways have been implicated in the global control of pigment cell behavior during pigment pattern formation. Whereas agouti/melanocortin receptor signaling controls dorso-ventral counter shading [23], insulin and thyroid hormone signaling affect stripe formation. Insulin signaling needs to be specifically attenuated in melanophores by the sheddase Bace2 to ensure proper stripe formation [24]. Lack of thyroid hormone leads to an excess of melanophores, while xanthophores remain in a cryptic unpigmented state. An excess of thyroid hormone, in contrast, causes a reduction in melanophore numbers and the over-proliferation of yellow xanthophores. Transcriptional profiling of individual cells indicates that thyroid hormone promotes maturation of melanophores and xanthophores in distinct ways during the formation of the adult pattern [6, 25].
The npm Mutation Impairs Interactions between All Three Types of Pigment Cells
Here, we describe the recessive mutant nepomuk (npm), which appeared spontaneously in our wild-type stock. The fish have only two dark stripes flanking the first light stripe and a rudimentary third dark stripe ventrally (Figures 1E, 1F, and 1I). They display a shiny appearance due to a less pronounced transition of dense to loose iridophores at the boundaries between light and dark stripes (Figures 1A, 1B, 1E, and 1F). They also show a reduced melanophore density and increased xanthophore numbers (Figures 1C, 1G, and 1K–1M). Melanophores in the mutants appear pale due to the aggregation of melanosomes in the center of the cells; fully dispersed melanosomes show that the cells have a more stellate shape than wild-type melanophores (Figures 1C, 1G, and S1). Whereas xanthophores are not visible in early mutant larvae, ectopic compact xanthophores are present in the dark stripes in adults (Figures 1D and 1H). Figures 2A and 2B show the development of the stripes in npm mutants compared to wild-type fish of similar stages [26]; the mutants tend to reach those stages at a smaller body length. In the mutants, melanophores of the ventral dark stripe appear later, and iridophores are less densely organized covering larger regions dorsally and ventrally to the first light stripe. In double mutants of npm with pfeffer (csfr1ra), lacking xanthophores [27], or with shady (ltk), lacking iridophores [12], the remaining melanophores are almost evenly distributed (Figures 2C and 2D). In the respective, single mutants melanophores are clustered into spots, due to repulsive interactions between them and the other remaining pigment cell type [1]. These findings suggest impaired interactions in npm mutants between melanophores and both xanthophores and iridophores, whereas proliferation and spreading of iridophores and xanthophores across the body appear normal. Taken together, all three cell types seem to be affected in their heterotypic interactions, leading to a more diffuse pattern and a reduced number of stripes.
Figure 1.

The npm Mutation Impairs Interactions between Pigment Cells
(A–D) Wild-type adult zebrafish (A), magnified mid-trunk area (B), expanded melanophores (C), and detail of 1st ventral dark stripe in fixed specimen (D).
(E–H) npm adult mutant (E) with magnified mid-trunk area (F). The 2nd ventral dark stripe is underdeveloped (arrow in F). Melanophores appear contracted (G). Pigmented xanthophores appear in the 1st ventral dark stripe in fixed specimen (H; see also Figure S1).
(I and J) Number of dark stripes (I) in fish of comparable height (J) (mean ± SD, n = 10).
(K) Density of melanophores (mean ± SD, n = 10).
(L) Distance between melanophores in the 1st ventral stripe (median ± SD, n = 10).
(M) Density of xanthophores in the first light stripe (mean ± SD, n = 10).
Figure 2.

Pigment Pattern of npm during Development and in Double Mutants
(A) Wild-type iridophores appear as a dense sheet along the horizontal myoseptum (stages PB and PR); they spread dorsally and ventrally where they form secondary light stripes (stages J and J++) [3].
(B) In npm mutants iridophores fail to form compact sheets. Scale bars, 250 μm.
(C) pfe mutant (top panel) compared to npm;pfeffer double mutant.
(D) shd mutant (top panel) compared to npm;shd double mutant.
npm Function Is Not Required in Pigment Cells, but in the Brain
To test whether npm mutant pigment cells are competent in stripe formation, we created chimeras by blastomere transplantations from npm donor embryos into nac (mitfa);pfe (csf1ra);rse (ednrb1a) triple mutant hosts (Figures 3A1 and 3A2). The nac;pfe;rse mutants lack all melanophores and xanthophores as well as S-iridophores, which participate in stripe formation [1], therefore all the pigment cells in the chimeric fish must come from the npm donors. We observed that the npm pigment cells in the chimeric fish (5 of 34 transplants) could form a striped pattern with normal stripe width and sharp boundaries, contributing to at least three dark and three light stripes across the entire dorso-ventral extent (Figures 3A3 and 3A4). This indicates that the npm mutation affects the pigment cells indirectly, and npm-activity is not required in pigment cells.
Figure 3.

npm Function Is Not Required in Pigment Cells, but in the Brain
(A) Chimeric animals (A3, A4) derived from blastomere transplantations of npm donors (A1) into nac;pfe;rse hosts (A2).
(B) Blastomere transplantations of npm;Tg(ubi:Red) donors (B1) into wild-type hosts (B2). A chimeric animal is shown (B3).
(C) Fluorescent image of an open brain (outlined).
Surprisingly, when mutant npm blastomeres were transplanted into wild-type recipients, a few chimeras displayed a complete npm mutant phenotype throughout the body (Figure 3B3). This suggests that npm-derived tissue leads to a global alteration of the entire pattern in genetically wild-type fish. The frequency of fish displaying a complete mutant pattern depended on the numbers of transplanted npm cells. To assess which regions of the body were derived from the mutant donor cells, we transplanted a small number of blastomeres (∼30) of npm;Tg(ubi:Red) or npm; Tg(actin:GFP) donors into wild-type hosts. While most of the resulting fish looked normal (we did not analyze these wild-type looking fish for donor tissue), we obtained 5 chimeric animals (<1%) that showed a mutant phenotype in the entire body; all five fish had patches of labeled mutant donor tissue in the brain (Figure 3C), one of them additionally displayed labeled tissue in the liver. This indicates that npm activity is required in a specific small region in the brain.
npm Encodes Galanin Receptor 1a
We mapped the npm mutation to a 12 Mb region on chromosome 19 (corresponding to 14.5–25.5 Mb in GRCz11) (Figure S2A). Given the information that a CRISPR-mediated knockout of the galanin gene in zebrafish yielded a pigmentation phenotype similar to npm (Ajeet P. Singh and Mark C. Fishman, personal communication), we identified galr1A as a candidate gene responsible for the npm phenotype. Indeed, we found that the splice donor site at the end of exon1 of galr1A is disrupted in npm by a repetitive sequence element. This results in the activation of a cryptic splice site leading to a variant transcript lacking 63 bases at the end of the 1st exon. The 63 bases absent in the mutant transcript correspond to a deletion of 21 amino acids in the protein, predicted to coincide with the 5th transmembrane domain of the receptor (Figures S2B–S2D). This is expected to result in a complete loss of function.
We used CRISPR/Cas9 to generate a 4 base pair deletion in the 1st exon of galr1A, which results in a loss-of-function allele due to a frameshift and premature stop codon (Figure S2B). We also generated a 7 base pair deletion in galanin (Figure S2E). Both the galr1A and the galanin knockout alleles lead to a phenotype similar to npm, with only 3 stripes and reduced melanophore density (Figures 4A2, 4A4, S3B, and S3C). The galr1A k.o. allele does not complement npm (Figure 4A3).
Figure 4.

Galanin Receptor 1A Is Mutated in npm
(A) Phenotypes of npm (A1) and CRISPR-Cas9 induced frameshift mutations in galr1A (A2), galn (A4), and a trans-heterozygous fish galr1A/npm (A3) (see also Figures S2, S3, and S4).
(B) T4 thyroid hormone levels measured in wild-type, galn, and npm mutants (mean ± SD, n = 6 for WT, n = 5 for galn, n = 4 for npm).
(C–E) Relative transcript abundance for thyroglobulin (tg; C), thyroid-stimulating hormone (tshba; D), and thyrotropin-releasing hormone (trh; E) in the heads of galn (n = 8) and npm (n = 7) mutant fish compared to wild-type (n = 9). The plots depict the mean values (horizontal line), the first and third quartiles (box), and the lowest and highest values no further than 1.5 × IQR (interquartile range) from the hinge (whiskers); outliers are plotted as individual points (∗p < 0.09; ∗∗p < 0.05; ∗∗∗p < 0.01; n.s., not significant).
Galr1A is one of four paralogous receptors for the neuropeptide galanin in zebrafish [28]; however, the similarity of the loss-of-function phenotypes for both genes, galn and galr1A, indicates that galanin signaling via only one of these receptors, Galr1A, is responsible for the pigmentation defects we observe in the mutant fish.
Loss of Function of Either Galanin or Galnr1a Leads to Increased Thyroid Hormone Levels in Mutant Fish
In agreement with previously published reports [28, 29], we find that galanin and galr1A are expressed in the brain and (weakly) the intestine of zebrafish (Figure S3A). Together with our transplantation results, this suggests that galanin signaling through Galr1A functions in the brain, possibly by regulating endocrine pathways that in turn control pigment cell behavior.
Galanin has been implicated in the regulation of several endocrine pathways at the level of the hypothalamus and/or the pituitary gland [30], including the thyroid hormone pathway [31]. The reduction of melanophores and the increase of pigmented xanthophore numbers in npm mutants resembles the phenotype of the hyperthyroid zebrafish mutant opallus and the phenotype resulting from oral administration of T3 hormone [6, 32]. We find that the loss of either galanin or Galr1A function leads to a transcriptional upregulation of the thyroid hormone precursor thyroglobulin and to increased levels of T4 thyroid hormone (Figures 4B and 4C). To test at what level galanin signaling regulates thyroid hormone production, we analyzed the transcript levels of the upstream regulators thyrotropin-releasing hormone (trh) and thyroid stimulating hormone (tsh). While the expression of both is increased in galn mutants, in npm, trh levels are not significantly altered and the significance of tsh upregulation is only weak (Figures 4D and 4E). In larvae, galn is expressed in clusters of cells in the anterior hypothalamus [33], while galr1A is more widely expressed in the head [28]. Given the strong expression of both genes in the brain of adult fish (Figure S3A), we suggest that galanin signaling functions as a negative regulator of thyroid hormone production though Galr1A at the level of the pituitary gland or the hypothalamus. Thyroid hormone levels were shown to affect differentiation of melanophores and xanthophores in different ways [6, 25]. Lower levels of the hormone reduce terminal differentiation of melanophores and re-pigmentation of xanthophores during larval development [25]. Higher hormone levels, as they occur in the mutants described here, drive melanophores into premature terminal differentiation [6, 25], thereby restricting their numbers and influencing their interactions with other pigment cells.
In zebrafish, the loss of galr1A results in a similar phenotype as the loss of its ligand galanin. The paralogous receptors, Galr1B, Galr2A, and Gal2B, apparently cannot compensate for the loss of Galr1A with respect to thyroid hormone signaling and pigment pattern formation, and their expression is mostly not altered upon loss of function of galanin or galr1A (Figure S4A). They might have other functions, which we did not detect in our mutants. Alternatively, other ligands might exist in zebrafish, not yet identified and annotated in the genome. In mammals, galanin-like peptides have been identified that show only limited sequence similarity to galanin but signal via some of the same receptors [34, 35]. A likely candidate for a galanin-like peptide in zebrafish is si:rp71-1c10.8, predicted to code for a peptide with a 13 amino acid N terminus identical to Galn (Figure S3D).
Insulin signaling is another endocrine pathway known to affect pigment cell development and behavior: overactive insulin b signaling in melanophores results in over-proliferation and hyperdendritic cells [24]. While we see similar melanophore shape defects in npm mutants (Figure S1), we detected no change of insb expression in the mutants (Figure S4B). Similarly, no change of expression is observed for pomca, the precursor for melanocortin receptors agonists (Figure S4B).
Presently, we can only speculate about the role Galr1A signaling plays in the interaction between pigment cells, which is required for producing the precise shaping and superposition of all three pigment cell types during stripe formation. The npm phenotype does not resemble that of any known pigmentation gene involved in these heterotypic interactions. The mixing of melanophores and xanthophores in the similar opallus mutants and the loss of stripes has been suggested to bear some resemblance to the color pattern of a species closely related to zebrafish, Danio albolineatus [6]. It seems possible that regulation by global hormonal control might be involved in the acquisition of novel patterns in evolution, similar to what has been proposed for endothelin signaling [36, 37]. The involvement of galanin signaling in color pattern formation in zebrafish may open up new approaches to understand the molecular details of the function of this neuropeptide.
STAR★Methods
Key Resources Table
| REAGENT or RESOURCE | SOURCE | IDENTIFIER |
|---|---|---|
| Chemicals, Peptides, and Recombinant Proteins | ||
| (-) Epinephrine | Sigma-Aldrich | Cat.-No. E4250 |
| Tricaine Methane Sulphonate | PHARMAQ, Hampshire, UK | N/A |
| Trizol | ThermoFisher Scientific | Cat.-No. 15596018 |
| Critical Commercial Assays | ||
| DNeasy Blood & Tissue Kit | QIAGEN | Cat.-No. 69504 |
| Fish Thyroxine, T4 ELISA Kit | MyBioSource | Cat.-No. MBS1601699 |
| TruSeq DNA Nano Kit | Illumina | Cat.-No. 20015964 |
| Deposited Data | ||
| WGS mapping data | this study | ENA: PRJEB32642 |
| Experimental Models: Organisms/Strains | ||
| TÜ | ZFIN: ZDB-GENO-990623-3 | |
| WIK | ZFIN: ZDB-GENO-010531-2 | |
| nacW2 | [38] | ZFIN: ZDB-ALT-990423-22 |
| pfetm236b | [27] | ZFIN: ZDB-ALT-980203-1613 |
| rsetLF802 | [13] | ZFIN: ZDB-ALT-140818-5 |
| shdj9s1 | [12] | ZFIN: ZDB-ALT-060909-2 |
| Tg(actb:GFP) | K. Poss | N/A |
| Tg(ubb:LOX2272-LOXP-RFP-LOX2272-CFP-LOXP-YFP), “zebrabow” | [39] | ZFIN: ZDB-TGCONSTRUCT-130816-1 |
| galnt12ae(galnk.o.) | this study | N/A |
| galr1At14ae(galr1Ak.o.) | this study | N/A |
| galr1Atnpm(npm) | this study | N/A |
| Oligonucleotides | ||
| s. Table S1 | N/A | |
| Recombinant DNA | ||
| DR274 | [40] | AddGene #42250 |
| Software and Algorithms | ||
| bcl2fastq v2.16.0.10 | Illumina | N/A |
| FastQC | Babraham Bioinformatics | http://www.bioinformatics.babraham.ac.uk/projects/fastqc/ |
| ImageJ | NIH | https://imagej.nih.gov/ij/ |
| nCounter | [41] | http://www.nanostring.com/ |
| R | [42] | https://www.R-project.org/ |
| SNPTrack | [43] | http://genetics.bwh.harvard.edu/snptrack/ |
Lead Contact and Materials Availability
Requests for resources and reagents should be directed to and will be fulfilled by the Lead Contact Uwe Irion (uwe.irion@tuebingen.mpg.de). Plasmids and mutant zebrafish lines generated in this study are available upon request.
Experimental Model and Subject Details
Zebrafish were maintained and bred under standard conditions as described [44]. The following genotypes were used: TÜ and WIK wild-type strains; nacrew2 [45], pfeffertm236b [27], rosetLF802 [13], shadyj9s1 [12]. Tg(ubb:LOX2272-LOXP-RFP-LOX2272-CFP-LOXP-YFP), zebrabow, referred to as Tg(ubi:Red) (transgenic line expressing mRFP under control of 3,5 kb fragment of the ubiquitin b promoter, when not co-expressed with Cre-recombinase) [46]. Tg(actb:GFP) (the transgenic line expressing EGFP under the control of a 5.3 kb fragment of the zebrafish β-actin promoter (bpeGFP) was a gift of K. Poss (unpublished).
All animal experiments were performed in accordance with the rules of the State of Baden-Württemberg, Germany, and approved by the Regierungspräsidium Tübingen.
Method Details
Live imaging
Fish were anesthetized with 0.004% Tricaine. Metamorphic and post-metamorphic fish were measured and staged according to [26], treated with 1mg/ml (-) Epinephrine to cause pigment granule aggregation and photographed with a Leica M205 FA stereomicroscope with a Leica DCF300 FX camera using the software LAS V4.1 to allow multifocus images. Adult fish were anaesthetized as above and photographed with a Canon EOS 5D MarkII camera and a Macro 100 or MP-E 65 objectives. Images were processed with Adobe Photoshop and Fiji (ImageJ) [40].
Transplantations
Blastula transplantations [47] of either 30 or > 100 blastomeres from donor to host embryos at the 1000-cell blastula stage were used to create chimeric animals. Upon transplantation of npm; ubi:Red blastomeres the chimeric animals displaying an npm-like phenotype were dissected and their tissues screened under the fluorescent Leica M205 FA stereomicroscope to detect RFP signal.
Mutant mapping
Offspring of a cross between npm/WIK heterozygous fish were sorted according to phenotype (npm or wild-type). DNA from finclips of 96 mutant and wild-type fish was isolated using DNeasy Blood and Tissue kit (QIAGEN), pooled, sheared by Covaris to ∼400 bases length. Libraries were constructed using Truseq Nano kit (Illumina) and re-sequenced on HISeq3000. Sequence de-multiplexing and adaptor trimming was done by bcl2fastq v2.16.0.10 (Illumina), FastQC (Babraham Bioinformatics) was used for read quality control. The region harboring the mutation was mapped with SNPTrack [43]. Data available at ENA: PRJEB32642.
Generation of galr1A and galn loss-of-function alleles
CRISPR-Cas9 was used as described [38, 48] for targeted indel induction and generating of loss-of-function alleles of galr1A and galanin. Oligonucleotide pairs galr1A_CRISPR1 and −2, and galn_CRISPR1 and −2 (Table S1) were annealed and cloned into pDR274 to create the template vectors for in vitro transcription of the sgRNAs with T7 RNA-Polymerase. Cas9 mRNA was produced as described previously [19]. 2-4 nL of 200 ng/μl Cas9 mRNA and 15 ng/μl sgRNA were co-injected into one-cell stage embryos. The mosaic fish with pigmentation defects were outcrossed, sequenced with primers galr1A_seq_f and –r and galn_seq_f and –r, and used to establish mutants stocks.
Pigment cell counts
The mid-trunk areas of adult fish were photographed with a Canon EOS 5D MarkII camera and a Macro MP-E 65 objective so that individual melanophores and xanthophores are seen in the first light stripe and the first ventral dark stripe. Individual cells were counted using the multi-point tool of ImageJ over the areas 1 −3 mm2, and the distances between neighboring cells were calculated using Delaunay-Voronoi plugin (https://imagej.net/Delaunay_Voronoi). For the visualization of xanthophores whole animals were fixed in a mixture of 4% formaldehyde and 4% glutaraldehyde in 0.5 x PBS over night at 4°C. The pictures were taken under blue light illumination with a Leica Camera DFC300FX mounted on a Leica MZ1 stereomicroscope.
RT-PCR and sequencing of galr1A trancripts
Three month old female fish (TÜ) were dissected and brain, eye, skin, liver, ovary, gut, and muscle tissues were collected in TRIzol (Life Technologies). cDNA was produced using SuperScript II reverse transcriptase (Thermo Fisher Scientific). galr1A cDNA fragments were amplified with primers galr1A_cdna_f and –r, and galn cDNA fragments were amplified with primers galn_cdna_f and –r (Table S1).
For comparison of mutant and wild-type galr1A transcripts, RNA was extracted from the brains of npm mutants and heterozygous siblings with TRIzol (Life Technologies) and cDNA was produced using SuperScript II reverse transcriptase (Thermo Fisher Scientific). galr1A cDNA fragments were amplified with primers galr1A_cdna_f and –r (Table S1), subcloned into the vector pGEM-T-Easy (Clontech) and sequenced with M13f and M13r universal primers.
Expression profiling
Three month old fish (n = 9 for TÜ, n = 8 for galnk.o., n = 7 for npm) were decapitated, the heads were homogenized and RNA extracted with Trizol (Life Technologies). Direct expression measurement was done using the Nanostring technology [39, 41] by Proteros GmbH (Planegg, Germany). See Table S2 for the targeted transcripts and probe target sequences. The targets-specific fluorescent counts were normalized using nCounter [39] based on positive control and housekeeping genes (actb2, gapdh). Statistical analysis of the data was performed and p values were calculated using unpaired two-tailed t tests.
T4 quantification
Thyroid hormone (thyroxine, T4) levels were quantified from tissue homogenates (n = 6 for TÜ, n = 5 for galnk.o., n = 4 for npm) using the ’Fish Thyroxine, T4 ELISA Kit’ from MyBioSource Inc.. Experiments were performed according to the manufacturer’s instructions. The data were analyzed with the elisaanalysis.com/app. p values were calculated using unpaired two-tailed t tests.
Quantification and Statistical Analysis
Statistical analysis and plotting of the data was carried out using R version 3.5.0 [42].
Data and Code Availability
The dataset generated during this study is available at The European Nucleotide Archive (ENA) accession number: PRJEB32642.
Acknowledgments
We thank Ajeet P. Singh and Mark C. Fishman for notifying us of the pigmentation phenotype of galanin knock out alleles. We thank Brigitte Walderich and Hans-Martin Maischein for assistance with the blastomere transplantations. This work was supported by an ERC Advanced Grant “Danio pattern” (694289) and the Max Planck Society, Germany.
Author Contributions
All authors were involved in the design of the experiments. A.E., H.G.F., and U.I. performed the experiments and analyzed the data. A.E. and H.G.F. made the figures with contributions from U.I. C.N.-V. and U.I. wrote the manuscript with the help of A.E. C.N.-V. acquired funding.
Declaration of Interests
The authors declare no competing interests.
Published: January 2, 2020
Footnotes
Supplemental Information can be found online at https://doi.org/10.1016/j.cub.2019.11.033.
Supplemental Information
References
- 1.Frohnhöfer H.G., Krauss J., Maischein H.M., Nüsslein-Volhard C. Iridophores and their interactions with other chromatophores are required for stripe formation in zebrafish. Development. 2013;140:2997–3007. doi: 10.1242/dev.096719. [DOI] [PMC free article] [PubMed] [Google Scholar]
- 2.Iwashita M., Watanabe M., Ishii M., Chen T., Johnson S.L., Kurachi Y., Okada N., Kondo S. Pigment pattern in jaguar/obelix zebrafish is caused by a Kir7.1 mutation: implications for the regulation of melanosome movement. PLoS Genet. 2006;2:e197. doi: 10.1371/journal.pgen.0020197. [DOI] [PMC free article] [PubMed] [Google Scholar]
- 3.Maderspacher F., Nüsslein-Volhard C. Formation of the adult pigment pattern in zebrafish requires leopard and obelix dependent cell interactions. Development. 2003;130:3447–3457. doi: 10.1242/dev.00519. [DOI] [PubMed] [Google Scholar]
- 4.Singh A.P., Nüsslein-Volhard C. Zebrafish stripes as a model for vertebrate colour pattern formation. Curr. Biol. 2015;25:R81–R92. doi: 10.1016/j.cub.2014.11.013. [DOI] [PubMed] [Google Scholar]
- 5.Watanabe M., Iwashita M., Ishii M., Kurachi Y., Kawakami A., Kondo S., Okada N. Spot pattern of leopard Danio is caused by mutation in the zebrafish connexin41.8 gene. EMBO Rep. 2006;7:893–897. doi: 10.1038/sj.embor.7400757. [DOI] [PMC free article] [PubMed] [Google Scholar]
- 6.McMenamin S.K., Bain E.J., McCann A.E., Patterson L.B., Eom D.S., Waller Z.P., Hamill J.C., Kuhlman J.A., Eisen J.S., Parichy D.M. Thyroid hormone-dependent adult pigment cell lineage and pattern in zebrafish. Science. 2014;345:1358–1361. doi: 10.1126/science.1256251. [DOI] [PMC free article] [PubMed] [Google Scholar]
- 7.Hökfelt T., Tatemoto K. Galanin--25 years with a multitalented neuropeptide. Cell. Mol. Life Sci. 2008;65:1793–1795. doi: 10.1007/s00018-008-8152-9. [DOI] [PMC free article] [PubMed] [Google Scholar]
- 8.Irion U., Singh A.P., Nüsslein-Volhard C. The developmental genetics of vertebrate color pattern formation: lessons from zebrafish. Curr. Top. Dev. Biol. 2016;117:141–169. doi: 10.1016/bs.ctdb.2015.12.012. [DOI] [PubMed] [Google Scholar]
- 9.Nüsslein-Volhard C., Singh A.P. How fish color their skin: a paradigm for development and evolution of adult patterns: multipotency, plasticity, and cell competition regulate proliferation and spreading of pigment cells in Zebrafish coloration. BioEssays. 2017;39 doi: 10.1002/bies.201600231. [DOI] [PubMed] [Google Scholar]
- 10.Dooley C.M., Mongera A., Walderich B., Nüsslein-Volhard C. On the embryonic origin of adult melanophores: the role of ErbB and Kit signalling in establishing melanophore stem cells in zebrafish. Development. 2013;140:1003–1013. doi: 10.1242/dev.087007. [DOI] [PubMed] [Google Scholar]
- 11.Fadeev A., Mendoza-Garcia P., Irion U., Guan J., Pfeifer K., Wiessner S., Serluca F., Singh A.P., Nüsslein-Volhard C., Palmer R.H. ALKALs are in vivo ligands for ALK family receptor tyrosine kinases in the neural crest and derived cells. Proc. Natl. Acad. Sci. USA. 2018;115:E630–E638. doi: 10.1073/pnas.1719137115. [DOI] [PMC free article] [PubMed] [Google Scholar]
- 12.Lopes S.S., Yang X., Müller J., Carney T.J., McAdow A.R., Rauch G.J., Jacoby A.S., Hurst L.D., Delfino-Machín M., Haffter P. Leukocyte tyrosine kinase functions in pigment cell development. PLoS Genet. 2008;4:e1000026. doi: 10.1371/journal.pgen.1000026. [DOI] [PMC free article] [PubMed] [Google Scholar]
- 13.Parichy D.M., Mellgren E.M., Rawls J.F., Lopes S.S., Kelsh R.N., Johnson S.L. Mutational analysis of endothelin receptor b1 (rose) during neural crest and pigment pattern development in the zebrafish Danio rerio. Dev. Biol. 2000;227:294–306. doi: 10.1006/dbio.2000.9899. [DOI] [PubMed] [Google Scholar]
- 14.Parichy D.M., Rawls J.F., Pratt S.J., Whitfield T.T., Johnson S.L. Zebrafish sparse corresponds to an orthologue of c-kit and is required for the morphogenesis of a subpopulation of melanocytes, but is not essential for hematopoiesis or primordial germ cell development. Development. 1999;126:3425–3436. doi: 10.1242/dev.126.15.3425. [DOI] [PubMed] [Google Scholar]
- 15.Parichy D.M., Turner J.M. Temporal and cellular requirements for Fms signaling during zebrafish adult pigment pattern development. Development. 2003;130:817–833. doi: 10.1242/dev.00307. [DOI] [PubMed] [Google Scholar]
- 16.Mahalwar P., Singh A.P., Fadeev A., Nüsslein-Volhard C., Irion U. Heterotypic interactions regulate cell shape and density during color pattern formation in zebrafish. Biol. Open. 2016;5:1680–1690. doi: 10.1242/bio.022251. [DOI] [PMC free article] [PubMed] [Google Scholar]
- 17.Singh A.P., Schach U., Nüsslein-Volhard C. Proliferation, dispersal and patterned aggregation of iridophores in the skin prefigure striped colouration of zebrafish. Nat. Cell Biol. 2014;16:607–614. doi: 10.1038/ncb2955. [DOI] [PubMed] [Google Scholar]
- 18.Eom D.S., Inoue S., Patterson L.B., Gordon T.N., Slingwine R., Kondo S., Watanabe M., Parichy D.M. Melanophore migration and survival during zebrafish adult pigment stripe development require the immunoglobulin superfamily adhesion molecule Igsf11. PLoS Genet. 2012;8:e1002899. doi: 10.1371/journal.pgen.1002899. [DOI] [PMC free article] [PubMed] [Google Scholar]
- 19.Irion U., Frohnhöfer H.G., Krauss J., Çolak Champollion T., Maischein H.M., Geiger-Rudolph S., Weiler C., Nüsslein-Volhard C. Gap junctions composed of connexins 41.8 and 39.4 are essential for colour pattern formation in zebrafish. eLife. 2014;3:e05125. doi: 10.7554/eLife.05125. [DOI] [PMC free article] [PubMed] [Google Scholar]
- 20.Patterson L.B., Parichy D.M. Interactions with iridophores and the tissue environment required for patterning melanophores and xanthophores during zebrafish adult pigment stripe formation. PLoS Genet. 2013;9:e1003561. doi: 10.1371/journal.pgen.1003561. [DOI] [PMC free article] [PubMed] [Google Scholar]
- 21.Eskova A., Chauvigné F., Maischein H.M., Ammelburg M., Cerdà J., Nüsslein-Volhard C., Irion U. Gain-of-function mutations in Aqp3a influence zebrafish pigment pattern formation through the tissue environment. Development. 2017;144:2059–2069. doi: 10.1242/dev.143495. [DOI] [PMC free article] [PubMed] [Google Scholar]
- 22.Frohnhöfer H.G., Geiger-Rudolph S., Pattky M., Meixner M., Huhn C., Maischein H.M., Geisler R., Gehring I., Maderspacher F., Nüsslein-Volhard C., Irion U. Spermidine, but not spermine, is essential for pigment pattern formation in zebrafish. Biol. Open. 2016;5:736–744. doi: 10.1242/bio.018721. [DOI] [PMC free article] [PubMed] [Google Scholar]
- 23.Cal L., Suarez-Bregua P., Comesaña P., Owen J., Braasch I., Kelsh R., Cerdá-Reverter J.M., Rotllant J. Countershading in zebrafish results from an Asip1 controlled dorsoventral gradient of pigment cell differentiation. Sci. Rep. 2019;9:3449. doi: 10.1038/s41598-019-40251-z. [DOI] [PMC free article] [PubMed] [Google Scholar]
- 24.Zhang Y.M., Zimmer M.A., Guardia T., Callahan S.J., Mondal C., Di Martino J., Takagi T., Fennell M., Garippa R., Campbell N.R. Distant insulin signaling regulates vertebrate pigmentation through the sheddase Bace2. Dev. Cell. 2018;45:580–594. doi: 10.1016/j.devcel.2018.04.025. [DOI] [PMC free article] [PubMed] [Google Scholar]
- 25.Saunders L.M., Mishra A.K., Aman A.J., Lewis V.M., Toomey M.B., Packer J.S., Qiu X., McFaline-Figueroa J.L., Corbo J.C., Trapnell C., Parichy D.M. Thyroid hormone regulates distinct paths to maturation in pigment cell lineages. eLife. 2019;8:e45181. doi: 10.7554/eLife.45181. [DOI] [PMC free article] [PubMed] [Google Scholar]
- 26.Parichy D.M., Elizondo M.R., Mills M.G., Gordon T.N., Engeszer R.E. Normal table of postembryonic zebrafish development: staging by externally visible anatomy of the living fish. Dev. Dyn. 2009;238:2975–3015. doi: 10.1002/dvdy.22113. [DOI] [PMC free article] [PubMed] [Google Scholar]
- 27.Odenthal J., Rossnagel K., Haffter P., Kelsh R.N., Vogelsang E., Brand M., van Eeden F.J., Furutani-Seiki M., Granato M., Hammerschmidt M. Mutations affecting xanthophore pigmentation in the zebrafish, Danio rerio. Development. 1996;123:391–398. doi: 10.1242/dev.123.1.391. [DOI] [PubMed] [Google Scholar]
- 28.Li L., Wei S., Huang Q., Feng D., Zhang S., Liu Z. A novel galanin receptor 1a gene in zebrafish: tissue distribution, developmental expression roles in nutrition regulation. Comp. Biochem. Physiol. B Biochem. Mol. Biol. 2013;164:159–167. doi: 10.1016/j.cbpb.2012.12.004. [DOI] [PubMed] [Google Scholar]
- 29.Förster D., Arnold-Ammer I., Laurell E., Barker A.J., Fernandes A.M., Finger-Baier K., Filosa A., Helmbrecht T.O., Kölsch Y., Kühn E. Genetic targeting and anatomical registration of neuronal populations in the zebrafish brain with a new set of BAC transgenic tools. Sci. Rep. 2017;7:5230. doi: 10.1038/s41598-017-04657-x. [DOI] [PMC free article] [PubMed] [Google Scholar]
- 30.Merchenthaler I. Galanin and the neuroendocrine axes. Exp. Suppl. 2010;102:71–85. doi: 10.1007/978-3-0346-0228-0_7. [DOI] [PubMed] [Google Scholar]
- 31.Seth A., Stanley S., Dhillo W., Murphy K., Ghatei M., Bloom S. Effects of galanin-like peptide on food intake and the hypothalamo-pituitary-thyroid axis. Neuroendocrinology. 2003;77:125–131. doi: 10.1159/000068648. [DOI] [PubMed] [Google Scholar]
- 32.Guillot R., Muriach B., Rocha A., Rotllant J., Kelsh R.N., Cerdá-Reverter J.M. Thyroid hormones regulate zebrafish melanogenesis in a gender-specific manner. PLoS ONE. 2016;11:e0166152. doi: 10.1371/journal.pone.0166152. [DOI] [PMC free article] [PubMed] [Google Scholar]
- 33.Chen S., Reichert S., Singh C., Oikonomou G., Rihel J., Prober D.A. Light-dependent regulation of sleep and wake states by prokineticin 2 in zebrafish. Neuron. 2017;95:153–168. doi: 10.1016/j.neuron.2017.06.001. [DOI] [PMC free article] [PubMed] [Google Scholar]
- 34.Lang R., Berger A., Santic R., Geisberger R., Hermann A., Herzog H., Kofler B. Pharmacological and functional characterization of galanin-like peptide fragments as potent galanin receptor agonists. Neuropeptides. 2005;39:179–184. doi: 10.1016/j.npep.2004.12.015. [DOI] [PubMed] [Google Scholar]
- 35.Ohtaki T., Kumano S., Ishibashi Y., Ogi K., Matsui H., Harada M., Kitada C., Kurokawa T., Onda H., Fujino M. Isolation and cDNA cloning of a novel galanin-like peptide (GALP) from porcine hypothalamus. J. Biol. Chem. 1999;274:37041–37045. doi: 10.1074/jbc.274.52.37041. [DOI] [PubMed] [Google Scholar]
- 36.Spiewak J.E., Bain E.J., Liu J., Kou K., Sturiale S.L., Patterson L.B., Diba P., Eisen J.S., Braasch I., Ganz J., Parichy D.M. Evolution of Endothelin signaling and diversification of adult pigment pattern in Danio fishes. PLoS Genet. 2018;14:e1007538. doi: 10.1371/journal.pgen.1007538. [DOI] [PMC free article] [PubMed] [Google Scholar]
- 37.Irion U., Nüsslein-Volhard C. The identification of genes involved in the evolution of color patterns in fish. Curr. Opin. Genet. Dev. 2019;57:31–38. doi: 10.1016/j.gde.2019.07.002. [DOI] [PMC free article] [PubMed] [Google Scholar]
- 38.Hwang W.Y., Fu Y., Reyon D., Maeder M.L., Tsai S.Q., Sander J.D., Peterson R.T., Yeh J.R., Joung J.K. Efficient genome editing in zebrafish using a CRISPR-Cas system. Nat. Biotechnol. 2013;31:227–229. doi: 10.1038/nbt.2501. [DOI] [PMC free article] [PubMed] [Google Scholar]
- 39.Kulkarni M.M. Digital multiplexed gene expression analysis using the NanoString nCounter system. Curr. Protoc. Mol. Biol. 2011;Chapter 25:Unit25.B10. doi: 10.1002/0471142727.mb25b10s94. [DOI] [PubMed] [Google Scholar]
- 40.Schindelin J., Arganda-Carreras I., Frise E., Kaynig V., Longair M., Pietzsch T., Preibisch S., Rueden C., Saalfeld S., Schmid B. Fiji: an open-source platform for biological-image analysis. Nat. Methods. 2012;9:676–682. doi: 10.1038/nmeth.2019. [DOI] [PMC free article] [PubMed] [Google Scholar]
- 41.Geiss G.K., Bumgarner R.E., Birditt B., Dahl T., Dowidar N., Dunaway D.L., Fell H.P., Ferree S., George R.D., Grogan T. Direct multiplexed measurement of gene expression with color-coded probe pairs. Nat. Biotechnol. 2008;26:317–325. doi: 10.1038/nbt1385. [DOI] [PubMed] [Google Scholar]
- 42.R Core Team . R Foundation for Statistical Computing; 2018. R: A Language and Environment for Statistical Computing. [Google Scholar]
- 43.Leshchiner I., Alexa K., Kelsey P., Adzhubei I., Austin-Tse C.A., Cooney J.D., Anderson H., King M.J., Stottmann R.W., Garnaas M.K. Mutation mapping and identification by whole-genome sequencing. Genome Res. 2012;22:1541–1548. doi: 10.1101/gr.135541.111. [DOI] [PMC free article] [PubMed] [Google Scholar]
- 44.Brand M., Granato M., Nüsslein-Volhard C. Keeping and raising zebrafish. In: Nüsslein-Volhard C., Dahm R., editors. Zebrafish: A Practical Approach. Oxford University Press; 2002. [Google Scholar]
- 45.Lister J.A., Robertson C.P., Lepage T., Johnson S.L., Raible D.W. nacre encodes a zebrafish microphthalmia-related protein that regulates neural-crest-derived pigment cell fate. Development. 1999;126:3757–3767. doi: 10.1242/dev.126.17.3757. [DOI] [PubMed] [Google Scholar]
- 46.Pan Y.A., Freundlich T., Weissman T.A., Schoppik D., Wang X.C., Zimmerman S., Ciruna B., Sanes J.R., Lichtman J.W., Schier A.F. Zebrabow: multispectral cell labeling for cell tracing and lineage analysis in zebrafish. Development. 2013;140:2835–2846. doi: 10.1242/dev.094631. [DOI] [PMC free article] [PubMed] [Google Scholar]
- 47.Nüsslein-Volhard C., Dahm R., editors. Zebrafish: A Practical Approach. Oxford University Press; 2002. [Google Scholar]
- 48.Irion U., Krauss J., Nüsslein-Volhard C. Precise and efficient genome editing in zebrafish using the CRISPR/Cas9 system. Development. 2014;141:4827–4830. doi: 10.1242/dev.115584. [DOI] [PMC free article] [PubMed] [Google Scholar]
Associated Data
This section collects any data citations, data availability statements, or supplementary materials included in this article.
Supplementary Materials
Data Availability Statement
The dataset generated during this study is available at The European Nucleotide Archive (ENA) accession number: PRJEB32642.