Abstract
The determination of the speciation of ions and molecules in supercritical aqueous fluids under pressure is critical to understanding their mass transport in the Earth’s interior. Unfortunately, there is no experimental technique yet available to directly characterize species dissolved in water at extreme conditions. Here we present a strategy, based on first-principles simulations, to determine ratios of Raman scattering cross-sections of aqueous species under extreme conditions, thus providing a key quantity that can be used, in conjunction with Raman measurements, to predict chemical speciation in aqueous fluids. Due to the importance of the Earth’s carbon cycle, we focus on carbonate and bicarbonate ions. Our calculations up to 11 GPa and 1000 K indicate a higher concentration of bicarbonates in water than previously considered at conditions relevant to the Earth’s upper mantle, with important implications for the transport of carbon in aqueous fluids in the Earth’s interior.
Subject terms: Raman spectroscopy, Density functional theory, Molecular dynamics
The determination of the speciation of ions and molecules in supercritical aqueous fluids under pressure is key to understanding their mass transport in the Earth’s interior. Here the authors present a strategy based on ab-initio molecular dynamics to determine the speciation of carbonates in aqueous fluids.
Introduction
The carbon cycle in the atmosphere and biosphere has important consequences for the Earth’s climate and thus is a topic of intense investigation in many fields of science, including chemistry, environmental science, and geoscience1,2. On the Earth, carbon is not only found in near-surface reservoirs, but it is also stored in the interior. In fact, >90% of the Earth’s carbon is buried in the Earth’s interior3, and the carbon cycle in the deep Earth greatly influences the carbon budget near the surface, with a substantial impact on global climate change and human energy consumption4. After decades of study, our knowledge of the global carbon cycle in the atmosphere, oceans, and the shallow crust has improved considerably; however, relatively little is known about deep carbon reservoirs4,5. Water, an important component of geofluids in the Earth’s crust and mantle, may carry a significant amount of carbon, but its dissolved forms in aqueous geofluids are still poorly known, thus limiting our overall understanding of mass transport of carbon in the Earth. This lack of knowledge is due to experimental difficulties in measuring which species are present in C–H–O fluids at extreme conditions, as well as to the use, on the theoretical side, of simplified models6,7. For example, C–H–O fluids at the conditions of the Earth’s interior have often been modeled as mixtures of neutral gas molecules (e.g., refs. 8,9). However, recent studies pointed out the importance of chemical reactions occurring in deep aqueous fluids, involving the presence of ionic products10–12; for example, using first-principles simulations we recently suggested that the molecular CO2(aq) species may completely convert into solvated carbonate and bicarbonate ions in water-rich fluids at high temperature and pressure13.
At present, the most used experimental tool to investigate chemical speciation in C–H–O fluids under extreme conditions is Raman spectroscopy14. The vibrational frequencies obtained from Raman spectra are used as fingerprints to identify molecules or ions, and in principle the concentration of chemical species may be obtained from vibrational peak intensities. Indeed, the concentration of a given species (Ci) is proportional to the corresponding Raman intensity Ii = γiCi, where γi is the Raman scattering cross section. However, under extreme conditions, the variation of γi with pressure (P) and temperature (T) is unknown; hence the concentration of chemical species may not be inferred from Raman peak intensities. Several estimates of the dependence of the Raman cross-sections of aqueous solutions at high P (HP) and high T (HT) have been reported in the literature; these estimates are not only controversial but in some cases they provide contradicting results. Based on geochemical models, Frantz predicted that the γ ratio between carbonate and bicarbonate ions in aqueous fluids, , decreased by 75% with increasing temperature from 523 to 823 K, and did not vary with increasing pressure15. However, Schmidt suggested that this ratio changed by no >10% from 296 to 873 K and up to 1 GPa, based on the comparison of the Raman bands of (bi)carbonate ions with those of similar ion pairs, sulfate and hydrogen sulfate ions, under similar conditions16.
The lack of knowledge of the P–T dependence of Raman scattering cross-sections poses serious limitations to the use of Raman spectroscopy to determine chemical speciation of C–H–O fluids in the deep Earth, and as a consequence to our understanding of the deep carbon cycle, since at present Raman spectroscopy has been the technique of choice to investigate these liquids. Indeed the use of other spectroscopic methods, e.g., infrared17 or nuclear magnetic resonance18, is challenging under extreme P–T conditions and it is not known how to derive the concentrations of dissolved species solely from measured spectroscopic data.
Here, we present a strategy, based on first-principles simulations at extreme conditions, to determine the ratios of the Raman scattering cross-sections, thus providing a key quantity that can be used, in conjunction with Raman measurements, to predict speciation in aqueous fluids. In particular we present the results of first-principles molecular dynamics (FPMD) simulations of Na2CO3 and NaDCO3 aqueous solutions at HP-HT conditions (see Fig. 1). Our simulations permit the determination of the concentration of species in the solution13, as well as of their Raman spectra, including peak positions and intensities. This combined information can then be used to obtain Raman cross-sections. To the best of our knowledge, our study represents the first determination of Raman cross section ratios between aqueous carbonate and bicarbonate ions up to ~11 GPa and 1000 K and hence the first determination of speciation in these aqueous fluids. We find that this ratio decreases with increasing pressure, while it increases with increasing temperature, at variance from conclusions reached using geochemical models. Our results point at the presence of a higher concentration of bicarbonate ions at extreme conditions than previously thought, with important consequences for carbon transport in the Earth.
Fig. 1. A snapshot of the sodium carbonate solution at ~10 GPa and 1000 K.
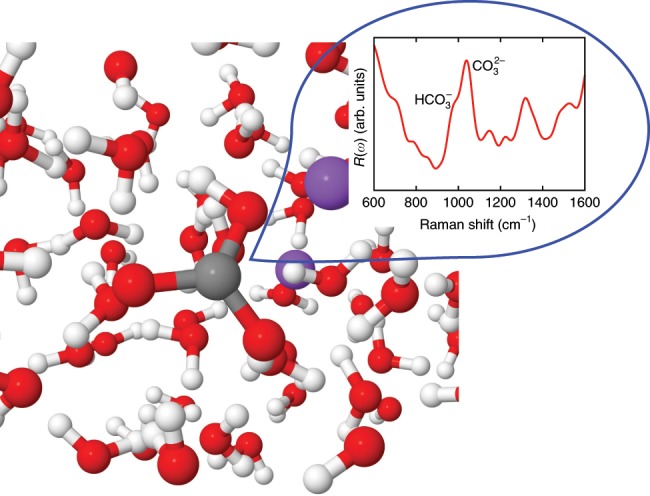
The configuration was selected from first-principles molecular dynamics simulations trajectories (see text). The inset shows the calculated unpolarized Raman spectrum of the solution (red line).
Results
Raman spectra at ambient density
Figure 2 shows the computed unpolarized and isotropic Raman spectra of 0.9 mol L−1 Na2CO3 and NaDCO3 solutions at ambient density and 380 K. We considered 380 instead of 300 K to better reproduce the experimental radial distribution functions and diffusion constant of water at ambient conditions with the functional adopted here (PBE19). The solute concentration was set to a value similar to that determined experimentally15. The Raman spectra were obtained using FPMD simulations, which account for an-harmonic effects (see Methods), critical to describe fluids. At these conditions, we found that <1% of carbonate and bicarbonate ions react in the Na2CO3 and NaDCO3 solutions. The broad band at ~2400 cm−1 shown in the figure originates from the water stretching mode20. The unpolarized and isotropic spectra show similar features, except at low frequency, in the range of 0~700 cm−1, where the baselines of the isotropic spectra are closer to zero than those of the unpolarized ones, consistent with experimental observations21. Following a procedure commonly adopted in experiments21, we used isotropic spectra to obtain Raman peak intensities. We first analyze the weak peaks between 400 and 1800 cm−1 (see Fig. 3). We assigned those peaks by using the computed vibrational densities of states (VDOS) and the intra-molecular Raman spectrum of the CO species. The VDOS of CO was obtained by Fourier transforming the velocity–velocity auto-correlation function:
| 1 |
where t is the correlation time, ω is the frequency, and vi is the velocity of the ith atom in the CO unit. The intra-molecular Raman spectra of CO were computed using the auto-correlation functions of the effective polarizabilities of CO, :
| 2 |
In Eq. (2), is the induced polarization of CO (computed from the centers of maximally localized Wannier functions) and E is the macroscopic electric field (see Supplementary Methods).
Fig. 2. Raman spectra of 0.9 mol L−1 solutions at ambient density and 380 K.
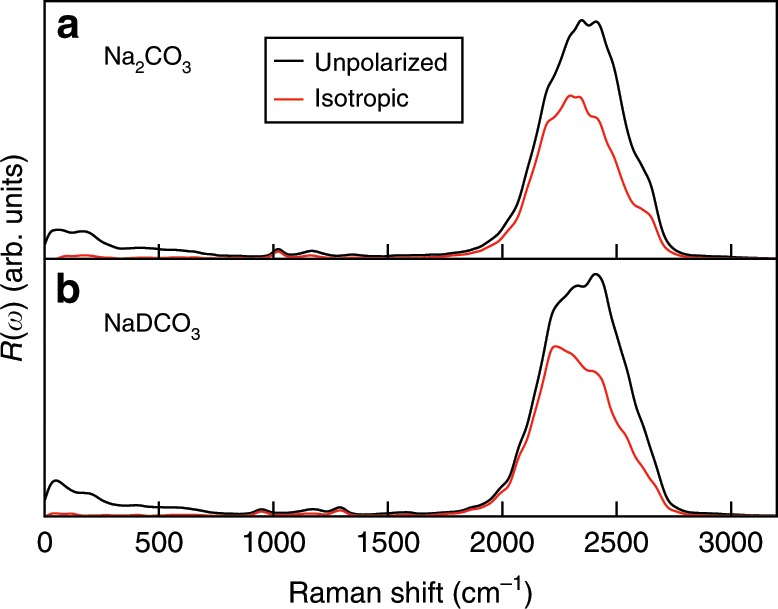
Calculated unpolarized (black line) and isotropic (red line) spectra of the sodium carbonate and deuterated sodium bicarbonate solutions are shown in the upper and lower panels, respectively.
Fig. 3. Zoomed-in Raman spectra of 0.9 mol L−1 solutions at ambient density and 380 K.
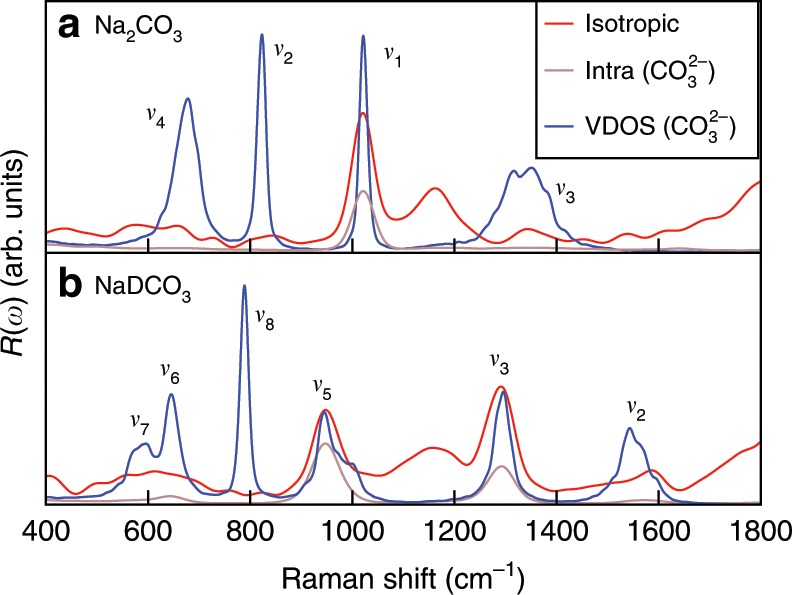
Calculated spectra of the sodium carbonate and deuterated sodium bicarbonate solutions are shown in the upper and lower panels, respectively. The isotropic Raman spectra (red line), the intra-molecular Raman spectra (brown line), and the vibrational density of states (VDOS) (blue line) of CO are compared.
The carbonate ion has four normal vibrational modes22, clearly visible in the VDOS of CO: the ν1 symmetric stretching at 1021 cm−1, the ν2 out-of-plane deformation at 823 cm−1, the ν3 asymmetric stretching at ~1350 cm−1, and the the ν4 in-plane deformation at 678 cm−1. In the full and intra-molecular Raman spectra, the ν1 peak is the most intense, and it has thus been used as the characteristic Raman signature of carbonate ions. The bicarbonate ion has 9 normal vibrational modes22. In Fig. 3, the VDOS corresponding to the bicarbonate ion HCO show at least six vibrational modes: the ν7(OD) and ν6(CO) bendings at ~596 cm−1 and 645 cm−1, respectively, the ν8(CO3) out-of-plane deformation at 788 cm−1, the ν5(C-OD) symmetric stretching at 945 cm−1, the ν3(CO) symmetric stretching at 1296 cm−1, and the ν2(CO) asymmetric stretching at ~1542 cm−1. In the full and intra-molecular Raman spectra, only the ν5(C-OD) and ν3(CO) modes can be easily identified. In both Raman spectra of the carbonate and bicarbonate solutions we found a broad band at ~1150 cm–1, which is not present in the VDOS and intra-molecular Raman spectra of CO. A similar band can be found in the Raman spectrum of pure water at ambient conditions20, and hence it was assigned to the bending mode of liquid water. We note that the calculated Raman frequencies are systematically lower than the experimental ones by ~40 cm−1 (ref. 23); this underestimate is ascribed to the exchange-correlation functional chosen in our simulations (a gradient-corrected functional: PBE19). It is well known that generalized gradient approximations underestimate the vibrational frequencies of covalent bonds24 and we do not consider this underestimate a serious drawback of our simulations, which we are using to assign species and understand trends, rather than to obtain exact values of vibrational frequencies. Importantly, our calculated unpolarized and isotropic Raman spectra are overall in good agreement with experimental ones. We also note that quite a few modes are present in the VDOS but not in the computed Raman spectra, indicating that the Raman selection rules included in our calculations are correctly reproducing experimental findings.
Raman spectra at high pressure and temperature
Having interpreted the low pressure and temperature spectra, we turned to solutions under extreme conditions. We increased the pressure of our simulations to ~9 GPa and the temperature to 600 K. At these conditions we observed the conversion between carbonate and bicarbonate ions. In the molecular dynamics (MD) simulation of 0.9 m (molality) Na2CO3, the mole percent of DCO per total carbon species is 8.5% and the remaining carbon species are CO. In the 0.9 m NaDCO3 solution, we found instead 18.5% CO, 81.3% DCO, and 0.2% D2CO3. The mole percents were obtained from MD trajectories based on the molecular geometry of the solutes (see the Methods section in ref. 13). Figure 4 shows the full Raman spectra of these two solutions, and Fig. 5 shows a specific frequency region. The calculated spectra are overall similar to those obtained at ambient conditions, but the vibrational bands are wider and the Raman active modes, ν1 of carbonate ions, ν5(C-OD) and ν3(CO) of bicarbonate ions, are all shifted to higher frequencies relative to ambient conditions. It has been experimentally reported that the Raman frequencies of the ν1 and ν5(C-OH) modes both increase with increasing pressure at a rate of ~6.5 and ~14 cm−1 per GPa, respectively, and decrease with increasing temperature at a rate of ~−0.035 and ~−0.096 cm−1 per K, respectively16; hence our results, obtained at ~9 GPa and 600 K, indicate that the pressure effect outweighs the temperature one and all major Raman peaks are blue-shifted compared to those at ambient conditions.
Fig. 4. Raman spectra of 0.9 molality solutions at ~9 GPa and 600 K.
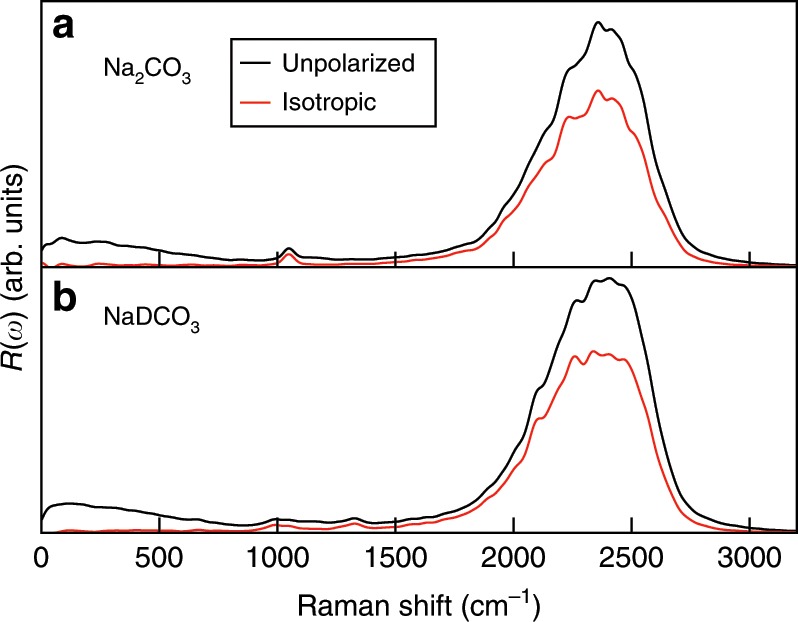
Calculated unpolarized (black line) and isotropic (red line) spectra of the sodium carbonate and deuterated sodium bicarbonate solutions are shown in the upper and lower panels, respectively.
Fig. 5. Zoomed-in Raman spectra of 0.9 molality solutions at ~9 GPa and 600 K.
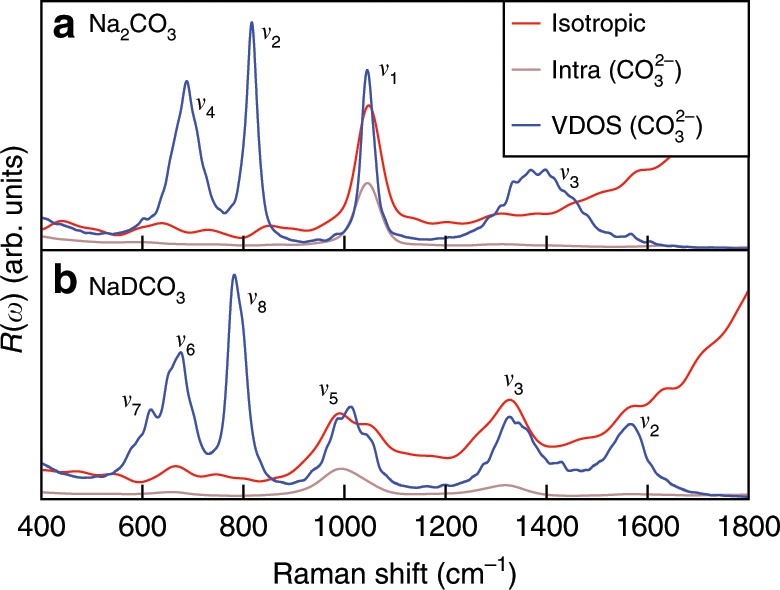
Calculated spectra of the sodium carbonate and deuterated sodium bicarbonate solutions are shown in the upper and lower panels, respectively. The isotropic Raman spectra (red line), the intra-molecular Raman spectra (brown line), and the vibrational density of states (VDOS) (blue line) of CO are compared.
Upon further increase of the pressure of the 0.9 m Na2CO3 solution to ~11 GPa and the temperature to 1000 K, we found 40.6% CO, 57.7% DCO, and 1.6% D2CO3. At these conditions, the carbonate and bicarbonate ions are rapidly converting into each other, and their lifetime is estimated to be on the sub-picosecond time scale, as reported in our previous study13. Figure 6 shows the isotropic Raman spectrum and VDOS of this solution. The Raman peaks are much broadened, due to the decreased lifetime of ions in the solution. Again, with the help of the computed VDOS and the intra-molecular Raman spectrum of CO, we identified the ν1 mode of carbonate ions and the ν3(CO) mode of bicarbonate ions. The ν1 band exhibits a shoulder, which is primarily assigned to the ν5(C-OD) mode of bicarbonate ions. The Raman signal of ion pairs NaCO is expected to be between the ν1 and ν5(C-OD) bands16.
Fig. 6. Raman spectra of the 0.9 molality sodium carbonate solution at ~11 GPa and 1000 K.
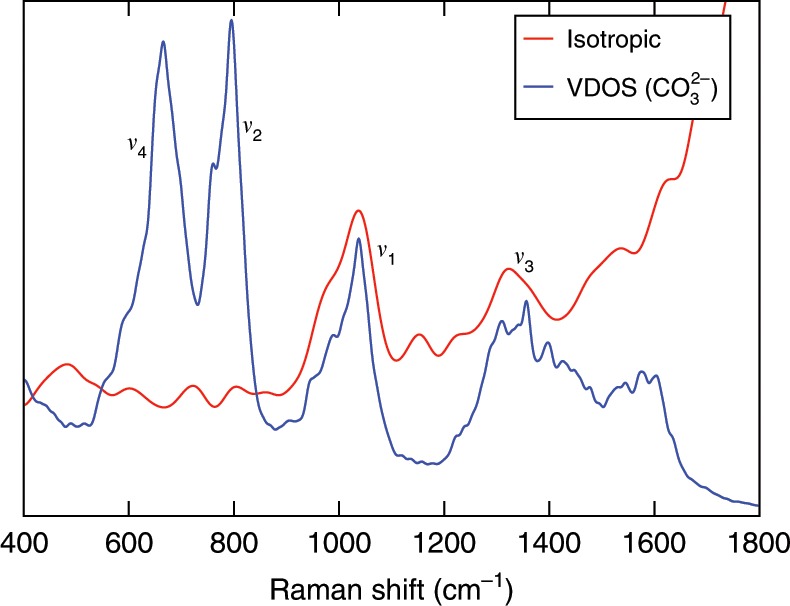
The isotropic Raman spectrum of this solution (red line) and the vibrational density of states (VDOS) (blue line) of CO are compared.
We note that while our calculations for the bicarbonate ion show the presence of two Raman bands (see Fig. 5), ν5(C-OD) and ν3(CO), in high-pressure experiments conducted in diamond anvil cells, only the ν5(C-OD) mode is detected. The reason is that the Raman band of the diamond window is at 1332 cm−1, i.e., very close to the Raman frequency of the ν3(CO) mode, and it becomes broader at high P and T25 and thus almost indistinguishable from the ν3(CO) mode.
Discussion
Having assigned all peaks in our computed spectra, and having determined the corresponding concentrations of ionic species from the MD trajectories, we are now in a position to directly compute γ from the Raman peak intensities and the concentrations of species. As mentioned in the introduction, γ is precisely the information not directly available in experiments at high P and T, and required to determine speciation from measured Raman spectra. We recall that at ambient conditions, and at 600 K and ~9 GPa, we calculated the Raman spectra of Na2CO3 and NaDCO3 solutions in separate simulations; therefore before proceeding to the determination of the γ ratio, the two spectra obtained in independent simulations need to be aligned. Since we simulated the Na2CO3 and NaDCO3 solutions with the same number of water molecules, we can use the water stretching band as our calibration to align the spectra. We found that the calculated γ ratio decreases with increasing Gaussian broadening width used to smooth the computed spectra; hence for comparison purposes, we adopted the same width in all the Raman spectra. The γ-ratio, , obtained from our simulations at ambient conditions is 1.57, which is comparable to the experimental value 1.46 reported by Rudolph et al.21, who also observed that the γ-ratio did not change up to 492 K. Both the experimental and calculated γ-ratios suggest that the Raman scattering cross section of carbonate ions is larger than that of bicarbonate ions, consistent with the expectation that more symmetric species, such as the carbonate ion, have a larger γ for the symmetric stretching modes. At 600 K and ~9 GPa, the computed γ ratio is 1.60, essentially the same as that found at ambient conditions. At 1000 K and ~11 GPa, the determination of the γ ratio is much more challenging, because the Raman signal of bicarbonate ions is hidden in the shoulder of the Raman peak of carbonate ions at 1037 cm−1. In this case no peak alignment was needed, because both ions were simulated in the same solution. We found a weak peak at 989 cm−1 in the VDOS of CO, which may be assigned to the ν5(C-OD) mode of bicarbonate ions. Using the Raman intensities at 989 cm−1 and 1037 cm−1, we calculated the γ ratio to be 1.81, which is larger than that at ambient conditions, and at 600 K and ~9 GPa.
To understand how pressure and temperature separately affect the value of γ, we computed the Raman spectra of the δ-Na2CO3 and NaHCO3 crystals up to 10 GPa and at 0 K in Fig. 7. The space groups of these two crystals are C2∕m26 and P121∕c127, respectively. We compressed the crystals without allowing for structural phase transitions. Figure 7 shows that both γcarb and γbicarb increase with increasing pressure, but γbicarb increases faster than γcarb, so the γ ratio decreases by 17% from 0 to 10 GPa. Our FPMD simulations showed that the γ ratio is approximately constant in going from ambient conditions to ~9 GPa and 600 K; this result, together with the one obtained for the solids under pressure, indicates that the γ ratio increases with increasing temperature. If we assume that this ratio linearly depends separately on temperature and pressure, then its value may be obtained from the following relation:
| 3 |
where α is the decrease rate with pressure and β is the increase rate with temperature. Using the γ ratios in Fig. 7 and at ~9 GPa and 600 K, we can calculate α as −2.99 × 10⁻² GPa−1 and β as 9.84 × 10⁻⁴ K−1. To test the validity of Eq. (3), we used the α- and β-values obtained above to calculate the γ ratio at ~11 GPa and 1000 K, which we also have computed directly from FP simulations: we obtained a value of 1.93, about 7% larger than the one directly obtained from the Raman spectrum in Fig. 6 (1.81). This agreement is not perfect but satisfactory and importantly we found the same trend relative to ambient conditions from our simulations and using Eq. (3).
Fig. 7. Raman scattering cross-sections of carbonate and bicarbonate ions.
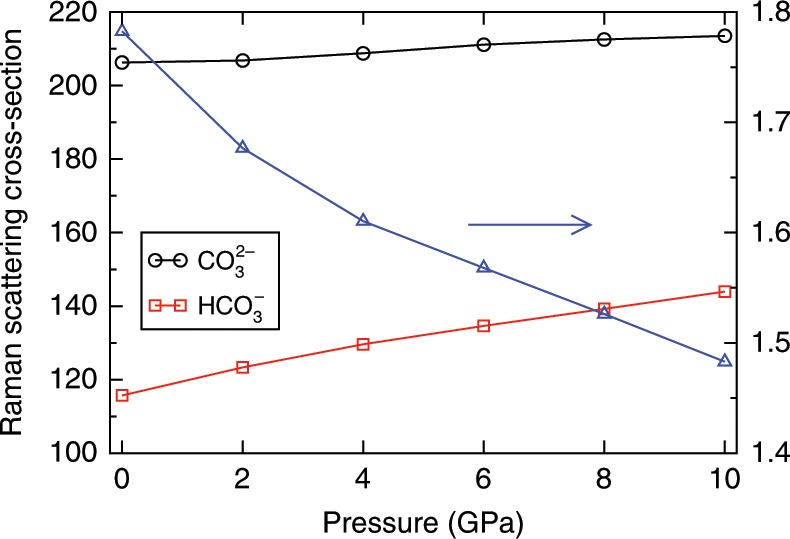
We present results for the δ-Na2CO3 (black line) and NaHCO3 (red line) crystals as a function of pressure. The cross section ratios between these two ions, i.e., the γ ratio (), are shown as blue triangles.
Our calculation shows that the γ-ratio increases with increasing temperature, but decreases with increasing pressure; these results differ from those obtained from geochemical models. Using the concentrations calculated from geochemical models, Frantz predicted that the γ-ratio decreased by 75% with increasing temperature from 523 to 823 K, and did not change with increasing pressure15. However, Schmidt reported that the γ-ratio estimated at ambient conditions from Frantz’s work (0.98) is much smaller than the experimental value (1.46), casting doubts on the generality of Frantz’s model16. In addition, at 873 K the γ-ratio given by Frantz is only 0.003, indicating that the Raman bands of CO are extremely weak and almost impossible to detect, contrary to what observed experimentally16. Hence, it is likely that the carbon species concentrations given by the geochemical models in Frantz’s work are not accurate. According to Rudolph’s Raman studies, the γ ratio changes little from 296 to 492 K21. Furthermore, Schmidt suspected that this ratio should not change >10% from 492 to 873 K and up to 1 GPa, but according to Eq. (3), this ratio should increase by 22% in this P–T range. At high temperatures, underestimating the γ ratio leads to an underestimate of the concentration of bicarbonate ions. In our previous study of the Na2CO3 solutions at 0.2 GPa and 823 K, the mole percent of HCO obtained by Raman spectra and the γ ratio at ambient conditions is 68%, which is smaller than the mole percent obtained by the FPMD simulations (73–82%), showing that the concentration of bicarbonate ions is indeed underestimated if we assume that the γ ratio does not change with pressure and temperature.
In summary, we presented a strategy to determine the speciation of carbonates in aqueous fluids under pressure, which combines theoretical and experimental spectroscopies. We considered conditions relevant to the Earth’s upper mantle, though our first-principles calculations can be conducted under a variety of different conditions and for numerous other ions and molecules in aqueous environments. In particular we showed how to compute, from first-principles, Raman scattering cross-sections, which are not yet known experimentally, at high pressure and high temperature. The information on cross-sections, together with that of measured Raman intensities, can then be used to obtain the speciation of aqueous carbonates, an essential prerequisite to understand the chemistry of carbon in water at extreme conditions.
Interestingly, we found that the ratio of the Raman scattering cross-sections of carbonate and bicarbonate ions in water, , decreases with increasing pressure, while it increases with increasing temperature, up to ~10 GPa and 1000 K. Our results differ from those reported previously based on geochemical models, showing either a decrease or a constant γ ratio under high temperature. These discrepancies are not surprising as the C–H–O fluids were modeled assuming neutral gas species under extreme P–T conditions, while many recent studies, including our simulations, show reactions between these gas species in aqueous environments. The results obtained here for the γ ratio imply a higher concentration of bicarbonate ions than previously considered, with important implications for the transport of carbon in aqueous fluids in the Earth interior.
Methods
First-principles molecular dynamics
We performed first-principles MD simulations using the Qbox code (http://qboxcode.org)28. The time step was 0.24 fs. We used the PBE exchange-correlation functional19 and Hamann-Schluter-Chiang-Vanderbilt norm-conserving pseudopotentials29,30 with a plane-wave kinetic energy cutoff of 85 Ry. When calculating pressure, the cutoff was increased to 220 Ry. There are 62 water molecules and one Na2CO3 or NaDCO3 molecule in the cubic simulation box with periodic boundary conditions. We used deuterium instead of hydrogen so as to enable the use of a larger time step in MD simulations. Temperature was controlled by the Bussi-Donadio-Parrinello thermostat31, and the time scale of the response of the thermostat (τ) is 24.2 fs.
First-principles Raman spectroscopy
The Raman spectra were calculated by the auto-correlation functions of electronic polarizabilities20. The isotropic and anisotropic Raman spectra were obtained respectively by
| 4 |
| 5 |
where ω is the frequency, kB is the Boltzmann constant, t is the correlation time, and Tr is the trace matrix operator, and β are the isotropic and anisotropic components of the polarizability tensor α: and , where I is the identity tensor. The linear combination of these two spectra gives the unpolarized Raman spectra: . The polarizability tensors were calculated by density functional perturbation theory32 every 15 MD steps. The length of each MD trajectory used in the auto-correlation calculations is between 210 and 280 ps. A Gaussian broadening is used to smooth spectra, whose full width at half maximum (FWHM) is 45 cm−1.
We note that in our MD simulations, nuclei were treated as classical particles; the comparisons between intensities reported for the vibrational spectra of water with classical and quantum dynamics at ambient conditions do not show any qualitative difference and relatively small quantitative differences for the intensities, with blue-shifted frequencies of the order 60–120 cm−1 in the case of classical dynamics33,34. At elevated temperatures, we expect the small differences observed at ambient conditions to diminish.
Supplementary information
Acknowledgements
We thank Quan Wan for helpful discussions and Shenli Zhang for her help in the final revision of our manuscript. D.P. acknowledges support from Hong Kong Research Grants Council (project number ECS-26305017, GRF-16307618), the National Natural Science Foundation of China (project number 11774072), the Alfred P. Sloan Foundation through the Deep Carbon Observatory (DCO), and the Croucher Foundation through the Croucher Innovation Award. Work by Giulia Galli was supported by AMEWS, an Energy Frontier Research Center funded by DOE, Office of Science, Basic Energy Science. Part of this work was carried out using the DCO Computer Cluster. We also acknowledge the University of Chicago Research Computing Center for support of this work.
Author contributions
D.P. and G.G. designed the research. Calculations were performed by D.P. All authors contributed to the analysis and discussion of the data and the writing of the manuscript.
Data availability
The data that support this study are available upon request from the authors.
Code availability
Qbox is a free and open source code available at http://qboxcode.org. Data processing scripts are available upon request from the authors.
Competing interests
The authors declare no competing interests.
Footnotes
Peer review information Nature Communications thanks the anonymous reviewer(s) for their contribution to the peer review of this work.
Publisher’s note Springer Nature remains neutral with regard to jurisdictional claims in published maps and institutional affiliations.
Supplementary information
Supplementary information is available for this paper at 10.1038/s41467-019-14248-1.
References
- 1.Falkowski P, et al. The global carbon cycle: a test of our knowledge of earth as a system. Science. 2000;290:291–296. doi: 10.1126/science.290.5490.291. [DOI] [PubMed] [Google Scholar]
- 2.Hayes JM, Waldbauer JR. The carbon cycle and associated redox processes through time. Philos. Trans. Royal Soc. B. 2006;361:931–950. doi: 10.1098/rstb.2006.1840. [DOI] [PMC free article] [PubMed] [Google Scholar]
- 3.Javoy M. The major volatile elements of the Earth: Their origin, behavior, and fate. Geophys. Res. Lett. 1997;24:177–180. doi: 10.1029/96GL03931. [DOI] [Google Scholar]
- 4.Hazen RM, Schiffries CM. Why deep carbon? Rev. Mineral. Geochem. 2013;75:1–6. doi: 10.2138/rmg.2013.75.1. [DOI] [Google Scholar]
- 5.Manning CE. Geochemistry: a piece of the deep carbon puzzle. Nature Geosci. 2014;7:333–334. doi: 10.1038/ngeo2152. [DOI] [Google Scholar]
- 6.Manning CE, Shock EL, Sverjensky D. The chemistry of carbon in aqueous fluids at crustal and upper mantle conditions: experimental and theoretical constraints. Rev. Mineral Geochem. 2013;75:109–148. doi: 10.2138/rmg.2013.75.5. [DOI] [Google Scholar]
- 7.Manning CE. Fluids of the lower crust: Deep is different. Annu. Rev. Earth Planet. Sci. 2018;46:67–97. doi: 10.1146/annurev-earth-060614-105224. [DOI] [Google Scholar]
- 8.Huizenga J-M. Thermodynamic modelling of C-O-H fluids. Lithos. 2001;55:101–114. doi: 10.1016/S0024-4937(00)00040-2. [DOI] [Google Scholar]
- 9.Zhang C, Duan Z. A model for COH fluid in the earth’s mantle. Geochim. Cosmochim. Acta. 2009;73:2089–2102. doi: 10.1016/j.gca.2009.01.021. [DOI] [Google Scholar]
- 10.Facq S, Daniel I, Montagnac G, Cardon H, Sverjensky DA. In situ raman study and thermodynamic model of aqueous carbonate speciation in equilibrium with aragonite under subduction zone conditions. Geochim. Cosmochim. Acta. 2014;132:375–390. doi: 10.1016/j.gca.2014.01.030. [DOI] [Google Scholar]
- 11.Abramson EH, Bollengier O, Brown JM. The water-carbon dioxide miscibility surface to 450 ∘C and 7 GPa. Am. J. Sci. 2017;317:967–989. doi: 10.2475/09.2017.01. [DOI] [PMC free article] [PubMed] [Google Scholar]
- 12.Sverjensky DA. Thermodynamic modelling of fluids from surficial to mantle conditions. J. Geol. Soc. 2019;176:348–374. doi: 10.1144/jgs2018-105. [DOI] [Google Scholar]
- 13.Pan D, Galli G. The fate of carbon dioxide in water-rich fluids under extreme conditions. Sci. Adv. 2016;2:e1601278. doi: 10.1126/sciadv.1601278. [DOI] [PMC free article] [PubMed] [Google Scholar]
- 14.Goncharov, A. F. Raman spectroscopy at high pressures. Int. J. Spectrosc.2012, 617528 (2012).
- 15.Frantz JD. Raman spectra of potassium carbonate and bicarbonate aqueous fluids at elevated temperatures and pressures: comparison with theoretical simulations. Chem. Geol. 1998;152:211–225. doi: 10.1016/S0009-2541(98)00058-8. [DOI] [Google Scholar]
- 16.Schmidt C. Schmidt, C. Raman spectroscopic determination of carbon speciation and quartz solubility in H2O+Na2CO3 and H2O+NaHCO3 fluids to 600 °C and 1.53 GPa. Geochim. Cosmochim. Acta. 2014;145:281–296. doi: 10.1016/j.gca.2014.09.009. [DOI] [Google Scholar]
- 17.Sowerby JR, Keppler H. Water speciation in rhyolitic melt determined by in-situ infrared spectroscopy. Am. Mineral. 1999;84:1843–1849. doi: 10.2138/am-1999-11-1211. [DOI] [Google Scholar]
- 18.Pilgrim CD, Casey WH, Walton JH. High pressure aqueous geochemical NMR. eMagRes. 2019;8:127–136. [Google Scholar]
- 19.Perdew JP, Burke K, Ernzerhof M. Generalized gradient approximation made simple. Phys. Rev. Lett. 1996;77:3865. doi: 10.1103/PhysRevLett.77.3865. [DOI] [PubMed] [Google Scholar]
- 20.Wan Q, Spanu L, Galli GA, Gygi F. Raman spectra of liquid water from ab initio molecular dynamics: vibrational signatures of charge fluctuations in the hydrogen bond network. J. Chem. Theory Comput. 2013;9:4124–4130. doi: 10.1021/ct4005307. [DOI] [PubMed] [Google Scholar]
- 21.Rudolph, W. W., Irmer, G. and Königsberger, E. Speciation studies in aqueous HCO –CO solutions. A combined raman spectroscopic and thermodynamic study. Dalton Trans. 900–908, 10.1039/B713254A (2008). [DOI] [PubMed]
- 22.Davis A, Oliver B. A vibrational-spectroscopic study of the species present in the CO2 -H2 O system. J. Solution Chem. 1972;1:329–339. doi: 10.1007/BF00715991. [DOI] [Google Scholar]
- 23.Rudolph WW, Fischer D, Irmer G. Vibrational spectroscopic studies and density functional theory calculations of speciation in the CO2-Water system. Appl. Spectrosc. 2006;60:130–144. doi: 10.1366/000370206776023421. [DOI] [PubMed] [Google Scholar]
- 24.Boulard E, Pan D, Galli G, Liu Z, Mao WL. Tetrahedrally coordinated carbonates in earth’s lower mantle. Nat. Commun. 2015;6:6311. doi: 10.1038/ncomms7311. [DOI] [PubMed] [Google Scholar]
- 25.Goncharov AF, et al. Dynamic ionization of water under extreme conditions. Phys. Rev. Lett. 2005;94:125508. doi: 10.1103/PhysRevLett.94.125508. [DOI] [PubMed] [Google Scholar]
- 26.Dušek M, Chapuis G, Meyer M, Petricek V. Sodium carbonate revisited. Acta Crystallogr. B. 2003;59:337–352. doi: 10.1107/S0108768103009017. [DOI] [PubMed] [Google Scholar]
- 27.Duan Y, et al. Density functional theory studies on the electronic, structural, phonon dynamical and thermo-stability properties of bicarbonates MHCO3, M= Li, Na, K. J. Phys. Condens. Matter. 2012;24:325501. doi: 10.1088/0953-8984/24/32/325501. [DOI] [PubMed] [Google Scholar]
- 28.Gygi F. Architecture of qbox: A scalable first-principles molecular dynamics code. IBM J. Res. Dev. 2008;52:137–144. doi: 10.1147/rd.521.0137. [DOI] [Google Scholar]
- 29.Hamann DR, Schlüter M, Chiang C. Norm-conserving pseudopotentials. Phys. Rev. Lett. 1979;43:1494–1497. doi: 10.1103/PhysRevLett.43.1494. [DOI] [Google Scholar]
- 30.Vanderbilt D. Optimally smooth norm-conserving pseudopotentials. Phys. Rev. B. 1985;32:8412–8415. doi: 10.1103/PhysRevB.32.8412. [DOI] [PubMed] [Google Scholar]
- 31.Bussi G, Donadio D, Parrinello M. Canonical sampling through velocity rescaling. J. Chem. Phys. 2007;126:014101. doi: 10.1063/1.2408420. [DOI] [PubMed] [Google Scholar]
- 32.Baroni S, De Gironcoli S, Dal Corso A, Giannozzi P. Phonons and related crystal properties from density-functional perturbation theory. Rev. Mod. Phys. 2001;73:515. doi: 10.1103/RevModPhys.73.515. [DOI] [Google Scholar]
- 33.Reddy SK, Moberg DR, Straight SC, Paesani F. Temperature-dependent vibrational spectra and structure of liquid water from classical and quantum simulations with the mb-pol potential energy function. J. Chem. Phys. 2017;147:244504. doi: 10.1063/1.5006480. [DOI] [PubMed] [Google Scholar]
- 34.Morawietz T, et al. The interplay of structure and dynamics in the raman spectrum of liquid water over the full frequency and temperature range. J. Phys. Chem. Lett. 2018;9:851–857. doi: 10.1021/acs.jpclett.8b00133. [DOI] [PubMed] [Google Scholar]
Associated Data
This section collects any data citations, data availability statements, or supplementary materials included in this article.
Supplementary Materials
Data Availability Statement
The data that support this study are available upon request from the authors.
Qbox is a free and open source code available at http://qboxcode.org. Data processing scripts are available upon request from the authors.


