

SUMMARY
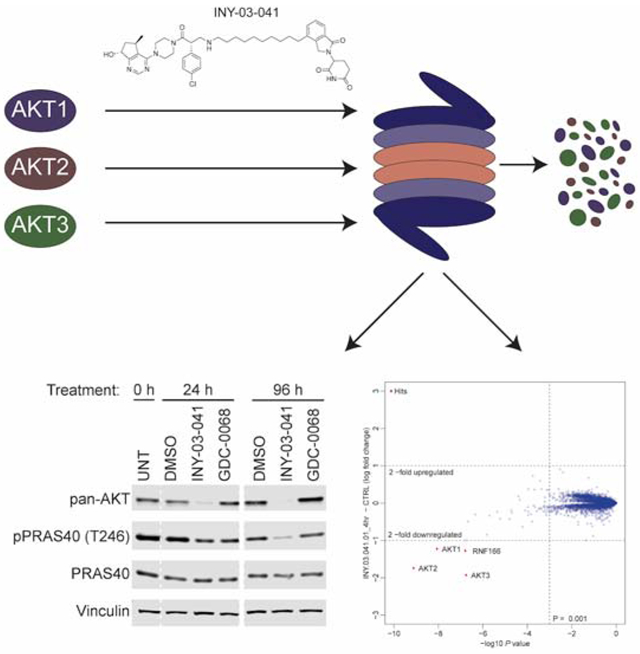
The PI3K/AKT signaling cascade is one of the most commonly dysregulated pathways in cancer, with over half of tumors exhibiting aberrant AKT activation. Although potent small molecule AKT inhibitors have entered clinical trials, robust and durable therapeutic responses have not been observed. As an alternative strategy to target AKT, we report the development of INY-03-041, a pan-AKT degrader consisting of the ATP-competitive AKT inhibitor GDC-0068 conjugated to lenalidomide, a recruiter of the E3 ubiquitin ligase substrate adaptor Cereblon (CRBN). INY-03-041 induced potent degradation of all three AKT isoforms and displayed enhanced anti-proliferative effects relative to GDC-0068. Notably, INY-03-041 promoted sustained AKT degradation and inhibition of downstream signaling effects for up to 96 hours, even after compound washout. Our findings indicate that AKT degradation may confer prolonged pharmacological effects compared to inhibition, and highlight the potential advantages of AKT-targeted degradation.
Graphical Abstract
In Brief
You and Erickson et al. report the development and characterization of INY-03-041, a highly selective AKT degrader. The authors demonstrate that INY-03-041 not only exhibits more potent anti-proliferative effects than the catalytic inhibitor GDC-0068, but also induces sustained AKT destabilization and inhibition of downstream signaling, even after compound washout.
INTRODUCTION
The serine/threonine kinase AKT is a central component of the phosphoinositide 3-kinase (PI3K) signaling cascade and is a key regulator of critical cellular processes, including proliferation, survival and metabolism (Manning and Toker, 2017). The AKT protein kinase family is comprised of three highly homologous isoforms, AKT1, AKT2 and AKT3, that possess both redundant functions and isoform-specific activities (Toker, 2012). Hyperactivation of AKT, due to gain-of-function mutations or amplification of oncogenes (receptor tyrosine kinases, PI3K) or inactivation of tumor suppressor genes (PTEN, INPP4B, PHLPP), is one of the most common molecular perturbations in cancer and promotes malignant phenotypes associated with tumor initiation and progression (Cantley and Neel, 1999; Fruman et al., 2017; Shayesteh et al., 1999). Thus, AKT is an attractive therapeutic target and significant efforts have been made to develop AKT targeted therapies (Brown and Banerji, 2017).
Current strategies to target AKT have focused on ATP-competitive, allosteric and covalent inhibitors. Several ATP-competitive inhibitors, such as ipatasertib (GDC-0068) and capivasertib (AZD5363), are currently under clinical investigation in phase II and III studies (Oliveira et al., 2019; Turner et al., 2019). However, these inhibitors suffer from a lack of selectivity among the AGC kinase family, and this may limit their clinical efficacy or tolerability (Huck and Mochalkin, 2017). By contrast, allosteric inhibitors which target the pleckstrin homology (PH) domain, such as MK-2206 and miransertib (ARQ-092), exhibit a high degree of specificity towards AKT, but either lack significant efficacy in the clinic or require further clinical evaluation (Do et al., 2015; Keppler-Noreuil et al., 2019). Covalent allosteric inhibitors which target AKT at Cys296 and Cys310 have been reported, but have not advanced to clinical trials (Uhlenbrock et al., 2019).
An alternative pharmacological approach to inhibiting AKT activity is to directly reduce cellular AKT protein levels via targeted protein degradation. Heterobifunctional degraders, also known as PROTACs (proteolysis targeting chimeras), consist of a moiety that binds to an E3 ubiquitin ligase chemically linked to a second moiety that engages a target protein, thereby recruiting the E3 ligase into close proximity to the target protein to induce its ubiquitination and subsequent proteasomal degradation (Winter et al., 2015). Several advantages of degraders over inhibitors have been reported, which include enhancing the selectivity of multi-targeted inhibitors (CDK9) (Olson et al., 2018), abrogating non-kinase dependent functions (FAK) (Cromm et al., 2018), and overcoming resistance mutations (BTK) (Dobrovolsky et al., 2018). Because the pharmacological effects of degraders depend on the re-synthesis rate of the target protein rather than sustained target occupancy, small molecule degraders may also have significantly prolonged effects in comparison to reversible inhibitors. However, while the potential for degraders to achieve an extended pharmacological duration of action has been noted, there have been no reported degraders to date that highlight such a feature (Churcher, 2018). Given the long half-life of AKT (Basso et al., 2002) and its importance in cancer etiology and progression, AKT is an attractive protein to target for degradation.
Here, we report the development of INY-03-041, a pan-AKT degrader that induces potent degradation of all three AKT isoforms for an extended period of time. Through cell-based assays, we demonstrate that INY-03-041 exhibits more potent and prolonged effects on downstream signaling than GDC-0068, which may explain its enhanced anti-proliferative effects in comparison to the parent catalytic inhibitor. Our data demonstrate that AKT degradation has more durable pharmacological effects than AKT inhibition, which highlights a potentially novel aspect of degrader pharmacology.
RESULTS
Design and Development of the Pan-AKT Degrader INY-03-041
To develop an AKT-targeting heterobifunctional degrader, we designed compounds based on GDC-0068, the most advanced AKT inhibitor in clinical trials (Oliveira et al., 2019). The co-crystal structure of GDC-0068 bound to AKT1 (PDB ID: 4EKL) revealed that the isopropylamine is solvent-exposed, suggesting that the amine could serve as a suitable attachment site for linkers without adversely affecting affinity to AKT (Figure 1A). A ten hydrocarbon linker was used to conjugate GDC-0068 with lenalidomide to generate INY-03-041 (Figure 1B).
Figure 1. Design and Development of INY-03-041.

(A) Co-crystal structure of GDC-0068 (green) bound to AKT1 (gray, PDB: 4EKL) revealing solvent-exposed isopropylamine (circled) where linker was attached. (B) Chemical structure of INY-03-041. (C) TREEspot visualization of the biochemical kinome selectivity profile of GDC-0068 and INY-03-041 (1 μM). AKT isoforms are highlighted in blue, while all other inhibited kinases are highlighted in red (Table S1).
To verify that conjugation of the linker and lenalidomide did not affect the ability of INY-03-041 to bind to AKT, INY-03-041 was tested in a commercially-available fluorescence resonance energy transfer (FRET)-based assay (Invitrogen, Z’-Lyte) for AKT1, AKT2, and AKT3 inhibition (Table S1). INY-03-041 had similar inhibitory activity against AKT1 (IC50 = 2.0 nM), AKT2 (IC50 = 6.8 nM), and AKT3 (IC50 = 3.5 nM) as GDC-0068 (IC50s for AKT1, 2, and 3 = 5, 18, and 8 nM, respectively) (Blake et al., 2012), demonstrating that INY-03-041 retained comparable biochemical affinity to all three AKT isoforms as its parent inhibitor. In addition, we evaluated the biochemical selectivity of INY-03-041 against a panel of 468 kinases at 1 μM (KINOMEscan) and observed that INY-03-041 had a similar selectivity profile as GDC-0068 (Figure 1C). Although INY-03-041 scored as a strong binder of RET (V804M) in the KINOMEscan assay, this was confirmed to be a false positive, as its biochemical IC50 was determined to be >10000 nM (Invitrogen, LanthaScreen) (Table S1).
INY-03-041 is a potent and highly selective pan-AKT degrader
After verifying that INY-03-041 engaged AKT biochemically, we sought to characterize its degradation activity in cells. We first chose to evaluate the AKT degrader in the triple negative breast cancer cell line MDA-MB-468 due to their high expression of all three AKT isoforms. We found that INY-03-041 induced potent degradation of all three AKT isoforms in a dose-dependent manner after a 12-hour treatment, with maximal degradation observed between 100 to 250 nM (Figure 2A). At concentrations of 500 nM and greater, we observed diminished AKT degradation, consistent with the hook effect, in which independent engagement of AKT and CRBN by INY-03-041 prevents formation of a productive ternary complex (An and Fu, 2018). Treatment of MDA-MB-468 cells with 250 nM of INY-03-041 over time revealed partial degradation of all AKT isoforms within 4 hours and progressive loss of AKT abundance out to 24 hours (Figure 2B).
Figure 2. INY-03-041 induces potent degradation of AKT isoforms dependent on CRBN, neddylation, and the proteasome.

(A) Immunoblots for AKT1, AKT2, AKT3, pan-AKT and Vinculin in MDA-MB-468 cells after 12-hour treatment with DMSO, GDC-0068 (GDC), or INY-03-041 at the concentrations indicated (n=4). (B) Immunoblots for AKT1, AKT2, AKT3, pan-AKT and Vinculin in MDA-MB-468 cells after treatment with INY-03-041 (250 nM) at indicated times or DMSO (24 h) (n=4). (C) Immunoblots for AKT1, AKT2, AKT3, pan-AKT and Vinculin after 12-hour co-treatment of MDA-MB-468 cells with DMSO, bortezomib (0.5 μM), MLN-4924 (1 μM), lenalidomide (Len, 10 μM), or GDC-0068 (GDC, 10 μM) and either INY-03-041 (250 nM) or DMSO (n=4). (D) Scatterplot depicts the change in relative protein abundance of INY-03-041 (250 nM, 4 hour) treated MOLT4 cells compared to DMSO vehicle control treated cells. Protein abundance measurements were made using TMT quantitative mass spectrometry and significant changes were assessed by moderated t-test as implemented in the limma package (Ritchie et al., 2015). The log2 fold change (log2 FC) is shown on the y-axis and negative log10 p value (−log10 p value) on the x-axis for three independent biological replicates of each treatment. See also Table S2.
To ensure that INY-03-041-induced AKT degradation was dependent on CRBN, we synthesized INY-03-112, a negative control compound with an N-methylated glutarimide that substantially weakens CRBN binding (Figure S1A) (Brand et al., 2018). INY-03-112 did not induce potent degradation of any AKT isoform (Figure S1B), demonstrating that INY-03-041-induced AKT degradation was CRBN-dependent. Furthermore, co-treatment of INY-03-041 with bortezomib, a proteasome inhibitor, or MLN-4924, a NEDD8-activating enzyme inhibitor that prevents neddylation required for the function of cullin RING ligases such as CRL4CRBN (Soucy et al., 2009), prevented AKT destabilization, indicating that degradation was dependent on the ubiquitin-proteasome system (Figure 2C). Finally, we co-treated INY-03-041 with excess quantities of either GDC-0068 or lenalidomide to compete for binding to AKT or CRBN, respectively, both of which prevented AKT degradation, demonstrating that engagement to both AKT and CRBN are required for INY-03-041-induced AKT degradation (Figure 2C).
To broadly assess degrader selectivity, MOLT4 cells, a cell line that is amenable to proteomics and expresses all three AKT isoforms, were treated with 250 nM of INY-03-041 for 4 hours and an unbiased, multiplexed mass spectrometry (MS)-based proteomic analysis was performed (Donovan et al., 2018). This analysis identified significant downregulation of all three AKT isoforms, as well as RNF166, a ring-finger protein known to be downregulated by lenalidomide treatment (Figure 2D) (Kronke et al., 2015). Although INY-03-041 exhibited potent in vitro inhibition of S6K1 (IC50 = 37.3 nM) and PKG1 (IC50 = 33.2 nM), both of which are known off-targets of GDC-0068, no downregulation of either kinases was observed in the proteomics (Table S2). Further immunoblot analysis confirmed that INY-03-041 did not induce S6K1 degradation (Figure S1C). While the time-course (Figure 2B) indicates that stronger AKT degradation would be observed at longer time points, it is likely that the results would be confounded by subsequent transcriptional changes caused by AKT degradation.
As CRBN-targeting degraders often destabilize zinc finger proteins, and because we observed IMiD-induced downregulation of RNF166, we examined whether INY-03-041 affected protein abundance levels of Ikaros (IKZF1) and Aiolos (IKZF3), well-established targets of lenalidomide (Kronke et al., 2014). Immunoblot analysis revealed weak IKZF1 and IKZF3 degradation after 24 hours of drug treatment, albeit at relatively high concentrations of 500 nM or greater, indicating that INY-03-041 is primarily a selective degrader for AKT (Figure S1C).
INY-03-041 exhibits enhanced anti-proliferative effects compared to GDC-0068.
As AKT has well-characterized functions in regulating cell proliferation, we next compared the anti-proliferative effects of AKT degradation and inhibition using growth rate inhibition (GR) to account for variation in division rates among cells, as this can confound other drug response metrics, such as IC50 values (Hafner et al., 2017). In a panel of cell lines with PI3K pathway mutations that have been reported to be sensitive (ZR-75-1, T47D, LNCaP, and MCF-7) and insensitive (MDA-MB-468 and HCC1937) to AKT inhibition (Table S3) (Lin et al., 2013), we found that INY-03-041 was most potent in ZR-75-1 cells (GR50 = 16 nM), with a 14-fold increased potency compared to GDC-0068 (GR50 = 229 nM). The anti-proliferative effect of INY-03-041 was degradation-dependent, as INY-03-112 was significantly less potent (GR50 = 413 nM) than INY-03-041 and had a comparable GR50 value to GDC-0068 (Figure 3A; Table S4). Similar trends were seen in the other cell lines sensitive to AKT inhibition, with 8- to 14- fold lower GR50 values for INY-03-041 in comparison to GDC-0068 (Figures 3A-D; Table S4). In addition, lenalidomide, used as a control for RNF166, IKZF1, and IKZF3 degradation, did not have strong anti-proliferative effects, suggesting that the enhanced anti-proliferative effects were due to AKT degradation (Figures 3A-D).
Figure 3. INY-03-041 induces enhanced anti-proliferative effects compared to GDC-0068.

GR values across concentrations in (A) ZR-75-1, (B) T47D, (C) LNCaP, (D) MCF-7, (E) MDA-MB-468, and (F) HCC1937 cells after 72-hour treatment with GDC-0068 (blue), INY-03-041 (red), INY-03-112 (green), and lenalidomide (orange). Error bars represent standard deviation of three technical replicates.
While INY-03-041 displayed enhanced anti-proliferative effects compared to GDC-0068 in MDA-MB-468 and HCC1937 cells, there were no apparent differences in GR50 values between INY-03-041 and INY-03-112, its non-CRBN binding control (Figures 3E and 3F; Table S4). Thus, the anti-proliferative effects of INY-03-041 in these cell lines were likely due to off-target effects unrelated to AKT degradation that manifest at elevated concentrations of INY-03-041 and INY-03-112. This is consistent with previous studies reporting resistance of MDA-MB-468 and HCC1937 to AKT inhibition (Lin et al., 2013), and indicates that AKT degradation has similar phenotypic effects as AKT inhibition in these cell lines. Overall, the data show that INY-03-041 suppresses proliferation more potently than GDC-0068, and highlight the potential therapeutic value of targeted AKT degradation.
INY-03-041 suppresses downstream signaling more potently than GDC-0068
Given the enhanced anti-proliferative effects of INY-03-041 compared to GDC-0068, we sought to compare their effects on downstream AKT signaling. In T47D cells, which were highly sensitive to INY-03-041 in terms of anti-proliferation, we confirmed that INY-03-041 induced potent AKT degradation, with no detectable levels of all three AKT isoforms observed after a 24-hour treatment with 250 nM of INY-03-041 (Figure S2). Moreover, INY-03-041 treatment resulted in robust and dose-dependent inhibition of phosphorylated PRAS40 (pPRAS40) and GSK3β (pGSK3β), well-established direct substrates of AKT (Cross et al., 1995; Wang et al., 2012), as well as S6 (pS6), a downstream marker of AKT activity (Lin et al., 2013) (Figure 4A). While 250 nM INY-03-041 significantly reduced pPRAS40, pGSK3β, and pS6 levels, doses up to 1 μM of GDC-0068 were required to observe comparable effects (Figure 4A). To test whether these effects were generalizable across distinct cell lines, we also compared the effects of INY-03-041 and GDC-0068 in MDA-MB-468, MOLT4, IGROV1 and PC3 cells (Figure 4A and Figures S3A-C). Similar to that observed in T47D cells, INY-03-041 significantly reduced phosphorylation of PRAS40, GSK3β and S6 at 250 nM, while weaker responses were seen with equivalent doses of GDC-0068 (Figure 4A and Figures S3A-C). Although INY-03-041 suppresses downstream AKT signaling more potently than GDC-0068 in a variety of cancer cell lines, longer time points were required for INY-03-041 to display maximal pharmacodynamic effects relative to GDC-0068 (Figure S4A-C), consistent with the rate of AKT degradation observed.
Figure 4. INY-03-041 exhibits more potent and durable downstream signaling effects than GDC-0068.

(A) Immunoblots of pan-AKT, phospho-PRAS40 (T246), total PRAS40, phospho-GSK3β (S9), total GSK3β, phospho-S6 (S240/244), total S6 and Vinculin after treating T47D or MDA-MB-468 cells for 24 hours with DMSO, INY-03-041, or GDC-0068 at the concentrations indicated (n=3). (B) Immunoblots of pan-AKT, phospho-PRAS40 (T246), total PRAS40 and Vinculin after treatment of T47D or MDA-MB-468 cells with 250 nM of INY-03-041 or GDC-0068 at time points indicated (n=3). (C) Immunoblots of pan-AKT, phospho-PRAS40 (T246), total PRAS40 and Vinculin in T47D or MDA-MB-468 cells treated for 12 hours with INY-03-041 or GDC-0068 (250 nM), followed by washout for indicated times (n=4). Solid vertical white line indicates samples run on separate gels.
Notably, we also found that INY-03-041 promoted sustained destabilization of all three AKT isoforms for at least 96 hours after treatment with 250 nM of INY-03-041 in both T47D and MDA-MB-468 cells (Figure 4B). This durable AKT degradation resulted in sustained inhibition of downstream signaling, as pPRAS40 levels were also significantly reduced for up to 96 hours (Figure 4B). By contrast, treatment with an equivalent dose of GDC-0068 not only resulted in less pronounced inhibition of pPRAS40, but the duration of this effect was also shorter (Figure 4B).
To further characterize the mechanism underlying the extended duration of AKT degradation induced by INY-03-041, we performed compound washout experiments after 12 hours of treatment with either 250 nM of INY-03-041 or GDC-0068. We observed no detectable rebound of AKT levels for up to 96 hours after washout in INY-03-041 treated cells (Figure 4C), suggesting that the re-synthesis rate of AKT is slow. Consistently, INY-03-041 potently suppressed levels of pPRAS40 for up to 96 hours after washout, while washout in GDC-0068 treated cells resulted in rebound of pPRAS40, as would be expected of a reversible inhibitor (Figure 4C). Taken together, our data suggest that INY-03-041-mediated AKT degradation resulted in more potent and durable pharmacological effects than AKT inhibition.
DISCUSSION
Heterobifunctional degraders have garnered attention recently due to potential advantages over traditional small molecule inhibitors, including their ability to target proteins deemed undruggable through the use of non-functional ligands (Farnaby et al., 2019; Silva et al., 2019) and to achieve selectivity with promiscuous ligands (Nowak et al., 2018). However, one advantage of degraders that has not been fully investigated is their potential to exert long-lasting pharmacological effects. Given that degraders deplete abundance of a targeted protein, short-term drug exposure may deliver sustained pharmacological effects, uncoupling pharmacodynamics from pharmacokinetics. This distinction may be more apparent for proteins with slow re-synthesis rates, as longer periods of time may be required for protein levels to recover and re-establish physiological signaling.
Consistent with the long reported half-life for AKT (Basso et al., 2002), INY-03-041 destabilized all three AKT isoforms and diminished downstream signaling effects for up to 96 hours, even after compound washout. This durable and prolonged pharmacodynamic effect, which was significantly greater than that of the parent AKT inhibitor GDC-0068, may explain, at least in part, the more potent anti-proliferative effects of INY-03-041. To the best of our knowledge, this is the first example of a small molecule degrader that sustains knockdown and downstream signaling effects for such an extended period of time, and exemplifies a distinguishing feature of degrader pharmacology.
Although several ATP-competitive and allosteric AKT inhibitors have entered clinical trials, dose-limiting toxicities or lack of clinical efficacy have hindered their progress (Jansen et al., 2016). Moreover, AKT has been reported to have kinase-independent functions (Vivanco et al., 2014) that would reduce efficacy of small molecule inhibitors, and resistance to AKT inhibitors can arise in some contexts due to upregulation of AKT3 (Stottrup et al., 2016). As degraders have been reported to abrogate kinase-independent functions (Cromm et al., 2018) and overcome inhibitor-induced compensatory upregulation of target proteins (Cai et al., 2012; Han et al., 2019), targeted AKT degradation may be a promising alternative approach for therapeutic intervention in cancers with PI3K/AKT pathway alterations. Although our data indicate that AKT degraders can induce more potent and durable downstream effects than AKT inhibitors, further optimization, particularly of the pharmacokinetic properties of the large heterobifunctional degrader molecules will be necessary. In addition, reported on-target toxicities with AKT inhibitors (Jansen et al., 2016) suggest that more potent degraders may have a narrow therapeutic window, further necessitating the need to investigate the therapeutic viability of targeted AKT degradation.
Our data also support the value of INY-03-041 as a chemical probe for studying the acute biological effects of pan-AKT depletion. Existing methods for inducing AKT1, AKT2 and AKT3 depletion in cells have relied on CRISPR knockout or repression, doxycycline-inducible shRNAs, or transient transfection with siRNA, all of which require relatively long incubation periods (Degtyarev et al., 2008; Koseoglu et al., 2007). This not only prevents assessment of acute biological changes resulting from loss of AKT, but also may allow reprogramming and compensation of cellular networks. By contrast, INY-03-041 induces rapid degradation of all three AKT isoforms, thereby permitting the investigation of the phenotypes of acute pan-AKT depletion. Therefore, INY-03-041 will be a useful chemical tool to explore AKT biology inaccessible with current strategies.
SIGNIFICANCE
While many small molecule AKT inhibitors have been developed, here we demonstrate an alternative approach to targeting AKT by inducing its degradation, which resulted in distinct pharmacological effects. INY-03-041, a heterobifunctional degrader, promoted rapid and highly selective degradation of all three AKT isoforms and had more potent anti-proliferative effects than GDC-0068, the most clinically advanced AKT inhibitor. More importantly, INY-03-041-induced degradation of AKT and the ensuing suppression of downstream signaling were sustained for several days. Our work showcases the extended pharmacodynamic effects of degraders, and presents INY-03-041 as a tool to study acute changes to the AKT signaling network after rapid AKT degradation.
CONTACT FOR REAGENT AND RESOURCE SHARING
Further information and requests for resources and reagents should be directed to and will be fulfilled by the Lead Contact, Alex Toker (atoker@bidmc.harvard.edu). Requested compounds will be provided following completion of an MTA.
EXPERIMENTAL MODEL AND SUBJECT DETAILS
MOLT4 (male, CVCL_0013), Jurkat (male, CVCL_0065), ZR-75-1 (female, CVCL_0588), LNCaP (male, VCL_0395), T47D (female, CVCL_0553), MCF-7 (female, CVCL_0031) , MDA-MB-468 (female, CVCL_0419) , and HCC1937 (female, CVCL_0290) cells were cultured in RPMI media (Wisent Bioproducts) supplemented with 10% heat inactivated fetal bovine serum (Thermo Fisher Scientific) and 100U/mL Penicillin-Streptomycin (Gibco) at 37°C in the presence of 5% CO2. IGROV1 (female, CVCL_1304) and PC3 (male, CVCL_0035) cells were cultured in DMEM media (Gibco) supplemented with 10% heat inactivated fetal bovine serum (Thermo Fisher Scientific) and 100U/mL Penicillin-Streptomycin (Gibco) at 37°C in the presence of 5% CO2
METHODS DETAILS
Drug Treatment Experiments
Cells were plated at 250,000 cells per mL (MDA-MB-468, MOLT4, IGROV1, PC3, and Jurkat) or 200,000 cells per mL (T47D) in 2 mL per well of RPMI or DMEM media with 10% serum in 6-well treated tissue culture plates (Greiner, Cat # TCG-657160) or 60 mm treated tissue culture plates (Corning, Cat # 430166) and incubated overnight. The next day, cells were treated with the indicated compounds at the appropriate concentration and protein lysates were harvested at the times specified.
Immunoblotting
Cells were washed once in 1x PBS then lysed in RIPA buffer (150 mM Tris-HCl, 150 mM NaCl, 0.5% (w/v) sodium deoxycholate, 1% (v/v) NP-40, pH 7.5) containing 0.1% (w/v) sodium dodecyl sulfate, 1 mM sodium pyrophosphate, 20 mM sodium fluoride, 50 nM calyculin, and 0.5% (v/v) protease inhibitor cocktail (Sigma-Aldrich®) for 15 minutes. Cell extracts were precleared by centrifugation at 14,000 rpm for 10 minutes at 4°C. The Bio-Rad DC protein assay was used to assess protein concentration, and sample concentration was normalized using SDS sample buffer. Lysates were resolved on acrylamide gels by SDS-polyacrylamide gel electrophoresis and electrophoretically transferred to nitrocellulose membrane (BioRad) at 100 volts for 90 minutes. Membranes were blocked in 5% (w/v) nonfat dry milk in tris-buffered saline (TBS) buffer for 1 hour then incubated with specific primary antibodies diluted in 5% (w/v) nonfat dry milk in TBS-T (TBS with 0.05% Tween-20) at 4°C overnight, shaking. The next day, membranes were washed with TBS-T then incubated for 1 hour at room temperature with fluorophore-conjugated secondary antibodies (LI-COR Biosciences). The membrane was washed again with TBS-T then imaged with a LI-COR Odyssey CLx Imaging System (LI-COR Biosciences).
Growth Rate Assay and Analysis
Cell lines were plated at densities ranging from 500 to 2000 cells per well in a 384-well plate using a Matrix WellMate Reagent Dispenser (Thermo Fisher) and allowed 24 hours to adhere to plate prior to treatment. A D300 Digital Dispenser (Hewlett-Packard) was used to treat cells with dilution series of compounds as indicated. At the time of treatment and after 72 hours of treatment, cells were stained and fixed for subsequent analysis. Cells were stained with LIVE/DEAD Far Red Dead Cell Stain (LDR) (Thermo Fisher Scientific) at 1:2000 for 1 hour at 37°C. Cells were fixed for 30 minutes at room tempe rature in 4% formaldehyde (Sigma Aldrich) then permeabilized with 0.5% Triton X-100 in PBS. Cells were blocked for 1 hour using Odyssey Blocking Buffer (LI-COR Biosciences) and stained overnight at 4°C with 2 μg/ml Hoechst 33342 (Sigma Aldrich). An Operetta microscope was used to image fixed cells, and data was stored and analyzed using Columbus software (PerkinElmer). Nuclei were segmented by Hoechst signal using the Columbus system (Perkin Elmer). The average LDR and Hoechst intensities were determined within the nuclear area. Dead cells were classified by LDR signal. Experiments were performed in technical triplicate.
In Vitro Kinase Assays
Z’-LYTE assays were conducted for AKT1, AKT2, AKT3, PKG1, S6K1, PKN1, ßMSK2, and Haspin at Life Technologies in a 10-point dose response using Km ATP concentrations. LanthaScreen assays were conducted for RET (V804M) in a 10-point dose response at Life Technologies.
TMT LC-MS Sample Preparation
MOLT4 cells were treated with DMSO, 250 nM INY-03-041-01 for 4 hours in biological triplicates. Cells were harvested by centrifugation. Lysis buffer (8 M Urea, 50 mM NaCl, 50 mM 4-(2hydroxyethyl)-1-piperazineethanesulfonic acid (EPPS) pH 8.5, 1x Roche protease inhibitor and 1x Roche PhosphoStop was added to the cell pellets and cells were homogenized by 20 passes through a 21 gauge (1.25 in. long) needle to achieve a cell lysate with a protein concentration between 0.5 – 4 mg mL−1. The homogenized sample was clarified by centrifugation at 20,000 x g for 10 minutes at 4 °C. A Bradford assay was used to determine the final protein concentration in the cell lysate. 200 μg protein for each sample were reduced and alkylated as previously described(An et al., 2017). Proteins were precipitated using methanol/chloroform. In brief, four volumes of methanol were added to the cell lysate, followed by one volume of chloroform, and finally three volumes of water. The mixture was vortexed and centrifuged at 14,000 x g for 5 minutes to separate the chloroform phase from the aqueous phase. The precipitated protein was washed with three volumes of methanol, centrifuged at 14,000 x g for 5 min, and the resulting washed precipitated protein was allowed to air dry. Precipitated protein was resuspended in 4 M Urea, 50 mM HEPES pH 7.4, followed by dilution to 1 M urea with the addition of 200 mM EPPS pH 8 for digestion with LysC (1:50; enzyme:protein) for 12 hours at RT. The LysC digestion was diluted to 0.5 M Urea, 200 mM EPPS pH 8 and then digested with trypsin (1:50; enzyme:protein) for 6 hours at 37°C. Tandem mass tag (TMT) reagents (Thermo Fisher Scientific) were dissolved in anhydrous acetonitrile (ACN) according to manufacturer’s instructions. Anhydrous ACN was added to each peptide sample to a final concentration of 30% v/v, and labeling was induced with the addition of TMT reagent to each sample at a ratio of 1:4 peptide:TMT label. The 11-plex labeling reactions were performed for 1.5 hours at RT and the reaction quenched by the addition of 0.3% hydroxylamine for 15 minutes at RT. The sample channels were combined at a 1:1:1:1:1:1:1:1:1:1:1 ratio, desalted using C18 solid phase extraction cartridges (Waters) and analyzed by LC-MS for channel ratio comparison. Samples were then combined using the adjusted volumes determined in the channel ratio analysis and dried down in a speed vacuum. The combined sample was then resuspended in 1% formic acid and acidified (pH 2–3) before being subjected to desalting with C18 SPE (Sep-Pak, Waters). Samples were then offline fractionated into 96 fractions by high pH reverse-phase HPLC (Agilent LC1260) through an aeris peptide xb-c18 column (phenomenex) with mobile phase A containing 5% acetonitrile and 10 mM NH4HCO3 in LC-MS grade H2O, and mobile phase B containing 90% acetonitrile and 10 mM NH4HCO3 in LC-MS grade H2O (both pH 8.0). The 96 resulting fractions were then pooled in a non-continuous manner into 24 fractions and every fraction was used for subsequent mass spectrometry analysis.
Data were collected using an Orbitrap Fusion Lumos mass spectrometer (Thermo Fisher Scientific, San Jose, CA, USA) coupled with a Proxeon EASY-nLC 1200 LC pump (Thermo Fisher Scientific). Peptides were separated on a 50 cm and 75 μm inner diameter Easyspray column (ES803a, Thermo Fisher Scientific). Peptides were separated using a 190 minute gradient of 6 – 27% acetonitrile in 1.0% formic acid with a flow rate of 300 nL/min.
Each analysis used an MS3-based TMT method as described previously (McAlister et al., 2014). The data were acquired using a mass range of m/z 340 – 1350, resolution 120,000, AGC target 5 x 10⁵, maximum injection time 100 ms, dynamic exclusion of 120 seconds for the peptide measurements in the Orbitrap. Data dependent MS2 spectra were acquired in the ion trap with a normalized collision energy (NCE) set at 35%, AGC target set to 1.8 x 10⁴ and a maximum injection time of 120 ms. MS3 scans were acquired in the Orbitrap with a HCD collision energy set to 55%, AGC target set to 2 x 10⁵, maximum injection time of 150 ms, resolution at 50,000 and with a maximum synchronous precursor selection (SPS) precursors set to 10.
LC-MS Data analysis
Proteome Discoverer 2.2 (Thermo Fisher) was used for .RAW file processing and controlling peptide and protein level false discovery rates, assembling proteins from peptides, and protein quantification from peptides. MS/MS spectra were searched against a Uniprot human database (September 2016) with both the forward and reverse sequences. Database search criteria are as follows: tryptic with two missed cleavages, a precursor mass tolerance of 10 ppm, fragment ion mass tolerance of 0.6 Da, static alkylation of cysteine (57.02146 Da), static TMT labeling of lysine residues and N-termini of peptides (229.16293 Da), variable phosphorylation of serine, threonine and tyrosine (79.966 Da), and variable oxidation of methionine (15.99491 Da). TMT reporter ion intensities were measured using a 0.003 Da window around the theoretical m/z for each reporter ion in the MS3 scan. Peptide spectral matches with poor quality MS3 spectra were excluded from quantitation (summed signal-to-noise across 10 channels < 200 and precursor isolation specificity < 0.5). Only proteins containing at least two unique peptides identified in the experiment were included in final quantitation.
Chemistry Synthetic Scheme
General Chemistry Methods
Reagents and solvents were purchased from commercial suppliers and were used without further purification unless otherwise noted. Reactions were monitored using a Waters Acquity UPLC/MS system (Waters PDA eλ Detector, QDa Detector, Sample manager - FL, Binary Solvent Manager) using Acquity UPLC® BEH C18 column (2.1 x 50 mm, 1.7 μm particle size): solvent gradient = 85% A at 0 min, 1% A at 1.7 min; solvent A = 0.1% formic acid in Water; solvent B = 0.1% formic acid in Acetonitrile; flow rate: 0.6 mL/min. Products were purified by flash column chromatography using CombiFlash®Rf with Teledyne Isco RediSep® normal-phase silica flash columns (4 g, 12 g, 24 g, 40 g or 80 g) and preparative HPLC using Waters SunFireTM Prep C18 column (19 x 100 mm, 5 μm particle size) using a gradient of 15-75% methanol in water containing 0.05% trifluoroacetic acid (TFA) over 48 min (60 min run time) at a flow of 40 mL/min. 1H NMR spectra were recorded on 500 MHz Bruker Avance III spectrometer, and chemical shifts are reported in million (ppm, δ) downfield from tetramethylsilane (TMS). Coupling constants (J) are reported in Hz. Spin multiplicities are described as s (singlet), br (broad singlet), d (doublet), t (triplet), q (quartet) and m (multiplet). Purities of assayed compounds were in all cases greater than 95%, as determined by reverse-phase HPLC analysis.
Chemical Synthesis of INY-03-041 and INY-03-112
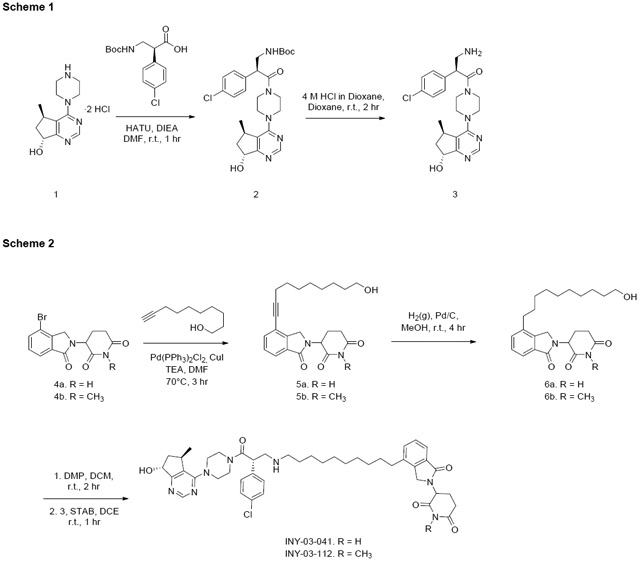
Chemical Synthesis of 3
Tert-butyl((S)-2-(4-chlorophenyl)-3-(4-((5R,7R)-7-hydroxy-5-methyl-6,7-dihydro-5H-cyclopenta[d]pyrimidin-4-yl)piperazin-1-yl)-3-oxopropyl)carbamate (2):
To a solution of known intermediate 1 (Blake et al., 2012) (727 mg, 2.37 mmol), (S)-3-((tert-butoxycarbonyl)amino)-2-(4-chlorophenyl)propanoic acid (711 mg, 2.37 mmol) and HATU (902 mg, 2.37 mmol) in DMF (12 mL) was added DIEA (2.1 mL) and stirred for 1 hour at r.t. The reaction mixture was diluted ethyl acetate (30 mL) and washed with water (2 x 15 mL) and brine (2 x 15 mL). The organic layer was dried over anhydrous sodium sulfate, filtered, and concentrated in vacuo to afford 2 as a yellow oil (1.22 g, 100% yield). The crude was used directly for the next reaction. LC-MS: m/z 516.27 [M+1].
(S)-3-amino-2-(4-chlorophenyl)-1-(4-((5R,7R)-7-hydroxy-5-methyl-6,7-dihydro-5H-cyclopenta[d]pyrimidin-4-yl)piperazin-1-yl)propan-1-one (3):
To a solution of intermediate 2 (1.22 g, 2.37 mmol) in dioxane (7 mL) was added 4 M HCl in dioxane (5 mL). The reaction was stirred at r.t. for 4 hours. The reaction mixture was concentrated in vacuo and purified by reverse-phase HPLC (95-35% methanol in water) to obtain 3 as a TFA salt. The resultant TFA salt was dissolved in a mixture of 4:1 chloroform: isopropanol (50 mL) and washed with sat. aq sodium bicarbonate (50 mL) to give 3 as a white foam (868 mg, 88% yield). LC-MS: m/z 416.25 [M+1]. 1H NMR (500 MHz, DMSO-d6) δ 8.43 (s, 1H), 7.43 – 7.38 (m, 2H), 7.35 – 7.28 (m, 2H), 4.84 (t, J = 7.3, 6.2 Hz, 1H), 4.07 (dd, J = 8.3, 5.3 Hz, 1H), 3.73 – 3.66 (m, 1H), 3.64 – 3.56 (m, 3H), 3.52 – 3.35 (m, 4H), 3.22 – 3.16 (m, 1H), 3.09 (dd, J = 12.6, 8.3 Hz, 1H), 2.72 – 2.67 (m, 1H), 2.01 – 1.87 (m, 2H), 1.04 (dd, J = 6.5, 3.9 Hz, 3H).
Synthesis of INY-03-041 and INY-03-112
3-(4-(10-hydroxydec-1-yn-1-yl)-1-oxoisoindolin-2-yl)piperidine-2,6-dione (5a)
Known intermediate 4a (Zhou et al., 2018) (500 mg, 1.55 mmol), dec-9-yn-1-ol (478 mg, 3.10 mmol), Pd(PPh3)2Cl2 (113 mg, 0.16 mmol) and CuI (61 mg, 0.32 mmol) were dissolved in TEA (4 mL) and DMF (8 mL). The reaction mixture was flushed with nitrogen (x3) and stirred at 70°C for 3 hours. The reaction mixture was cooled to r.t., diluted with ethyl acetate (50 mL) and filtered through celite. The organic layer was washed with brine (3 x 20 mL), dried over anhydrous sodium sulfate, filtered and concentrated in vacuo. The crude material was purified by column chromatography on silica gel (9:1 DCM:MeOH) to afford 5a as a pale yellow solid (503 mg, 82% yield). LC-MS: m/z 397.24 [M+1]. 1H NMR (500 MHz, DMSO-d6) δ 11.00 (s, 1H), 7.71 (dd, J = 7.6, 1.0 Hz, 1H), 7.64 (dd, J = 7.7, 1.0 Hz, 1H), 7.52 (t, J = 7.6 Hz, 1H), 5.76 (s, 2H), 5.15 (dd, J = 13.3, 5.2 Hz, 1H), 4.45 (d, J = 17.6 Hz, 1H), 4.31 (d, J = 17.6 Hz, 1H), 3.37 (t, J = 6.5 Hz, 2H), 2.92 (ddd, J = 17.3, 13.6, 5.5 Hz, 1H), 2.64 – 2.57 (m, 1H), 2.50 – 2.40 (m, 2H), 2.06 – 1.99 (m, 1H), 1.62 – 1.54 (m, 2H), 1.47 – 1.37 (m, 3H), 1.36 – 1.23 (m, 5H), 1.18 (t, J = 7.3 Hz, 1H).
3-(4-(10-hydroxydecyl)-1-oxoisoindolin-2-yl)piperidine-2,6-dione (6a)
To a solution of intermediate 5a (100 mg, 0.25 mmol) in MeOH (10 mL) was added Pd/C (10 mg). H2 (g) was introduced to the reaction mixture, and the reaction was stirred at r.t. for 4 hours. The reaction mixture was filtered over celite and concentrated in vacuo to afford 6a as a white solid (91 mg, 91% yield). LC-MS: m/z 401.30 [M+1]. 1H NMR (500 MHz, DMSO-d6) δ 10.98 (s, 1H), 7.60 – 7.54 (m, 1H), 7.50 – 7.41 (m, 2H), 5.13 (dd, J = 13.3, 5.1 Hz, 1H), 4.45 (d, J = 17.2 Hz, 1H), 4.34 – 4.28 (m, 2H), 3.36 (td, J = 6.5, 4.9 Hz, 2H), 2.92 (ddd, J = 17.3, 13.7, 5.4 Hz, 1H), 2.66 – 2.58 (m, 3H), 2.43 (qd, J = 13.3, 4.5 Hz, 1H), 2.01 (dtd, J = 12.7, 5.2, 2.2 Hz, 1H), 1.66 – 1.54 (m, 2H), 1.43 – 1.35 (m, 2H), 1.33 – 1.21 (m, 12H).
3-(4-(10-(((S)-2-(4-chlorophenyl)-3-(4-((5R,7R)-7-hydroxy-5-methyl-6,7-dihydro-5H-cyclopenta[d]pyrimidin-4-yl)piperazin-1-yl)-3-oxopropyl)amino)decyl)-1-oxoisoindolin-2-yl)piperidine-2,6-dione (INY-03-41)
To a solution of intermediate 6a (83 mg, 0.21 mmol) in DCM (4 mL) was added DMP (132 mg, 0.31 mmol). The reaction was stirred at r.t. for 2 hours. The reaction mixture was filtered and concentrated in vacuo to obtain 10-(2-(2,6-dioxopiperidin-3-yl)-1-oxoisoindolin-4-yl)decanal (84 mg, quantitative yield). LC-MS: m/z 399.27 [M+1]. The crude material was then dissolved in DCE (2 mL), followed by addition of intermediate 3 (131 mg, 0.31 mmol). The reaction was stirred at r.t. for 30 minutes, after which STAB (89 mg, 0.42 mmol) was added. The reaction mixture was stirred for an additional 1 hour. The reaction was quenched by sat. aq sodium bicarbonate (10 mL) and extracted with DCM (3 x 20 mL). The organic layers were combined, dried over anhydrous sodium sulfate, filtered and concentrated in vacuo. The crude residue was purified by reverse-phase HPLC (75-15% methanol in water) to obtain INY-03-041 (TFA salt). The resultant TFA salt was dissolved in 4:1 chloroform: isopropanol (10 mL) and washed with sat. aq sodium bicarbonate. The organic layer was dried over anhydrous sodium sulfate, filtered and concentrated in vacuo to afford title compound as an off-white solid (42 mg, 25% yield). LC-MS: m/z 798.42 [M+1]. 1H NMR (500 MHz, DMSO-d6) δ 8.43 (s, 1H), 7.56 (dd, J = 5.4, 3.2 Hz, 1H), 7.45 – 7.43 (m, 2H), 7.41 (d, J = 8.2 Hz, 2H), 7.34 (d, J = 8.2 Hz, 2H), 5.38 (d, 1H), 5.13 (dd, J = 13.3, 5.1 Hz, 1H), 4.87 – 4.80 (m, 1H), 4.45 (d, J = 17.1 Hz, 1H), 4.29 (dd, J = 15.4, 7.6 Hz, 2H), 3.70 – 3.56 (m, 5H), 3.51 – 3.42 (m, 3H), 3.41 – 3.36 (m, 1H), 3.24 – 3.16 (m, 2H), 2.92 (ddd, J = 17.9, 13.8, 5.4 Hz, 1H), 2.77 – 2.71 (m, 1H), 2.63 (t, J = 7.5 Hz, 3H), 2.60 – 2.55 (m, 2H), 2.42 (tt, J = 13.3, 6.6 Hz, 1H), 2.04 – 1.93 (m, 2H), 1.93 – 1.87 (m, 1H), 1.62 – 1.55 (m, 2H), 1.41 – 1.35 (m, 2H), 1.32 – 1.26 (m, 4H), 1.22 (s, 8H), 1.03 (d, J = 6.8 Hz, 3H).
3-(4-(10-hydroxydec-1-yn-1-yl)-1-oxoisoindolin-2-yl)-1-methylpiperidine-2,6-dione (5b)
5b was synthesized with similar procedures as 5a using intermediate 4b (90 mg, 0.27 mmol) as the starting material. 5b was obtained as a light orange solid (49 mg, 44% yield). LC-MS: m/z 411.51 [M+1]. 1H NMR (500 MHz, DMSO-d6) δ 7.71 (dd, J = 7.6, 1.0 Hz, 1H), 7.63 (dd, J = 6.8, 1.2 Hz, 1H), 7.52 (t, J = 7.6 Hz, 1H), 5.21 (dd, J = 13.5, 5.1 Hz, 1H), 4.44 (d, J = 17.6 Hz, 1H), 4.30 (d, J = 17.6 Hz, 1H), 3.36 (t, J = 6.5 Hz, 2H), 3.04 – 2.95 (m, 4H), 2.79 – 2.72 (m, 1H), 2.47 (t, J = 7.1 Hz, 2H), 2.45 – 2.39 (m, 1H), 2.03 (dtd, J = 12.7, 5.2, 2.2 Hz, 1H), 1.61 – 1.52 (m, 2H), 1.47 – 1.34 (m, 4H), 1.34 – 1.24 (m, 6H).
3-(4-(10-hydroxydecyl)-1-oxoisoindolin-2-yl)-1-methylpiperidine-2,6-dione (6b)
6b was synthesized with similar procedures as 6a using intermediate 5b (42 mg, 0.1 mmol) as the starting material. 6b was obtained as an off-white solid (33 mg, 79% yield). LC-MS: m/z 415.57 [M+1]. 1H NMR (500 MHz, DMSO-d6) δ 7.60 – 7.53 (m, 1H), 7.49 – 7.43 (m, 2H), 5.20 (dd, J = 13.4, 5.1 Hz, 1H), 4.45 (d, J = 17.1 Hz, 1H), 4.32 – 4.27 (m, 2H), 3.36 (td, J = 6.6, 5.1 Hz, 2H), 3.01 (s, 3H), 3.00 – 2.95 (m, 1H), 2.79 – 2.74 (m, 1H), 2.66 – 2.61 (m, 2H), 2.48 – 2.39 (m, 1H), 2.08 – 1.98 (m, 1H), 1.63 – 1.56 (m, 2H), 1.43 – 1.34 (m, 2H), 1.32 – 1.22 (m, 12H).
3-(4-(10-(((S)-2-(4-chlorophenyl)-3-(4-((5R,7R)-7-hydroxy-5-methyl-6,7-dihydro-5H-cyclopenta[d]pyrimidin-4-yl)piperazin-1-yl)-3-oxopropyl)amino)decyl)-1-oxoisoindolin-2-yl)-1-methylpiperidine-2,6-dione (INY-03-112)
INY-03-112 was synthesized with similar procedures as INY-03-041 using intermediate 6b (27 mg, 0.07 mmol) as the starting material. INY-03-112 was obtained as an off-white solid (9 mg, 16% yield). LC-MS: m/z 812.47 [M+1]. 1H NMR (500 MHz, DMSO-d6) δ 8.43 (s, 1H), 7.57 (dd, J = 5.8, 2.8 Hz, 1H), 7.49 – 7.43 (m, 4H), 7.37 – 7.32 (m, 2H), 5.40 (d, J = 5.5 Hz, 1H), 5.21 (dd, J = 13.4, 5.1 Hz, 1H), 4.83 (q, J = 6.3 Hz, 1H), 4.45 (d, J = 17.1 Hz, 1H), 4.38 (dd, J = 8.9, 5.1 Hz, 1H), 4.29 (d, J = 17.1 Hz, 1H), 3.76 – 3.41 (m, 8H), 3.41 – 3.34 (m, 3H), 3.10 (t, J = 10.0 Hz, 1H), 3.01 (s, 3H), 2.99 – 2.95 (m, 1H), 2.83 – 2.73 (m, 3H), 2.63 (t, J = 7.7 Hz, 2H), 2.43 (qd, J = 13.2, 4.5 Hz, 1H), 2.05 – 1.87 (m, 3H), 1.59 (t, J = 7.5 Hz, 2H), 1.50 (s, 2H), 1.33 – 1.27 (m, 4H), 1.23 (s, 8H), 1.02 (d, J = 6.9 Hz, 3H).
QUANTIFICATION AND STATISTICAL ANALYSIS
Anti-proliferation Assay
Growth rate inhibition values were determined as described previously (Hafner et al., 2017) using python 3.7.3. Data was visualized using a non-linear regression curve fit in GraphPad Prism 8. N=3 biological replicates were used for each treatment condition and each data point represents the mean +/− SEM, as also indicated by the figure legend.
LC-MS Data Analysis
Reporter ion intensities were normalized and scaled using in house scripts and the R framework(Team, 2013). Statistical analysis was carried out using a moderated t-test in the limma package within the R framework (Ritchie et al., 2015).
DATA AND SOFTWARE AVAILABILITY
The accession number for the proteomic data reported in this paper is Pride: PXD015207
Supplementary Material
Table S1. Biochemical IC50 (nM) values for INY-03-041 and INY-03-112, and KINOMEscan hits. Related to Figure 1 and Figure S1. Z’lyte kinase assays (Invitrogen) were conducted to assess IC50 values for all kinases listed in the table with the exception of RET (V804M) which was assayed using LanthaScreen assays (Invitrogen).
Table S2. Proteomics output from limma processing of MOLT4 cells treated for 4 hours with INY-03-041 vs DMSO control. Related to Figure 2.
KEY RESOURCES TABLE
| REAGENT or RESOURCE | SOURCE | IDENTIFIER |
|---|---|---|
| Antibodies | ||
| Rabbit monoclonal anti AKT1 | Cell Signaling Technology | Cat# 2938; RRID: AB_915788 |
| Rabbit monoclonal anti AKT2 | Cell Signaling Technology | Cat# 3063; RRID: AB_2225186 |
| Mouse monoclonal anti AKT3 | Cell Signaling Technology | Cat# 8018; RRID: AB_10859371 |
| Rabbit monoclonal anti AKT (pan) | Cell Signaling Technology | Cat# 4691; RRID: AB_915783 |
| Mouse monoclonal anti AKT (pan) | Cell Signaling Technology | Cat# 2920; RRID: AB_1147620 |
| Rabbit monoclonal anti Phospho-PRAS40 (T246) | Cell Signaling Technology | Cat# 2997; RRID: AB_2258110 |
| Rabbit monoclonal anti PRAS40 | Cell Signaling Technology | Cat# 2691; RRID: AB_2225033 |
| Rabbit monoclonal anti GSK3β | Cell Signaling Technology | Cat# 9315; RRID: AB_490890 |
| Rabbit polyclonal anti Phospho-GSK3β (S9) | Cell Signaling Technology | Cat# 9336; RRID: AB_331405 |
| Rabbit monoclonal anti S6 Ribosomal Protein | Cell Signaling Technology | Cat# 2217; RRID: AB_331355 |
| Rabbit polyclonal anti Phospho-S6 Ribosomal Protein (S240/244) | Cell Signaling Technology | Cat# 2215; RRID: AB_331682 |
| Rabbit monoclonal anti Phospho-S6 Ribosomal Protein (S240/244) | Cell Signaling Technology | Cat# 5364; RRID: AB_1069423 |
| Rabbit monoclonal anti Vinculin | Cell Signaling Technology | Cat# 13901; RRID: AB_2728768 |
| Rabbit monoclonal anti p70S6 Kinase | Cell Signaling Technology | Cat# 2708; RRID: AB_390722 |
| Rabbit monoclonal anti Ikaros | Cell Signaling Technology | Cat# 14859; RRID: AB_2744523 |
| Rabbit monoclonal anti Aiolos | Cell Signaling Technology | Cat# 15103; RRID: AB_2744524 |
| Rabbit monoclonal anti β-actin | Cell Signaling Technology | Cat# 4970; RRID: AB_2223172 |
| Chemicals, Peptides, and Recombinant Proteins | ||
| DMSO | Fisher | Cat# BP231-100 |
| Bortezomib (PS-341) | Cayman Chemical | Cat# 10008822 |
| Pevonedistat (MLN4924) | Selleckchem | Cat# S7109 |
| GDC-0068 | Selleckchem | Cat# S2808 |
| Lenalidomide | Sigma Aldrich | Cat# 901558 |
| Penicillin Streptomycin | Thermo Fisher Scientific | Cat# 15140122 |
| RPMI Medium | Wisent Bioproducts | Cat# 350000CL |
| DMEM Medium | Thermo Fisher Scientific | Cat# 11965118 |
| LIVE/DEAD Far Red | Thermo Fisher Scientific | Cat# L34974 |
| INY-03-041 | This study | N/A |
| INY-03-112 | This study | N/A |
| Critical Commercial Assays | ||
| Z’ Lyte (AKT1) | Invitrogen | Assay ID 247 |
| Z’ Lyte (AKT2) | Invitrogen | Assay ID 250 |
| Z’ Lyte (AKT3) | Invitrogen | Assay ID 253 |
| Z’ Lyte (PKG1) | Invitrogen | Assay ID 757 |
| Z’ Lyte (S6K1) | Invitrogen | Assay ID 810 |
| Z’ Lyte (PKN1) | Invitrogen | Assay ID 703 |
| Z’ Lyte (βMSK2) | Invitrogen | Assay ID 801 |
| Z’ Lyte (Haspin) | Invitrogen | Assay ID 1115 |
| Lanthascreen (RET (V804M)) | Invitrogen | Assay ID 1847 |
| Deposited Data | ||
| INY-03-041 Proteomics in MOLT4 cells | This study | Pride: PXD015207 |
| Experimental Models: Cell Lines | ||
| MOLT4 | ATCC | CRL-1582; RRID: CVCL_0013 |
| Jurkat | ATCC | TIB-152; RRID: CVCL_0367 |
| ZR-75-1 | ATCC | CRL-1500; RRID: CVCL_0588 |
| LNCaP | Steven P. Balk’s Lab | N/A |
| T47D | ATCC | HTB-133; RRID: CVCL_0553 |
| MCF7 | ATCC | HTB-22; RRID:CVCL_0031 |
| MDA-MB-468 | ATCC | HTB-132; RRID: CVCL_0419 |
| HCC1937 | ATCC | CRL-2336; RRID: CVCL_0290 |
| IGROV1 | Panagiotis A. Konstantinopoulos’s Lab | N/A |
| PC3 | Jarrod A. Marto’s Lab | N/A |
| Software and Algorithms | ||
| GraphPad Prism | GraphPad Software, Inc. | www.graphpad.com/ |
| Columbus image storage and analysis | PerkinElmer Informatics | http://www.perkinelmer.com/product/image-data-storage-and-analysis-system-columbus |
| Adobe Illustrator | Adobe Creative Cloud | https://www.adobe.com/creativecloud.html |
| Proteome Discoverer 2.2 | Thermo Fisher Scientific | https://www.thermofisher.com/order/catalog/product/OPTON-30795 |
| R Framework | Team RCR: A Language and Environment for Statistical Computing | http://www.R-project.org/ |
| Python 3.7.3 | Python Software Foundation | https://www.python.org/ |
Highlights.
An AKT-selective heterobifunctional degrader was developed
AKT degradation induced stronger anti-proliferative effects than AKT inhibition
AKT loss and inhibition of downstream signaling was sustained, even after washout
ACKNOWLEDGEMENTS
We would like to thank Eric Wang and Milka Kostic for helpful comments on the manuscript. We would also like to thank Caitlin Mills and Kartik Subramanian (Laboratory for Systems Pharmacology at Harvard Medical School) for their help with proliferation data collection and analysis. This work was supported by the Training Grant in Chemical Biology (NIH 7 T32 GM095450-07, I.Y.), the Training Grant in Pharmacological Sciences (NIH 1 T32 GM132089-01, I.Y.), the National Science Foundation Graduate Research Fellowship Program (DGE1745303, E.C.E.), the NIH 1R01 CA218278-01A1 (E.S.F., N.S.G.) and the Ludwig Center at Harvard (E.C.E., A.T.).
Abbreviations Used
- DCM
Dichloromethane
- DIEA
N,N-Diisopropylethylamine
- DMF
Dimethylformamide
- TEA
Triethylamine
- DMP
Dess–Martin periodinane
- STAB
Sodium triacetoxyborohydride
- DCE
1,2-Dichloroethane
- MeOH
Methanol
Footnotes
DECLARATION OF INTERESTS
A.T. is a consultant for Oncologie, Inc. N.S.G. is a Scientific Founder and member of the Scientific Advisory Board (SAB) of C4 Therapeutics, Syros, Soltego, B2S, Gatekeeper and Petra Pharmaceuticals and has received research funding from Novartis, Astellas, Taiho and Deerfield. E.S.F. is a founder and/or member of the scientific advisory board (SAB), and equity holder of C4 Therapeutics and Civetta Therapeutics and a consultant to Novartis, AbbVie and Pfizer. The Fischer lab receives research funding from Novartis, Deerfield and Astellas. I.Y., E.C.E., K.A.D., E.S.F., A.T., and N.S.G. are inventors on a patent application related to the AKT degraders described in this manuscript.
Publisher's Disclaimer: This is a PDF file of an unedited manuscript that has been accepted for publication. As a service to our customers we are providing this early version of the manuscript. The manuscript will undergo copyediting, typesetting, and review of the resulting proof before it is published in its final form. Please note that during the production process errors may be discovered which could affect the content, and all legal disclaimers that apply to the journal pertain.
REFERENCES
- An J, Ponthier CM, Sack R, Seebacher J, Stadler MB, Donovan KA, and Fischer ES (2017). pSILAC mass spectrometry reveals ZFP91 as IMiD-dependent substrate of the CRL4CRBN ubiquitin ligase. Nat Commun 8, 15398. [DOI] [PMC free article] [PubMed] [Google Scholar]
- An S, and Fu L (2018). Small-molecule PROTACs: An emerging and promising approach for the development of targeted therapy drugs. EBioMedicine 36, 553–562. [DOI] [PMC free article] [PubMed] [Google Scholar]
- Basso AD, Solit DB, Chiosis G, Giri B, Tsichlis P, and Rosen N (2002). Akt forms an intracellular complex with heat shock protein 90 (Hsp90) and Cdc37 and is destabilized by inhibitors of Hsp90 function. J Biol Chem 277, 39858–39866. [DOI] [PubMed] [Google Scholar]
- Blake JF, Xu R, Bencsik JR, Xiao D, Kallan NC, Schlachter S, Mitchell IS, Spencer KL, Banka AL, Wallace EM, et al. (2012). Discovery and preclinical pharmacology of a selective ATP-competitive Akt inhibitor (GDC-0068) for the treatment of human tumors. J Med Chem 55, 8110–8127. [DOI] [PubMed] [Google Scholar]
- Brand M, Jiang B, Bauer S, Donovan KA, Liang Y, Wang ES, Nowak RP, Yuan JC, Zhang T, Kwiatkowski N, et al. (2018). Homolog-Selective Degradation as a Strategy to Probe the Function of CDK6 in AML. Cell Chem Biol. [DOI] [PMC free article] [PubMed] [Google Scholar]
- Brown JS, and Banerji U (2017). Maximising the potential of AKT inhibitors as anti-cancer treatments. Pharmacol Ther 172, 101–115. [DOI] [PMC free article] [PubMed] [Google Scholar]
- Cai J, Cai LQ, Hong Y, and Zhu YS (2012). Functional characterisation of a natural androgen receptor missense mutation (N771H) causing human androgen insensitivity syndrome. Andrologia 44 Suppl 1, 523–529. [DOI] [PubMed] [Google Scholar]
- Cantley LC, and Neel BG (1999). New insights into tumor suppression: PTEN suppresses tumor formation by restraining the phosphoinositide 3-kinase/AKT pathway. Proc Natl Acad Sci U S A 96, 4240–4245. [DOI] [PMC free article] [PubMed] [Google Scholar]
- Churcher I (2018). Protac-Induced Protein Degradation in Drug Discovery: Breaking the Rules or Just Making New Ones? J Med Chem 61, 444–452. [DOI] [PubMed] [Google Scholar]
- Cromm PM, Samarasinghe KTG, Hines J, and Crews CM (2018). Addressing Kinase-Independent Functions of Fak via PROTAC-Mediated Degradation. J Am Chem Soc. [DOI] [PubMed] [Google Scholar]
- Cross DA, Alessi DR, Cohen P, Andjelkovich M, and Hemmings BA (1995). Inhibition of glycogen synthase kinase-3 by insulin mediated by protein kinase B. Nature 378, 785–789. [DOI] [PubMed] [Google Scholar]
- Degtyarev M, De Maziere A, Orr C, Lin J, Lee BB, Tien JY, Prior WW, van Dijk S, Wu H, Gray DC, et al. (2008). Akt inhibition promotes autophagy and sensitizes PTEN-null tumors to lysosomotropic agents. J Cell Biol 183, 101–116. [DOI] [PMC free article] [PubMed] [Google Scholar]
- Do K, Speranza G, Bishop R, Khin S, Rubinstein L, Kinders RJ, Datiles M, Eugeni M, Lam MH, Doyle LA, et al. (2015). Biomarker-driven phase 2 study of MK-2206 and selumetinib (AZD6244, ARRY-142886) in patients with colorectal cancer. Invest New Drugs 33, 720–728. [DOI] [PMC free article] [PubMed] [Google Scholar]
- Dobrovolsky D, Wang ES, Morrow S, Leahy C, Faust T, Nowak RP, Donovan KA, Yang G, Li Z, Fischer ES, et al. (2018). Bruton's Tyrosine Kinase degradation as a therapeutic strategy for cancer. Blood. [DOI] [PMC free article] [PubMed] [Google Scholar]
- Donovan KA, An J, Nowak RP, Yuan JC, Fink EC, Berry BC, Ebert BL, and Fischer ES (2018). Thalidomide promotes degradation of SALL4, a transcription factor implicated in Duane Radial Ray syndrome. Elife 7. [DOI] [PMC free article] [PubMed] [Google Scholar]
- Farnaby W, Koegl M, Roy MJ, Whitworth C, Diers E, Trainor N, Zollman D, Steurer S, Karolyi-Oezguer J, Riedmueller C, et al. (2019). BAF complex vulnerabilities in cancer demonstrated via structure-based PROTAC design. Nat Chem Biol 15, 672–680. [DOI] [PMC free article] [PubMed] [Google Scholar]
- Fruman DA, Chiu H, Hopkins BD, Bagrodia S, Cantley LC, and Abraham RT (2017). The PI3K Pathway in Human Disease. Cell 170, 605–635. [DOI] [PMC free article] [PubMed] [Google Scholar]
- Hafner M, Heiser LM, Williams EH, Niepel M, Wang NJ, Korkola JE, Gray JW, and Sorger PK (2017). Quantification of sensitivity and resistance of breast cancer cell lines to anti-cancer drugs using GR metrics. Sci Data 4, 170166. [DOI] [PMC free article] [PubMed] [Google Scholar]
- Han X, Wang C, Qin C, Xiang W, Fernandez-Salas E, Yang CY, Wang M, Zhao L, Xu T, Chinnaswamy K, et al. (2019). Discovery of ARD-69 as a Highly Potent Proteolysis Targeting Chimera (PROTAC) Degrader of Androgen Receptor (AR) for the Treatment of Prostate Cancer. J Med Chem 62, 941–964. [DOI] [PubMed] [Google Scholar]
- Huck BR, and Mochalkin I (2017). Recent progress towards clinically relevant ATP-competitive Akt inhibitors. Bioorg Med Chem Lett 27, 2838–2848. [DOI] [PubMed] [Google Scholar]
- Jansen VM, Mayer IA, and Arteaga CL (2016). Is There a Future for AKT Inhibitors in the Treatment of Cancer? Clin Cancer Res 22, 2599–2601. [DOI] [PMC free article] [PubMed] [Google Scholar]
- Keppler-Noreuil KM, Sapp JC, Lindhurst MJ, Darling TN, Burton-Akright J, Bagheri M, Dombi E, Gruber A, Jarosinski PF, Martin S, et al. (2019). Pharmacodynamic Study of Miransertib in Individuals with Proteus Syndrome. Am J Hum Genet 104, 484–491. [DOI] [PMC free article] [PubMed] [Google Scholar]
- Koseoglu S, Lu Z, Kumar C, Kirschmeier P, and Zou J (2007). AKT1, AKT2 and AKT3-dependent cell survival is cell line-specific and knockdown of all three isoforms selectively induces apoptosis in 20 human tumor cell lines. Cancer Biol Ther 6, 755–762. [DOI] [PubMed] [Google Scholar]
- Kronke J, Fink EC, Hollenbach PW, MacBeth KJ, Hurst SN, Udeshi ND, Chamberlain PP, Mani DR, Man HW, Gandhi AK, et al. (2015). Lenalidomide induces ubiquitination and degradation of CK1alpha in del(5q) MDS. Nature 523, 183–188. [DOI] [PMC free article] [PubMed] [Google Scholar]
- Kronke J, Hurst SN, and Ebert BL (2014). Lenalidomide induces degradation of IKZF1 and IKZF3. Oncoimmunology 3, e941742. [DOI] [PMC free article] [PubMed] [Google Scholar]
- Lin J, Sampath D, Nannini MA, Lee BB, Degtyarev M, Oeh J, Savage H, Guan Z, Hong R, Kassees R, et al. (2013). Targeting activated Akt with GDC-0068, a novel selective Akt inhibitor that is efficacious in multiple tumor models. Clin Cancer Res 19, 1760–1772. [DOI] [PubMed] [Google Scholar]
- Manning BD, and Toker A (2017). AKT/PKB Signaling: Navigating the Network. Cell 169, 381–405. [DOI] [PMC free article] [PubMed] [Google Scholar]
- McAlister GC, Nusinow DP, Jedrychowski MP, Wuhr M, Huttlin EL, Erickson BK, Rad R, Haas W, and Gygi SP (2014). MultiNotch MS3 enables accurate, sensitive, and multiplexed detection of differential expression across cancer cell line proteomes. Anal Chem 86, 7150–7158. [DOI] [PMC free article] [PubMed] [Google Scholar]
- Meric-Bernstam F, Akcakanat A, Chen H, Do KA, Sangai T, Adkins F, Gonzalez-Angulo AM, Rashid A, Crosby K, Dong M, et al. (2012). PIK3CA/PTEN mutations and Akt activation as markers of sensitivity to allosteric mTOR inhibitors. Clin Cancer Res 18, 1777–1789. [DOI] [PMC free article] [PubMed] [Google Scholar]
- Nowak RP, DeAngelo SL, Buckley D, He Z, Donovan KA, An J, Safaee N, Jedrychowski MP, Ponthier CM, Ishoey M, et al. (2018). Plasticity in binding confers selectivity in ligand-induced protein degradation. Nat Chem Biol 14, 706–714. [DOI] [PMC free article] [PubMed] [Google Scholar]
- Oliveira M, Saura C, Nuciforo P, Calvo I, Andersen J, Passos-Coelho JL, Gil Gil M, Bermejo B, Patt DA, Ciruelos E, et al. (2019). FAIRLANE, a double-blind placebo-controlled randomized phase II trial of neoadjuvant ipatasertib plus paclitaxel for early triple-negative breast cancer. Ann Oncol. [DOI] [PubMed] [Google Scholar]
- Olson CM, Jiang B, Erb MA, Liang Y, Doctor ZM, Zhang Z, Zhang T, Kwiatkowski N, Boukhali M, Green JL, et al. (2018). Pharmacological perturbation of CDK9 using selective CDK9 inhibition or degradation. Nat Chem Biol 14, 163–170. [DOI] [PMC free article] [PubMed] [Google Scholar]
- Ritchie ME, Phipson B, Wu D, Hu Y, Law CW, Shi W, and Smyth GK (2015). limma powers differential expression analyses for RNA-sequencing and microarray studies. Nucleic Acids Res 43, e47. [DOI] [PMC free article] [PubMed] [Google Scholar]
- Shayesteh L, Lu Y, Kuo WL, Baldocchi R, Godfrey T, Collins C, Pinkel D, Powell B, Mills GB, and Gray JW (1999). PIK3CA is implicated as an oncogene in ovarian cancer. Nat Genet 21, 99–102. [DOI] [PubMed] [Google Scholar]
- Silva MC, Ferguson FM, Cai Q, Donovan KA, Nandi G, Patnaik D, Zhang T, Huang HT, Lucente DE, Dickerson BC, et al. (2019). Targeted degradation of aberrant tau in frontotemporal dementia patient-derived neuronal cell models. Elife 8. [DOI] [PMC free article] [PubMed] [Google Scholar]
- Soucy TA, Smith PG, and Rolfe M (2009). Targeting NEDD8-activated cullin-RING ligases for the treatment of cancer. Clin Cancer Res 15, 3912–3916. [DOI] [PubMed] [Google Scholar]
- Stottrup C, Tsang T, and Chin YR (2016). Upregulation of AKT3 Confers Resistance to the AKT Inhibitor MK2206 in Breast Cancer. Mol Cancer Ther 15, 1964–1974. [DOI] [PMC free article] [PubMed] [Google Scholar]
- Team, R.C. (2013). R: A language and environment for statistical computing. R Foundation for Statistical Computing, Vienna, Austria. [Google Scholar]
- Toker A (2012). Achieving specificity in Akt signaling in cancer. Adv Biol Regul 52, 78–87. [DOI] [PMC free article] [PubMed] [Google Scholar]
- Turner NC, Alarcon E, Armstrong AC, Philco M, Lopez Chuken YA, Sablin MP, Tamura K, Gomez Villanueva A, Perez-Fidalgo JA, Cheung SYA, et al. (2019). BEECH: a dose-finding run-in followed by a randomised phase II study assessing the efficacy of AKT inhibitor capivasertib (AZD5363) combined with paclitaxel in patients with estrogen receptor-positive advanced or metastatic breast cancer, and in a PIK3CA mutant sub-population. Ann Oncol 30, 774–780. [DOI] [PMC free article] [PubMed] [Google Scholar]
- Uhlenbrock N, Smith S, Weisner J, Landel I, Lindemann M, Le TA, Hardick J, Gontla R, Scheinpflug R, Czodrowski P, et al. (2019). Structural and chemical insights into the covalent-allosteric inhibition of the protein kinase Akt. Chem Sci 10, 3573–3585. [DOI] [PMC free article] [PubMed] [Google Scholar]
- Vivanco I, Chen ZC, Tanos B, Oldrini B, Hsieh WY, Yannuzzi N, Campos C, and Mellinghoff IK (2014). A kinase-independent function of AKT promotes cancer cell survival. Elife 3. [DOI] [PMC free article] [PubMed] [Google Scholar]
- Vlietstra RJ, van Alewijk DC, Hermans KG, van Steenbrugge GJ, and Trapman J (1998). Frequent inactivation of PTEN in prostate cancer cell lines and xenografts. Cancer Res 58, 2720–2723. [PubMed] [Google Scholar]
- Wang H, Zhang Q, Wen Q, Zheng Y, Lazarovici P, Jiang H, Lin J, and Zheng W (2012). Proline-rich Akt substrate of 40kDa (PRAS40): a novel downstream target of PI3k/Akt signaling pathway. Cell Signal 24, 17–24. [DOI] [PubMed] [Google Scholar]
- Winter GE, Buckley DL, Paulk J, Roberts JM, Souza A, Dhe-Paganon S, and Bradner JE (2015). DRUG DEVELOPMENT. Phthalimide conjugation as a strategy for in vivo target protein degradation. Science 348, 1376–1381. [DOI] [PMC free article] [PubMed] [Google Scholar]
- Zhou B, Hu J, Xu F, Chen Z, Bai L, Fernandez-Salas E, Lin M, Liu L, Yang CY, Zhao Y, et al. (2018). Discovery of a Small-Molecule Degrader of Bromodomain and Extra-Terminal (BET) Proteins with Picomolar Cellular Potencies and Capable of Achieving Tumor Regression. J Med Chem 61, 462–481. [DOI] [PMC free article] [PubMed] [Google Scholar]
Associated Data
This section collects any data citations, data availability statements, or supplementary materials included in this article.
Supplementary Materials
Table S1. Biochemical IC50 (nM) values for INY-03-041 and INY-03-112, and KINOMEscan hits. Related to Figure 1 and Figure S1. Z’lyte kinase assays (Invitrogen) were conducted to assess IC50 values for all kinases listed in the table with the exception of RET (V804M) which was assayed using LanthaScreen assays (Invitrogen).
Table S2. Proteomics output from limma processing of MOLT4 cells treated for 4 hours with INY-03-041 vs DMSO control. Related to Figure 2.
Data Availability Statement
The accession number for the proteomic data reported in this paper is Pride: PXD015207