

Abstract
Protein–protein and protein–substrate interactions are critical to function and often depend on factors that are difficult to disentangle. Herein, a combined biochemical and biophysical approach, based on electrically switchable DNA biochips and single‐molecule mass analysis, was used to characterize the DNA binding and protein oligomerization of the transcription factor, forkhead box protein P2 (FOXP2). FOXP2 contains domains commonly involved in nucleic‐acid binding and protein oligomerization, such as a C2H2‐zinc finger (ZF), and a leucine zipper (LZ), whose roles in FOXP2 remain largely unknown. We found that the LZ mediates FOXP2 dimerization via coiled‐coil formation but also contributes to DNA binding. The ZF contributes to protein dimerization when the LZ coiled‐coil is intact, but it is not involved in DNA binding. The forkhead domain (FHD) is the key driver of DNA binding. Our data contributes to understanding the mechanisms behind the transcriptional activity of FOXP2.
Keywords: biochips, FOXP2, mass photometry, protein–DNA interactions, protein–protein interactions
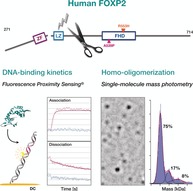
It takes two to tango: A combined biochemical and biophysical approach based on electrically switchable DNA biochips and single‐molecule mass analysis was used to unravel the key contributors to DNA binding and protein oligomerization of the forkhead box protein P2 (FOXP2), which is a human transcription factor, important for language and speech development.
The transcription factor forkhead box protein P2 (FOXP2) plays an important role in the regulation of gene expression in the central nervous system (CNS) of mammals.1 Human FOXP2 is expressed in tissues, such as the brain, lung, intestine, and heart, during embryonic development.4 FOXP2 is involved in the transcriptional regulation of thousands of genes.5 Dysregulated FOXP2 activity has been associated with human oncogenesis.6 Human FOXP2 is of particular interest because of its implication in an inherited speech and language disorder.7 A R553H missense mutation located in the forkhead domain (FHD) of FOXP2 disrupts the DNA‐binding ability of the human transcription factor.3, 9 Consequences are severe alterations in the human brain.10
The 714 amino‐acid‐long human FOXP2 protein comprises several motifs and domains, recognizable from its primary structure (Figure S1a). Besides the FHD, human FOXP2 contains a polyglutamine‐rich region, a zinc finger (ZF), and a leucine zipper (LZ).12 The polyglutamine‐rich region of human FOXP2 contains an uninterrupted segment of 40 glutamines, which is the longest naturally occurring polyglutamine chain in the human proteome.13 Polyglutamine tracts form α‐helical structures, which mediate protein–protein interactions through the formation of coiled‐coil domains.14
The highly conserved FHD, located at the C‐terminus of human FOXP2, recognizes a degenerate 7‐mer nucleotide consensus binding site with sequence‐dependent affinity.3 The FHD is also capable of mediating homotypic protein–protein interactions. In a crystal structure FOXP2‐FHD underwent structural rearrangements leading to domain‐swapped FHD dimers.8 The domain swapping appears to be an adaptive structural feature of FOXP2 and its paralogs FOXP1, FOXP3, and FOXP4 to mediate DNA looping or inter‐chromosomal interactions.8, 15
The ZF motif in human FOXP2 belongs to the class of C2H2 “classic” ZFs, which is the most common protein motif in mammalian proteomes. C2H2 ZFs also mediate homotypic protein–protein interactions.16 Unlike most ZF proteins, human FOXP2 only contains a single C2H2 ZF motif with the consensus sequence C‐X4‐C‐X12‐H‐X4‐H, where X is any amino acid. Whether the ZF in human FOXP2 is involved in DNA‐binding and/or protein–protein interactions remains unclear: the removal of the conserved FOXP2 ZF motif in a yeast two‐hybrid system had no significant effect on transcriptional repression.2
The FOXP2 LZ domain mediates DNA binding and promotes homo‐and heterotypic interactions with FOXP1, FOXP2, and FOXP4.2 FOXP proteins are conserved and co‐expressed paralogs FOXP1, FOXP2, and FOXP4 interact with themselves, with each other, as well as with other proteins in the cellular environment.2, 5b, 5c, 17
FOXP2 is thus an intricate, multifunctional protein. Analysis of the FHD alone cannot reveal the full picture of interactions of FOXP2 with itself and with its substrate DNA, given all of the other functional motifs. Hence, we characterized the roles of the ZF, LZ, and FHD with respect to DNA–FOXP2 and FOXP2–FOXP2 interactions.
We engineered seven variants of FOXP2 to delineate the contributions of the individual FOXP2 domains to DNA binding and to protein homo‐oligomerization (Figure 1 a and Supporting Information, Figure S1a). All variants lacked the aggregation‐prone N‐terminal 270 amino‐acid‐long polyglutamine‐rich region. Duplex DNA featuring a previously identified consensus FOXP2 binding sequence (TGTTTAC, from ref. 3) was titrated against the protein variants at a fixed concentration in native electrophoretic mobility shift assays (EMSA) (Figure 1 b). In the case of the all‐domains‐active variant P1, for low DNA concentrations, all DNA was sequestered in low‐mobility species, reflecting the formation of DNA‐multi‐protein complexes. Increasing the DNA concentration led to an increasing mobility of those species, indicating fewer protein copies per DNA target. Eventually, when we increased the DNA concentration beyond a stoichiometric ratio of around four FOXP2 molecules per DNA target, a sudden increase in free DNA became apparent. These results are in contrast with EMSA data for a similar titration for protein variant P4, which features only the FHD. Free DNA was present already at very low DNA concentrations, and higher‐order DNA–protein complexes were hardly detectable (Figure 1 b, region of interest was contrast enhanced to make low intensity bands visible, see Figure S1b in the Supporting Information for the untreated gel image). Hence, the affinity of the truncated P4 variant for DNA binding is substantially reduced compared to the variant P1.
Figure 1.
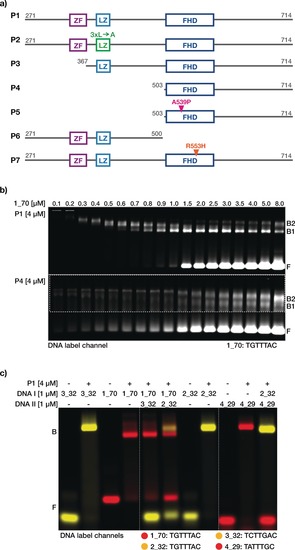
Truncated human FOXP2 protein constructs interacting with DNA. a) Schematic of truncated FOXP2 constructs P1–P7 showing the C2H2 zinc‐finger motif (ZF, purple), leucine‐zipper domain (LZ, light blue), and the DNA‐binding forkhead domain (FHD, navy blue). Leucine‐to‐alanine substitutions (L413A, L420A, and L427A) in the zipper domain of P2 leucine zipper, which destroy the dimerization interface,2 are indicated in green. The alanine‐to‐proline (A539P) substitution, which prevents dimerization via domain swapping, in the DNA‐binding FHD,8 and the mutation (R553H) linked to verbal dyspraxia11 are shown in pink and orange, respectively. b) Laser‐scanned image of a 5 % agarose gel on which FOXP2 constructs P1 and P4 incubated with increasing concentrations of Cy5‐labeled DNA (1_70), containing the consensus binding site TGTTTAC, were electrophoresed. Area within the dashed line was contrast enhanced. F=free DNA, B1 and B2=bands attributed to protein–DNA complexes. c) False‐colored image of a 5 % agarose gel showing the overlay of laser‐scanned channels Cy3 (yellow) and Cy5 (red). Fluorescently labeled DNA species 1_70, 2_32, 3_32, and 4_29 used for FOXP2 interaction analysis are of various lengths (70, 32, 32, and 29 bp, respectively) and contain different 7‐mer consensus binding sites (TGTTTAC, TCTTGAC, and TATTTGC). Some gel lanes were cropped from the gel image at locations indicated with dashed white lines. Protein–DNA mixtures were electrophoretically separated into bound (B) and free (F) DNA.
EMSAs of mixtures of protein variant P1 and DNA targets of different lengths and featuring altered consensus binding sites revealed that different consensus motifs can be all efficiently populated by the protein (Figure 1 c). When exposed to two DNA targets featuring different sequence motifs in the same mixture, the protein will distribute among the targets according to the relative affinity. Indeed, we found that protein variant P1 prefers TGTTTAC over TATTTGC or TCTTGAC, which is consistent with previously reported sequence rankings.3 When the protein variant P1 was exposed to two DNA targets featuring the same TGTTTAC motif embedded in either a 32‐ or 70‐base pair long duplex, it bound to both targets with no apparent bias.
The EMSA data typically show substantial smear, which we attribute to dissociation of the rather unstable protein–DNA complexes in the gel matrix under the non‐equilibrium gel electrophoresis conditions.18 A quantitative analysis of the DNA binding affinity of FOXP2 using EMSA was thus not practical. Instead, we resorted to DNA‐biochip‐based fluorescence proximity sensing (FPS, Figure 2; for experimental info see the Supporting Information).19, 20 In the FPS measurements we observed changes in intensity only for the DNA target containing a FOXP2 consensus sequence, whereas control measurements with the anchor duplex alone or with a longer negative control did not lead to significant intensity changes (Figure 2 c), which established the sensitivity of the setup for specific FOXP2–DNA binding.
Figure 2.
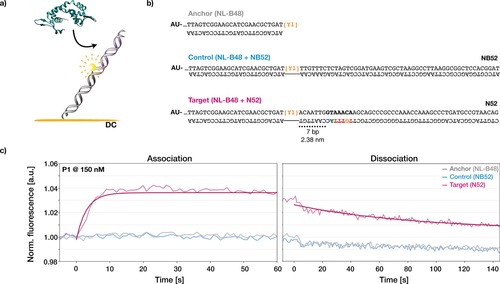
Resolving FOXP2–DNA association and dissociation in real‐time with Fluorescence Proximity SensingTM (switchSENSE). a) Schematic of the biochip‐based setup for time‐resolved interaction analysis of FOXP2 (green) with DNA. SwitchSENSE experiments were performed under direct current (DC) in Fluorescence Proximity SensingTM (FPS) mode. Orange=gold surface. Gray=anchor DNA covalently linked to surface. Yellow sphere=fluorescent dye on anchor DNA. Purple= DNA sequence extension. b) Sequences of anchor DNA (NL‐B48, gray) with extensions: control (NB52, blue) and target (N52, magenta). Sequences NB52 (no binder) and N52 (strong binder) were taken from ref. 3. N52 contained the 7‐mer consensus binding site TGTTTAC (colored according to the affinity logo from ref. 3). c) Graphs give normalized fluorescence intensities, as acquired with switchSENSE. Protein was flushed over anchor DNA (gray), control DNA (blue), and target DNA (magenta).
To determine the individual contributions of the ZF, LZ, and FHD to DNA‐binding of FOXP2, concentration‐dependent measurements were performed with the different protein constructs on the biochip. For the variants P1–P5, all of which contained the FHD and can be seen, along with variants P6 and P7, in a cartoon representation in Figure 1 a, increasing fluorescence was observed upon flushing in the protein and decreasing fluorescence was observed when the protein was washed out (Figure 3 a, see Figure S3 in the Supporting Information for variant P5). In both phases, the signal eventually reached a steady‐state. The steady‐state fluorescence intensity during flushing in of the protein varied with the sample concentration; higher protein concentrations yielded higher absolute fluorescence intensities (Figure 3 a). Hence, a greater bulk protein concentration caused a greater fraction of the surface‐tethered DNA to be populated by the protein, as expected for reversible binding reactions. When washing the protein out, the steady‐state fluorescence signals returned to their initial values prior to flushing in the protein, indicating that all bound protein dissociated.
Figure 3.
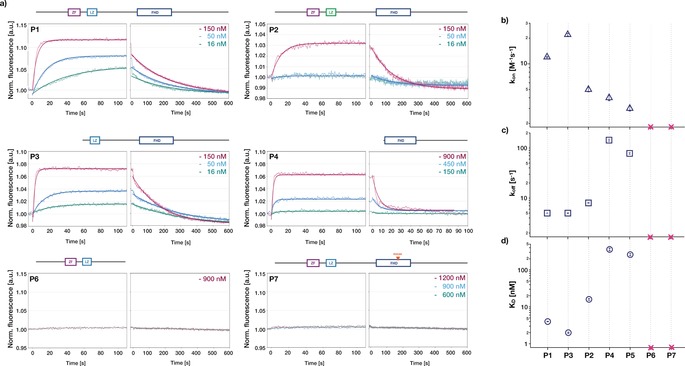
Concentration‐dependent DNA‐binding kinetics of FOXP2 constructs. a) Thin solid lines: normalized fluorescence intensity over time measured during association (left) and dissociation (right) of protein constructs P1–P4, P6, and P7 with target DNA (see Figure 2 b) attached to the chip surface. Numbers give the protein concentrations. Thick solid lines: global fits to the data based on a bimolecular reaction model (see the Methods in the Supporting Information). b, c) Association rate constant k on (b) and dissociation rate constant k off (c) obtained from the global fits. d) dissociation constants K D=k off/k on. Error bars give error of the fit. Red crosses: no binding detected.
The variant P1, containing all functional domains, yielded a large steady‐state fluorescence increase even at a protein concentration of 150 nm, whereas the FHD alone in P4 yielded a comparable signal only at much higher concentrations of around 900 nm. For FOXP2 variants P6 and P7, we could not detect any changes in fluorescence, which means these protein variants did not bind the DNA target in the range of concentrations tested (up to 1.2 μm). We used a global fit to the concentration‐dependent fluorescence time traces with a bimolecular reaction model to extract the association rate constant in units M−1s−1 (Figure 3 b) and dissociation rate constant in units s−1 (Figure 3 c). The model described the data satisfactorily. From the ratio of the dissociation and association rate constants, the dissociation constants for protein–DNA binding were determined, which ranged from approximately 2 nm to approximately 360 nm, depending on the protein variant (Figure 3 d).
To quantify the interactions of human FOXP2 with itself, single‐molecule mass‐photometry landing assays21 were used (Figure 4 a, for calibration see Figure S4 in the Supporting Information). For protein variant P1, the longest FOXP2 variant studied herein, a mass distribution featuring at least five different species was obtained (Figure 4 b). More than half of the particles analyzed stem from a species that, on average, has a molecular weight of 100 kDa. Since the molecular weight of the P1 monomer is half that value (approximately 52 kDa), we attribute the most frequent species to FOXP2 dimers. The next higher molecular weight species in the P1 mass distribution had a molecular weight of 200 kDa, which is an integer multiple of 100 kDa. Therefore, we attribute this species to dimers of dimers of FOXP2. We also detected two low molecular weight species that we had difficulties to assign, one of 46 kDa and another of 73 kDa. The former could potentially be identified as P1 monomers within measurement error. The 73 kDa species cannot be assigned to P1. Impurities are the most likely cause of the 73 kDa species that we could not assign to P1 oligomers (Supporting Information, Figure S5). For protein variant P2, which is identical in mass to P1 but has a LZ with three leucine‐to‐alanine substitutions, we obtained a quite different mass distribution. 75 % of all particles exhibited, on average, a mass of 51 kDa, which is very close to the expected molecular weight of a monomeric P2 of approximately 52 kDa. We therefore attribute this species to monomers. The next higher molecular weight species were 100 kDa and 150 kDa in molecular weight. Since these are integer multiples of 50 kDa, we attribute these species to P2 dimers and trimers, respectively. The mass distribution obtained for protein variant P3, which had an active LZ but is missing the ZF, shows 45 kDa and 85 kDa species (Figure 4 d). The expected molecular weight of protein variant P3 is approximately 42 kDa, hence we attribute these two species to monomers and dimers of this FOXP2 variant, respectively. For the protein variants consisting only of the terminal FHD, the expected monomer molecular weight is approximately 27 kDa. For the short variant P4, we obtained a distribution with molecular weights of approximately 31 kDa, approximately 53 kDa, and approximately 89 kDa. For the short variant P5, we obtained a distribution with molecular weights of approximately 31 kDa, approximately 56 kDa and approximately 94 kDa, respectively. Within the error of the measurement, we attribute these species to monomers, dimers, and higher‐order assemblies, respectively.
Figure 4.
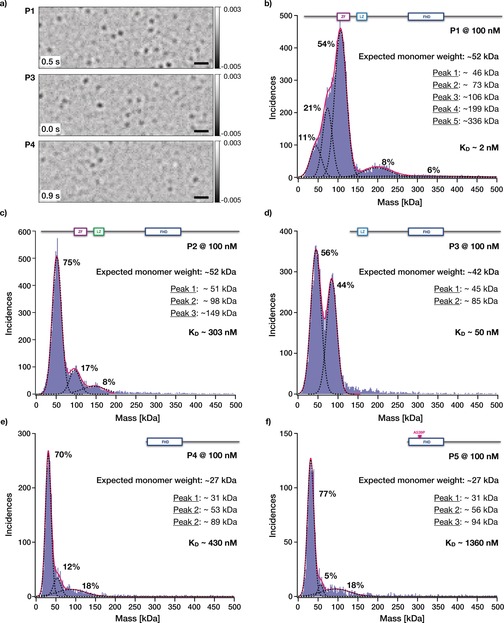
Single‐molecule mass analysis of FOXP2 constructs using interferometric scattering (iSCAT). a) Exemplary frames from representative single‐molecule mass‐photometry landing assay movies acquired for constructs P1, P3, and P4 showing differential interferometric scattering. Scale bar=1 μm. Numbers give elapsed time. b–f) Blue bars: Histograms (bin width=2 kDa) of the single‐particle peak contrast values obtained for the indicated protein constructs.
We plotted the dissociation constants obtained from the FPS measurements versus the dissociation constants obtained from the mass‐photometry measurements (Supporting Information, Figure S6a) and computed the free energies for the interactions (Supporting Information, Figure S6b). The protein variants P1 and P3 have comparable DNA‐binding strengths with ΔG≈−12 kcal mol−1 (Supporting Information, Figure S6). Since deleting the ZF domain in P3 did not affect DNA binding, we conclude that the ZF does not directly interact with the DNA target studied. Comparing the variants P3 (LZ and FHD) and P4 (only FHD) reveals that deleting the LZ destabilized the DNA binding by ΔΔG≈3 kcal mol−1. Hence, the LZ interacts with DNA. In protein variant P2, we exchanged three leucines for alanines in the LZ to break the heptad repeat sequence,22 which had a drastic effect on protein oligomerization: P1 with intact LZ and ZF has a K D (protein–protein)≈2 nm, whereas P2, with a broken heptad sequence, has a K D (protein–protein)≈300 nm. Hence, breaking the heptad repeat sequence destabilized the protein dimerization by ΔΔG≈3 kcal mol−1.
Deleting the ZF in P3 destabilized the protein dimerization interactions by ΔΔG≈2 kcal mol−1 relative to variant P1. Thus, the ZF also contributes attractive protein–protein interactions. However, variant P2, which contains the ZF and the LZ with broken heptad repeat sequence, exhibits protein–protein interaction strengths that are numerically consistent with those of P4, which only contains the FHD. Thus, we attribute the protein–protein interactions seen in P2 to the interactions between the FHDs, and not to interactions mediated by the LZ or the ZF. It appears that the ZF does not contribute to protein–protein interactions unless the LZ also forms a proper coiled‐coil.
Protein variants P4 and P5, which comprise only the FHD, both show DNA binding with a K D (DNA–protein)≈300 nm (ΔG≈−9 kcal mol−1). Hence, the FHD directly binds DNA, which is consistent with previous studies.2, 3, 8, 23 Adding the LZ domain increases the stability of DNA binding to K D (DNA‐protein)≈2 nm, based on the results obtained with variants P1, P2, and P3. In energetic terms, the LZ/ ZF region of FOXP2 thus contribute a minor part of ΔΔG≈−3 kcal mol−1 to the interactions of FOXP2 with DNA. Protein variant P7, which is equivalent to wild‐type P1 except for a single R553H point mutation in the FHD that causes speech and language disorder,3, 7, 9 did not show any DNA binding under the conditions tested here. Hence, the single R553H mutation in the FHD is sufficient to practically abolish the DNA‐binding functionality of the entire FOXP2 protein. Even though the ZF and LZ in principle could also bind to DNA, their interactions are too weak to be relevant at cellular expression levels of FOXP2.
The FHD‐only constructs were mostly monomeric, but the residual dimer/monomer equilibrium allowed us to infer the protein–protein binding strengths. Accordingly, P4 and P5 have dimerization potential with ΔG≈−8.8 kcal mol−1 and ΔG≈−8.1 kcal mol−1, respectively. P5 featured the A539P substitution in the FHD which reportedly disrupts the ability to form domain‐swapped dimers.8 Since P4 and P5 behave the same, domain swapping is not relevant for our concentration regime.15c
In conclusion, our information about FOXP2 interactions with DNA and with itself should improve understanding of the mechanisms underlying the transcriptional activity of this intricate, multifunctional protein. Our results also underline the potential of biochip‐based fluorescence proximity measurements and of interferometric single‐molecule mass photometry to provide quantitative insights in protein science. The mass photometry provided clear insight into the higher‐order complexes formed by the protein variants under study, whereas the biochip measurements revealed protein–substrate association and dissociation in a time resolved fashion. Both techniques provide complementary information about thermodynamic and kinetic parameters important for the analysis of many different target proteins.
Conflict of interest
The authors declare no conflict of interest.
Supporting information
As a service to our authors and readers, this journal provides supporting information supplied by the authors. Such materials are peer reviewed and may be re‐organized for online delivery, but are not copy‐edited or typeset. Technical support issues arising from supporting information (other than missing files) should be addressed to the authors.
Supplementary
Acknowledgements
We thank Hanna Müller‐Landau and Wolfgang Kaiser of the Dynamic Biosensors GmbH for technical support; Johanna Perens, Maximilian Schmalhofer, Michael Ostertag, and Haissi Cui for auxiliary experiments; and Christian Wachauf, Florian Praetorius, Jonas Funke, and Evi Meier for discussions. This work was supported by a European Research Council Consolidator Grant to H.D. (GA no. 724261) and the Deutsche Forschungsgemeinschaft through grants provided within the Gottfried‐Wilhelm‐Leibniz Program, the SFB863 TPA9, the Excellence Cluster CIPSM, and Bavarian Elite Network Program CompInt, in the form of a fellowship to K.H.; G.Y. was supported by a Zvi and Ofra Meitar Magdalen Graduate Scholarship and P.K. by an European Research Council Starting Grant (GA no. 337757).
K. Häußermann, G. Young, P. Kukura, H. Dietz, Angew. Chem. Int. Ed. 2019, 58, 7662.
Contributor Information
Dr. Katharina Häußermann, https://www.dietzlab.org/
Prof. Dr. Hendrik Dietz, Email: dietz@tum.de.
References
- 1.
- 1a. Enard W., Curr. Opin. Neurobiol. 2011, 21, 415–424; [DOI] [PubMed] [Google Scholar]
- 1b. Reimers-Kipping S., Hevers W., Paabo S., Enard W., Neuroscience 2011, 175, 75–84; [DOI] [PubMed] [Google Scholar]
- 1c. Vernes S. C., Oliver P. L., Spiteri E., Lockstone H. E., Puliyadi R., Taylor J. M., Ho J., Mombereau C., Brewer A., Lowy E., Nicod J., Groszer M., Baban D., Sahgal N., Cazier J.-B., Ragoussis J., Davies K. E., Geschwind D. H., Fisher S. E., PLoS Genet. 2011, 7, e1002145. [DOI] [PMC free article] [PubMed] [Google Scholar]
- 2. Li S., Weidenfeld J., Morrisey E. E., Mol. Cell. Biol. 2004, 24, 809–822. [DOI] [PMC free article] [PubMed] [Google Scholar]
- 3. Nelson C. S., Fuller C. K., Fordyce P. M., Greninger A. L., Li H., Derisi J. L., Nucleic Acids Res. 2013, 41, 5991–6004. [DOI] [PMC free article] [PubMed] [Google Scholar]
- 4. Marcus G. F., Fisher S. E., Trends Cognit. Sci. 2003, 7, 257–262. [DOI] [PubMed] [Google Scholar]
- 5.
- 5a. Estruch S. B., Graham S. A., Chinnappa S. M., Deriziotis P., Fisher S. E., J. Neurodevelopmental Disorders 2016, 8, 44; [DOI] [PMC free article] [PubMed] [Google Scholar]
- 5b. Estruch S. B., Graham S. A., Deriziotis P., Fisher S. E., Sci. Rep. 2016, 6, 20911; [DOI] [PMC free article] [PubMed] [Google Scholar]
- 5c. Estruch S. B., Graham S. A., Quevedo M., Vino A., Dekkers D. H. W., Deriziotis P., Sollis E., Demmers J., Poot R. A., Fisher S. E., Hum. Mol. Genet. 2018, 27, 1212–1227. [DOI] [PubMed] [Google Scholar]
- 6.
- 6a. Myatt S. S., Lam E. W. F., Nat. Rev. Cancer 2007, 7, 847–859; [DOI] [PubMed] [Google Scholar]
- 6b. Herrero M. J., Gitton Y., Genes Cancer 2018, 9, 11–38; [DOI] [PMC free article] [PubMed] [Google Scholar]
- 6c. Chen M. T., Sun H. F., Li L. D., Zhao Y., Yang L. P., Gao S. P., Jin W., Oncol Lett. 2018, 15, 8582–8588. [DOI] [PMC free article] [PubMed] [Google Scholar]
- 7.
- 7a. Fisher S. E., Vargha-Khadem F., Watkins K. E., Monaco A. P., Pembrey M. E., Nat. Genet. 1998, 18, 168–170; [DOI] [PubMed] [Google Scholar]
- 7b. Vargha-Khadem F., Watkins K. E., Price C. J., Ashburner J., Alcock K. J., Connelly A., Frackowiak R., Friston K. J., Pembrey M. E., Mishkin M., Gadian D. G., Passingham R. E., Proc. Natl. Acad. Sci. USA 1998, 95, 12695–12700. [DOI] [PMC free article] [PubMed] [Google Scholar]
- 8. Stroud J. C., Wu Y., Bates D. L., Han A., Nowick K., Paabo S., Tong H., Chen L., Structure 2006, 14, 159–166. [DOI] [PubMed] [Google Scholar]
- 9. Banerjee-Basu S., Baxevanis A. D., Proteins Struct. Funct. Bioinf. 2004, 54, 639–647. [DOI] [PubMed] [Google Scholar]
- 10.
- 10a. Hurst J. A., Baraitser M., Auger E., Graham F., Norell S., Dev. Med. Child Neurol. 1990, 32, 352–355; [DOI] [PubMed] [Google Scholar]
- 10b. Lai C. S., Fisher S. E., Hurst J. A., Vargha-Khadem F., Monaco A. P., Nature 2001, 413, 519–523; [DOI] [PubMed] [Google Scholar]
- 10c. Zhang J., Webb D. M., Podlaha O., Genetics 2002, 162, 1825–1835; [DOI] [PMC free article] [PubMed] [Google Scholar]
- 10d. Liégeois F., Baldeweg T., Connelly A., Gadian D. G., Mishkin M., Vargha-Khadem F., Nat. Neurosci. 2003, 6, 1230–1237; [DOI] [PubMed] [Google Scholar]
- 10e. Spiteri E., Konopka G., Coppola G., Bomar J., Oldham M., Ou J., Vernes S. C., Fisher S. E., Ren B., Geschwind D. H., Am. J. Hum. Genet. 2007, 81, 1144–1157; [DOI] [PMC free article] [PubMed] [Google Scholar]
- 10f. Enard W., Gehre S., Hammerschmidt K., Hölter S. M., Blass T., Somel M., Brückner M. K., Schreiweis C., Winter C., Sohr R., Becker L., Wiebe V., Nickel B., Giger T., Müller U., Groszer M., Adler T., Aguilar A., Bolle I., Calzada-Wack J., Dalke C., Ehrhardt N., Favor J., Fuchs H., Gailus-Durner V., Hans W., Hölzlwimmer G., Javaheri A., Kalaydjiev S., Kallnik M., Kling E., Kunder S., Mossbrugger I., Naton B., Racz I., Rathkolb B., Rozman J., Schrewe A., Busch D. H., Graw J., Ivandic B., Klingenspor M., Klopstock T., Ollert M., Quintanilla-Martinez L., Schulz H., Wolf E., Wurst W., Zimmer A., Fisher S. E., Morgenstern R., Arendt T., de Angelis M. H., Fischer J., Schwarz J., Paabo S., Cell 2009, 137, 961–971. [DOI] [PubMed] [Google Scholar]
- 11. Vargha-Khadem F., Watkins K., Alcock K., Fletcher P., Passingham R., Proc. Natl. Acad. Sci. USA 1995, 92, 930–933. [DOI] [PMC free article] [PubMed] [Google Scholar]
- 12. UniProt C. The, Nucleic Acids Res. 2017, 45, D158–D169. [DOI] [PMC free article] [PubMed] [Google Scholar]
- 13. Butland S. L., Devon R. S., Huang Y., Mead C.-L., Meynert A. M., Neal S. J., Lee S. S., Wilkinson A., Yang G. S., Yuen M. M. S., Hayden M. R., Holt R. A., Leavitt B. R., Ouellette B. F. F., BMC Genomics 2007, 8, 126. [DOI] [PMC free article] [PubMed] [Google Scholar]
- 14. Fiumara F., Fioriti L., Kandel E. R., Hendrickson W. A., Cell 2010, 143, 1121–1135. [DOI] [PMC free article] [PubMed] [Google Scholar]
- 15.
- 15a. Bandukwala H. S., Wu Y., Feuerer M., Chen Y., Barboza B., Ghosh S., Stroud J. C., Benoist C., Mathis D., Rao A., Chen L., Immunity 2011, 34, 479–491; [DOI] [PMC free article] [PubMed] [Google Scholar]
- 15b. Chu Y.-P., Chang C.-H., Shiu J.-H., Chang Y.-T., Chen C.-Y., Chuang W.-J., Protein Sci. 2011, 20, 908–924; [DOI] [PMC free article] [PubMed] [Google Scholar]
- 15c. Medina E., Córdova C., Villalobos P., Reyes J., Komives E. A., Ramírez-Sarmiento C. A., Babul J., Biophys. J. 2016, 110, 2349–2360; [DOI] [PMC free article] [PubMed] [Google Scholar]
- 15d. Ostrow A. Z., Kalhor R., Gan Y., Villwock S. K., Linke C., Barberis M., Chen L., Aparicio O. M., Proc. Natl. Acad. Sci. USA 2017, 114, E2411–E2419. [DOI] [PMC free article] [PubMed] [Google Scholar]
- 16.
- 16a. Nagadoi A., Nakazawa K., Uda H., Okuno K., Maekawa T., Ishii S., Nishimura Y., J. Mol. Biol. 1999, 287, 593–607; [DOI] [PubMed] [Google Scholar]
- 16b. Polekhina G., House C. M., Traficante N., Mackay J. P., Relaix F., Sassoon D. A., Parker M. W., Bowtell D. D. L., Nat. Struct. Biol. 2002, 9, 68–75; [DOI] [PubMed] [Google Scholar]
- 16c. McCarty A. S., Kleiger G., Eisenberg D., Smale S. T., Mol. Cell 2003, 11, 459–470; [DOI] [PubMed] [Google Scholar]
- 16d. Westman B. J., Perdomo J., Matthews J. M., Crossley M., Mackay J. P., Biochemistry 2004, 43, 13318–13327; [DOI] [PubMed] [Google Scholar]
- 16e. Brayer K. J., Segal D. J., Cell Biochem. Biophys. 2008, 50, 111–131. [DOI] [PubMed] [Google Scholar]
- 17.
- 17a. Zhao H., Zhou W., Yao Z., Wan Y., Cao J., Zhang L., Zhao J., Li H., Zhou R., Li B., Wei G., Zhang Z., French C. A., Dekker J. D., Yang Y., Fisher S. E., Tucker H. O., Guo X., Dev. Biol. 2014, 398, 242–254; [DOI] [PMC free article] [PubMed] [Google Scholar]
- 17b. Sin C., Li H., Crawford D. A., J. Mol. Neurosci. 2015, 55, 437–448; [DOI] [PubMed] [Google Scholar]
- 17c. Estruch S. B., Graham S. A., Chinnappa S. M., Deriziotis P., Fisher S. E., J. Neurodevelopmental Disorders 2016, 8, 354; [DOI] [PMC free article] [PubMed] [Google Scholar]
- 17d. Mendoza E., Scharff C., Front. Mol. Neurosci. 2017, 10, 112. [DOI] [PMC free article] [PubMed] [Google Scholar]
- 18. Hellman L. M., Fried M. G., Nat. Protoc. 2007, 2, 1849–1861. [DOI] [PMC free article] [PubMed] [Google Scholar]
- 19. Knezevic J., Langer A., Hampel P. A., Kaiser W., Strasser R., Rant U., J. Am. Chem. Soc. 2012, 134, 15225–15228. [DOI] [PubMed] [Google Scholar]
- 20. Langer A., Hampel P. A., Kaiser W., Knezevic J., Welte T., Villa V., Maruyama M., Svejda M., Jahner S., Fischer F., Strasser R., Rant U., Nat. Commun. 2013, 4, 2099. [DOI] [PMC free article] [PubMed] [Google Scholar]
- 21. Young G., Hundt N., Cole D., Fineberg A., Andrecka J., Tyler A., Olerinyova A., Ansari A., Marklund E. G., Collier M. P., Chandler S. A., Tkachenko O., Allen J., Crispin M., Billington N., Takagi Y., Sellers J. R., Eichmann C., Selenko P., Frey L., Riek R., Galpin M. R., Struwe W. B., Benesch J. L. P., Kukura P., Science 2018, 360, 423–427. [DOI] [PMC free article] [PubMed] [Google Scholar]
- 22. Lupas A., Curr. Opin. Struct. Biol. 1997, 7, 388–393. [DOI] [PubMed] [Google Scholar]
- 23. Weigel D., Jäckle H., Cell 1990, 63, 455–456. [DOI] [PubMed] [Google Scholar]
Associated Data
This section collects any data citations, data availability statements, or supplementary materials included in this article.
Supplementary Materials
As a service to our authors and readers, this journal provides supporting information supplied by the authors. Such materials are peer reviewed and may be re‐organized for online delivery, but are not copy‐edited or typeset. Technical support issues arising from supporting information (other than missing files) should be addressed to the authors.
Supplementary