Abstract
Adult Intestinal Stem Cells (ISCs) are located at the bottom of crypts of Lieberkühn, where they express markers such as Lgr51,2, and fuel the constant replenishment of the intestinal epithelium1. Although fetal Lgr5 expressing cells can give rise to adult ISCs3,4, it remains unclear whether this population in the patterned epithelium represents unique ISC precursors. Using unbiased quantitative lineage-tracing approaches, biophysical modeling and intestinal transplantation, we show that all cells of the mouse intestinal epithelium, irrespective of their location and pattern of Lgr5 expression in the fetal gut tube, contribute actively to the adult ISC pool. Based on 3D imaging, we find that, during fetal development, villi undergo gross remodeling and fission. This brings epithelial cells from the non-proliferative villus into the proliferative intervillus region, enabling them to contribute to the adult stem cell niche. Our results demonstrate that large-scale remodeling of the intestinal wall and cell fate specification are intertwined processes. Moreover, these findings provide a direct link between the observed plasticity and cellular reprogramming of differentiating cells in adult tissues following damage5–9, revealing that stem cell identity is an induced rather than a hardwired property.
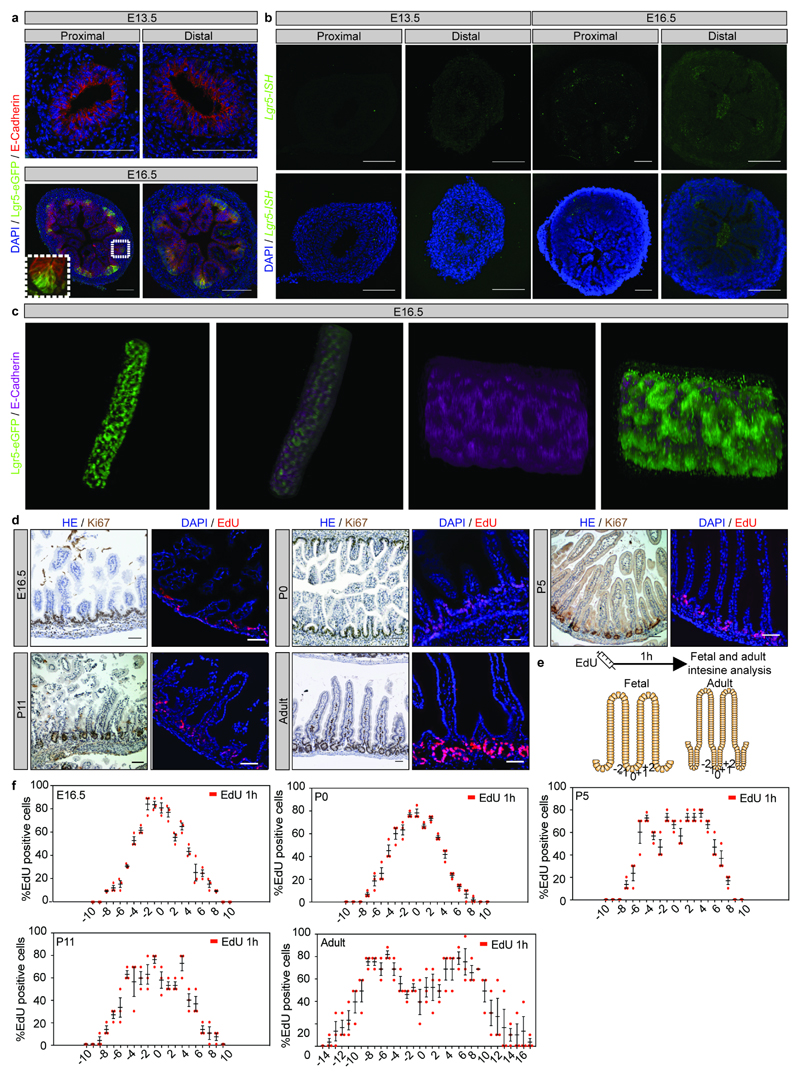
The intestine forms from the pseudo-stratified gut tube, which becomes patterned during late fetal development into villi and a continuous intervillus region covered by Lgr5negative and Lgr5positive cells, respectively (Figure 1a; Extended Data Figure 1a-c)10. The continuous intervillus region is the major site for proliferation in the developing intestine (Extended Data Figure 1d-f), and crypts subsequently form from this region postnatally11. Despite the apparent transcriptional similarity between fetal and adult Lgr5positive cells4, it remains unclear how the fetal immature intestine transitions into the mature structure and how this is orchestrated at the cellular level. In particular, it is not known whether a specialized subset of fetal cells become adult ISCs or whether stem cell identity is an induced property.
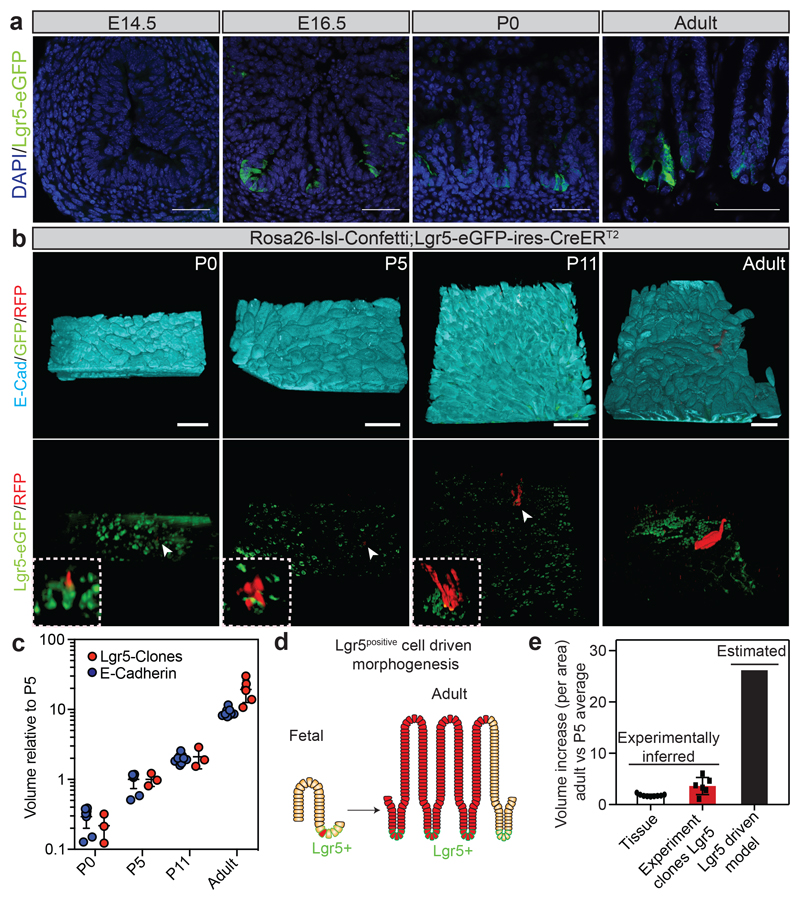
Figure 1. Fetal Lgr5 progeny contribute to the adult intestinal epithelium, but are insufficient to sustain intestinal growth during development.
a) Detection of Lgr5-eGFP (green) and DAPI (blue) at the indicated time points. Scale bars: 100μm. Representative pictures of n=3 biologically independent samples at each time point are shown.
b) Detection of E-cadherin (E-cad, cyan), GFP (green) and RFP (red) in tissue whole mounts from the proximal part of the small intestine isolated from Rosa26-lsl-Confetti/Lgr5-eGFP-ires-CreERT2 animals at P0 (n=3 animals), P5 (n=3 animals), P11 (n=3 animals) and adulthood (n=6 animals) following induction at E16.5 by the administration of 4-hydroxytamoxifen. White arrowheads indicate the clones depicted in the white dashed boxes at higher magnifications. Scale bars: 250 μm.
c) Relative volume (projected) of clones from (b) and epithelium based on E-Cadherin (Animals analysed: P0 n=9, P5 n=9, P11 n=9, Adult n=9). Dots and lines indicate independent samples and mean±S.E.M, respectively.
d-e) Model based on Lgr5 cells driven morphogenesis and assessment of the observed and predicted clonal expansion (Experiment clones Lgr5, P5 n=3, Adult n=6; Tissue, P5 n=9, Adult n=9). Error bars indicate the mean±S.E.M.
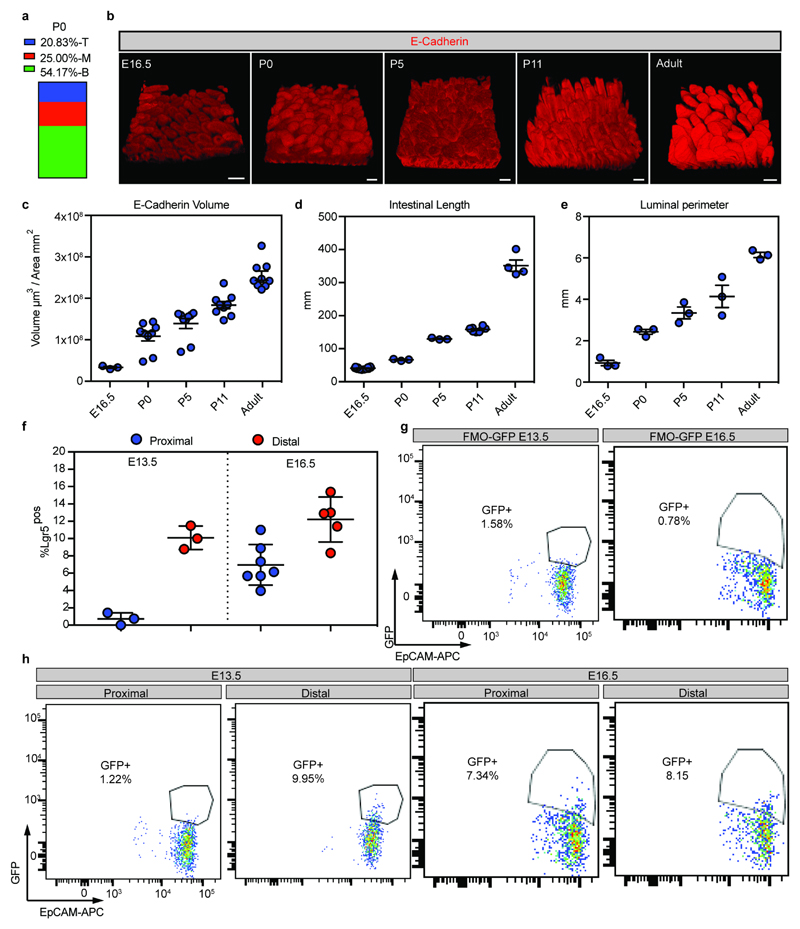
To investigate the role of fetal Lgr5positive cells in the establishment of the adult ISC population, we lineage traced this population from embryonic day (E)16.5. Focusing on the proximal part of the small intestine, we observed that, in agreement with previous reports3,4,12, progeny of the Lgr5-expressing population was maintained into adulthood and thereby contributed to the adult ISC compartment (Figure 1b). Most of the clones observed at post-natal day (P)0 were, as expected, located in the intervillus regions (Extended Data Figure 2a). Moreover, it was not until P11 that clones extended as ribbons from the base of crypts to the tips of villi (Supplementary information; Supplementary video 1).
When assessing the quantitative contribution from Lgr5positive progeny, labelled at E16.5, we found this to be slightly greater than the overall degree of tissue expansion (Figure 1c; Extended Data Figure 2b-e). This confirmed that Lgr5positive cells were an important source of tissue growth. However, given that Lgr5positive cells constituted only a small fraction, f=7.0%±0.9 (mean±SEM), in the proximal part of the small intestine at the time of labeling (Extended Data Figure 2f-h), we reasoned that, if Lgr5positive cells were the main source of adult epithelium (Figure 1d), they would have to expand by a ratio 1/f greater than overall tissue to fuel growth and replace cells outside the intervillus regions. Thus, Lgr5-clones should expand 130-fold from P5 to adulthood, nearly an order of magnitude larger than the actual measured value (Figure 1e). Expansion of Lgr5 progeny was thus insufficient to explain tissue growth.
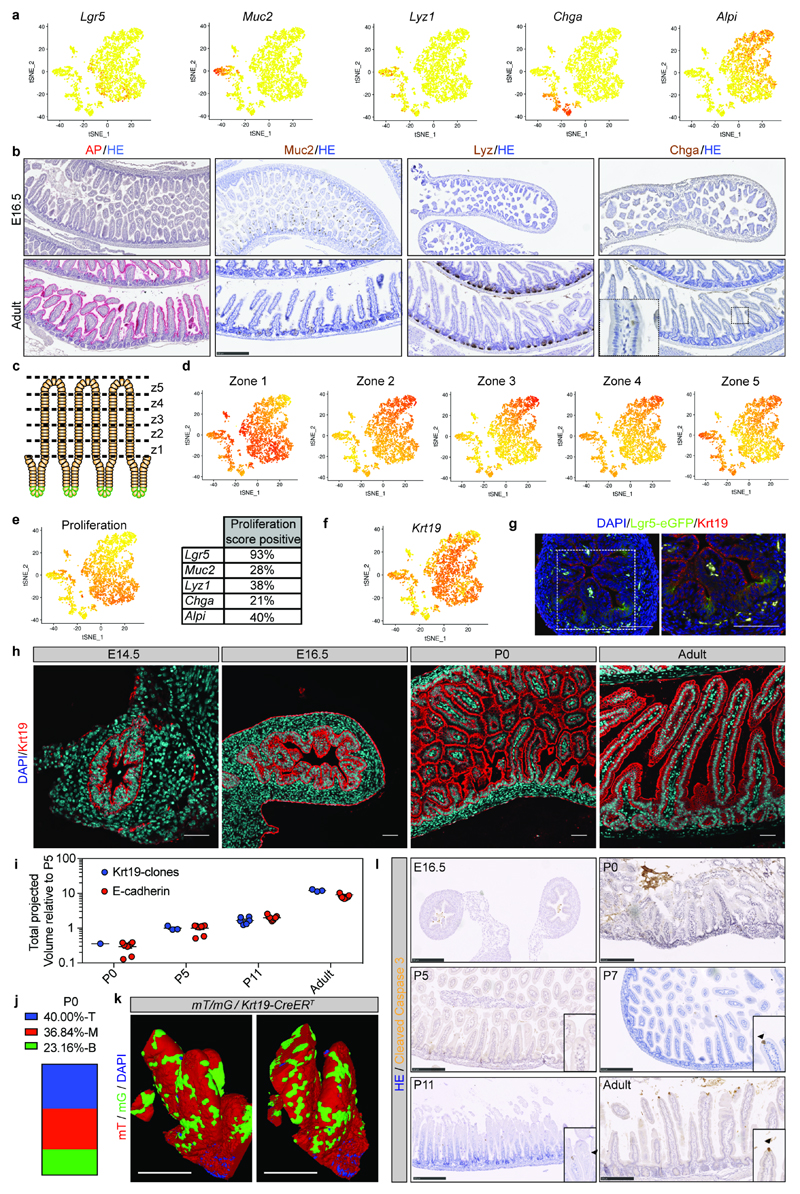
To resolve the cellular diversity in the epithelium at E16.5, we performed single-cell RNA sequencing (sc-RNAseq). In line with our characterization for Lgr5-eGFP, Lgr5 was detected in 7% of the 3509 cells analyzed, and despite detecting only goblet cells by immunostaining, we identified other differentiated cell types including Paneth cells (Lyz1), enteroendocrine cells (Chga) and enterocytes (Alpi) (Extended Data Figure 3a,b). In the adult epithelium, the differentiated villi compartment can be separated into at least 5 transcriptionally distinct populations13. In the fetal intestine, these largely collapse into 2 populations and a gene signature for crypt proliferation was detected beyond the Lgr5positive compartment, including cells expressing differentiation markers (Extended Data Figure 3c-e)14. This supported strongly the conclusion that cells in the fetal intestinal epithelium were distinct from their adult counterpart, while cells expressing differentiation markers have not completed their differentiation program.
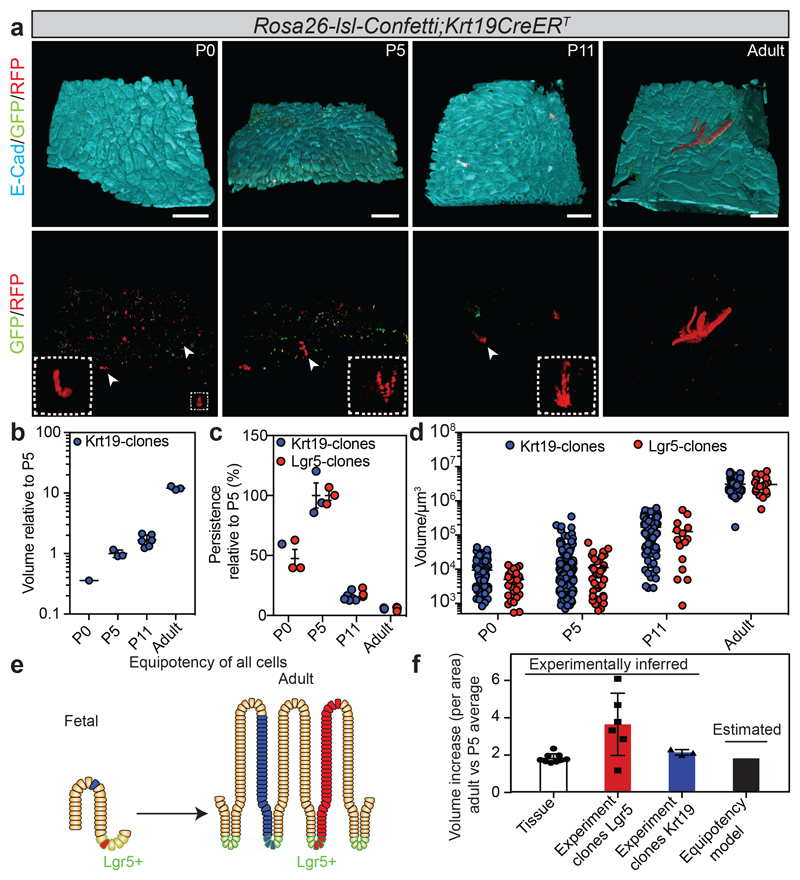
To test experimentally how cells other than those within the intervillus region contributed to tissue growth, we went on to perform fate mapping using a ubiquitously expressed Keratin 19 driven cre model (Figure 2a; Extended Data Figure 3f-h). Although the sc-RNAseq data revealed that 49% of Krt19positive cells at E16.5 score positive for the proliferation signature, the expansion of clones closely mirrored the overall growth of the tissue (Figure 2b; Extended Data Figure 3i), confirming that Krt19 expressing cells were representative of the tissue. Remarkably, however, we found that both the long-term persistence, defined as the fraction of surviving clones, and size of Krt19-labeled clones, were very similar to their Lgr5-labeled counterparts (Figure 2c,d; Supplementary information). Importantly, several independent measurements confirmed that Krt19 labelled a population of cells distributed randomly along the villus/intervillus axis (Extended Data Figure 3j,k; Supplementary video 2). Moreover, apoptotic cells at the tips of villi appeared only from P7, meaning that Krt19 clones cannot be lost prior to P5, meaning that both P0 and P5 can be used for normalizing clonal persistence (Extended Data Figure 3l). This suggested strongly that fetal epithelial cells, irrespective of location, harbored long-term self-renewal potential, carrying the same probability to contribute to the adult ISC compartment (Figure 2e). Importantly, although the expansion of the Lgr5-targeted clones was slightly larger than that of tissue and Krt19-targeted clones, the bias was small (Figure 2f). This small bias likely reflects a transient proliferative advantage due to their privileged location at the time of induction, a point to which we will return. Together, these findings indicated that all fetal cells had a similar capacity to contribute to the growth of the intestinal epithelium during development, and give rise to adult ISCs, suggesting that cell fate potential was not fixed in the fetal epithelium.
Figure 2. Random distribution of intestinal stem cell precursors in the fetal epithelium.
a) Detection of E-cadherin (E-cad, cyan), GFP (green) and RFP (red) in tissue whole mounts from the proximal part of the small intestine isolated from Rosa26-lsl-Confetti/Krt19CreERT animals at P0 (n=1 animal), P5 (n=3 animals), P11 (n=6 animals) and adulthood (n=3 animals) following induction at E16.5 by the administration of 4-hydroxytamoxifen. White arrowheads indicate the clones depicted in the white dashed boxes at higher magnifications. Scale bars: 250 μm.
b) Relative volume (projected) of clones from the Krt19CreERT induction (from a). Each dot represents one animal and the line the mean.
c) Relative number of clones (Projected persistence). Each dot represents an independent biological sample at the indicated time point (from 1b and 2a). Lines indicate the mean±S.E.M.
d) Volume (μm3) of individual clones (Krt19-CreERT: P0 n=94, P5 n=244, P11 n=103, P36-Adult n=42; Lgr5-eGFP-ires-CreERT2: P0 n=28, P5 n=39, P11 n=15, Adult n= 18). Lines indicate the mean.
e) Model based on morphogenesis relying on equipotent stem cells randomly distributed in the tissue.
f) Assessment of the observed and predicted clonal expansion (Experiment clones Krt19, P5 n=3, Adult n=3; Experiment clones Lgr5, P5 n=3, Adult n=6; Tissue P5 n=9, Adult n=9). Error bars indicate the mean±S.E.M.
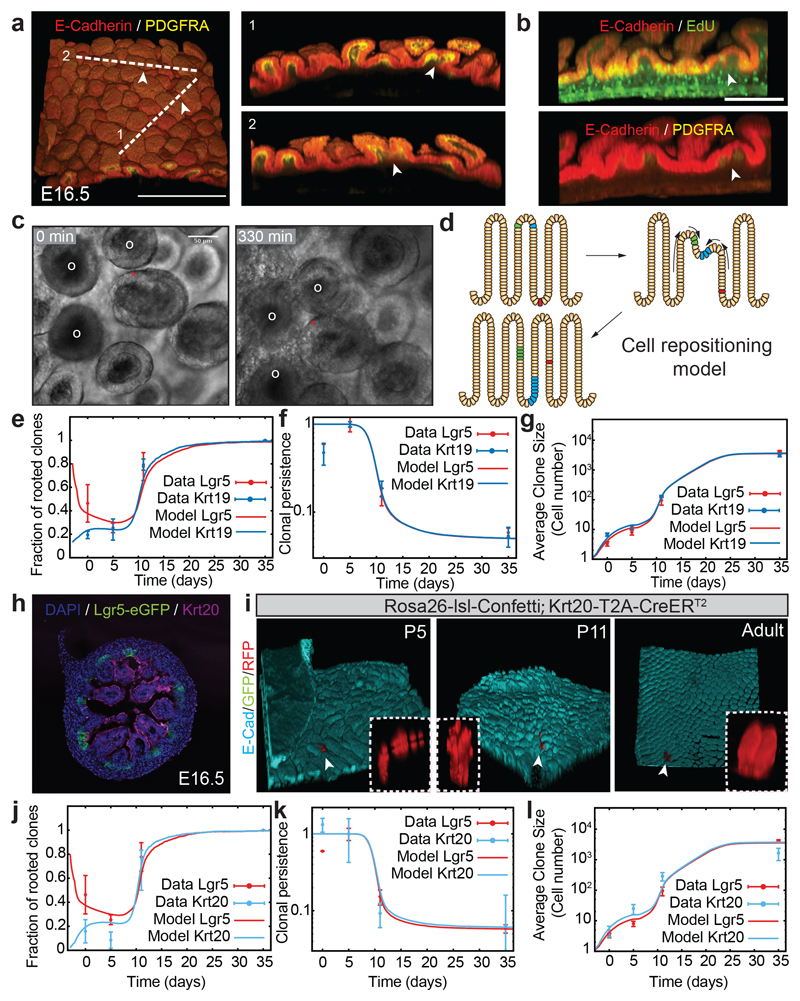
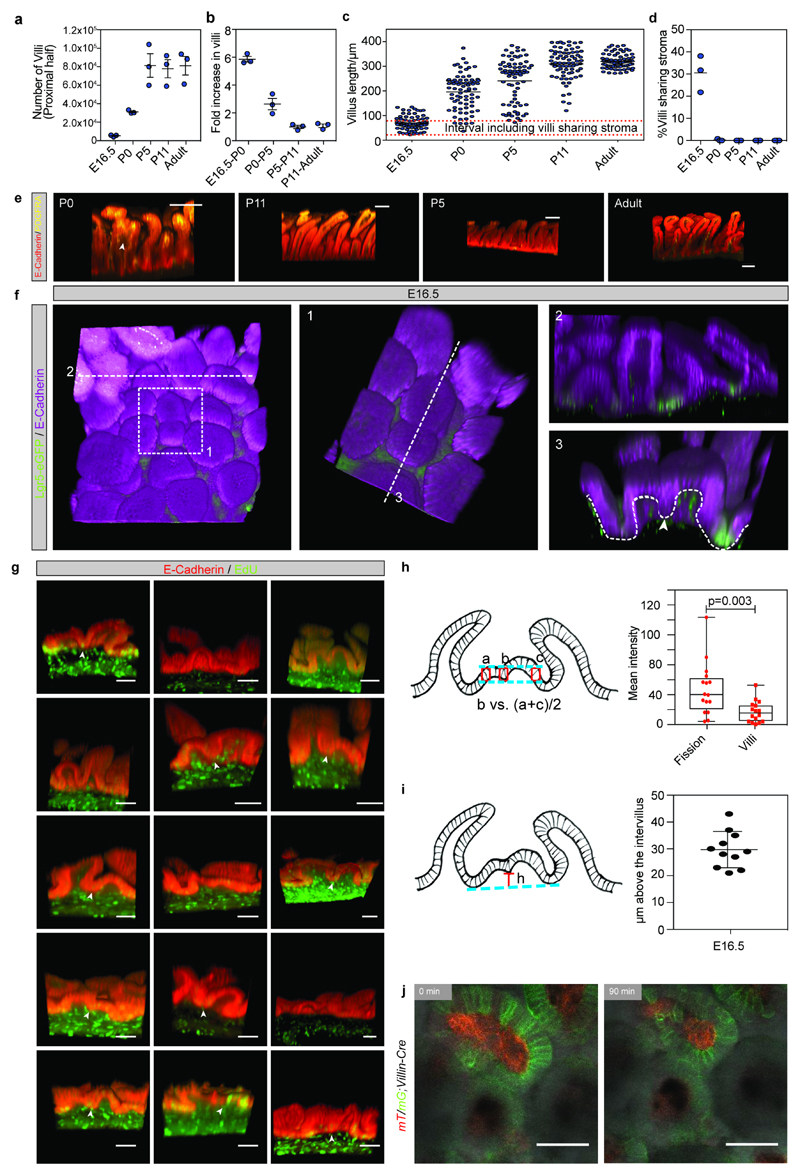
This finding, however, raised a conundrum, as this implied that cells on villi, traditionally considered as committed to differentiation, contributed substantially in the long-term to intestinal growth. Given the influence of gut epithelial geometry on cell fate3,15, we hypothesized that extensive cell rearrangements linked to continuous villification could shed light on this paradox. Between E16.5 and birth, the total number of villi increased by approximately 6-fold, before reaching the final number characterizing the adult epithelium by P5 (Extended Data Figure 4a,b). Therefore, we posited that global 3D epithelial sheet movements during villification could provide a mechanism to allow relocation of villus cells to the proliferative intervillus regions and de novo intervilli formation. Strikingly, detailed 3D reconstruction of the E16.5 intestine revealed that around 30% of villi presented irregular structures of doublet form, with shared mesenchymal clusters within a specific interval of villus heights (Figure 3a; Supplementary Video 3,4; Extended Data Figure 4c-e). We speculated that this could be a sign of a single villus undergoing fission. Of note, cells found at the juncture between these structures were Lgr5negative (Extended Data Figure 4f) and often proliferative (68% of junctures analyzed, Figure 3b; Extended Data Figure 4g-h; Supplementary video 5), even though the fission points were distant from the proliferative intervillus regions (Extended Data Figure 4i). To challenge these observations, we turned to explant cultures which, despite the intestine not expanding in length, revealed fission events evident from the top of single villi (Figure 3c, Extended Data Figure 4j; Supplementary video 6,7). Thus, villi underwent active remodeling causing pronounced reorganization of the epithelial cell layer.
Figure 3. Villi fission is required to explain epithelial expansion.
a) Detection of E-cadherin (red) and PDGFRA (yellow) in intestinal whole-mount during villi formation. A representative picture at E16.5 (n=3 animals). Arrowheads indicate villi with shared mesenchyme. Scale bar: 250 μm.
b) Detection of EdU (green top), PDGFRA (yellow, bottom) and E-cadherin (red) in intestinal whole mounts following a 1-hour EdU pulse at E16.5. Arrowhead indicate proliferative cells at the edge of putative branching villus (n=3 animals). Scale bar: 100 μm.
c) Pictures showing the start and end-points from live-imaging of a villus undergoing fission (red star) (Supplementary Video 5). White circles are reference villi. Three animals analysed. Scale bar: 50μm.
d) Model for cell repositioning based on villi emerging from the intervillus regions or through villus fission. Clones from villi can hereby recolonize the intervillus region and vice versa.
e-g) Simulation of the clonal dynamics (Lgr5- and Krt19 derived) using the cell repositioning model to predict the fraction of clones rooted in the intervillus region called rootedness (e), clonal persistence (Experimentally obtained data is also shown in Figure 2c) (f) and mean clone size (g). (Lgr5 data: P0 n=3, P5 n=3, P11 n=3, P36-Adult n=6 analyzed animals; Krt19 data: P0 n=1; P5 n=3, P11 n=6, Adult n=3 analyzed animals). Error bars indicate the mean±S.E.M.
h) Detection of Keratin 20 (Krt20, magenta), GFP (Lgr5-DTR-eGFP) and DAPI (cyan) at E16.5 in proximal small intestine. A representative picture of n=3 independent biological samples is shown.
i) Detection of E-cadherin (E-cad, cyan), GFP (green) and RFP (red) in tissue whole mounts from the proximal part of the small intestine isolated from Rosa26-lsl-Confetti/Krt20Cre-T2A-CreERT2 animals at P5 (n=4 animals), P11 (n=3 animals), and Adulthood (n=5 animals) following induction at E16.5 by the administration of 4-hydroxytamoxifen. White arrowheads indicate the clones depicted in the white dashed boxes at higher magnifications.
j-l) Simulation of the clonal dynamics (Krt20-derived) using the cell repositioning model to predict the fraction of clones with a rooted in the intervillus region (j), clonal persistence (Experimentally obtained data is also shown in Figure 2g) (k) and mean clone size (l). Lgr5 data P0 n=3, P5 n=3, P11 n=3, Adult n=6 animals analyzed and Krt20 data, P0 n=3, P5 n=4, P11 n=3, Adult n=5 animals analyzed. Line and error bars indicate the mean±S.E.M.
Based on these findings, we turned to a biophysical modeling approach to address whether a minimal model of villi fission could be sufficient to explain the observed long-term equipotency of epithelial cells at E16.5. We modeled both the neutral drift dynamics of proliferative cells restricted to intervillus regions, together with the bottom/up influx of cells driving villus elongation, using experimentally derived cell kinetics and geometrical parameters (Supplementary information; Extended Data Figure 5). Additionally, we incorporated stochastic villi fission (between E16.5 and P4), whereupon cells underwent positional changes and a fraction of cells from the parent villus became assigned to the new intervillus region (Figure 3d). To inform the model, we used the experimentally inferred growth rate of villi number (Extended Data Figure 6a), so that villi duplication and rapid underlying cell proliferation played a significant role in fueling epithelial growth. Within this simplified 2D framework, which takes into account the key features of a more complex 3D process, fission events resulted in the reversible transfer of cells between villus and intervillus regions. Importantly, we found that, with the experimentally inferred fission rate, just a few days were sufficient to fully erase the positional advantage of progeny from Lgr5positive cells, resulting in long-term equipotency amongst all epithelial cells (Figure 3e-g). In addition to reproducing well the global evolution of the mean clone size, clonal persistence and rootedness (Figure 3e-g), the model explained several non-trivial aspects of the observed short-term clonal dynamics. In particular, the model predicted that Krt19-clones should initially be bigger and more dispersed than Lgr5-clones because, even though Krt19 cells were predominantly induced in non-proliferative regions, they participated more readily in villi fission (Extended Data Figure 6b-e). Further, the model predicted that these Krt19 clones should still be less “rooted” in intervillus regions than Lgr5 clones in the short term (Fig. 3e), with the two converging at longer time points. These predictions showed consistently good agreement with the data (detailed statistics in Supplementary information).
We also performed sensitivity controls on our simulations. First, we assessed the clonal dynamics, only enabling fetal fission from E16.5 to P0. Importantly this result showed that fetal remodelling was sufficient to explain the bulk of equipotency between Lgr5 and Krt19 clones (Extended Figure 7a-c). By contrast, when the model was applied, either in the absence of de novo villi formation or with villi fission without epithelial reshuffling, a satisfactory fit to the data could not be obtained (Extended Data Figure 7d-i; Supplementary Information). Moreover, if we used a biophysical model based on the current model for villification, which involves successive rounds of de novo villi formation initiating from the intervillus regions16, it provided a poor fit to the data as this does not allow the relocation of villus cells to intervillus regions (Extended Data Figure 7j-o; Supplementary Theory Note). Finally, a last prediction of our biophysical model was that the contribution from the Krt19-labeled population should be drastically reduced once villi fission slowed down, which was corroborated by fate mapping experiments starting at P0 rather than E16.5 (Extended Data Fig. 8a-c). This suggested strongly that villi remodelling events were required for recruitment of villus cells into the future stem cell compartment.
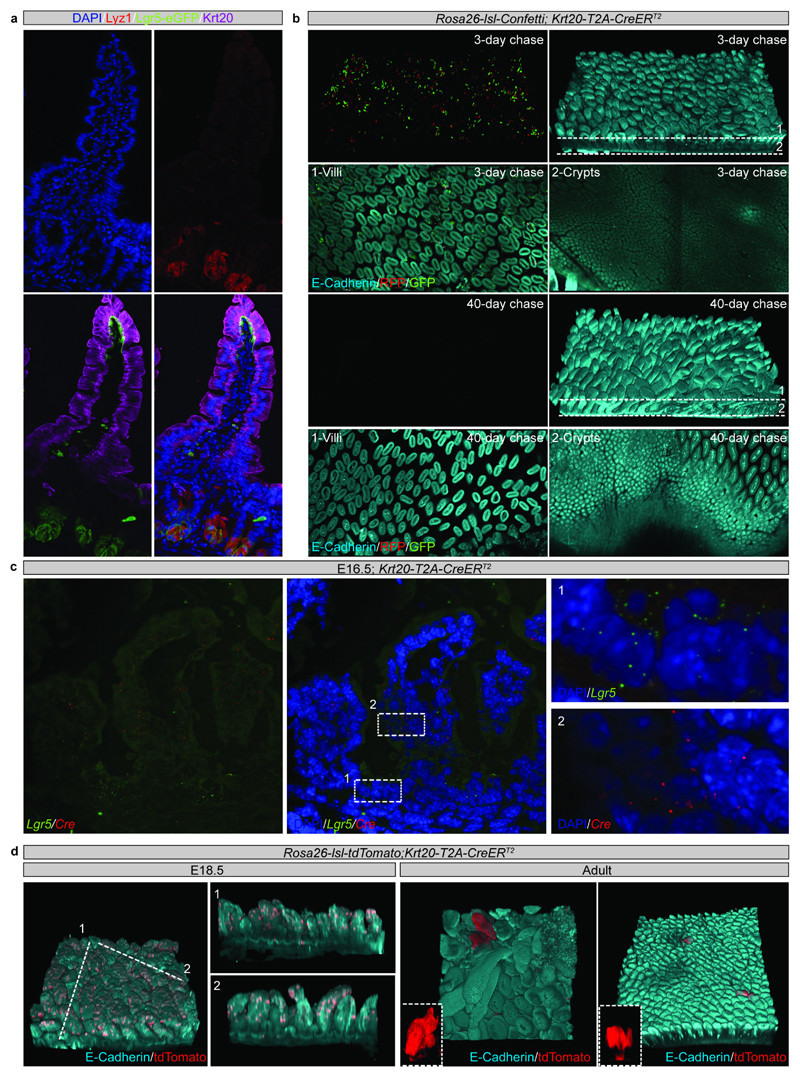
To validate independently that cells specifically located on villi contributed to the adult intestinal epithelium, similarly to Lgr5-derived cells, we identified Krt20 as a marker of fetal and adult villi (Figure 3h; Extended Data Figure 9a-c). Interestingly, 27% of Krt20positive score positive for the proliferation signature, even though these cells are confined to villi. Using a Krt20 driven cre, it was evident that cells labelled in the adult epithelium were invariably lost, as reported for other differentiated cell types (Extended Data Figure 9b)5,6. However, in the fetal epithelium, although the majority of labeled cells were initially detected in villi, clones persisted and generated adult ISCs (Figure 3i; Extended Data Figure 9d; Supplementary information). Importantly, quantitative analysis confirmed the model predictions for rootedness, persistence and size for Krt20 clones, demonstrating once again that intervillus and villus cells display similar behavioral dynamics (Figure 3j-l). Altogether, these findings confirmed that the long-term self-renewal potential of intestinal cells become sensitive to location soon after birth17, i.e. after major structural changes of villi have ceased and cell migration streams established.
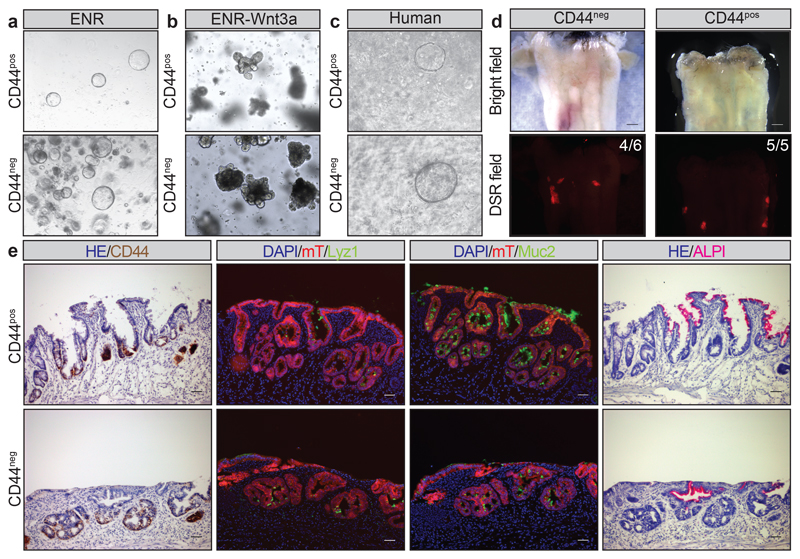
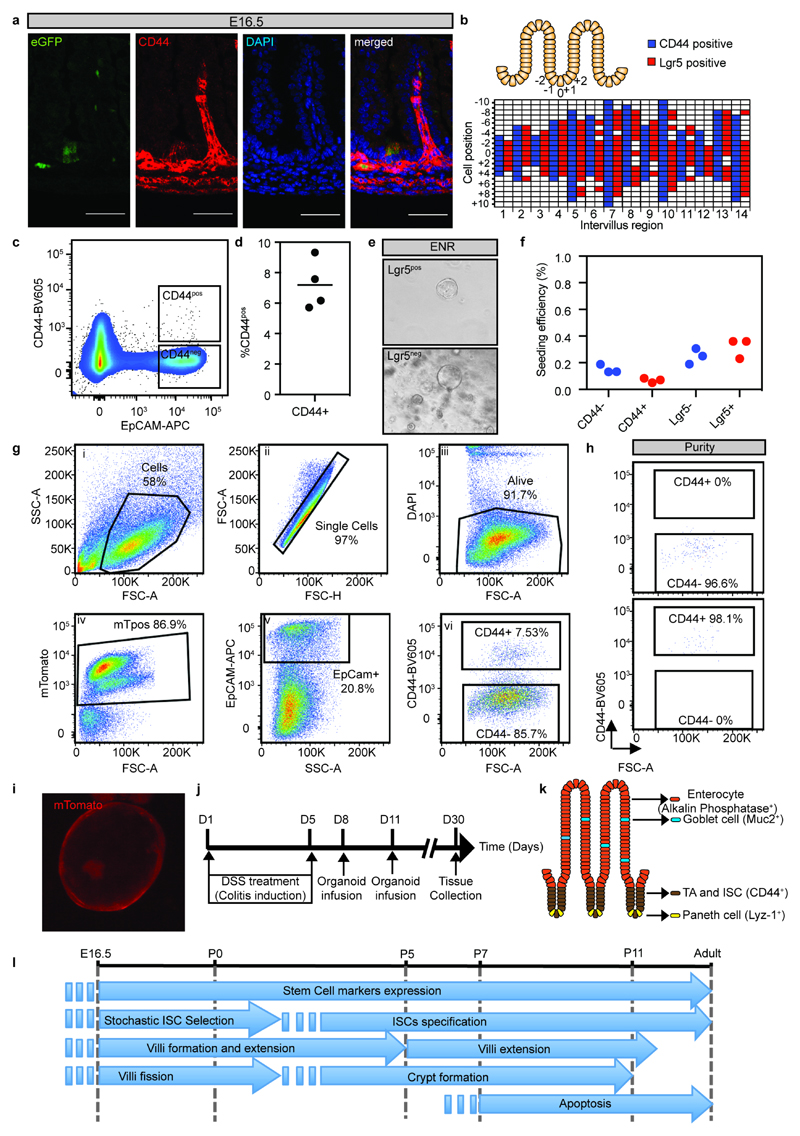
To further investigate mechanistically the surprising plasticity of cells from villus (Lgr5/CD44negative) and intervillus (Lgr5/CD44positive) regions (Extended Data Figure 10a-d), we took advantage of a 3D culture system that allowed cells to self-organize into villus and crypt domains18,19. When sorted from E16.5 proximal small intestine, both populations grew as spheroids mimicking the immature nature of the fetal small intestine with comparable plating efficiencies (Figure 4a; Extended Data Figure 10e,f). As reported for bulk cultures19, Wnt3a stimulation was sufficient, irrespective of their cell-of-origin, to convert spheres into budding intestinal organoids (Figure 4b). Importantly, CD44positive and CD44negative cells isolated from gestational week 8-10 human fetal intestine were capable of forming spheroids (Figure 4c). Finally, to challenge the murine cultures from the two cell population, these were transplanted into conditioned animals (Extended Data Figure 10g-j)20. Again, both cell populations engrafted with similar efficiencies and established CD44positive adult stem cell niches at the bottom of crypts and gave rise to appropriate differentiated lineages including Paneth cells (Lyz1), goblet cells (Muc2) and enterocytes (Alp) (Figure 4d-e; Extended Data Figure 10k). Altogether, these findings demonstrated that fetal villi and intervillus cells had similar potential to grow in vivo and in vitro, and exhibited the same regenerative potential.
Figure 4. Villus and intervillus cells are equipotent and have the same regenerative potential.
a) Formation of spheroids from epithelial cells isolated based on DAPInegEpCAMposCD44pos and DAPInegEpCAMposCD44neg from the proximal half of the small intestine from mice at E16.5. A representative picture of n=3 independent samples is shown.
b) Spheroids following treatment with Wnt3a. A representative picture of n=3 independent samples is shown.
c) Formation of spheroids from epithelial cells isolated based on DAPInegCD44pos and DAPInegCD44neg from the proximal half of the human fetal small intestine (8 weeks of gestation). A representative picture of n=2 independent samples is shown.
d) Engraftment of spheroids derived from DAPInegEpCAMposCD44pos and DAPInegEpCAMposCD44neg obtained from E16.5 mT/mG animals. Four out of six mice were engrafted with CD44neg-derived cells and five out of five in CD44pos-derived cells. Scale bars: 10mm. A representative picture of independent engraftments is shown (CD44neg n=4; CD44pos n=5)
e) Detection of CD44v6, Lyz1, Muc2 and ALPI in serial section of the engrafted patches (red). Scale bars: 50μm. A representative picture of independent engraftments is shown (CD44neg n=4; CD44pos n=5)
Altogether, using in vivo lineage tracing in combination with biophysical modeling and in vitro analysis of both mouse and human fetal samples, these results demonstrate that fetal intestinal cells irrespective of their location and marker expression represent equipotent precursors for adult intestinal stem cells (Extended Data Figure 10l). We propose that the process of villi-fission/tissue bending during intestinal morphogenesis provides a biophysical mechanism to remodel the local microenvironment, allowing cells to switch reversibly between Lgr5negative and Lgr5positive states. This behavior mirrors the findings from various adult injury models, where Lgr5positive cells lost through damage were subsequently replenished through the recolonization by Lgr5negative cells5,6,8,9,21,22. Interestingly, the fission mechanism resembled the proposed model for villification in avians, where longitudinal epithelial ridges generate a zig-zag pattern that break-up into individual villi15, and where villi geometry was proposed to define gradients of growth factors thereby establishing distinct cell fates3. We propose that these growth factor gradients impose specific expression patterns without irreversibly changing cell fates. This is evident from the profound cellular plasticity observed within cells covering both villi and intervillus regions with respect to their long-term self-renewal potential. This could be a generic property of developmental systems, ensuring the robust coordination of morphogenesis and fate specification23.
These findings have important implications for the improvement of differentiation protocols to e.g. generate intestinal stem cells from hiPSC24,25. Consistent with our findings, fetal-like intestinal cells derived from hiPSC generate cells with adult stem cell characteristics only upon transplantation26–29. In this sense, the plastic fetal precursor state, which retains the capacity to be induced into an adult stem cell state, represents an attainable target for our strategies to direct differentiation. Understanding how these fetal precursors are induced to become adult stem cells will provide insight into how the process can be orchestrated in vitro. As fetal progenitors have been identified in multiple tissues, and all appear to mature in a similar manner upon transplantation26–29, the precursor state is most likely a general intermediate during tissue maturation. It is, therefore, tempting to speculate that the plasticity observed during tissue regeneration may be explained via the equipotent progenitor state observed during fetal development.
Methods
Mice
Unless otherwise specified, C57BL/6J mice (purchased from Taconic, Denmark) were used for all the experiments. Transgenic murine lines used in the experiments have been previously described: Rosa26-mT/mG30, Lgr5-eGFP-ires-CreERT2 2, Krt19CreERT 31, RAG2-/- (Taconic, US), Rosa26-lsl-Confetti32, Lgr5-DTR-eGFP22, Villin-Cre34, Krt20-T2A-CreERT2 (Jackson laboratories, Stock No: 030600), and Rosa26-lsl-tdTomato33. CD1 mice (Janvier) were used as foster mothers in the lineage tracing experiments.
None of the animals used in these studies had been subjected to prior procedures and were drug and test naïve. All animals were housed in SPF (specific pathogen free) animal facilities, in either open or individually ventilated cages always with companion mice, and cages were placed under a 12hr light-dark cycle. Food and water were provided ad libitum. Randomized cohorts including both male and female animals were distributed in an unblinded manner into the experimental time points for analysis. Sample sizes were selected to provide sufficient statistical power for analysis. The National animal ethics committee in Denmark reviewed and approved all animal procedures (Permit numbers 2013-15-2934-00756 and 2013-15-2934-00927).
Lineage tracing experiments and quantification
Pregnant females carrying embryos at E16.5 were intraperitoneally injected with 4-Hydroxytamoxifen (4OHT) at the indicated amount (Sigma) and Progesterone (50μg, Sigma) in corn oil (Sigma). Lgr5-eGFP-ires-CreERT2 and Krt20-T2A-CreERT2 pregnant mice were injected with 1mg of 4OHT; Krt19CreRT pregnant mice were injected with 100μg of 4OHT. Krt19CreERT/Rosa26mT/mG pregnant mice were injected with 1mg of 4OHT. Krt19CreERT/Rosa26-lsl-Confetti and Lgr5-eGFP-ires-CreERT2/Rosa26-lsl-Confetti P0 newborns were injected with 10μg of 4OHT. Lgr5-eGFP-ires-CreERT2 mice were delivered by Cesarean sections at E18.5 and newborns were transferred to CD1 foster mothers. The proximal half of the small intestine was collected at the time points indicated in the figures. In Krt19CreERT/Rosa26-lsl-Confetti and Lgr5-eGFP-ires-CreERT2/Rosa26-lsl-Confetti quantifications only red clones were considered in Krt20-T2A-CreERT2 red and YFP clones were considered. The projections of “volume”, “number of villi” and “number of clones (persistence)” at the indicated time points was calculated by multiplying the “volume/unit area”, “number of villi/unit area” and “number of clones/unit area” by the total surface of the proximal half of the intestine at each time point analyzed.
Transplantation
Transplantation was performed using RAG2-/- mice as recipients, essentially as previously described20. Briefly, Colitis was induced in RAG2-/- animals (3-6 months old) by administration of 3.3% DSS (MP Biomedicals; MW; 36.000-50.000) in the drinking water for 5 days followed by normal water. Animals were subsequently infused with cultured intestinal epithelial cells derived from Rosa26mT/mG mice on day 8 and day 11 after the beginning of DSS treatment. Cells were cultured as described below in Matrigel. At passage 5, epithelial cells were released from matrix, and mechanically dissociated into epithelial sheets. After washing, cell fragments from approximately 600 organoids were resuspended in 300μL 5% Matrigel in PBS. Under general anesthesia (Isoflurane; Piramal Healthcare), a flexible catheter was inserted into the colon of mice and the cell suspension was subsequently infused slowly into the colonic lumen. The anus was sealed with surgical histoacryl glue (B. Brawn) for 3 hours to reduce flow in the colon. The animals were carefully monitored during the colitis and following transplantation. Two weeks after the second transplantation, recipient mice were sacrificed and colons were harvested and processed for analysis.
Human Fetal Samples
Human fetal tissue collection was approved by the regional ethics committee (permit number H-1-2012-007 and 258206). Women gave their informed written and oral consent. None of the terminations were for reasons of fetal abnormality and the fetal tissue was available following elective termination of pregnancy during first trimester.
Imaging and histology
Whole mount immunostainings
Proximal half of the small intestines were fixed with 4% Paraformaldehyde (PFA) from 3 hours to overnight at 4°C. Then the samples were dissected into smaller fragments (approx. 4mm x 4mm) followed by dehydration in methanol. Samples were stored in methanol at -20C. Then, the tissue was rehydrated in series of PBS prior to staining with all steps being performed at 4°C. Briefly, samples were blocked and permeabilized in 1% Bovine Serum Albumin (Sigma), 0.5% Triton X-100 (Triton™ X-100 Surfact-Amps™ Detergent Solution, Thermo Fisher) in PBS for 24h. Primary antibodies (indicated in Supplementary Table) were incubated in 1% Bovine Serum Albumin (Sigma), 0.5% Triton in PBS for 48h. Tissue was subsequently washed in 0.5%Triton (Triton™ X-100 Surfact-Amps™ Detergent Solution, Thermo Fisher) in PBS overnight. Secondary antibodies (indicated in Supplementary Table) were incubated in 1% Bovine Serum Albumin (Sigma) 0.5% Triton X-100 (Triton™ X-100 Surfact-Amps™ Detergent Solution, Thermo Fisher) in PBS for 48h and the tissue was subsequently washed overnight with 0.5% Triton X-100 (Triton™ X-100 Surfact-Amps™ Detergent Solution, Thermo Fisher) in PBS. Diamidino-2-phenylindole dihydrochloride (DAPI; 1μM; Sigma) was used to counterstain nuclei in the indicated experiments. Samples were then dehydrated in Methanol and kept at -20°C. Samples were cleared using 1:2 Benzyl alchol:Benzyl Benzoate (BABB) (Sigma). Briefly, 5 changes (1 minute each) of BABB:Methanol 1:1, then 5 changes (2 minutes each) of BABB. The samples were subsequently mounted within a Fast well (FW20-FastWells 20mm Dia. X 1.0mm Depth / 25 X 25mm, Grace-Biolabs). Z-stack images were acquired using laser scanning confocal microscopy (Leica TSC SP8). 3-dimensional reconstructions were done using Fiji software and clone volume was assessed using Volocity 6.3.0 (Perkin Elmer).
EdU staining
Mice were intraperitoneally injected with EdU (Pregnant females carrying embryos at E16.5 with 250μg; P0 with 25μg; P5 with 31.25μg, P11 37.5μg and Adult with 250μg) and processed according to manufacturer’s instructions (Click-iT® Plus EdU Alexa Fluor® 488 Flow Cytometry Assay Kit / Click-iT™ EdU Alexa Fluor™ 555 Imaging Kit, Thermo Fisher). Following a 1-hour chase, the tissue was processed as detailed in the previous section. Before (2-dimensional stainings) or after (whole mount immunostainings) primary and secondary antibody staining, EdU was developed using Click-iT® technology. Diamidino-2-phenylindole dihydrochloride (DAPI; 1μM; Sigma) was used to counterstain nuclei in the indicated experiments
2-Dimensional immunostainings
Proximal halves of the small intestine were fixed with 4% Paraformaldehyde (PFA) from 3 hours to overnight at 4°C and following dehydration embedded in Paraffin. 5-8μm-sections were prepared with a microtome.
The luminal perimeter was measured at the indicated time points in sections of small intestines stained with Hematoxylin QS (Vector) and Eosin Solution Aqueous (Sigma). Alkaline Phosphatase staining was performed using Vector Red Substrate Kit (Vector). Images were acquired and using NDP Zoomer Digital Pathology (Hamamatsu) and subsequently analyzed in NDP.view2 software.
To perform immunohistochemistry and immunofluorescence on paraffin embedded tissues, sections were rehydrated prior to antigen retrieval. Diva Decloaker solution (Biocare Medical) and Retriever 2100 (Aptum) were used at this step. Then, blocking and permeabilization was performed in 10% Adult bovine serum (Sigma), 0.3% Triton X-100 (Triton™ X-100 Surfact-Amps™ Detergent Solution, Thermo Fisher) in PBS for at least 1h at room temperature. Primary Antibodies (indicated in Supplementary Table) were incubated overnight in 10% Adult bovine serum (Sigma) at 4°C. Secondary antibodies (indicated in Supplementary Table) were incubated 1-2h at room temperature in 0.5% Bovine Serum Albumin (Sigma) or in the ready to use solutions (Vector), when using Horseradish Peroxidase conjugated secondary antibodies. For immunofluorescence Diamidino-2-phenylindole dihydrochloride (DAPI; 1μM; Sigma) was used to counterstain nuclei in the indicated experiments. For immunofluorescence Alexa™ conjugated secondary antibodies were used (detailed in Supplementary table) except for anti-CD44 antibody (indicated in Supplementary table), were TSA Plus Cyanine 3 and Fluorescein System (Perkin Elmer) was used. For the immunohistochemistry secondary antibodies were developed using DAB (ImmPACT DAB Peroxidase (HRP) Substrate, Vector) and nuclei subsequently visualized with Hematoxylin QS (Vector). Fluorescent images were acquired using laser scanning confocal microscopes (Leica TSC SP8), images of engrafted patches were acquired using a Zeiss Imager M2 microscope equipped with ORCA-R2 Digital CCD camera C10600 (Hamamatsu), and immunohistochemistry sample were imaged using NDP Zoomer Digital Pathology (Hamamatsu). All images were subsequently analyzed in NDP.view2 software, Fiji and Adobe Photoshop CS6.
Sequential sectioning of grafted epithelial patches
Two weeks after the second transplantation, recipient RAG2-/- mice were culled by cervical dislocation and colons were dissected. After washing with PBS, colons were opened longitudinally and imaged by stereomicroscopy (Leica M165FC). Engrafted patches were dissected from colon and fixed with 4% PFA for 3 hours followed by incubation in 20% Sucrose solution in PBS for overnight. Tissue fragments were embedded in OCT. Eight μm sequential frozen sections were analyzed histologically as described above.
Intestinal live imaging of explant cultures
Proximal half of small intestine was isolated from E16.5 embryos. The intestine was subsequently cut opened longitudinally and attached from both ends of the intestine to a bottom glass plate using surgical histoacryl glue (B. Brawn). Explant cultures were covered in BGJb Medium (ThermoFisher Scientific) supplemented with 0.1 mg/ml Ascorbic Acid (Sigma) and 1% PenStrep (Life technologies, GIBCO) as previously described35. Samples were imaged using a Delta Vision deconvolution microscope (GE Healthcare) and Widefield Zeiss AxioImager microscope.
Isolation of epithelial cells from the fetal epithelium and purification by flow cytometry
Fetal small intestine from mouse or human fetuses was dissected and incubated with collagenase solution (125μg/mL in PBS) for 45 min at 37°C, and subjected to vigorously pipetting every 15 min using a P1000 pipette. Released cells were pelleted and resuspended in PBS supplemented with 1% BSA and incubated with fluorescent conjugated primary antibodies (indicated in Supplementary Table) for 30 min on ice. After washing, 4′,6-Diamidino-2-phenylindole dihydrochloride (DAPI; Sigma; 1μM) was added to the cell suspension to facilitate exclusion of dead cells by flow cytometry. Purified cell populations were subsequently isolated using a FACSAria I or III (BD Bioscience). After isolation, cells were embedded in growth factor reduced Matrigel (Corning) in the presence of human EGF (Peprotech; 50ng/mL), murine Noggin (Peprotech; 100ng/mL), human Noggin (Peprotech; 100ng/mL), mouse R-spondin1 (R&D; 500ng/mL) as previously reported20. In some experiments Wnt3a conditioned medium (50% in volume) was added as a supplement as indicated. Prostaglandin E2 (2.5 μM, Sigma) was added to the human fetal cultures. In all experiments using murine organoids, cells were harvested from WT C57/BL6 animals (Taconic, Denmark). Cells were cultured in a dome-shaped 25μl extracellular matrix droplet and 250μl culture medium was added to each well in a 48-well plate (flat bottom; Corning). Medium was subsequently changed every 2-3 days. For human samples we observed no discernable effect of whether the pregnant mother was a smoker or not.
Single cell sequencing
Cells were isolated from a pool of six proximal small intestines (1cm of length each) at E16.5 using collagenase treatment and cell sorting as described in the previous section. 20,000 DAPInegCD31negCD45negEpCAMpos cells were processed using 10x Genomics Chromium protocols (version 2 chemistry).
RNA sequencing data analysis
Reads were de-multiplexed, aligned and counted using the 10x Genomics Cellranger 2.1.0 software36. The refdata-cellranger-mm10-1.2.0 reference was downloaded from the 10x Genomics website https://support.10xgenomics.com/. The resulting filtered count matrix was loaded into Pagoda 237 for data exploration and Seurat 2.338 for visualization purposes. Genes that were expressed in less than 5 cells were removed. Cells with less than 200 genes, more than 6000 genes or more than 10% mitochondrial genes were removed. Before filtering the dataset consisted of 3770 cells. After quality control, 3509 cells remained.
Scores for signatures for adult epithelium single cell zones 1-5 and the proliferation signature were calculated using Seurat’s AddModuleScore function. The corresponding gene lists were extracted from Table S114,15.
Cells were considered as positive for a particular Moor et al. Zone signature, when their expression was higher than mean + 1 sd for that particular signature. Cells were considered as positive for the proliferation signature when their scores were >0 in Seurat 2.3’s normalized expression value. Similarly, cells were considered as positive for individual genes when their scores were >0 in Seurat’s normalized expression value.
Statistics
The number of biological and technical replicates and the number of animals are indicated in figure legends and text. All tested animals were included. Sample size was not predetermined. For all experiments with error bars, the standard error of the mean (S.E.M.) or standard deviation (SD) was calculated to indicate the variation within each experiment or sample. T-test was used to assessed the significance in the indicated experiments.
Extended Data
Extended Data Figure 1. Lgr5 positive cells and proliferative cells are restricted to the intervillus regions.
a) Detection of E-Cadherin (red) and GFP (Lgr5-DTR-eGFP) at E13.5 and E16.5 in proximal and distal small intestine. Tissue is counterstained with DAPI (cyan). A representative picture from each time point and intestinal segment is shown (n=3 animals analyzed).
b) In situ hybridization of endogenous Lgr5 at E13.5 and E16.5 in proximal and distal small intestine. Tissue is counterstained with DAPI (cyan). A representative picture of at each time point and intestinal segment is shown (n=3 animals analyzed).
c) Detection of E-cadherin (magenta) and GFP (Lgr5-DTR-eGFP) in intestinal whole-mount at E16.5 in proximal small intestine. A representative picture from n=3 independent samples is shown.
d) Detection of Ki67 and EdU (red) following a 1-hour pulse at the indicated time points (left and right panels, respectively). Three animals were analyzed at each time point and a representative picture is shown. Scale bars: 50μm.
e-f) Quantification of number and location of EdU+ cells as depicted (e) from at least 10 intervillus regions per mouse at E16.5, P5, P11, Adult, and 20 intervillus regions per mouse at P0 up to position 10 and position 17 (adult). Samples from three animals were analyzed at each time point. Bars represent the mean + S.E.M.
Extended Data Figure 2. Lgr5-derived clones are located in intervillus regions and qualitative/quantitative morphological analysis of the intestine from fetal to adult stages.
a) Quantification of the localization of labeled clones at P0 following labeling at E16.5 in Rosa26-lsl-Confetti/Lgr5-eGFP-ires-CreERT2 animals. Villi containing clones were divided in three equal regions (T: top, M: mid, B: bottom) based on the z-projections in the 3D to determine the clone localization at P0 (n=24 clones).
b) Detection of E-cadherin (red) in whole mounts at the indicated time points. Scale bars: 100μm. A minimum of three animals were analyzed at each time point and representative pictures are shown (E16.5 n=3, P0 n=9, P5 n=9, P11 n=9, Adult n=9 independent animals)
c) Measurements of the total epithelial volume/unit area based on detection of E-cadherin relative to the area of the intestine was assessed (samples from b). Dots represent independent biological samples and lines represent the mean±S.E.M.
d) Length of the small intestine at E16.5 (n=12), P0 (n=3), P5 (n=3), P11 (n=8) and Adult (n=4). Dots represent individual animals and lines represent the mean±S.E.M.
e) Luminal perimeter of the small intestine at E16.5, P0, P5, P11 and Adult. Dots represent individual animals (n=3) and lines represent the mean±S.E.M.
f-h) Quantification of GFP as a proxy of Lgr5 in proximal and distal small intestine at E13.5 (n=3 animals both proximal and distal) and E16.5 (n=7 animals proximal and n=5 animals distal) small intestines (f). Fluorescence minus one (GFP) controls used to establish the positive gates are shown in (g). h) Representative FACS dot plot illustrating the gating strategy to quantify the size of the Lgr5-DTR-eGFPpositive population (Gate: DAPInegCD31negCD45negEpCAMpos). Dots represent measurement in individual animals and lines represent the mean±S.E.M.
Extended Data Figure 3. Characterisation of the fetal small intestinal epithelium.
a) tSNE plots from sc-RNAseq of epithelial cells from the proximal small intestine showing expression of ISC (Lgr5) and differentiation markers (Muc2, Lyz1, ChgA, Alpi). Darker color indicates higher normalized gene expression. Each dot represents independent cells, a total of 3509 cells are shown.
b) Detection of differentiation markers at E16.5 and adult small intestine. Tissue is counterstained with HE. Scale bars: 250μm. Samples from n=3 animals were analysed at each time point and representative images are shown.
c-d) (c) Cartoon depicting that adult villi are transcriptionally zonated in five regions from the bottom to the top (z: zone). (d) tSNE plots showing the enrichment of villi clusters in the sc-RNAseq from E16.5 small intestine.
e) tSNE plot showing the enrichment of a proliferation signature in specific cell populations (left panel) and fraction of cells in each subpopulation scoring positive for the proliferation gene signature (right panel). Darker color in tSNE plot indicates higher expression levels of the proliferation gene signature.
f) tSNE plot showing expression of Keratin 19 (Krt19). Darker color indicates higher normalized gene expression levels.
g) Detection of Krt19 (red) and GFP (Lgr5-DTR-eGFP) at E16.5 in proximal small intestine. Tissue is counterstained with DAPI (cyan). Scale bars: 50μm. Samples from three animals were analyzed and a representative picture is shown.
h) Detection of (Krt19, red) at different time points in tissue from the small intestine. Tissue is counterstained with DAPI (cyan). Scale bars: 50μm. Samples from three animals were analyzed per time point and representative pictures are shown.
i) Relative volume (projected) of Krt19-clones and epithelium based on E-Cadherin. E-Cadherin is also shown in Figure 1c and Krt19-clones are also shown in Figure 2. (Krt19-clones, biologically independent samples: P0 n=1; P5 n=3, P11 n=6, Adult n=3; E-Cadherin biologically independent samples: P0 n=9, P5 n=9, P11 n=9, Adult n=9)
j) Quantification of the localization of labeled clones at P0 following administration of 4-hydroxytamoxifen at E16.5 in Rosa26-lsl-Confetti/Krt19-CreERT animals. Villi containing clones were divided in three equal regions (T: top, M: mid, B: bottom) based on the z-projection in 3D to determine where clones were located at P0 (n=27).
k) Detection of GFP (green) and RFP (red) in whole mounts from the proximal part of the small intestine isolated from mT/mG/Krt19CreERT animals at P0 following induction at E16.5. A representative picture of n=3 biologically independent samples is shown. Scale bars: 25μm
l) Apoptotic cells were detected by cleaved caspase3. Arrowheads demarcate positive cells in inserts. Samples from 3 animals were analyzed per time point and representative pictures are shown. Scale bars: 250μm.
Extended Data Figure 4. Villi formation and parameter description of villi fissions.
a) Total number of villi (projected) in the proximal half of the small intestine based on equal density along the length. Samples from 3 animals were analyzed per time point. Each dot represents an animal and lines represent the mean±S.E.M.
b) The fold change in villi numbers between the indicated time points based on 3 samples analyzed per time point. Each dot represents an independent sample and lines represent the mean±S.E.M.
c) Villus height at the different time points. The demarcated red lines indicate the interval containing villi with sharing stroma. The length was assessed in 25 villi per animal and in 3 animals per time point. Dots represent independent measurements and lines represent the mean.
d) Quantification of the number of villi sharing stroma in 3 animals per indicated time point (E16.5 n=233, P0 n=412, P5 n=406, P11 n=412, Adult n=129 villi were counted). Dots represent the percentage of villi sharing stroma in each independent animal and the line the mean.
e) Detection E-cadherin (red) and PDGFRA (yellow) in whole mounts indicating villi with sharing stroma (arrowhead). Samples from 3 animals were analyzed per time point and representative pictures are shown. Scale bars: 100μm.
f) Detection of E-cadherin (magenta) and GFP (Lgr5-DTR-eGFP) in E16.5 intestinal whole-mount. Boxed area (1) indicate a villus undergoing fissioning shown in higher magnification. Transversal sections (a and 3) illustrating villi surrounded by Lgr5-expressing cells (2) and villus with shared mesenchyme (3). Arrowhead indicates that pockets formed in a fissioning villus are Lgr5 negative, dashed line outline the epithelium. Samples from 3 animals were analyzed and a representative picture is shown.
g) Detection of EdU incorporation (green) in the epithelium (E-cadherin, red) following a 1-hour chase in E16.5 intestinal whole-mounts. Arrowheads indicating proliferative cells at the edge of putative villi undergoing fission. These are detected in 11 out of 16 structures. Representative pictures from 3 animals analyzed are shown. Scale bars: 50μm
h) Quantification of EdU intensity in the fissioning areas compared to the surrounding villi at the same height quantified as depicted in the cartoon based on thresholded intensity in the demarcated boxes. n=16 independent villi sharing stroma were quantified. Min to max quartiles, dots represent fluorescent ratio of the independent villi sharing stroma quantified. Paired t-test was applied.
i) Height of the proliferative fissioning areas compared to the surrounding intervillus regions were quantified as depicted in the cartoon. n=11 independent villi sharing stroma were quantified.
j) Pictures showing the start and end points from live-imaging of villi undergoing fission (Supplementary Video 6). In mT/mG;Villin-Cre animals, where the epithelium is shown Green (mG) and remaining cells in red (mT). A representative fission event from 5 analyzed animals ishown. Scale bar: 50μm.
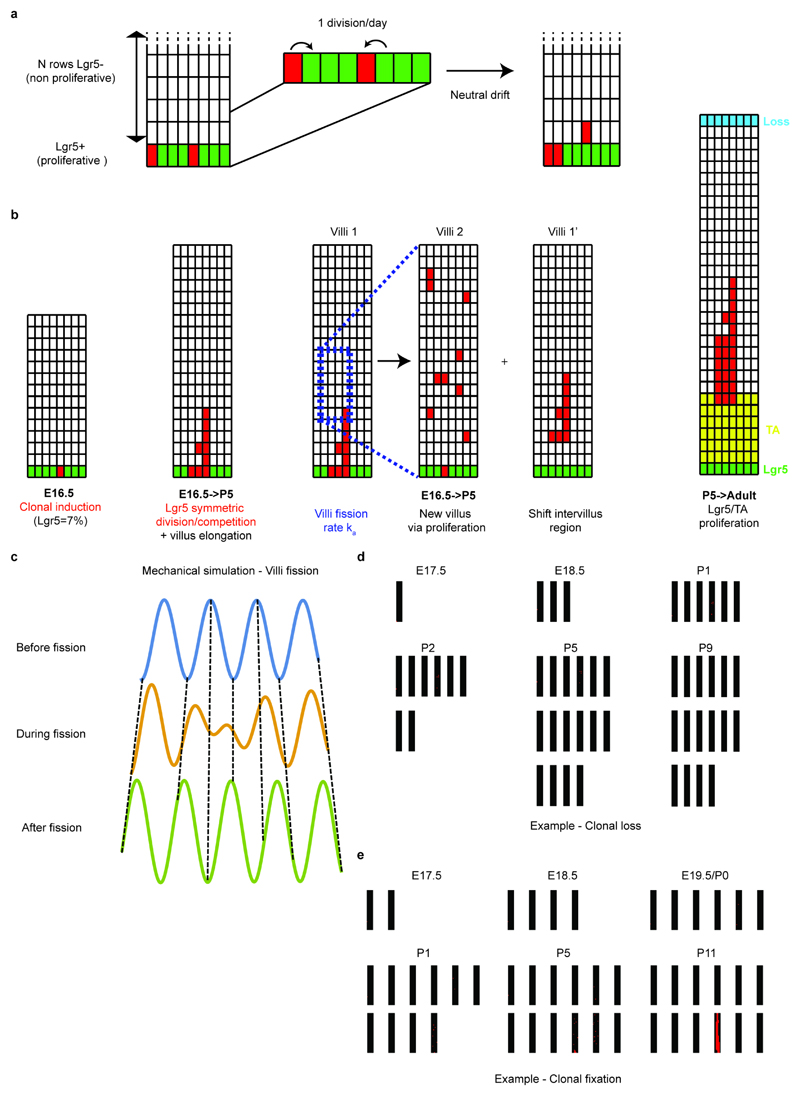
Extended Data Figure 5. Outline of the model and typical outputs from simulations.
a) Schematics of the model for the renewal of intervillus Lgr5+ cells. Based on proliferation data, we assume that the classical model of symmetrically dividing and competing Lgr5+ cells holds embryonically, with a division rate once a day. The “losing” cell is expelled into the TA compartment, displacing all cells above it by one position.
b) Schematics of the model for the dynamics of differentiated cells on the villus. The model dynamics are separated into two phases. A first one occurs from E16.5 to P5: Lgr5+ cells are the only proliferative cells, and villi fission occurs as a stochastic event, resulting in the duplication of a villus sub-region into a whole new intervillus/villus grid, and a resulting shift of cells along the existing villus. A second phase occurs after P5, where the dynamics are similar to adulthood, with rapidly dividing TA cells (occupying 1/5 of the villus at the bottom) and cell loss at the top. Proliferation of TAs is again exclusively along the top/bottom axis, resulting in unidirectional displacement of all cells above the dividing cell.
c) Three snapshots from a numerical simulation of the epithelium as a growing elastic sheet on a growing elastic media. The growth is assumed to be quasi-static, so that the epithelium wishes to maintain a deformation at a given wavelength, minimizing the elastic energy of the sheet+substrate. Where the system grows (top to bottom panels), this results in de novo villi formation from local deformations of the epithelial sheet, resulting in villus and intervillus regions to shift places via tissue bending (dashed lines serve as a guide for the eye to represent how a cell in a given position x can change height z).
d-e) Two sets of snapshots from two numerical simulations of an E16.5 Lgr5 tracing, according to the rules outlined in a-b). Each black box represents an intervillus/villus grid, with the number increasing in time due to random villi fission. Red squares indicate the labeled cells at E16.5 (initially in the bottom-most layer of Lgr5+ cells). Panel d) displays an example of a clone, which becomes lost in time, despite having participated to villi fission between E18.5 and P1. Panel e) displays an example of a clone, which becomes fixed within one of the villi having formed de novo during the simulation (while the labeled cell in the original intervillus/villus region of induction got shifted away from the intervillus by an event of villi fission between E16.5 and E17.5).
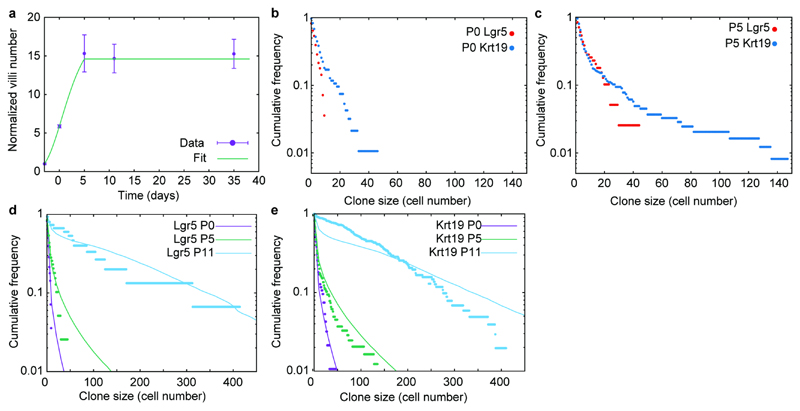
Extended Data Figure 6. Clone size distributions based on simulation using the cell repositioning model.
a) Normalized total number of intestinal villi in time (purple, same as Extended Data Figure 4a) vs. fitted trend for the villi formation rate (green line), which we use in the numerical simulations. Samples from 3 animals were analyzed per time point. Error bars represent the mean±S.E.M.
b) Cumulative distribution of clone sizes (induced at E16.5) at P0 in the Lgr5 (red) compared to the Krt19 (blue) tracing also depicted in Figure 2d.
c) Cumulative distribution of clone sizes (induced at E16.5) at P5 in the Lgr5 (red) compared to the Krt19 (blue) tracing also depicted in Figure 2d.
d) Comparison between experimental (dots) and theoretical cumulative distribution of Lgr5 clone sizes (induced at E16.5), at P0 (purple), P5 (red) and P11 (cyan).
e) Comparison between experimental (dots) and theoretical cumulative distribution of Krt19 clone sizes (induced at E16.5), at P0 (purple), P5 (red) and P11 (cyan).
For all panels, clone size was inferred from clonal volume (Supplementary Table 2), using average single-cell measurements volume as a conversion factor.
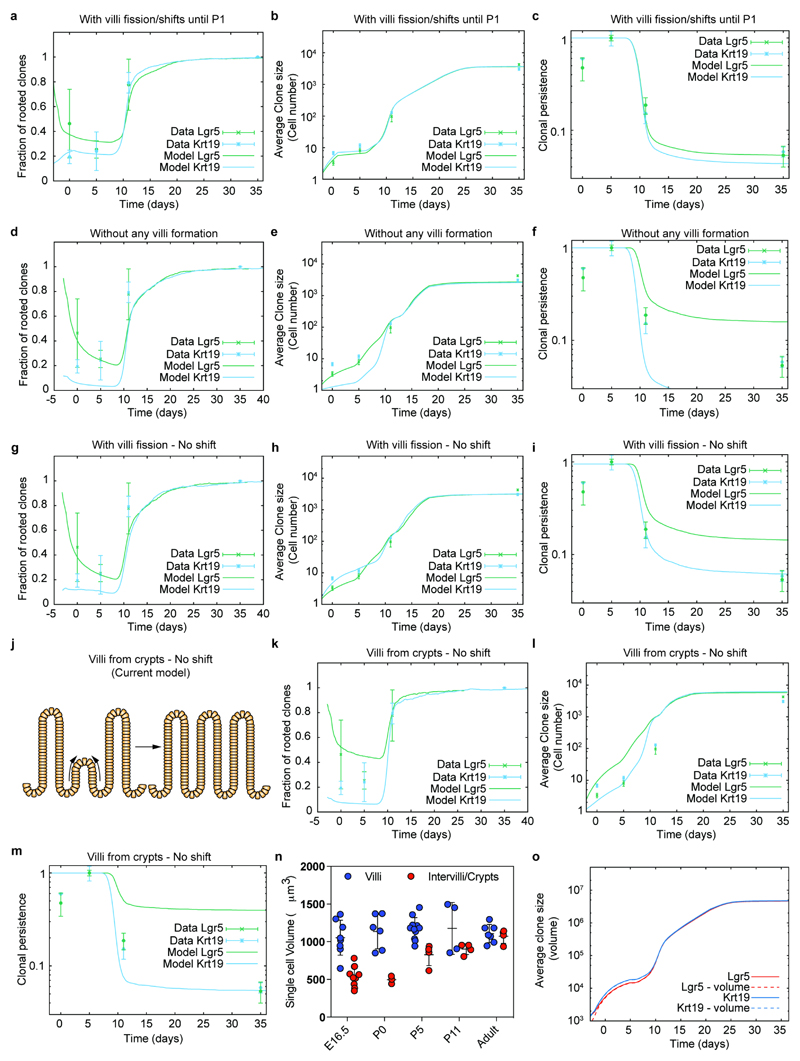
Extended Data Figure 7. Theoretical controls and sensitivity analysis.
a-c) Comparison between experimental data (dots and error bars) and theoretical predictions (thick lines) for the time evolution of the clonal rootedness (a), average clone size (b) and clonal persistence (c), both for the Krt19 (cyan) and the Lgr5 (green) tracings from E16.5. Here, the theoretical prediction corresponds to the case of villi fission, following exactly the same model in extended data Figure 6, but stopping at P1 instead of at P5. This shows that fetal fission is enough to explain the bulk of the equipotency between Lgr5 and Krt19 clones.
d-f) Comparison between experimental data (dots and error bars) and theoretical predictions (thick lines) for the time evolution of the clonal rootedness (d), average clone size (e) and clonal persistence (f), both for the Krt19 (cyan) and the Lgr5 (green) tracings from E16.5. Here, the theoretical prediction corresponds to the case of no new villi formation occurring, showing a very poor fit for the clonal persistence and size to the data. g-i) Comparison between experimental data (dots and error bars) and theoretical predictions (thick lines) for the time evolution of the clonal rootedness (g), average clone size (h) and clonal persistence (i), both for the Krt19 (cyan) and the Lgr5 (green) tracings from E16.5. Here, the theoretical prediction corresponds to the case of villi fission occurring as in the model of Figure 3, but without shift of cells upon villi fission (see schematics of Extended Data Figure 5), showing a very poor fit for the clonal persistence to the data.
j) Cartoon illustrating that current vilification model suggests that villi emerge from the intervillus region.
k-m) Comparison between experimental data (dots and error bars) and theoretical predictions (thick lines) for the time evolution of the clonal rootedness (k), average clone size (l) and clonal persistence (m), both for the Krt19 (cyan) and the Lgr5 (green) tracings from E16.5. Here, the theoretical prediction corresponds to the case of villi formation occurring only from existing crypts, showing a very poor fit for the clonal persistence to the data.
n) Single cell volume of villi cells and intervillus/crypts cells. Total E-Cadherin volume of villi and intervilli/crypts and subsequently divided by the number of DAPI positive nuclei to estimate the single cell volume. E16.5 villi n=8, E16.5 intervilli n=10, P0 villi n=6, P0 intervilli n=3, P5 villi n=11, P5 intervilli n=4, P11 villi n=4, P11 intervilli n=4, Adult villi n=7, Adult intervilli n=4 independent pictures were analyzed.
o) Sensitivity analysis on the influence of differential Lgr5- and Lgr5+ cellular volume on the model prediction (considering either that all cells have the same volume, continuous lines and panels a-n, or the differential volume measured at E16.5 in Supplementary theory note, dashed lines).
For panels a-i,k-m, P0 n=3, P5 n=3, P11 n=3, Adult n=6 independent samples were analyzed for Lgr5, P0 n=1; P5 n=3, P11 n=6, Adult n=3 independent samples for Krt19. Error bars indicate the mean±S.E.M.
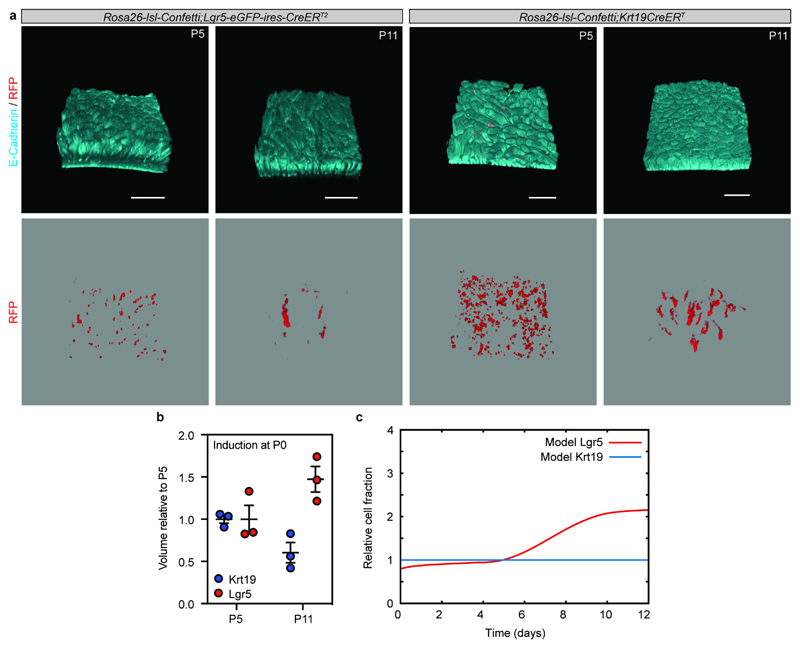
Extended Data Figure 8. Postnatal lineage tracing.
a) Detection of E-Cadherin (Cyan) and clones (Red) induced at P0 either randomly (Krt19CreERT) or in the intervillus region (Lgr5-eGFP-ires-CreERT2). Samples from 3 animals were analyzed per time point and representative images are shown.
b) Relative volume of clones (projected) induced either randomly (Krt19CreERT) or in the intervillus region (Lgr5-eGFP-ires-CreERT2) as assessed by quantitative clonal analysis following induction at P0. Samples from 3 animals were analyzed per time point and dots represent individual samples and lines indicate the mean±S.E.M.
c) Theoretical labelled cell fraction of the Lgr5 clones induced at P0, using the same model dynamics as the E16.5 induction. Expansion of the Lgr5 clones is represented by the thick red line, normalized by the Krt19 tracing (blue, indicative of global tissue growth), and normalized by its P5 value. This displays a net two-fold increase between P5 and P11, consistent with the results of the experimental P0 tracing.
Extended Data Figure 9. The contribution of Krt20 expressing cells during development and homeostasis.
a) Detection of Keratin 20 (Krt20, magenta), Lysozyme1 (Lyz1, red) and GFP (Lgr5-DTR-eGFP) in adult mouse intestine. Tissue is counterstained with DAPI (cyan). Representative picture of n=3 biologically independent samples is shown.
b) Detection of E-cadherin (E-cad, cyan), GFP (green) and RFP (red) in tissue whole mounts from the proximal part of the small intestine isolated from Rosa26-lsl-Confetti/Krt20-T2A-CreERT2 animals at 3- and 40-days post label induction with 4-hydroxytamoxifen. Samples from 3 animals were analyzed per time point and representative images are shown.
c) In situ hybridization of Lgr5 (Green) and Cre (Red) at E16.5 in proximal E16.5 small intestine. Tissue is counterstained with DAPI (cyan). Samples from 3 animals were analyzed per time point and representative images are shown.
d) Detection of E-cadherin (E-cad, cyan) and tdTomato (red) in tissue whole mounts from the proximal part of the small intestine isolated from Rosa26-lsl-tdTomato/Krt20-T2A-CreERT2 animals at E18.5 and adulthood following administration of 4-hydroxytamoxifen at E16.5. Representative pictures of n=2 samples are shown.
Extended Data Figure 10. Testing intestinal epithelial cells for equipotency.
a) Detection of Lgr5-eGFP (green) and CD44 (red) in the E16.5 small intestine isolated from Lgr5-eGFP-ires-CreERT2 E16.5 animals. Tissue was counterstained with DAPI (blue). Samples from 3 animals were analyzed and a representative image is shown Scale bars: 50μm.
b) Cartoon depicting the positions used to quantify the pattern of CD44 and Lgr5 expression. Quantifications of the localization of CD44 and Lgr5 positive cells. A total of 14 intervillus regions (x-axis) were quantified up to position +/- 10 (y-axis).
c-d) Representative FACS dot plot illustrating the gating strategy used to quantify CD44. Dots represent the quantification in individual animals (n=4).
e) Spheroids forming from cells isolated based on DAPInegEpCAMposLgr5-eGFPpos and DAPInegEpCAMposLgr5-eGFPneg from the proximal half of the small intestine from mice at E16.5. Representative pictures of n=3 biologically independent samples.
f) Quantification of spheroid seeding efficiency following isolation based on either CD44 or Lgr5 (n=3 animals per condition).
g-i) Gating strategy for purification of villus and intervillus cells for transplantation. The gating hierarchy of the panels is number i-vi (g), example of purity is indicated (h), mT/mG derived organoid is shown in (i). Spheroids were generated from a pool of n=6 biologically independent samples.
j-k) Outline for transplantation experiment. Briefly, experimental colitis was induced in RAG2-/- animals by administration of DSS in the drinking water. Organoids from the different cultures were subsequently infused into lumen of the animals (j) and engrafted regions were immunostained for lineage and stem cell markers depicted (k).
l) Scheme summarizing the main findings of this work.
Supplementary Material
Acknowledgement
We thank members of the Jensen and Simons lab for comments and suggestion; H. Clevers (Rosa26-lsl-Confetti and Lgr5-eGFP-iresCreERT2), F. de Sauvage (Lgr5-iDTR-eGFP) and G. Gu (Krt19-CreER) for gifts of mice; and Yasuko Antoku in Imaging core facilities at BRIC and the Center for Advanced Bioimaging at University of Copenhagen for experimental support. This work was supported by Lundbeck Foundation (R105-A9755 to KBJ; R190-2014-3904 to THP), the Novo Nordisk Foundation (NNF14OC0012927 to KBJ and NNF16OC0019920 to KK), the Carlsberg Foundation, EMBO Young Investigator programme (to KBJ), the Marie Curie fellowship programme (SY and JG; 625238/FP7-PEOPLE-2013-IIF, 656099/H2020-MSCA-IF-2014) and the Wellcome Trust (098357/Z/12/Z to BDS, 110326/Z/15/Z to EH). B.D.S also acknowledges funding from the Royal Society E.P. Abraham Research Professorship (RP\R1\180165). This project has received funding from the European Union’s Horizon 2020 research and innovation programme (grant agreements STEMHEALTH ERCCoG682665 and INTENS 668294 to KBJ). The Novo Nordisk Foundation Center for Stem Cell Biology and the Novo Nordisk Foundation Center for Basic Metabolic Research are supported by Novo Nordisk Foundation grants (NNF17CC0027852 and NNF18CC0034900, respectively).
Footnotes
Data availability
RNA sequencing data that support the findings of this study have been deposited in the ArrayExpress database at EMBL-EBI (www.ebi.ac.uk/arrayexpress) under accession number E-MTAB-7660. All other data supporting the findings of this study are available from the corresponding author on reasonable request. Code for the biophysical modelling is provided as a Supplementary file.
Author contribution
JG and KBJ conceived the project. JG, EH, BDS and KBJ designed experiments. JG, SY, SU and MM performed experiments. AJ, SP, LL, LSM, CYA, LLT, KJH, AL, RHO collected and processed human fetal material. SD, THP and KK analyzed single cell sequencing data. EH and BDS designed and performed the mathematical modeling. JG wrote the manuscript with input from KBJ, EH, and BDS; Funding Acquisition, JG, SY, BDS and KBJ; Supervision, BDS and KBJ.
Competing financial interests
The authors declare no competing financial interests.
References
- 1.Clevers H. The intestinal crypt, a prototype stem cell compartment. Cell. 2013;154:274–284. doi: 10.1016/j.cell.2013.07.004. [DOI] [PubMed] [Google Scholar]
- 2.Barker N, et al. Identification of stem cells in small intestine and colon by marker gene Lgr5. Nature. 2007;449:1003–1007. doi: 10.1038/nature06196. [DOI] [PubMed] [Google Scholar]
- 3.Shyer AE, Huycke TR, Lee C, Mahadevan L, Tabin CJ. Bending gradients: how the intestinal stem cell gets its home. Cell. 2015;161:569–580. doi: 10.1016/j.cell.2015.03.041. [DOI] [PMC free article] [PubMed] [Google Scholar]
- 4.Nigmatullina L, et al. Id2 controls specification of Lgr5+ intestinal stem cell progenitors during gut development. The EMBO journal. 2017;36:869–885. doi: 10.15252/embj.201694959. [DOI] [PMC free article] [PubMed] [Google Scholar]
- 5.Tetteh PW, et al. Replacement of Lost Lgr5-Positive Stem Cells through Plasticity of Their Enterocyte-Lineage Daughters. Cell stem cell. 2016;18:203–213. doi: 10.1016/j.stem.2016.01.001. [DOI] [PubMed] [Google Scholar]
- 6.van Es JH, et al. Dll1+ secretory progenitor cells revert to stem cells upon crypt damage. Nat Cell Biol. 2012;14:1099–1104. doi: 10.1038/ncb2581. [DOI] [PMC free article] [PubMed] [Google Scholar]
- 7.Buczacki SJ, et al. Intestinal label-retaining cells are secretory precursors expressing Lgr5. Nature. 2013;495:65–69. doi: 10.1038/nature11965. [DOI] [PubMed] [Google Scholar]
- 8.Yui S, et al. YAP/TAZ-Dependent Reprogramming of Colonic Epithelium Links ECM Remodeling to Tissue Regeneration. Cell stem cell. 2018;22:35–49 e37. doi: 10.1016/j.stem.2017.11.001. [DOI] [PMC free article] [PubMed] [Google Scholar]
- 9.Nusse YM, et al. Parasitic helminths induce fetal-like reversion in the intestinal stem cell niche. Nature. 2018;559:109–113. doi: 10.1038/s41586-018-0257-1. [DOI] [PMC free article] [PubMed] [Google Scholar]
- 10.Guiu J, Jensen KB. From Definitive Endoderm to Gut-a Process of Growth and Maturation. Stem Cells Dev. 2015;24:1972–1983. doi: 10.1089/scd.2015.0017. [DOI] [PubMed] [Google Scholar]
- 11.Sumigray KD, Terwilliger M, Lechler T. Morphogenesis and Compartmentalization of the Intestinal Crypt. Developmental cell. 2018;45:183–197 e185. doi: 10.1016/j.devcel.2018.03.024. [DOI] [PMC free article] [PubMed] [Google Scholar]
- 12.Mustata RC, et al. Identification of Lgr5-independent spheroid-generating progenitors of the mouse fetal intestinal epithelium. Cell Rep. 2013;5:421–432. doi: 10.1016/j.celrep.2013.09.005. [DOI] [PubMed] [Google Scholar]
- 13.Moor AE, et al. Spatial Reconstruction of Single Enterocytes Uncovers Broad Zonation along the Intestinal Villus Axis. Cell. 2018;175:1156–1167 e1115. doi: 10.1016/j.cell.2018.08.063. [DOI] [PubMed] [Google Scholar]
- 14.Merlos-Suarez A, et al. The intestinal stem cell signature identifies colorectal cancer stem cells and predicts disease relapse. Cell stem cell. 2011;8:511–524. doi: 10.1016/j.stem.2011.02.020. S1934-5909(11)00110-X [pii] [DOI] [PubMed] [Google Scholar]
- 15.Shyer AE, et al. Villification: how the gut gets its villi. Science. 2013;342:212–218. doi: 10.1126/science.1238842. [DOI] [PMC free article] [PubMed] [Google Scholar]
- 16.Walton KD, et al. Hedgehog-responsive mesenchymal clusters direct patterning and emergence of intestinal villi. Proceedings of the National Academy of Sciences of the United States of America. 2012;109:15817–15822. doi: 10.1073/pnas.1205669109. [DOI] [PMC free article] [PubMed] [Google Scholar]
- 17.Itzkovitz S, Blat IC, Jacks T, Clevers H, van Oudenaarden A. Optimality in the development of intestinal crypts. Cell. 2012;148:608–619. doi: 10.1016/j.cell.2011.12.025. S0092-8674(12)00012-8 [pii] [DOI] [PMC free article] [PubMed] [Google Scholar]
- 18.Sato T, et al. Single Lgr5 stem cells build crypt-villus structures in vitro without a mesenchymal niche. Nature. 2009;459:262–265. doi: 10.1038/nature07935. nature07935 [pii] [DOI] [PubMed] [Google Scholar]
- 19.Fordham RP, et al. Transplantation of expanded fetal intestinal progenitors contributes to colon regeneration after injury. Cell stem cell. 2013;13:734–744. doi: 10.1016/j.stem.2013.09.015. [DOI] [PMC free article] [PubMed] [Google Scholar]
- 20.Yui S, et al. Functional engraftment of colon epithelium expanded in vitro from a single adult Lgr5(+) stem cell. Nature medicine. 2012;18:618–623. doi: 10.1038/nm.2695. [DOI] [PubMed] [Google Scholar]
- 21.Ritsma L, et al. Intestinal crypt homeostasis revealed at single-stem-cell level by in vivo live imaging. Nature. 2014;507:362–365. doi: 10.1038/nature12972. [DOI] [PMC free article] [PubMed] [Google Scholar]
- 22.Tian H, et al. A reserve stem cell population in small intestine renders Lgr5-positive cells dispensable. Nature. 2011;478:255–259. doi: 10.1038/nature10408. [DOI] [PMC free article] [PubMed] [Google Scholar]
- 23.Chan CJ, Heisenberg CP, Hiiragi T. Coordination of Morphogenesis and Cell-Fate Specification in Development. Curr Biol. 2017;27:R1024–R1035. doi: 10.1016/j.cub.2017.07.010. [DOI] [PubMed] [Google Scholar]
- 24.Hannan NR, et al. Generation of multipotent foregut stem cells from human pluripotent stem cells. Stem Cell Reports. 2013;1:293–306. doi: 10.1016/j.stemcr.2013.09.003. [DOI] [PMC free article] [PubMed] [Google Scholar]
- 25.Spence JR, et al. Directed differentiation of human pluripotent stem cells into intestinal tissue in vitro. Nature. 2011;470:105–109. doi: 10.1038/nature09691. nature09691 [pii] [DOI] [PMC free article] [PubMed] [Google Scholar]
- 26.Watson CL, et al. An in vivo model of human small intestine using pluripotent stem cells. Nature medicine. 2014;20:1310–1314. doi: 10.1038/nm.3737. [DOI] [PMC free article] [PubMed] [Google Scholar]
- 27.Sun X, et al. Directed differentiation of human embryonic stem cells into thymic epithelial progenitor-like cells reconstitutes the thymic microenvironment in vivo. Cell stem cell. 2013;13:230–236. doi: 10.1016/j.stem.2013.06.014. [DOI] [PubMed] [Google Scholar]
- 28.McCracken KW, et al. Modelling human development and disease in pluripotent stem-cell-derived gastric organoids. Nature. 2014;516:400–404. doi: 10.1038/nature13863. [DOI] [PMC free article] [PubMed] [Google Scholar]
- 29.Kroon E, et al. Pancreatic endoderm derived from human embryonic stem cells generates glucose-responsive insulin-secreting cells in vivo. Nat Biotechnol. 2008;26:443–452. doi: 10.1038/nbt1393. [DOI] [PubMed] [Google Scholar]
- 30.Muzumdar MD, Tasic B, Miyamichi K, Li L, Luo L. A global double-fluorescent Cre reporter mouse. Genesis. 2007;45:593–605. doi: 10.1002/dvg.20335. [DOI] [PubMed] [Google Scholar]
- 31.Means AL, Xu Y, Zhao A, Ray KC, Gu G. A CK19(CreERT) knockin mouse line allows for conditional DNA recombination in epithelial cells in multiple endodermal organs. Genesis. 2008;46:318–323. doi: 10.1002/dvg.20397. [DOI] [PMC free article] [PubMed] [Google Scholar]
- 32.Snippert HJ, et al. Intestinal crypt homeostasis results from neutral competition between symmetrically dividing Lgr5 stem cells. Cell. 2010;143:134–144. doi: 10.1016/j.cell.2010.09.016. S0092-8674(10)01064-0 [pii] [DOI] [PubMed] [Google Scholar]
- 33.Madisen L, et al. A robust and high-throughput Cre reporting and characterization system for the whole mouse brain. Nat Neurosci. 2010;13:133–140. doi: 10.1038/nn.2467. [DOI] [PMC free article] [PubMed] [Google Scholar]
- 34.el Marjou F, et al. Tissue-specific and inducible Cre-mediated recombination in the gut epithelium. Genesis. 2004;39:186–193. doi: 10.1002/gene.20042. [DOI] [PubMed] [Google Scholar]
- 35.Walton KD, Kolterud A. Mouse fetal whole intestine culture system for ex vivo manipulation of signaling pathways and three-dimensional live imaging of villus development. J Vis Exp. 2014:e51817. doi: 10.3791/51817. [DOI] [PMC free article] [PubMed] [Google Scholar]
- 36.Zheng GX, et al. Massively parallel digital transcriptional profiling of single cells. Nature communications. 2017;8 doi: 10.1038/ncomms14049. 14049. [DOI] [PMC free article] [PubMed] [Google Scholar]
- 37.Fan J, et al. Characterizing transcriptional heterogeneity through pathway and gene set overdispersion analysis. Nature methods. 2016;13:241–244. doi: 10.1038/nmeth.3734. [DOI] [PMC free article] [PubMed] [Google Scholar]
- 38.Butler A, Hoffman P, Smibert P, Papalexi E, Satija R. Integrating single-cell transcriptomic data across different conditions, technologies, and species. Nature biotechnology. 2018;36:411–420. doi: 10.1038/nbt.4096. [DOI] [PMC free article] [PubMed] [Google Scholar]
Associated Data
This section collects any data citations, data availability statements, or supplementary materials included in this article.


