

Abstract
Background and Purpose
Non‐alcoholic fatty liver disease (NAFLD), including non‐alcoholic steatohepatitis, is closely related to metabolic diseases such as obesity and diabetes. Despite an accumulating number of studies, no pharmacotherapy that targets NAFLD has received general approval for clinical use.
Experimental Approach
Inhibition of the sodium‐glucose cotransporter 2 (SGLT2) is a promising approach to treat diabetes, obesity, and associated metabolic disorders. In this study, we investigated the effect of a novel SGLT2 inhibitor, NGI001, on NAFLD and obesity‐associated metabolic symptoms in high‐fat diet (HFD)‐induced obese mice.
Key Results
Delayed intervention with NGI001 protected against body weight gain, hyperglycaemia, hyperlipidaemia, and hyperinsulinaemia, compared with HFD alone. Adipocyte hypertrophy was prevented by administering NGI001. NGI001 inhibited impaired glucose metabolism and regulated the secretion of adipokines associated with insulin resistance. In addition, NGI001 supplementation suppressed hepatic lipid accumulation and inflammation but had little effect on kidney function. In‐depth investigations showed that NGI001 ameliorated fat deposition and increased AMPK phosphorylation, resulting in phosphorylation of its major downstream target, acetyl‐CoA carboxylase, in human hepatocyte HuS‐E/2 cells. This cascade ultimately led to the down‐regulation of downstream fatty acid synthesis‐related molecules and the up‐regulation of downstream β oxidation‐associated molecules. Surprisingly, NGI001 decreased gene and protein expression of SGLT1 and SGLT2 and glucose uptake in oleic acid‐treated HuS‐E/2 cells.
Conclusion and Implications
Our findings suggest the novel SGLT2 inhibitor, NGI001 has therapeutic potential to attenuate or delay the onset of diet‐induced metabolic diseases and NAFLD.
What is already known
The sodium‐glucose cotransporter 2 (SGLT2) is an emerging therapeutic target for diabetes and obesity.
What this study adds
The novel SGLT2 inhibitor NGI001 ameliorated diet‐induced metabolic dysfunction and non‐alcoholic fatty liver disease (NAFLD).
What is the clinical significance
We demonstrated the therapeutic potential of SGLT2 inhibitors to attenuate diet‐induced metabolic diseases and NAFLD.
Abbreviations
- ATGL
adipose TG lipase
- CPT1
carnitine palmitoyl transferase I
- CRE
creatinine
- FAS
fatty acid synthase
- GOT
glutamic oxaloacetic transaminase
- GPT
glutamic pyruvic transaminase
- H&E
haematoxylin and eosin
- HDLC
HDL cholesterol
- HFD
high‐fat diet
- NAFLD
nonalcoholic fatty liver disease
- NASH
nonalcoholic steatohepatitis
- OA
oleic acid
- PAI‐1
plasminogen activator inhibitor‐1
- SGLT2
sodium glucose cotransporter 2
- SREBP1
sterol regulatory element‐binding protein 1
- T2DM
Type 2 diabetes mellitus
- TC
total cholesterol
- TG
triglyceride
- UA
uric acid
1. INTRODUCTION
Non‐alcoholic fatty liver disease (NAFLD) used to be considered a benign and reversible disease and was neglected very often in the past decade, but its importance is being appreciated increasingly because of the continuously rising incidence worldwide of obesity and Type 2 diabetes mellitus (T2DM). NAFLD, which is closely related to metabolic syndrome and generally associated with central obesity, T2DM and dyslipidaemia, is a common chronic liver disease with a global morbidity up to 40% (Lu et al., 2018; Stepanova et al., 2013). A critical factor in the association between obesity, NAFLD, and diabetes is insulin resistance, a critical pathophysiological feature of NAFLD (Marchesini et al., 1999). Patients with NAFLD may develop severe liver disease, such as non‐alcoholic steatohepatitis (NASH), liver cirrhosis, and hepatocellular carcinoma (Tilg & Moschen, 2008). Among diabetic patients, NAFLD was found in over 70% and NASH in over 20%, indicating that patients with diabetes are at high risk for both NAFLD and NASH (Williams et al., 2011). However, guidelines for effective treatment have not been established, and there is no clinical treatment approved for NAFLD (Dixon et al., 1990). Therefore, developing effective drugs to treat NAFLD is imperative.
The various types of clinicallu used antidiabetic medications, based on the pathophysiological mechanisms underlying T2DM, may be divided into several categories, such as biguanides, dipeptidyl peptidase 4 inhibitors, https://www.guidetopharmacology.org/GRAC/ObjectDisplayForward?objectId=916) inhibitors, insulin, glucagon‐like peptide‐1 agonists, sulfonylureas, and thiazolidinediones (Chaudhury et al., 2017; Defronzo, 2009). Among them, the SGLT2 inhibitors constitute a new class of oral glucose‐lowering agents and include https://www.guidetopharmacology.org/GRAC/LigandDisplayForward?ligandId=4582, https://www.guidetopharmacology.org/GRAC/LigandDisplayForward?ligandId=4594, and https://www.guidetopharmacology.org/GRAC/LigandDisplayForward?ligandId=4754 (Chaudhury et al., 2017). The unique insulin‐independent mechanism of SGLT2 inhibitors eliminates glucose from the urine by blocking glucose reabsorption in the proximal renal tubule, thereby efficiently reducing blood glucose levels in patients with T2DM (Riser Taylor & Harris, 2013). In addition to improving glucose‐related parameters, SGLT2 inhibitors have shown additional benefits, including reduction of body weight, lowering of BP, and improving cardiovascular outcomes (Davies et al., 2018; Maliha & Townsend, 2015; Zinman et al., 2015). Nevertheless, only <50% of glucose can be excreted via the urine, perhaps because inhibition of SGLT2 forces glucose reabsorption by https://www.guidetopharmacology.org/GRAC/ObjectDisplayForward?objectId=915 (Liu, Lee, & DeFronzo, 2012). Accordingly, novel and safer SGLT2 inhibitors are sought, with partial inhibition of SGLT1, without gastrointestinal side effects.
In our previous study, a series of acetylamino‐containing N‐glucosyl indole derivatives were synthesized, and their inhibitory potency against human SGLT2 was demonstrated (Chu et al., 2016). That study showed that the C6‐modified N‐glucosyl indoles play a vital role in SGLT2 suppression. Among many structural modifications, compound 6a (1‐[6‐(acetylamino)‐6‐deoxy‐β‐D‐glucopyranosyl]‐4‐chloro‐3‐(4‐cyclopropylbenzyl)‐1H‐indole), named NGI001, showed the highest inhibitory activity against SGLT2 and moderate selectivity over SGLT1. In the present study, we investigated the effects of delayed NGI001 intervention on NAFLD and metabolic symptoms in a high‐fat diet (HFD)‐induced obese mouse model, and in a cell model of human fatty livers, using the HuS‐E/2 immortalized human primary hepatocytes we had established previously (Liu et al., 2015). By delaying NGI001 treatment until 8 weeks after the start of HFD feeding, we mimicked the clinical situation of obesity in which metabolic dysfunction has already developed. This delayed intervention enables us to investigate the ability of NGI001 to treat NAFLD and obesity‐associated complications, rather than to prevent them.
2. METHODS
2.1. Animals
Animal care and experimental protocols complied with The Guide for the Care and Use of Laboratory Animals (NIH publication, 85–23, revised 1996) and the guidelines of the Animal Welfare Act, Taiwan and were approved by the Animal Research Committee of the National Research Institute of Chinese Medicine. Animal studies are reported in compliance with the ARRIVE guidelines (Kilkenny, Browne, Cuthill, Emerson, & Altman, 2010) and with the recommendations made by the British Journal of Pharmacology.
Four‐week‐old male C57BL/6J mice (RRID:IMSR_JAX:000664) were purchased from The National Laboratory Animal Center, Taipei, Taiwan, and were maintained in a temperature‐controlled room on a 12‐hr light–dark cycle at the Animal Center of the National Research Institute of Chinese Medicine (IACUC no.106‐520‐1), Taipei, Taiwan. They were housed with four per cage and had free access to food and drinking water. Mice fed with a standard diet and adapted to the environment for 1 week were subsequently divided randomly into five groups. The ND group (n = 12) continued on the same diet, whereas the other four groups (n = 12 per group) were switched to the HFD (494 kcal/100 g, 45% energy as fat; TestDiet Inc., USA) for 8 weeks to become obese. Then the four groups continued on an HFD (HFD group) for a further 4 weeks. During these 4 weeks, three groups started to receive drug NGI001 at 15 mg·kg−1·day−1 (NGI001‐15 group), drug NGI001 at 30 mg·kg−1·day−1 (NGI001‐30 group), and dapagliflozin at 30 mg·kg−1·day−1 (Dapa‐30 group) by oral gavage. Food consumption and weight gain were measured daily and weekly, respectively. At the end of the experimental period, all mice were killed. Serum samples, liver tissue, epididymis adipose tissue, and faeces were collected for further analysis.
2.2. Immunohistochemical characterization of tissue samples
The antibody‐based procedures used in this study comply with the recommendations made by the British Journal of Pharmacology (Alexander et al., 2018). At the end of the experiment (see above), epididymal adipose tissue and liver were dissected from the mice, isolated, weighed, and subsequently fixed in 10% paraformaldehyde in PBS. After overnight fixation, tissues were embedded in paraffin for haematoxylin and eosin (H&E) staining or with Oil Red O staining. Immunohistochemical (IHC) staining was carried out using the Dako REAL™ EnVision™ Detection System (Agilent, USA), according to the manufacturer's instructions. After blocking endogenous peroxides and proteins, the tissues were incubated with primary antibodies specific for SGLT1 (Invitrogen, USA, 1:100) or SGLT2 (Abcam, USA, 1:100) overnight at 4°C. Then the sections were stained with a 3,3′‐diaminobenzidine solution for 3 min and counterstained with haematoxylin. All specimens were observed microscopically (Carl Zeiss Inc., Germany) at 200× magnification.
2.3. Biochemical characterization
The serum triglyceride (TG), total cholesterol (TC), HDL cholesterol (HDLC), glutamic oxaloacetic transaminase (GOT), glutamic pyruvic transaminase (GPT), LDH, total bilirubin, albumin, γ‐glutamyltransferase, uric acid (UA), creatinine (CRE), and lipase levels were measured using enzymic assay kits with a FUJI DRI‐CHEM analyser (Fujifilm, Tokyo, Japan). Resistin, adiponectin, leptin, plasminogen activator inhibitor‐1 (PAI‐1), and glucagon levels were measured by multiplex assay (Yu Shing Bio‐Tech Co., Taiwan). The LDL cholesterol concentration was subsequently calculated using the Friedewald equation, as follows: TC − (HDLC + TG/5) (Friedewald, Levy, & Fredrickson, 1972).
2.4. TG and cholesterol analysis of liver tissue and faeces
For TG and cholesterol determinations, mouse liver tissues or faeces were extracted and analysed using TG and cholesterol quantitation assay kits (Abcam, UK), respectively, according to the manufacturer's instruction.
2.5. Blood glucose, serum insulin, the homeostasis model assessment of insulin resistance index, and intraperitoneal glucose tolerance test
After a 16‐hr overnight fasting period, whole‐blood glucose was measured with a glucose analyser (EASYTOUCH, Taiwan). An enzymic assay was used to measure the serum insulin concentration (Cisbio, USA). The homeostasis model assessment of insulin resistance was calculated as [fasting insulin concentration (mU·L−1) × fasting glucose concentration (mg·dl−1) × 0.05551]/22.5. Intraperitoneal glucose tolerance tests were performed in all mice 12 weeks after the start of the study. Mice fasted for 16 hr were injected intraperitoneally with glucose 1.0 g·kg−1 body weight; blood glucose levels were measured in tail vain blood at 0, 30, 60, 90, 120, and 150 min.
2.6. Cell culture and cell viability assay
HuS‐E/2 cells, kindly provided by Dr. Shimotohno (Kyoto University, Japan), were maintained as described previously in primary hepatocyte medium as described previously (Aly et al., 2007). For cell viability assay, cells were treated with various doses of NGI001 or dapagliflozin for 24 hr, and cell viability was determined using MTT [3‐(4,5‐dimethylthiazol‐2‐yl)‐2,5‐diphenyl tetrazolium bromide] assays. Briefly, MTT‐formazan crystals were formed in metabolically viable cells and were dissolved in 100 μl of DMSO for spectrophotometric determinations at a wavelength of 570 nm. To simulate fatty liver disease model, HuS‐E/2 cells at 70% confluence were incubated with 0.1‐mM oleic acid (OA) for 18 hr.
2.7. Quantitative real‐time PCR
Real‐time PCR (RT‐PCR) was performed as described previously (Huang et al., 2014). In brief, total mRNA was extracted from HuS‐E/2 cells using TRIzol reagent (Ambion, USA) and then reverse‐transcribed into cDNA using a Deoxy RT kit (Yeastern Biotech., Taiwan). Quantitative real‐time PCR (qPCR) was performed with SYBR Green PCR Master Mix (Applied Biosystems, USA), and the mRNA expression of the genes of interest was normalized to that of GAPDH. The primer pairs used in this study are listed in Table S1. Relative expression levels were calculated using the ΔΔCt method. Expression of mRNA was normalized to the average of the untreated control and, as is standard practice for qPCR data, expressed as relative fold change. Untreated control samples retained their individual fold change. For qPCR experiments, a one‐way ANOVA with Tukey's post hoc test was performed to compare relative fold change between treatment groups.
2.8. Antibodies and western blot analysis
Antibodies against AMPK, ACC, pACC (Ser 79), adipose TG lipase (ATGL), carnitine palmitoyl transferase I (CPT1), https://www.guidetopharmacology.org/GRAC/ObjectDisplayForward?objectId=2608 sterol regulatory element‐binding protein 1c (SREBP‐1c), and tubulin were obtained from Genetex, Taiwan. The anti‐phospho‐AMPK (Thr172) antibodies were from Cell Signaling, USA, the anti‐SGLT1 antibodies were from Invitrogen, USA, and the anti‐SGLT2 antibodies were from Abcam, USA. HRP‐conjugated secondary antibodies were from Jackson ImmunoResearch Laboratories, Inc., USA. For western blot analysis, HuS‐E/2 cells were harvested in RIPA (50‐mM Tris–HCl, pH 7.4, 1‐mM EDTA, 150‐mM NaCl, 1% Nonidet P‐40, 1% DOC, and 0.1% SDS), and the samples were sonicated three times with 12‐V breaks and centrifuged at 13,800 x g for 10 min at 4°C. The protein concentrations of the supernatants were determined using a BSA, and equal amounts of total cellular protein (50 mg) were resolved by SDS‐PAGE, transferred to a PVDF membrane, followed by blocking with 6% milk, incubation with primary antibody overnight at 4°C, and a secondary antibody at room temperature for 1 hr, and then bound antibody was visualized using enhanced chemiluminescence kits (Advansta, USA).
2.9. Measurement of 2‐NBDG uptake
The fluorescent glucose derivative, 2‐deoxy‐2‐[(7‐nitro‐2,1,3‐benzoxadiazol‐4‐yl)amino]‐D‐glucose (2‐NBDG) was used to assay glucose uptake by HuS‐E/2 cells. HuS‐E/2 cells were plated at 96‐well plates and used at subconfluence after 24 hr preincubation. Then cells were treated with indicated concentration of OA, NGI001, or dapagliflozin for 16 hr. Culture medium was removed from each well, and the cells were rinsed in sodium buffer (Na+ buffer; 140‐mM NaCl, 5‐mM KCl, 2.5‐mM CaCl2, 1‐mM MgSO4, 1‐mM KH2PO4, and 10‐mM HEPES, pH 7.4). HuS‐E/2 cells were then incubated in 100 μl of Na+ buffer in the absence or presence of 2‐NBDG at 37°C with 5% CO2 for 10 min, followed by removing the incubation medium and washing the cells with pre‐cooled Na+ buffer. To image the signal of 2‐NBDG uptake, fluorescence microscope (Olympus IX83) was used with the filters set for 488‐nm excitation and 545‐nm emission. (RRID:SCR_002368).
2.10. Data and statistical analysis
The data and statistical analysis comply with the recommendations of the British Journal of Pharmacology on experimental design and analysis in pharmacology (Curtis et al., 2018). Randomization was used to assign samples to the experimental groups and treatment conditions for all in vivo studies. Data collection and evaluation of all in vivo and in vitro experiments were performed in a blinded manner. Data obtained from all experiments are shown as means ± SEM. GraphPad Prism 6.01 software (GraphPad, CA, USA; GraphPad Prism, RRID:SCR_002798) was used to handle these data, and only when a minimum of n = 5 independent samples was acquired. Among them, some data were normalized to control unwanted sources of variation, as follows. First, the data was normalized to bring all of the variation into proportion with one another after removing the outliers. Then the coefficients associated with each variable will scale appropriately to adjust for the disparity in the variable sizes. The number of animals in each group included for statistical tests is shown in the figure legend for analysis. Data normalization was performed to control for sources of variation of baseline parameters. Data sets that involved more than two groups were assessed by ANOVA using Tukey's post hoc tests (only in those tests where F achieved the necessary level of statistical significance, P < .05), and there was no significant variance inhomogeneity. Differences were considered significant when P < .05. The size of these groups was decided by considering the accuracy and reproducibility of the detection method as well as the biological parameters involved. Effect sizes were estimated as odds ratios with corresponding 95% confidence intervals to quantify the precision of the estimated effects. Each group size is the number of independent values, and that statistical analysis was done using these independent values.
2.11. Materials
NGI001 was synthesized as reported previously (Chu et al., 2016). Dapagliflozin was purchased from Combi‐Blocks, Inc., USA. 2‐NBDG was purchased from Sigma (USA). Compounds were suspended in 0.5% methylcellulose solution for oral administration.
2.12. Nomenclature of targets and ligands
Key protein targets and ligands in this article are hyperlinked to corresponding entries in http://www.guidetopharmacology.org, the common portal for data from the IUPHAR/BPS Guide to PHARMACOLOGY (Harding et al., 2018), and are permanently archived in the Concise Guide to PHARMACOLOGY 2017/18 (Alexander, Cidlowski et al., 2017; Alexander, Fabbro et al., 2017; Alexander, Kelly et al., 2017).
3. RESULTS
3.1. Delayed intervention with NGI001 prevented body weight gain and improved the food efficiency ratio in HFD‐induced obese mice
A series of acetylamino‐containing N‐glucosyl indole derivatives were synthesized, and their inhibitory potency against human SGLT2 was investigated (Chu et al., 2016). A novel SGLT2 inhibitor, NGI001 (Figure 1a), showed the highest inhibitory activity against SGLT2 and moderate selectivity over SGLT1. To determine the effect of NGI001 on obesity and NAFLD in vivo, we established an experimental model of HFD‐induced obese C57BL/6J mice (Figure 1b). Eight weeks of HFD feeding resulted in significantly increased body weight and food efficiency ratio compared with ND control mice (Figure 1d,f). Thus, when we started NGI001 intervention after the first 8 weeks, the metabolic function of the HFD mice was already impaired. The clinical agent dapagliflozin was used as a control. The waistline of the HFD group was larger than the ND group but was not larger after oral administration of NGI001 or dapagliflozin for 4 weeks (Figure 1c). NGI001 or dapagliflozin significantly prevented body weight gain (Figure 1d). Furthermore, the food efficiency ratio of the NGI001 and dapagliflozin groups was greatly reduced, with almost equal food intake, compared with the HFD group (Figure 1e,f). These data demonstrated a lower body weight gain when eating the same amount of food, after NGI001 or dapagliflozin treatment.
Figure 1.
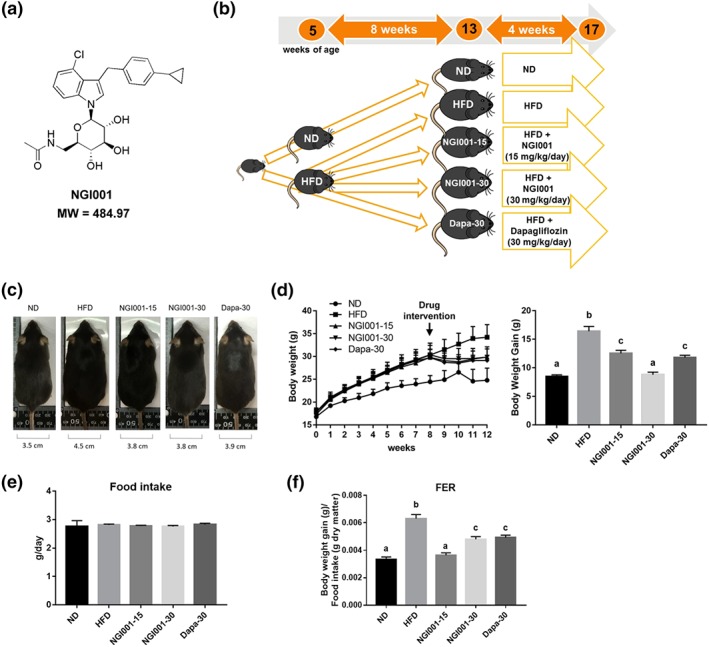
The experimental approach using NGI001 and the effect of NGI001 on morphology, body weight gain, food intake, and food efficiency ratio in HFD‐induced obese mice. (a) The structure of NGI001. (b) The experimental approach. The 5‐week‐old C57BL/6 male mice were fed a normal diet (ND) or high‐fat diet (HFD) for 8 weeks. After that, the ND group continued receiving an ND, and the HFD group either continued on that diet or were administered NGI001 (15 or 30 mg·kg−1·day−1) or dapagliflozin (Dapa; 30 mg·kg−1·day−1), in addition, by oral gavage for a further 4 weeks. At 17 weeks of age, the mice were killed, and the follow‐up analysis was conducted. (c) Changes in body shape and the waistline. (d) Body weight gain during the study. (e) Food intake. (f) Food efficiency ratio (FER). Data are shown as means ± SEM (n = 12 per group). In the graphs, bars labelled with different letters (a, b, c) indicate significant (P < .05) differences between them; bars with the same letter indicate no significant (P > .05) difference; one‐way ANOVA with Tukey's post hoc tests
3.2. Adipose tissue hypertrophy and dyslipidaemia were ameliorated in HFD‐induced obese mice after NGI001 intervention
A well‐known feature of metabolic syndrome is increase of lipid accumulation in the trunk region, which causes excessive visceral fat deposition (Mizuno, 2018). In order to confirm that the rising body weight gain was truly an increase of fat mass, we isolated the epididymal white adipose tissue from the mice. H&E staining of the paraffin sections demonstrated that the adipocytes were greater in size in the HFD group than the ND group but the sizes of the adipocytes after NGI001 or dapagliflozin administration were similar to those in the ND group (Figure 2a). As shown in Figure 2b, the HFD‐induced increase in the mass of epididymal white adipose tissue was ameliorated by NGI001 or dapagliflozin intervention. In addition, we found that, compared with the adipocytes from the HFD group, the NGI001 and dapagliflozin groups had lower cell diameters and smaller cell size (Figure 2c). The level of serum TG and TC in the HFD group was significantly higher than the ND group (Figure 2d,e). After treatment with NGI001 or dapagliflozin, the level of serum TG and TC was significantly lower than in the HFD group. However, treatment with NGI001 was more effective in preventing the increased concentration of serum TG, than that with dapagliflozin, and NGI001 at 15 mg·kg−1 maintained the serum TG at almost the same level as the ND group. The level of HDLC did not differ significantly from the HFD group after NGI001 or dapagliflozin intervention (Figure 2f). The level of LDL cholesterol was also significantly higher in the HFD group than the ND group, but this was somewhat ameliorated by two different doses of NGI001 or dapagliflozin supplementation (Figure 2g). This suggests that NGI001 may decrease fat deposition and inhibit hypertriglyceridaemia and high cholesterol levels in the HFD mouse model.
Figure 2.
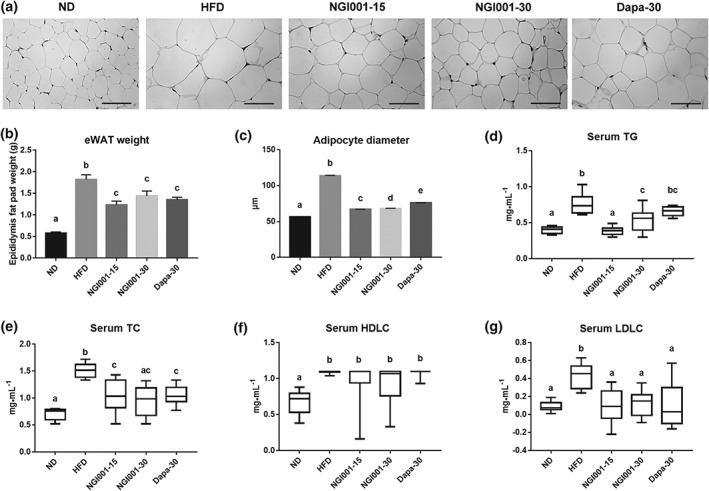
The effect of NGI001 on fat deposition and serum lipid levels in HFD‐induced obese mice. (a) H&E staining of adipocytes in the epididymal white adipose tissue (eWAT). (b) The weight of eWAT. (c) The adipocyte diameters. The level of serum (d) TG, (e) TC, (f) HDLC, and (g) LDL cholesterol (LDLC). The scale bar is 100 μM. Data are shown as means ± SEM (n = 10 per group) or as box plots of raw data showing median, inter quartile range, and whiskers identifying minimum and maximum values. In the graphs, bars labelled with different letters (a, b, c) indicate significant (P < .05) differences between them; bars with the same letter indicate no significant (P > .05) difference; one‐way ANOVA with Tukey's post hoc tests. In the case where two letters are present above the bars, each letter should be compared separately with the letters of the other bars to determine whether the results show statistically significant differences
3.3. NGI001 improved glucose homeostasis and insulin resistance in HFD‐induced obese mice
NAFLD is closely associated with insulin resistance, as 70–80% of obese and diabetic patients have NAFLD (Loomba et al., 2012; Williams et al., 2011). First, we measured the fasting blood glucose, which has a direct relationship with impaired insulin sensitivity. The fasting blood glucose was significantly higher at the 12th week in HFD group, compared to the ND group, but this was prevented in the NGI001‐15, NGI001‐30, and Dapa‐30 groups, by treatment for the last 4 weeks (Figure 3a). Consistent with these findings, the intraperitoneal glucose tolerance test showed that the glucose tolerance was substantially higher in the HFD mice than the ND mice but markedly lower in the NGI001 mice than the HFD mice (Figure 3b). Interestingly, the effect of NGI001 on glucose tolerance was better than dapagliflozin. We next measured fasting insulin directly. The fasting insulin was significantly increased by feeding an HFD, representing a decrease in insulin sensitivity, and that effect was ameliorated by NGI001 or dapagliflozin treatment (Figure 3c). The higher level of homeostasis model assessment of insulin resistance in HFD‐induced obese mice was also improved by drug treatment (Figure 3d).
Figure 3.
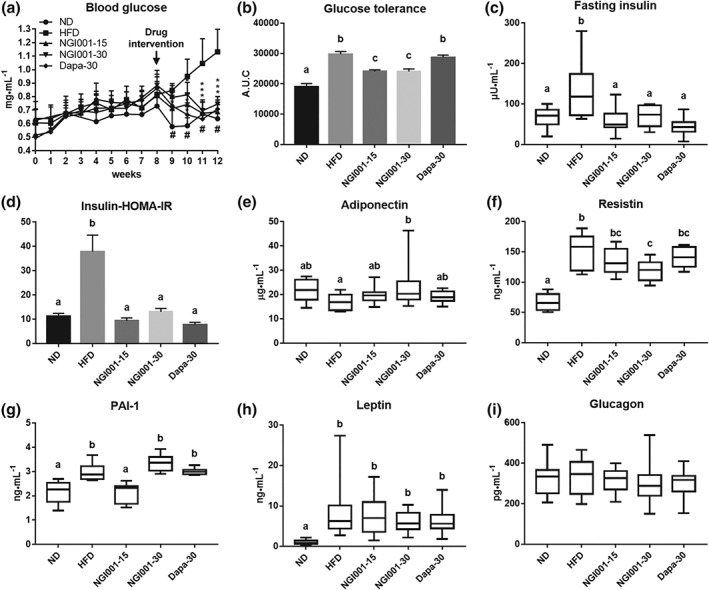
The effect of NGI001 on glucose metabolism and insulin resistance in HFD‐induced obese mice. (a) Fasting blood glucose levels after 4 weeks of drug intervention. (b) AUC of intraperitoneal glucose tolerance test. (c) Serum insulin levels after 16 hr of fasting. (d) The homeostasis model assessment of insulin resistance (HOMA‐IR) index calculated using fasting blood glucose and insulin levels. The levels of insulin resistance related adipokines (e) adiponectin, (f) resistin, (g) PAI‐1, and (h) leptin. The level of the insulin related hormone glucagon from the pancreas (i). Data are shown as means ± SEM (n = 10 per group) or as box plots of raw data showing median, inter quartile range, and whiskers identifying minimum and maximum values. * P < .05, HFD versus drug. # P<.05, HFD versus ND. In the graphs, bars labelled with different letters (a, b, c) indicate significant (P < .05) differences between them; bars with the same letter indicate no significant (P > .05) difference; one‐way ANOVA with Tukey's post hoc tests. Where two letters are present above the bars, each letter should be compared separately with the letters of the other bars to determine whether the results show statistically significant differences
As there is crosstalk between obesity, NAFLD, and T2DM, several adipokines have been associated with the development of insulin resistance (Knights, Funnell, Pearson, Crossley, & Bell‐Anderson, 2014). https://www.guidetopharmacology.org/GRAC/LigandDisplayForward?ligandId=3726 enhanced hepatic insulin action and adiponectin production and its concentration decrease in obesity (Tilg & Hotamisligil, 2006). Resistin induces resistance to the action of insulin (Steppan & Lazar, 2004). As shown in Figure 3e, the level of adiponectin was significantly higher in the NGI001‐30 mice than the HFD‐induced obese mice. There was a marked increase of resistin in HFD‐induced obese mice and that was mostly prevented by NGI001 at 30 mg·kg−1 (Figure 3f). Moreover, several studies have demonstrated elevated PAI‐1 levels in conditions associated with insulin resistance (Bastard, Pieroni, & Hainque, 2000). In our model, the highly elevated level of PAI‐1 in HFD mice was prevented by NGI001 at 15 mg·kg−1 (Figure 3g), whereas there was little effect on adiponectin, resistin, and PAI‐1 was observed in the dapagliflozin group. The important role of https://www.guidetopharmacology.org/GRAC/LigandDisplayForward?ligandId=5015 is controlling the appetite to regulate body weight. Feeding an HFD substantially increased the level of leptin, and there was no significant change after drug supplementation (Figure 3h). We also investigated the level of https://www.guidetopharmacology.org/GRAC/LigandDisplayForward?ligandId=1136 acting as a counter regulatory hormone to insulin, and no significant difference was observed among the groups (Figure 3i). Taken together, these data suggest that NGI001 improved HFD‐induced glucose homeostasis and insulin sensitivity.
3.4. NGI001 ameliorated the severity of NAFLD in HFD‐induced obese mice
One of the distinctive characteristics of metabolic syndrome is NAFLD, which is characterized by TG accumulation in the hepatocytes (Asrih & Jornayvaz, 2015; Williams, 2015). To examine the effect of NGI001 on lipid deposition in liver, we weighed the livers and measured the hepatic TG and cholesterol levels in the mice. The liver weights of the NGI001 groups were significantly lower than HFD group after treatment for 4 weeks (Figure 4a). Moreover, there was no difference among the groups in terms of the amount of hepatic cholesterol (Figure 4c). However, the level of hepatic TG was higher after feeding an HFD but much less so after NGI001 or dapagliflozin treatment (Figure 4b). H&E and Oil Red O staining showed considerable lipid deposition in the liver tissue in the HFD group, whereas lipid accumulation was greatly diminished by treatment with NGI001 or dapagliflozin (Figure 4d). Next, we investigated markers of hepatic lipotoxicity related to liver inflammation, including GOT/aspartate transaminase and GPT/alanine transaminase (Cassidy & Reynolds, 1994; Dufour et al., 2000). The levels of serum GOT and GPT were higher in HFD mice, but these high levels were significantly lower in mice treated with NGI001 (30 mg·kg−1), indicating an amelioration of liver inflammation (Figure 4e,f). Furthermore, in conjunction with detection of other clinical biochemical markers produced by the liver, albumin, LDH, total bilirubin, and γ‐glutamyltransferase did not differ among the groups (Figure 4g–j). These results suggest that the severity of diet‐induced NAFLD was ameliorated in NGI001‐treated mice.
Figure 4.
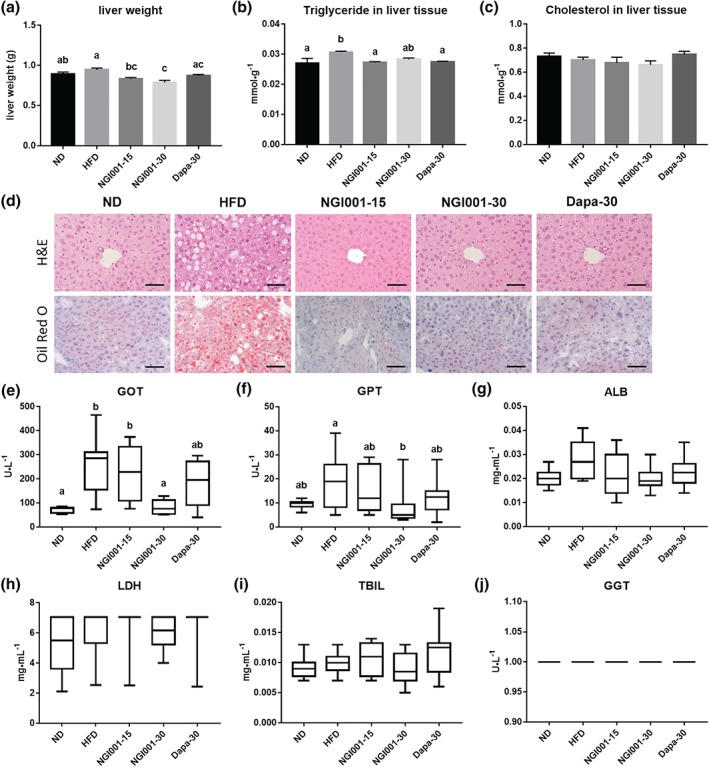
The effect of NGI001 on fat deposition and inflammation in the livers of HFD‐induced obese mice. (a) Liver weight. (b) Hepatic triglyceride level. (c) Hepatic cholesterol level. (d) H&E staining and Oil Red O staining of transverse liver sections (original magnification of 200×). Serum levels of the hepatic inflammation markers (e) glutamic oxaloacetic transaminase (GOT) and (f) glutamic pyruvic transaminase (GPT). The serum levels of the liver biochemical markers (g) albumin (ALB), (h) LDH, (i) total bilirubin (TBIL), and (j) γ‐glutamyltransferase (GGT). The scale bar is 100 μM. Data are shown as means ± SEM (n = 10 per group) or as box plots of raw data showing median, inter quartile range, and whiskers identifying minimum and maximum values. or as box plots of raw data showing median, inter quartile range, and whiskers identifying minimum and maximum values. In the graphs, bars labelled with different letters (a, b, c) indicate significant (P < .05) differences between them; bars with the same letter indicate no significant (P > .05) difference; one‐way ANOVA with Tukey's post hoc tests. Where two letters are present above the bars, each letter should be compared separately with the letters of the other bars to determine whether the results show statistically significant differences
3.5. NGI001 was less likely to cause renal impairment and promoted TG and cholesterol excretion via the faeces
We studied the common biochemical indices of renal function, including CRE and UA. There was no increase in CRE level after NGI001 treatment (Figure 5a). On the other hand, the level of UA was higher in the HFD group not after treatment with NGI001 (30 mg·kg−1) as shown in Figure 5b. We investigated whether NGI001 treatment was a risk of damaging other organs. Lipase is used clinically as a biochemical marker of pancreatic inflammation and its level was not higher in the HFD group or drug‐treated groups than the ND group (Figure 5c). Furthermore, the lipid content of the faeces was analysed to investigate the effect of NGI001 on the excretion of lipid through the intestine. Intriguingly, compared to the HFD group, the TG levels in the feces were significantly higher after treatment with NGI001 at both 15 and 30 mg·kg−1 (Figure 5d), and the TC levels in the faeces were substantially higher after the higher dose of NGI001 (Figure 5e). These results show NGI001 was not harmful to the kidneys and pancreas, and there was an effect of NGI001 on lipid excretion in the feces.
Figure 5.
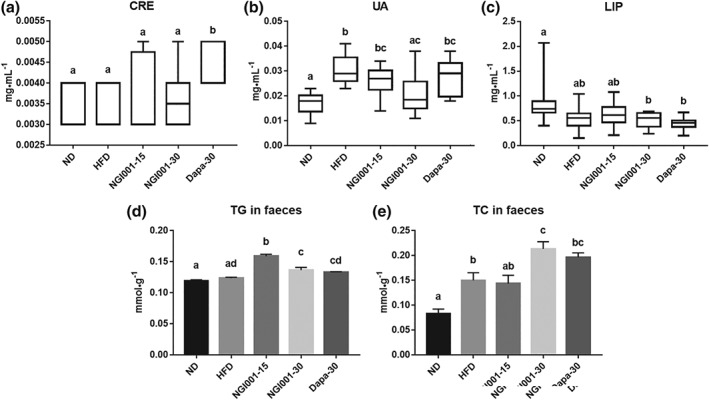
The effect of NGI001 on renal and pancreatic function and excretion of triglyceride and cholesterol in the feces of HFD‐induced obese mice. The serum levels of the kidney function markers (a) creatinine (CRE) and (b) uric acid (UA). The serum levels of the pancreatic inflammation marker (c) lipase (LIP). The levels of (d) triglyceride and (e) cholesterol in the feces. Data are shown as box plots of raw data showing median, inter quartile range, and whiskers identifying minimum and maximum values or means ± SEM (n = 12 per group). In the graphs, bars labelled with different letters (a, b, c) indicate significant (P < .05) differences between them; bars with the same letter indicate no significant (P > .05) difference; one‐way ANOVA with Tukey's post hoc tests. Where two letters are present above the bars, each letter should be compared separately with the letters of the other bars to determine whether the results show statistically significant differences
3.6. NGI001 alleviated fat droplet accumulation by blocking lipogenesis and promoting fatty acid β oxidation in a cell model of human fatty liver
Accumulation of TG is commonly observed in the hepatocytes in fatty liver diseases (Zambo et al., 2013). To determine the effects of NGI001 on lipid deposition in liver cells, we used immortalized human primary HuS‐E/2 hepatocytes as a cell model of human fatty liver (Liu et al., 2015). To determine the appropriate concentration of the drugs without cytotoxicity, a cell viability assay was performed with 0–200 μM of NGI001 or dapagliflozin for 24 hr. NGI001 and dapagliflozin concentrations of 10 and 20 μM had no significant effect on cell viability (Figure 6a). Therefore, we used NGI001 at 10 and 20 μM in subsequent studies. To induce cellular lipid accumulation, HuS‐E/2 cells were incubated in medium containing 0.1‐mM OA, with or without NGI001 or dapagliflozin. Intracellular lipid accumulation was measured using Oil Red O staining, showing significantly increased lipid content following the OA treatment, compared with the nontreated (NT) group (Figure 6b). The amount of lipid droplets was dramatically lower after NGI001 and dapagliflozin treatment. Following treatment with NGI001 at 20 μM, the lipid content of the HuS‐E/2 cells was about 45% of that of the OA group. This was confirmed by the microscopic analysis, which showed numerous fat granules in the OA group, compared to the NT group, and the accumulation of fat droplets was significantly less after treatment with NGI001 and dapagliflozin, compared with the OA group (Figure 6c). NGI001 showed a stronger inhibitory effect on lipid accumulation than dapagliflozin in HuS‐E/2 cells.
Figure 6.
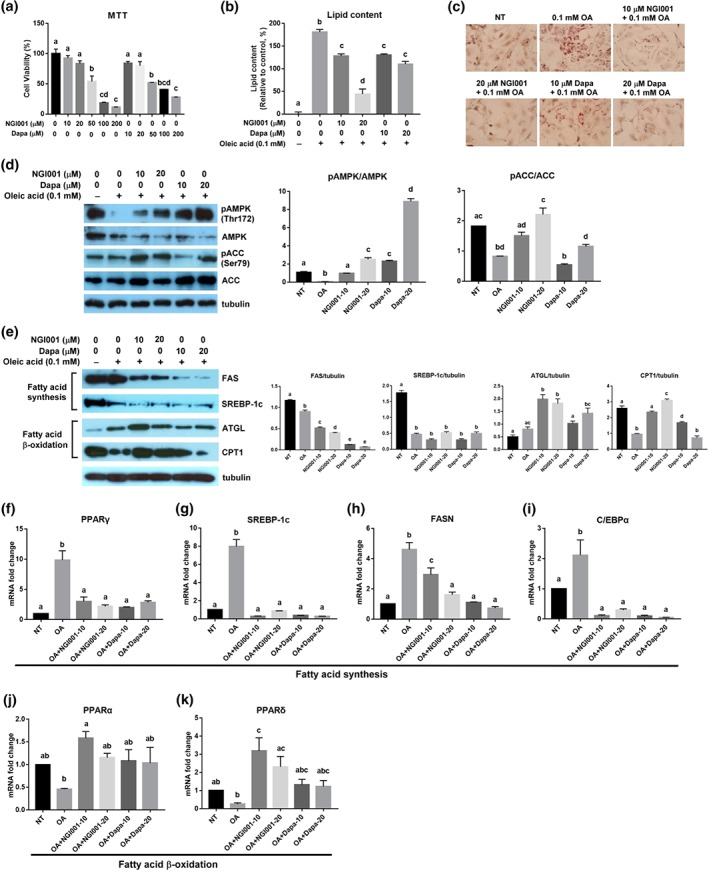
The effect of NGI001 on OA‐induced lipid accumulation, lipogenesis, and fatty acid β oxidation in HuS‐E/2 cells. (a) Cell viability following treatment with NGI001. HuS‐E/2 cells were incubated with the indicated concentration of NGI001 for 24 hr; then cell viability was determined using the MTT assay and expressed as a percentage of the value for untreated cells. (b, c) HuS‐E/2 cells were incubated for 18 hr with the indicated concentrations of OA, NGI001, or dapagliflozin; then quantitative analysis of lipid deposition in the Oil Red O‐stained cells was performed, shown in panel (b), and micrographs of the Oil Red O staining were captured using a microscope at 200× original magnification, shown in panel (c). (d, e) HuS‐E/2 cells were incubated for 18 hr with the indicated concentrations of OA, NGI001, or dapagliflozin and then analysed by western blotting for phosphorylation of AMPK at Thr172 and ACC at Ser79, total AMPK, and ACC in panel (d). Protein expression of total FAS, SREBP‐1c, ATGL, CPT1, and tubulin was analysed in panel (e). Tubulin served as a loading control. Quantitative analysis with Multi Gauge V3.0 is shown. NT represents cells without OA or drug treatment. (f–k) HuS‐E/2 cells were incubated in medium containing 0.1 mM of oleic acid (OA) with NGI001 at 10 μM (NGI001–10) and 20 μM (NGI001–20) and dapagliflozin at 10 μM (Dapa‐10) and 20 μM (Dapa‐20) for 18 hr. The levels of fatty acid synthesis‐related genes (f) PPARγ, (g) SREBP‐1c, (h) FASN, and (i) CCAAT/enhancer‐binding protein α (C/EBPα). The levels of fatty acid β oxidation‐related genes (j) PPARα and (k) PPARδ. Experiments were performed in triplicate, and data are presented as mean ± SEM (n = 6 per group). In the graphs, bars labelled with different letters (a, b, c) indicate significant (P < .05) differences between them; bars with the same letter indicate no significant (P > .05) difference; one‐way ANOVA with Tukey's post hoc tests. Where two letters are present above the bars, each letter should be compared separately with the letters of the other bars to determine whether the results show statistically significant differences
Because we found that NGI001 had an inhibitory effect on lipid deposition in human hepatocytes, possible mechanisms were explored. https://www.guidetopharmacology.org/GRAC/ObjectDisplayForward?objectId=1540 has been suggested to play a crucial role in regulating fat metabolism in the liver and changes with cellular energy status (Hardie, 2007). To determine whether NGI001 increased levels of AMPK and its activation, HuS‐E/2 cells were incubated with 0.1‐mM OA in the presence or absence of NGI001 and dapagliflozin, and the expression of AMPK was assessed by western blotting. Levels of phospho‐AMPK at Thr172 were assessed to evaluate AMPK activation. As shown in Figure 6d, NGI001 and dapagliflozin significantly increased AMPK phosphorylation at Thr172 in OA‐treated HuS‐E/2 cells. In addition, the activation of AMPK's downstream target enzyme, ACC, by phosphorylation at Ser79 was measured in OA‐treated HuS‐E/2 cells. Only treatment with 20 μM of NGI001 significantly increased ACC protein phosphorylation. NGI001 facilitated AMPK and ACC activation in HuS‐E/2 cells under high‐fat conditions.
We also identified the changes of proteins associated with fatty acid synthesis and β oxidation. Compared to the OA group, NGI001 and dapagliflozin substantially decreased FAS and SREBP‐1c protein expression, which are involved in fatty acid synthesis (Figure 6e). ATGL and CPT1 function as selective channels, hydrolyzing fatty acids by β oxidation. Treatment with NGI001 greatly increased ATGL and CPT1 protein expression, compared to the OA group (Figure 6e). We determined whether lipid metabolism‐related genes in the hepatocytes were influenced by drug intervention. The activities of genes involved in de novo lipogenesis in the hepatocytes, https://www.guidetopharmacology.org/GRAC/ObjectDisplayForward?objectId=595, CCAAT/enhancer‐binding protein α, FAS, and SREBP1 were substantially higher in the OA group than the NT group, while all the genes were expressed at greatly lower levels after treatment with NGI001 and dapagliflozin, compared with the OA group (Figure 6f–i). The expression of transcription factors, https://www.guidetopharmacology.org/GRAC/ObjectDisplayForward?objectId=593 and https://www.guidetopharmacology.org/GRAC/ObjectDisplayForward?objectId=594, associated with fatty acid β oxidation was markedly increased by treatment with NGI001, compared to the OA group (Figure 6j,k). The results suggest that NGI001 had a greater effect than the FDA‐approved drug, dapagliflozin, in terms of preventing the accumulation of fat droplets in OA‐treated HuS‐E/2 hepatocytes.
3.7. NGI001 down‐regulated gene and protein expression of SGLT1 and SGLT2 and glucose uptake
In order to determine the protein and gene expression level of SGLT1 and SGLT2 under fatty acid‐ and drug‐treated conditions in HuS‐E/2 cells, cells were incubated in OA‐containing medium with NGI001 or dapagliflozin and then analysed by western blotting and RT‐PCR. As shown in Figure 7a, protein expression of SGLT1 and SGLT2 was confirmed, and, surprisingly, the expression level of SGLT1 and SGLT2 was highly increased in the OA‐treated group compared with that in the NT group. In the presence of NGI001 and dapagliflozin, SGLT1 and SGLT2 were substantially decreased compared to cells treated only with OA. Consistent with the protein expression level, gene expression of SGLT1 and SGLT2 in the OA group was higher than the NT group, and expression of SGLT1 and SGLT2 was substantially lower after NGI001 and dapagliflozin treatment (Figure 7b). To investigate whether the expression levels of SGLT1 and SGLT2 correlate with glucose uptake in HuS‐E/2 cells, we used 2‐NBDG, a new fluorescent derivative of D‐glucose, for assaying glucose internalization. A significantly higher level of 2‐NBDG signals was detected in OA‐treated cells, compared with non‐treated cells. Treatment with NGI001 at 20 μM was the most effective in reducing amounts of 2‐NBDG in OA‐treated HuS‐E/2 cells (Figure 7c,d). These data showed that the up‐regulated SGLT1 and SGLT2 expression by OA induction in HuS‐E/2 cells resulted in increased glucose uptake, which could be down‐regulated by treatment with NGI001. In addition, expression of SGLT1 and SGLT2 was examined by IHC staining, in the liver tissues of HFD mice after treatment with NGI001 or dapagliflozin. IHC staining of SGLT1 in the intestine and of SGLT2 in the kidney were used as positive controls. As shown in Figure 7e, enhanced SGLT1 and SGLT2 antigen positivity was observed in the HFD group, compared with the ND group. Interestingly, weak SGLT1 and SGLT2 staining was detected in the NGI001 and dapagliflozin groups, indicating decreased protein expression levels of SGLT1 and SGLT2. Taken together, those results indicate that NGI001 treatment leads to up‐regulation of fatty acid oxidation, down‐regulation of fatty acid synthesis, inhibition of SGLT1/2 expression, and suppression of glucose uptake (Figure 7f), resulting in the amelioration of liver steatosis.
Figure 7.
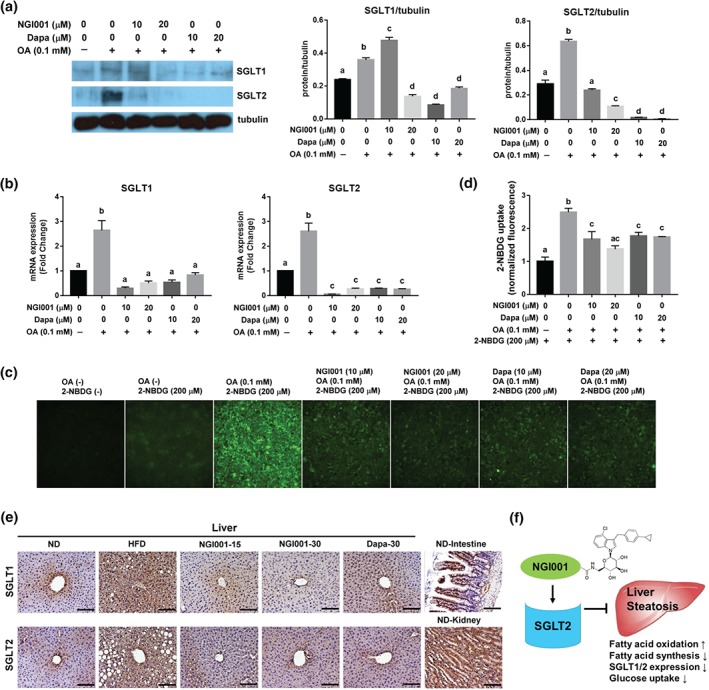
The effect of NGI001 on the expression of SGLT1 and SGLT2 and glucose uptake. (a) Protein expression of SGLT1 and SGLT2 in HuS‐E2 cells. HuS‐E/2 cells were incubated for 18 hr with the indicated concentrations of OA, NGI001, or dapagliflozin and then analysed by western blotting for SGLT1 and SGLT2. Tubulin served as a loading control. Quantitative analysis with Multi Gauge V3.0 is shown in the right panel. (b) Gene expression of SGLT1 and SGLT2 in HuS‐E2 cells. HuS‐E/2 cells were incubated for 18 hr with the indicated concentrations of OA, NGI001, or dapagliflozin; then RNA was isolated and subjected to real‐time PCR analysis to detect SGLT1 and SGLT2 mRNA. (c) Amounts of 2‐NBDG uptake in HuS‐E/2 cells. HuS‐E/2 cells were incubated in Na+ buffer for 10 min with 200 μM of 2‐NBDG. The fluorescent images were taken at 200× magnification. (d) Quantification of 2‐NBDG fluorescence intensity. The 2‐NBDG values were normalized to the fluorescence intensity. Experiments were performed in triplicate, and data are presented as mean ± SEM (n = 6 per group). In the graphs, bars labelled with different letters (a, b, c) indicate significant (P < .05) differences between them; bars with the same letter indicate no significant (P > .05) difference; one‐way ANOVA with Tukey's post hoc tests. Where two letters are present above the bars, each letter should be compared separately with the letters of the other bars to determine whether the results show statistically significant differences. (e) The effect of NGI001 on SGLT1 and SGLT2 expression in the livers of HFD‐induced obese mice. IHC detection of SGLT1 or SGLT2 in the liver tissue and that of SGLT1 and SGLT2 in the kidney and intestine served as positive controls. The scale bar is 100 μM. (f) A diagram of the pharmacological mechanisms of NGI001 action
4. DISCUSSION
The global prevalence of NAFLD is currently estimated to be 24% (Younossi et al., 2016). NAFLD with hepatic necroinflammation and faster progression to fibrosis may develop into NASH and even to hepatocellular carcinoma (Wong, Adams, de Ledinghen, Wong, & Sookoian, 2018). According to the guidelines of the American Association for the Study of Liver Disease, the first‐line treatment for NAFLD is lifestyle intervention to lose weight (Chalasani et al., 2012). Efficacious drugs approved for the treatment of NAFLD are lacking. SGLT2 inhibitors are novel anti‐hyperglycaemic agents for the pharmacological management of T2DM (Chaudhury et al., 2017). Thus, it is of interest to develop novel and safer SGLT2 inhibitors to treat diet‐induced metabolic dysfunction and NAFLD.
We had generated a series of acetylamino‐containing N‐glucosyl indoles with sufficient SGLT2 inhibition activity. Among those derivatives, NGI001 (compound 6a, 1‐[6‐(acetylamino)‐6‐deoxy‐β‐D‐glucopyranosyl]‐4‐chloro‐3‐(4‐cyclopropylbenzyl)‐1H‐indole) has the best inhibitory activity against SGLT2 (EC50 = 42 nM) and moderate selectivity over SGLT1 (EC50 = 1.4 μM; Chu et al., 2016). After oral administration of NGI001 to SD rats in single doses of 10 and 50 mg·kg−1, analysis of urinary glucose excretion revealed that, at 50 mg·kg−1, increased glucosuria was observed of 101‐mg glucose per 200‐g body weight over 24 hr, compared with that of the control (0.23‐mg glucose per 200‐g body weight). Moreover, the clearance of NGI001 was 18.8 ml·min−1·kg−1, and the half‐life of NGI001 was 3.2 hr. The clearance of dapagliflozin was 4.8 ml·min−1·kg−1, and the half‐life of dapagliflozin was 4.6 hr (Meng et al. 2008). Thus, the half‐life of NGI001 is shorter than that of dapagliflozin although NGI001 has a low total body clearance, suggesting it to be a metabolically stable compound.
In this study, we focused on the effects of treatment with NGI001 when obesity, NAFLD, and metabolic dysfunction had developed and our results showed that NGI001 improved metabolic dysfunctions, including insulin resistance, in HFD‐induced obese mice. In addition, NGI001 blocked the storage of total fat in adipose tissue and alleviated TG accumulation in liver tissue, corresponding to the decrease of the organ weight. This delayed intervention with NGI001 ameliorated the lipid metabolism and lipotoxicity in HFD‐induced obese mice. Interestingly, we found an elevated level of TGs and cholesterol in the faeces after NGI001 treatment. The effect of NGI001 on lipid excretion from the intestinal system needs further clarification.
Lipotoxicity was reported to be a trigger for renal dysfunction (Izquierdo‐Lahuerta, Martinez‐Garcia, & Medina‐Gomez, 2016). The kidney is adversely affected by dyslipidaemia, lipid accumulation, and changes in circulating adipokines that bring about alterations in renal lipid metabolism and promote insulin resistance, ultimately leading to alterations in the glomerular filtration barrier and renal failure. Our data showed that NGI001 attenuated body weight gain, lipotoxicity, dyslipidaemia, impaired glucose metabolism, and insulin resistance in HFD‐induced obese mice. Accordingly, NGI001 may provide protection of kidney function through elimination of lipotoxicity and dyslipidaemia in the HFD mice.
NGI001 showed a similar effect in decreasing blood glucose at 15 and 30 mg·kg−1 in the present study (Figure 2a). Also, NGI001 at 15 and 30 mg·kg−1 had a similar effect in decreasing glucose tolerance and fasting insulin levels in HFD‐induced obese mice (Figure 2b,c). Previous studies have shown that canagliflozin (10 and 30 mg·kg−1) and dapagliflozin (10 mg·kg−1) decreased blood glucose to almost the same level in HFHSD mice (Suga et al., 2019). Taken together, NGI001, as well as dapagliflozin and canagliflozin, were effective in inhibiting hyperglycaemia at a dose between 10 and 30 mg·kg−1 in HFD mice. On the other hand, the serum TG levels in NGI001‐15 mice were lower than in NGI001‐30 mice, although the levels of TG in both the NGI001‐15 and NGI001‐30 groups were significantly lower than the HFD group (Figure 2d). We also observed that excretion of TG in faeces was higher in NGI001‐15 mice than in NGI001‐30 mice (Figure 5d), indicating that NGI001‐15 mice excreted more TG through the faeces. Taken together, the most effective dose of NGI001 in ameliorating dyslipidaemia might be about 15 mg·kg−1. However, the detailed mechanism of NGI001 in regulating dyslipidaemia needs further investigation.
Elevated PAI‐1 levels have been shown to be associated with insulin resistance (Bastard et al., 2000). Our data show that the highly elevated level of PAI‐1 in HFD mice was prevented by NGI001 at 15 mg·kg−1 (Figure 3g). However, the PAI‐1 level did not reflect the dose‐dependent effect of NGI001. The down‐regulation of PAI‐1 was not always correlated with the down‐regulation of insulin resistance, suggesting that NGI001‐dependent PAI‐1 down‐regulation can influence insulin resistance in several ways.
Insulin resistance is one of the pivotal features in the pathogenesis of NAFLD, determining the progression from NAFLD to NASH (Manco, 2011). The key proposed mechanisms linking insulin resistance and NAFLD have been clarified, such as changes in rates of adipose tissue lipolysis and de novo lipogenesis, impaired mitochondrial fatty acid oxidation, changes in fat distribution, alterations in levels of adipokines and cytokines, and impaired glucose tolerance (Khan, Bril, Cusi, & Newsome, 2018). Our data demonstrated that HFD increased the symptoms of hyperlipidaemia and some adipokine abnormalities which could be reversed by NGI001.
Several adipokines have been associated with the development of insulin resistance (Knights et al., 2014). Adiponectin is a specific secretory adipokine that regulates fatty acid oxidation, inhibiting adipose and liver tissue lipid accumulation, and maintaining whole‐body glucose homeostasis and hepatic insulin sensitivity (Knights et al., 2014). Resistin, a hormone associated with increased blood glucose concentrations and enhanced glucose output from the liver, provides a link between adiposity and insulin resistance (Steppan & Lazar, 2004). PAI‐1 is a potent inhibitor of fibrinolysis which binds to and inactivates tissue plasminogen activator and is elevated in conditions associated with insulin resistance (Potter van Loon, Kluft, Radder, Blankenstein, & Meinders, 1993). We found that NGI001 ameliorated the greatly increased level of resistin and PAI‐1 and elevated the lower level of adiponectin in HFD‐induced obese mice. The changes of the adipokines were consistent with the beneficial effect of NGI001 on insulin resistance.
Previous studies have indicated that an HFD significantly enhanced the expression of SGLT1 mRNA in the intestine (Peng, Zhu, Zhong, Xu, & Wang, 2015). An HFD also increased SGLT2 protein expression in the kidney, whereas canagliflozin decreased the overexpression of SGLT2 (Ji et al., 2017). To date, no study has reported whether liver SGLT levels would be altered under HFD conditions by treatment with SGLT2 inhibitors. Our data demonstrated that SGLT1 and SGLT2 mRNAs and proteins could be detected in HuS‐E/2 cells. Surprisingly, after OA treatment, the expression of both SGLT1 and SGLT2 transcripts and proteins was markedly increased, and this increase could be down‐regulated by NGI001 or dapagliflozin. Consistent with the increased level of SGLT1 and SGLT2 under high fatty acid conditions, accumulation of the fluorescent marker, 2‐NBDG, was observed. Following treatment with NGI001 and dapagliflozin, 2‐NBDG uptake was greatly decreased with the alteration of SGLT1 and SGLT2 gene and protein expression. We hypothesized that SGLT2 inhibitors attenuated SGLT1 and SGLT2 expression thus preventing excessive absorption of glucose, under high‐fat conditions.
In conclusion, we observed that delayed intervention with NGI001 attenuated body weight gain, lipotoxicity, dyslipidaemia, impaired glucose metabolism, and insulin resistance in HFD‐induced obese mice. We also found the inhibitory effect of NGI001 on adipocyte hypertrophy in fat tissue and lipid accumulation in the liver. NGI001 caused less damage to the kidney and promoted excretion of TGs and cholesterol through the faeces. Further investigation of the molecular mechanism showed that NGI001 up‐regulated the genes and proteins associated with lipolysis, down‐regulated those related to hepatic de novo lipogenesis, and inhibited gene and protein expression of SGLT1 and SGLT2. The findings of this study suggest a therapeutic potential of the novel SGLT2 inhibitor NGI001 to attenuate or delay the onset of diet‐induced metabolic diseases and NAFLD.
AUTHOR CONTRIBUTIONS
H.C. and H.H. performed the experiments. J.C.L. synthesized the compounds. H.C.H. and H.K.L. analysed the data. H.C. and C.H. designed the experiments. C.H. was primarily responsible for writing the manuscript. All authors contributed to manuscript editing and approved the final version.
CONFLICT OF INTEREST
The authors declare no conflicts of interest.
DECLARATION OF TRANSPARENCY AND SCIENTIFIC RIGOUR
This Declaration acknowledges that this paper adheres to the principles for transparent reporting and scientific rigour of preclinical research as stated in the BJP guidelines for https://bpspubs.onlinelibrary.wiley.com/doi/full/10.1111/bph.14207, https://bpspubs.onlinelibrary.wiley.com/doi/full/10.1111/bph.14208, and https://bpspubs.onlinelibrary.wiley.com/doi/full/10.1111/bph.14206, and as recommended by funding agencies, publishers, and other organizations engaged with supporting research.
Supporting information
Table S1. Supporting Information
ACKNOWLEDGEMENTS
This work was supported by research grants MOST 106‐2320‐B‐010‐038 and MOST 107‐2320‐B‐010‐014 from the Ministry of Science and Technology, Taiwan, and the Professor Tsuei‐Chu Mong Merit Scholarship.
Chiang H, Lee J‐C, Huang H‐C, Huang H, Liu H‐K, Huang C. Delayed intervention with a novel SGLT2 inhibitor NGI001 suppresses diet‐induced metabolic dysfunction and non‐alcoholic fatty liver disease in mice. Br J Pharmacol. 2020;177:239–253. 10.1111/bph.14859
Hao Chiang and Jinq‐Chyi Lee contributed equally to this work.
REFERENCES
- Alexander, S. P. H. , Cidlowski, J. A. , Kelly, E. , Marrion, N. V. , Peters, J. A. , Faccenda, E. , … CGTP Collaborators (2017). The Concise Guide to PHARMACOLOGY 2017/18: Nuclear hormone receptors. British Journal of Pharmacology, 174, S208–S224. 10.1111/bph.13880 [DOI] [PMC free article] [PubMed] [Google Scholar]
- Alexander, S. P. H. , Fabbro, D. , Kelly, E. , Marrion, N. V. , Peters, J. A. , Faccenda, E. , … CGTP Collaborators (2017). The Concise Guide to PHARMACOLOGY 2017/18: Enzymes. British Journal of Pharmacology, 174, S272–S359. 10.1111/bph.13877 [DOI] [PMC free article] [PubMed] [Google Scholar]
- Alexander, S. P. , Kelly, E. , Marrion, N. V. , Peters, J. A. , Faccenda, E. , Harding, S. D. , … CGTP Collaborators (2017). The Concise Guide to PHARMACOLOGY 2017/18: Transporters. British Journal of Pharmacology, 174(Suppl 1), S360–S446. 10.1111/bph.13883 [DOI] [PMC free article] [PubMed] [Google Scholar]
- Alexander, S. P. H. , Roberts, R. E. , Broughton, B. R. S. , Sobey, C. G. , George, C. H. , Stanford, S. C. , … Ahluwalia, A. (2018). Goals and practicalities of immunoblotting and immunohistochemistry: A guide for submission to the British Journal of Pharmacology. British Journal of Pharmacology, 175, 407–411. 10.1111/bph.14112 [DOI] [PMC free article] [PubMed] [Google Scholar]
- Aly, H. H. , Watashi, K. , Hijikata, M. , Kaneko, H. , Takada, Y. , Egawa, H. , … Shimotohno, K. (2007). Serum‐derived hepatitis C virus infectivity in interferon regulatory factor‐7‐suppressed human primary hepatocytes. Journal of Hepatology, 46, 26–36. 10.1016/j.jhep.2006.08.018 [DOI] [PubMed] [Google Scholar]
- Asrih, M. , & Jornayvaz, F. R. (2015). Metabolic syndrome and nonalcoholic fatty liver disease: Is insulin resistance the link? Molecular and Cellular Endocrinology, 418(Pt 1), 55–65. [DOI] [PubMed] [Google Scholar]
- Bastard, J. P. , Pieroni, L. , & Hainque, B. (2000). Relationship between plasma plasminogen activator inhibitor 1 and insulin resistance. Diabetes/Metabolism Research and Reviews, 16, 192–201. 10.1002/1520-7560(200005/06)16:3<192::AID-DMRR114>3.0.CO;2-G [DOI] [PubMed] [Google Scholar]
- Cassidy, W. M. , & Reynolds, T. B. (1994). Serum lactic dehydrogenase in the differential diagnosis of acute hepatocellular injury. Journal of Clinical Gastroenterology, 19, 118–121. 10.1097/00004836-199409000-00008 [DOI] [PubMed] [Google Scholar]
- Chalasani, N. , Younossi, Z. , Lavine, J. E. , Diehl, A. M. , Brunt, E. M. , Cusi, K. , … Sanyal, A. J. (2012). The diagnosis and management of non‐alcoholic fatty liver disease: Practice guideline by the American Association for the Study of Liver Diseases, American College of Gastroenterology, and the American Gastroenterological Association. Hepatology, 55, 2005–2023. 10.1002/hep.25762 [DOI] [PubMed] [Google Scholar]
- Chaudhury, A. , Duvoor, C. , Reddy Dendi, V. S. , Kraleti, S. , Chada, A. , Ravilla, R. , … Mirza, W. (2017). Clinical review of antidiabetic drugs: Implications for type 2 diabetes mellitus management. Frontiers in Endocrinology (Lausanne), 8, 6. [DOI] [PMC free article] [PubMed] [Google Scholar]
- Chu, K. F. , Yao, C. H. , Song, J. S. , Chen, C. T. , Yeh, T. K. , Hsieh, T. C. , … Lee, J. C. (2016). N‐Indolylglycosides bearing modifications at the glucose C6‐position as sodium‐dependent glucose co‐transporter 2 inhibitors. Bioorganic & Medicinal Chemistry, 24, 2242–2250. 10.1016/j.bmc.2016.03.058 [DOI] [PubMed] [Google Scholar]
- Curtis, M. J. , Alexander, S. , Cirino, G. , Docherty, J. R. , George, C. H. , Giembycz, M. A. , … Ahluwalia, A. (2018). Experimental design and analysis and their reporting II: Updated and simplified guidance for authors and peer reviewers. British Journal of Pharmacology, 175, 987–993. 10.1111/bph.14153 [DOI] [PMC free article] [PubMed] [Google Scholar]
- Davies, M. J. , D'Alessio, D. A. , Fradkin, J. , Kernan, W. N. , Mathieu, C. , Mingrone, G. , … Buse, J. B. (2018). Management of Hyperglycemia in Type 2 Diabetes, 2018. A consensus report by the American Diabetes Association (ADA) and the European Association for the Study of Diabetes (EASD). Diabetes Care, 41, 2669–2701. 10.2337/dci18-0033 [DOI] [PMC free article] [PubMed] [Google Scholar]
- Defronzo, R. A. (2009). Banting lecture. From the triumvirate to the ominous octet: A new paradigm for the treatment of type 2 diabetes mellitus. Diabetes, 58, 773–795. 10.2337/db09-9028 [DOI] [PMC free article] [PubMed] [Google Scholar]
- Dixon, R. A. , Diehl, R. E. , Opas, E. , Rands, E. , Vickers, P. J. , Evans, J. F. , … Miller, D. K. (1990). Requirement of a 5‐lipoxygenase‐activating protein for leukotriene synthesis. Nature, 343, 282–284. 10.1038/343282a0 [DOI] [PubMed] [Google Scholar]
- Dufour, D. R. , Lott, J. A. , Nolte, F. S. , Gretch, D. R. , Koff, R. S. , & Seeff, L. B. (2000). Diagnosis and monitoring of hepatic injury. II. Recommendations for use of laboratory tests in screening, diagnosis, and monitoring. Clinical Chemistry, 46, 2050–2068. [DOI] [PMC free article] [PubMed] [Google Scholar]
- Friedewald, W. T. , Levy, R. I. , & Fredrickson, D. S. (1972). Estimation of the concentration of low‐density lipoprotein cholesterol in plasma, without use of the preparative ultracentrifuge. Clinical Chemistry, 18, 499–502. [PubMed] [Google Scholar]
- Hardie, D. G. (2007). AMP‐activated/SNF1 protein kinases: Conserved guardians of cellular energy. Nature Reviews. Molecular Cell Biology, 8, 774–785. 10.1038/nrm2249 [DOI] [PubMed] [Google Scholar]
- Harding, S. D. , Sharman, J. L. , Faccenda, E. , Southan, C. , Pawson, A. J. , Ireland, S. , … NC‐IUPHAR (2018). The IUPHAR/BPS Guide to PHARMACOLOGY in 2018: Updates and expansion to encompass the new guide to IMMUNOPHARMACOLOGY. Nucleic Acids Research, 46, D1091–D1106. 10.1093/nar/gkx1121 [DOI] [PMC free article] [PubMed] [Google Scholar]
- Huang, H. C. , Tao, M. H. , Hung, T. M. , Chen, J. C. , Lin, Z. J. , & Huang, C. (2014). (−)‐Epigallocatechin‐3‐gallate inhibits entry of hepatitis B virus into hepatocytes. Antiviral Research, 111, 100–111. 10.1016/j.antiviral.2014.09.009 [DOI] [PubMed] [Google Scholar]
- Izquierdo‐Lahuerta, A. , Martinez‐Garcia, C. , & Medina‐Gomez, G. (2016). Lipotoxicity as a trigger factor of renal disease. Journal of Nephrology, 29, 603–610. 10.1007/s40620-016-0278-5 [DOI] [PubMed] [Google Scholar]
- Ji, W. , Zhao, M. , Wang, M. , Yan, W. , Liu, Y. , Ren, S. , … Chen, L. (2017). Effects of canagliflozin on weight loss in high‐fat diet‐induced obese mice. PLoS ONE, 12, e0179960 10.1371/journal.pone.0179960 [DOI] [PMC free article] [PubMed] [Google Scholar]
- Khan, R. , Bril, F. , Cusi, K. , & Newsome, P. N. (2018). Modulation of insulin resistance in NAFLD. Hepatology 70(2), 711–724. [DOI] [PubMed] [Google Scholar]
- Kilkenny, C. , Browne, W. , Cuthill, I. C. , Emerson, M. , & Altman, D. G. (2010). Animal research: Reporting in vivo experiments: The ARRIVE guidelines. British Journal of Pharmacology, 160, 1577–1579. [DOI] [PMC free article] [PubMed] [Google Scholar]
- Knights, A. J. , Funnell, A. P. , Pearson, R. C. , Crossley, M. , & Bell‐Anderson, K. S. (2014). Adipokines and insulin action: A sensitive issue. Adipocytes, 3, 88–96. 10.4161/adip.27552 [DOI] [PMC free article] [PubMed] [Google Scholar]
- Liu, H. K. , Hung, T. M. , Huang, H. C. , Lee, I. J. , Chang, C. C. , Cheng, J. J. , … Huang, C. (2015). Bai‐Hu‐Jia‐Ren‐Shen‐Tang decoction reduces fatty liver by activating AMP‐activated protein kinase in vitro and in vivo. Evidence‐Based Complementary and Alternative Medicine, 2015, 651734. [DOI] [PMC free article] [PubMed] [Google Scholar]
- Liu, J. J. , Lee, T. , & DeFronzo, R. A. (2012). Why do SGLT2 inhibitors inhibit only 30‐50% of renal glucose reabsorption in humans? Diabetes, 61, 2199–2204. 10.2337/db12-0052 [DOI] [PMC free article] [PubMed] [Google Scholar]
- Loomba, R. , Abraham, M. , Unalp, A. , Wilson, L. , Lavine, J. , Doo, E. , … the Nonalcoholic Steatohepatitis Clinical Research Network (2012). Association between diabetes, family history of diabetes, and risk of nonalcoholic steatohepatitis and fibrosis. Hepatology, 56, 943–951. 10.1002/hep.25772 [DOI] [PMC free article] [PubMed] [Google Scholar]
- Lu, Y. , Jiang, Z. , Dai, H. , Miao, R. , Shu, J. , Gu, H. , … Cai, J. (2018). Hepatic leukocyte immunoglobulin‐like receptor B4 (LILRB4) attenuates nonalcoholic fatty liver disease via SHP1‐TRAF6 pathway. Hepatology, 67, 1303–1319. 10.1002/hep.29633 [DOI] [PMC free article] [PubMed] [Google Scholar]
- Maliha, G. , & Townsend, R. R. (2015). SGLT2 inhibitors: Their potential reduction in blood pressure. Journal of the American Society of Hypertension, 9, 48–53. 10.1016/j.jash.2014.11.001 [DOI] [PubMed] [Google Scholar]
- Manco, M. (2011). Metabolic syndrome in childhood from impaired carbohydrate metabolism to nonalcoholic fatty liver disease. Journal of the American College of Nutrition, 30, 295–303. 10.1080/07315724.2011.10719972 [DOI] [PubMed] [Google Scholar]
- Marchesini, G. , Brizi, M. , Morselli‐Labate, A. M. , Bianchi, G. , Bugianesi, E. , McCullough, A. J. , … Melchionda, N. (1999). Association of nonalcoholic fatty liver disease with insulin resistance. The American Journal of Medicine, 107, 450–455. 10.1016/S0002-9343(99)00271-5 [DOI] [PubMed] [Google Scholar]
- Meng, W. , Ellsworth, B. A. , Nirschl, A. A. , McCann, P. J. , Patel, M. , Girotra, R. N. , … Washburn, W. N. (2008). Discovery of dapagliflozin: A potent, selective renal sodium‐dependent glucose cotransporter 2 (SGLT2) inhibitor for the treatment of type 2 diabetes. Journal of Medicinal Chemistry, 51, 1145–1149. 10.1021/jm701272q [DOI] [PubMed] [Google Scholar]
- Mizuno, T. (2018). Fat mass and obesity associated (FTO) gene and hepatic glucose and lipid metabolism. Nutrients, 10, 1600 10.3390/nu10111600 [DOI] [PMC free article] [PubMed] [Google Scholar]
- Peng, B. J. , Zhu, Q. , Zhong, Y. L. , Xu, S. H. , & Wang, Z. (2015). Chlorogenic acid maintains glucose homeostasis through modulating the expression of SGLT‐1, GLUT‐2, and PLG in different intestinal segments of Sprague‐Dawley rats fed a high‐fat diet. Biomedical and Environmental Sciences, 28, 894–903. 10.3967/bes2015.123 [DOI] [PubMed] [Google Scholar]
- Potter van Loon, B. J. , Kluft, C. , Radder, J. K. , Blankenstein, M. A. , & Meinders, A. E. (1993). The cardiovascular risk factor plasminogen activator inhibitor type 1 is related to insulin resistance. Metabolism, 42, 945–949. 10.1016/0026-0495(93)90005-9 [DOI] [PubMed] [Google Scholar]
- Riser Taylor, S. , & Harris, K. B. (2013). The clinical efficacy and safety of sodium glucose cotransporter‐2 inhibitors in adults with type 2 diabetes mellitus. Pharmacotherapy, 33, 984–999. 10.1002/phar.1303 [DOI] [PubMed] [Google Scholar]
- Stepanova, M. , Rafiq, N. , Makhlouf, H. , Agrawal, R. , Kaur, I. , Younoszai, Z. , … Younossi, Z. M. (2013). Predictors of all‐cause mortality and liver‐related mortality in patients with non‐alcoholic fatty liver disease (NAFLD). Digestive Diseases and Sciences, 58, 3017–3023. 10.1007/s10620-013-2743-5 [DOI] [PubMed] [Google Scholar]
- Steppan, C. M. , & Lazar, M. A. (2004). The current biology of resistin. Journal of Internal Medicine, 255, 439–447. 10.1111/j.1365-2796.2004.01306.x [DOI] [PubMed] [Google Scholar]
- Suga, T. , Kikuchi, O. , Kobayashi, M. , Matsui, S. , Yokota‐Hashimoto, H. , Wada, E. , … Kitamura, T. (2019). SGLT1 in pancreatic alpha cells regulates glucagon secretion in mice, possibly explaining the distinct effects of SGLT2 inhibitors on plasma glucagon levels. Mol Metab, 19, 1–12. 10.1016/j.molmet.2018.10.009 [DOI] [PMC free article] [PubMed] [Google Scholar]
- Tilg, H. , & Hotamisligil, G. S. (2006). Nonalcoholic fatty liver disease: Cytokine‐adipokine interplay and regulation of insulin resistance. Gastroenterology, 131, 934–945. 10.1053/j.gastro.2006.05.054 [DOI] [PubMed] [Google Scholar]
- Tilg, H. , & Moschen, A. R. (2008). Insulin resistance, inflammation, and non‐alcoholic fatty liver disease. Trends in Endocrinology and Metabolism, 19, 371–379. 10.1016/j.tem.2008.08.005 [DOI] [PubMed] [Google Scholar]
- Williams, C. D. , Stengel, J. , Asike, M. I. , Torres, D. M. , Shaw, J. , Contreras, M. , … Harrison, S. A. (2011). Prevalence of nonalcoholic fatty liver disease and nonalcoholic steatohepatitis among a largely middle‐aged population utilizing ultrasound and liver biopsy: A prospective study. Gastroenterology, 140, 124–131. 10.1053/j.gastro.2010.09.038 [DOI] [PubMed] [Google Scholar]
- Williams, T. (2015). Metabolic syndrome: Nonalcoholic fatty liver disease. FP Essent, 435, 24–29. [PubMed] [Google Scholar]
- Wong, V. W. , Adams, L. A. , de Ledinghen, V. , Wong, G. L. , & Sookoian, S. (2018). Noninvasive biomarkers in NAFLD and NASH—Current progress and future promise. Nature Reviews. Gastroenterology & Hepatology, 15, 461–478. 10.1038/s41575-018-0014-9 [DOI] [PubMed] [Google Scholar]
- Younossi, Z. M. , Koenig, A. B. , Abdelatif, D. , Fazel, Y. , Henry, L. , & Wymer, M. (2016). Global epidemiology of nonalcoholic fatty liver disease—Meta‐analytic assessment of prevalence, incidence, and outcomes. Hepatology, 64, 73–84. 10.1002/hep.28431 [DOI] [PubMed] [Google Scholar]
- Zambo, V. , Simon‐Szabo, L. , Szelenyi, P. , Kereszturi, E. , Banhegyi, G. , & Csala, M. (2013). Lipotoxicity in the liver. World Journal of Hepatology, 5, 550–557. 10.4254/wjh.v5.i10.550 [DOI] [PMC free article] [PubMed] [Google Scholar]
- Zinman, B. , Wanner, C. , Lachin, J. M. , Fitchett, D. , Bluhmki, E. , Hantel, S. , … Inzucchi, S. E. (2015). Empagliflozin, cardiovascular outcomes, and mortality in type 2 diabetes. The New England Journal of Medicine, 373, 2117–2128. 10.1056/NEJMoa1504720 [DOI] [PubMed] [Google Scholar]
Associated Data
This section collects any data citations, data availability statements, or supplementary materials included in this article.
Supplementary Materials
Table S1. Supporting Information