Abstract
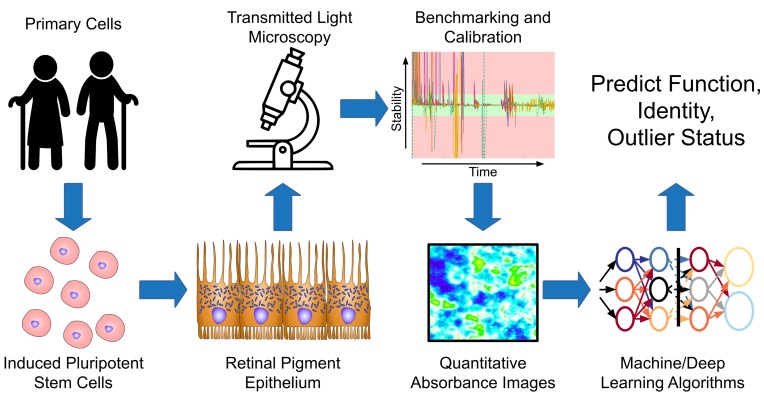
Increases in the number of cell therapies in the preclinical and clinical phases have prompted the need for reliable and noninvasive assays to validate transplant function in clinical biomanufacturing. We developed a robust characterization methodology composed of quantitative bright-field absorbance microscopy (QBAM) and deep neural networks (DNNs) to noninvasively predict tissue function and cellular donor identity. The methodology was validated using clinical-grade induced pluripotent stem cell–derived retinal pigment epithelial cells (iPSC-RPE). QBAM images of iPSC-RPE were used to train DNNs that predicted iPSC-RPE monolayer transepithelial resistance, predicted polarized vascular endothelial growth factor (VEGF) secretion, and matched iPSC-RPE monolayers to the stem cell donors. DNN predictions were supplemented with traditional machine-learning algorithms that identified shape and texture features of single cells that were used to predict tissue function and iPSC donor identity. These results demonstrate noninvasive cell therapy characterization can be achieved with QBAM and machine learning.
Keywords: Ophthalmology
Keywords: Stem cell transplantation
Introduction
Advancements in developmental biology and regenerative medicine have helped produce cell-based therapies to treat retinal degeneration, neurodegeneration, cardiopathies, and other diseases by replacing damaged or degenerative native tissue with a new functional implant developed in vitro. Induced pluripotent stem cells (iPSCs) have extended the potential of cell therapies to permit transplantation of autologous tissues (1). However, as these autologous cell therapies are translated from the laboratory to the clinic, barriers to large-scale biomanufacturing have become evident (2). Often, cell function is determined in the laboratory using sophisticated assays, including electrophysiology, ELISAs, immunolabeling, small molecule quantification, and DNA/RNA-based assays. These assays require a trained user, are low throughput, expensive, endpoint, and/or are time consuming. Thus, they are challenging to implement under current good manufacturing practices (cGMP) which are required to produce any cell-therapy product (3). Therefore, clinical translation of any iPSC-based therapy is made more challenging due to the scarcity of noninvasive, automated, fast, and robust assays (2).
Here, a methodology was developed that uses quantitative bright-field absorbance microscopy (QBAM), which is an automated method of capturing images that are reproducible across different microscopes, and neural networks to noninvasively predict tissue function. Clinical-grade iPSC-derived retinal pigment epithelial cells (iPSC-RPE) from age-related macular degeneration (AMD) patients and healthy donors were used as a model system to determine whether tissue function could be predicted from bright-field microscopy images.
The RPE is a cellular monolayer, and RPE are of clinical interest, as shown by the fact that at least 11 investigational new drug–enabling (IND-enabling) or phase I clinical trial stage studies are using RPE to treat AMD (4). Additionally, the appearance of RPE cells within the monolayer is known to be critical to RPE function (5–7) and recently a phase I clinical trial used visual inspection of RPE by an expert technician as a biomanufacturing release criterion for implantation (8). RPE cell appearance is largely dictated by the maturity of junctional complexes between neighboring RPE cells and the characteristic pigmented appearance from melanin production (9). The junctional complex is linked to tissue maturity and functionality, including barrier function (transepithelial resistance [TER] and transepithelial potential [TEP] measurements) (10) and polarized secretion of growth factors (ELISA) (9). Thus, cell appearance and function are correlated and may be predictive of each other.
The variability of transmitted light microscopy images makes them challenging to use for automated cell analysis and segmentation (11, 12). Thus, the methodology developed in this study consists of 2 components. The first is QBAM. The second component is artificial intelligence, which uses QBAM images to predict multicellular function. The artificial intelligence techniques were split into the categories of deep neural networks (DNNs) and traditional machine learning (TML). These techniques were chosen because of the high accuracy achieved in recent biomedical classification (13) and regression applications (14), their computational speeds for industrial scalability (15, 16), and their robustness to noise/variability (17, 18). We anticipate that the speed, reproducibility, and accuracy of these noninvasive, automated methods will aid in scaling the biomanufacturing process as cell therapies translate from the laboratory to the clinic.
Results
Methodology overview and test case description.
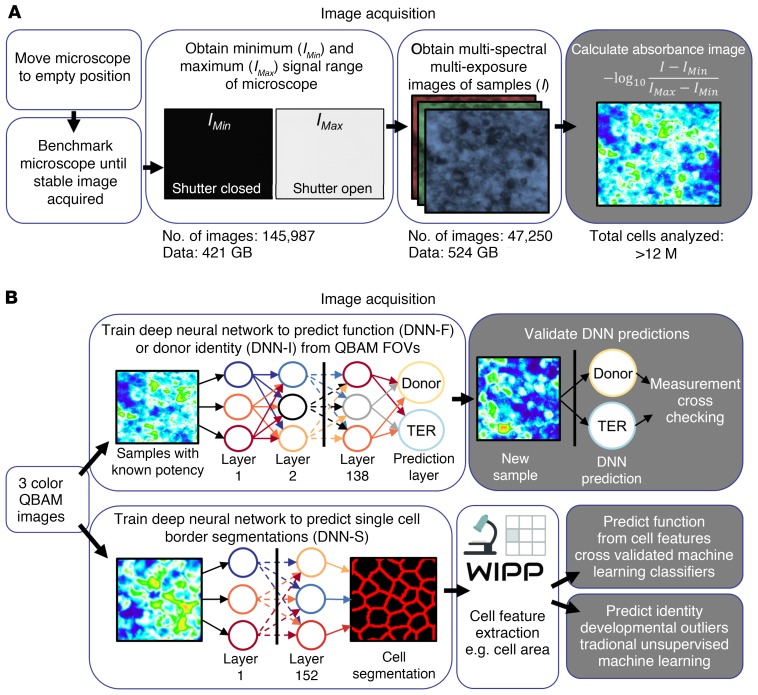
QBAM was developed to achieve reproducibility in bright-field imaging across different microscopes. QBAM converts pixels from relative intensity units to absorbance units, an absolute measure of light attenuation (Figure 1A). To improve reproducibility of imaging, QBAM calculates statistics on images in real time as they are captured to ensure that the absorbance value measured at every pixel has a 95% CI of 10 milli-absorbance units (mAU) (Supplemental Figure 1; supplemental material available online with this article; https://doi.org/10.1172/JCI131187DS1). In this study, 3 different band-pass filters were used for imaging, but the method scales to any number of wavelengths. QBAM imaging was implemented as a plugin for Micromanager (for microscopes with available hardware) or a modular python package (for microscopes not supported by Micromanager), so that the user needed to only push a few buttons to obtain QBAM images.
Figure 1. Methodology for image acquisition and image analysis.
(A) An overview of QBAM imaging. The method converts pixel values in bright-field images to absorbance values. (B) Methods of analyzing QBAM images of human iPSC-RPE to predict function, identity and developmental outliers. Three DNNs were constructed for this study: (a) Predicts function (TER and VEGF-ratio) from QBAM images (DNN-F) using entire FOVs from microscopes, (b) identifies whether QBAM images from different clones came from the same donor (DNN-I), (c) segments individual iPSC-RPE cells in absorbance images (DNN-S). QBAM images of iPSC-RPE that were segmented with DNN-S also had individual cell image features extracted with the WIPP, and these features were used to predict cell function, cell identity, and whether cells were developmental outliers. More information on QBAM imaging is presented in Supplemental Figure 1, and the DNN architectures are presented in Supplemental Figure 2. Features extracted by WIPP are listed in Supplemental Table 1.
Analysis of QBAM images was performed at the field of view (FOV) scale or the single-cell scale (Figure 1B). At both scales, DNNs were used for analysis, but for different purposes. The DNNs at the FOV scale were designed to directly predict 2 things: the outcome of functional/maturity assays (DNN-F, Supplemental Figure 2, A and B) or whether 2 sets of QBAM images came from the same donor (DNN-I). No image processing was performed prior to feeding images into DNN-F or DNN-I.
Single-cell analysis began with a DNN that identified cell borders in QBAM images (DNN-S) (Supplemental Figure 2C). Next, visual features of individual cells were extracted from the QBAM images using the web image processing pipeline (WIPP, extracted features in Supplemental Table 1 and ref. 19). The extracted visual features were then used to train TML algorithms to predict a variety of tissue characteristics, including function, origin of the donor the cells, and developmental outliers (abnormal cell appearance). TML algorithms were then used to identify critical cell features that contributed to the prediction of tissue characteristics. To demonstrate the effectiveness of the imaging and analysis method, a proof of principle study was carried out on iPSC-RPE from the following donor types: healthy, oculocutaneous albinism disorder (OCA), and AMD. The iPSC-RPE from healthy donors were imaged as they matured, while cells from AMD and OCA donors were imaged at a terminal time point once they had reached maturity. These 2 experimental designs were used to address 2 different use cases for the platform: (a) Noninvasively predicting iPSC-RPE function throughout the long culture to reduce the total number of replicates needed and provide more comprehensive/continuous assessment of samples and (b) noninvasively providing assurance of tissue function, tissue identity, and determination of whether tissue is an outlier from all other replicates on the implant that is being placed into patients on the day that it will be implanted. The assessment of cells was done using TML algorithms and DNNs (rather than traditional statistical approaches) due to the large heterogeneity of cells across scales (within a well, across replicates, between cultures, across clones, and across donors). To both assess and incorporate this heterogeneity, high-dimensional models were needed for accurate prediction of cell function, identity, and determination of whether cells were outliers.
iPSC-RPE from 5 different OCA patients and 2 healthy donors were imaged using QBAM to determine the sensitivity of the imaging method to biological variation and naturally low levels of melanin in OCA iPSC-RPE. In addition to weekly imaging, iPSC-RPE from healthy donors were assessed for TER and polarized VEGF secretion. TER is a measure of RPE maturity that increases as tight junctions form between neighboring cells. Polarized VEGF secretion is a measure of RPE function, where more VEGF is secreted on the basal side relative to the apical side of the cell monolayer (VEGF-ratio). Finally, 8 iPSC-RPE clones were derived from 3 AMD donors using clinical-grade protocols. Here, clinical grade refers to production of cells using xenogeneic free reagents and cGMP compliant production processes. QBAM imaging was carried out on AMD iPSC-RPE once they had reached maturity.
Accuracy, reproducibility, and sensitivity of QBAM.
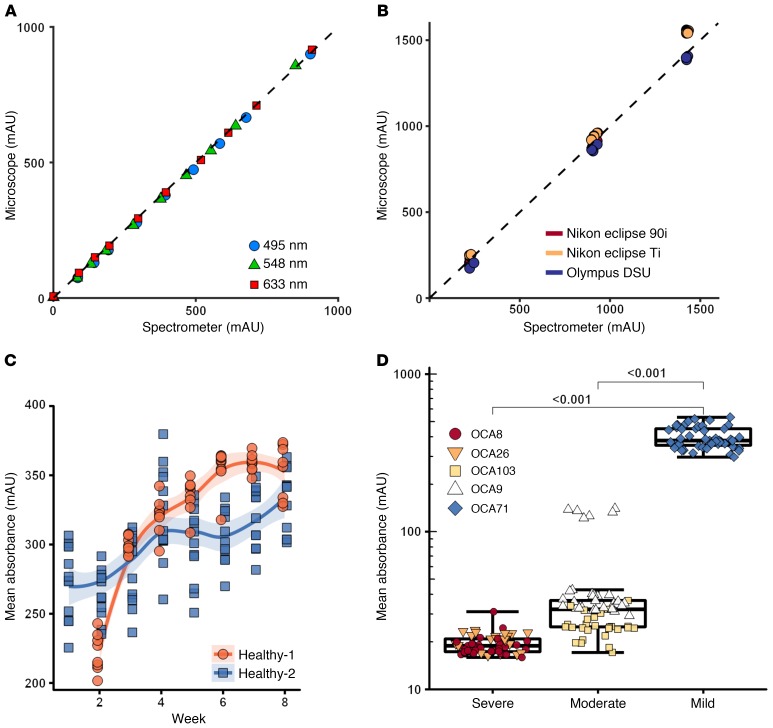
QBAM imaging was validated with a combination of reference neutral density (ND) filters and biological samples. ND filters with known absorbance values were used as a reference to validate QBAM imaging by comparing absorbance measured on a UV Vis spectrometer to absorbance measured using QBAM imaging. Absorbance measured with QBAM imaging strongly correlated with absorbance measured by the spectrometer across the visible spectrum (Figure 2A, R2 > 0.999). To further validate the method, reproducibility of QBAM on ND filters was determined across 3 additional microscopes, each equipped with different filters, objectives, and light sources. The root mean squared error (RMSE) across all filters and microscopes was 66 mAU or approximately 4.4% at the highest absorbance value measured (Figure 2B).
Figure 2. Assessment of QBAM reproducibility, accuracy, and robustness.
(A) ND filters were analyzed with a spectrometer and compared with absorbance values from QBAM images. n = 3 replicates per point; error bars = 3 SD (smaller than size of data point). (B) Three different ND filters were imaged on 3 different microscopes using different color filters to determine the comparability of absorbance values between different configurations (e.g., filters, cameras, etc.). n = 3 replicates per point[ error bars = 3 SD (smaller than size of data point). (C) iPSC-RPE from 2 healthy patients were imaged over time with QBAM (n = 12 wells per donor) to observe changes in pigmentation as iPSC-RPE mature. Each data point represents the mean of 12 images captured from 1 well. Shaded region represents 95% SEM. (D) iPSC-RPE from patients with OCA were imaged to determine whether QBAM was able to recapitulate clinical presentation (OCA patients have iPSC-RPE with low pigment). Each data point represents 1 FOV of each sample. Whiskers represent 3 times the inner quartile range; boxes show 25% and 75% quantiles. n = 9 replicates for severe; n = 10 replicates for moderate; and n = 8 replicates for mild. A linear mixed effect model controlling for multiple images being taken per well was performed for albino cells.
QBAM imaging was then tested on live, progressively maturing iPSC-RPE derived from 2 different healthy donors. As expected from published literature (20), a general trend of increasing mean absorbance as time progressed was found (Figure 2C). To determine how sensitive QBAM imaging was with respect to iPSC-RPE pigmentation, QBAM was used to image iPSC-RPE from 5 different patients with OCA (a disease known to reduce iPSC-RPE pigmentation). Mutant loci in OCA iPSC-RPE were sequenced to confirm the albinism type (OCA1A or OCA2) and the disease severity. OCA1A iPSC-RPE produced no melanin (OCA8 and OCA26) and thus had the lowest image absorbance. OCA2 patients had a range of phenotypes from moderate (OCA103 and OCA9) to mild (OCA71), which corresponded with absorbance measures made by QBAM (Figure 2D). Despite iPSC-RPE from OCA1A patients producing low levels of pigment, the absorbance values were 2× higher than the lowest sensitivity of QBAM (10 mAU). Taken together, these data demonstrate the accuracy, reproducibility, and sensitivity of QBAM imaging.
Methodology to predict iPSC-RPE function from absorbance images.
iPSC-RPE from healthy donors (healthy-1, healthy-2) were imaged to determine whether QBAM imaging affected cell maturation and could measure a large range in variation of iPSC-RPE pigmentation. This was done using 3 culture conditions: (a) control iPSC-RPE (no treatment), (b) iPSC-RPE treated with a known inducer of RPE maturation (aphidicolin), and (c) iPSC-RPE treated with a known inhibitor of RPE maturation (hedgehog pathway inhibitor-4 [HPI4]) (21).
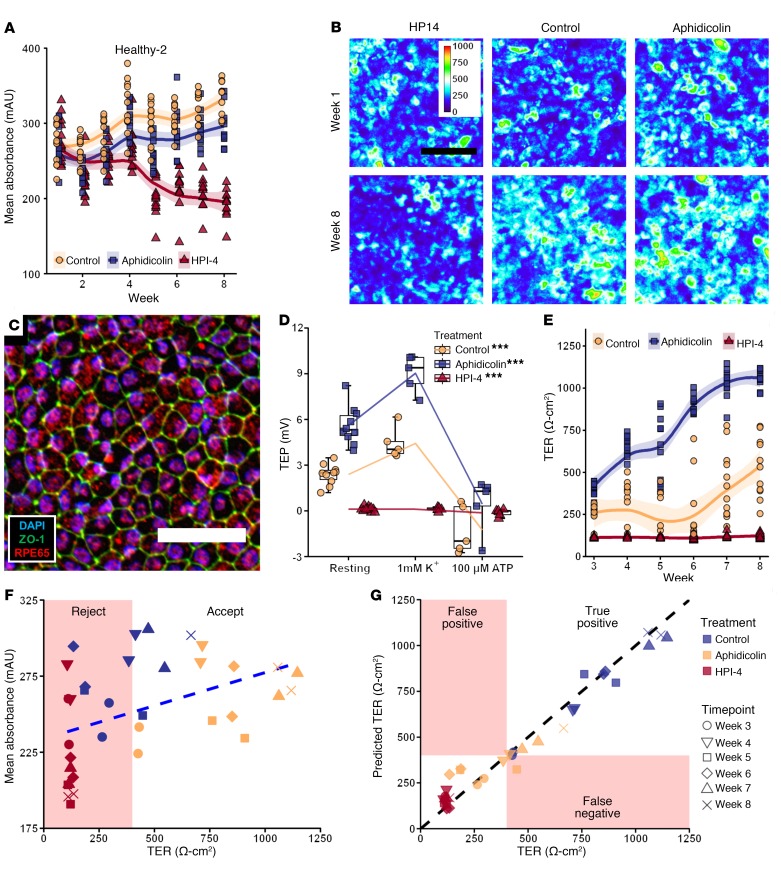
Control and aphidicolin-treated iPSC-RPE were found to mature as expected with increasing absorbance over the 8-week culture, while HPI4-treated iPSC-RPE had a decreasing trend in absorbance over time (healthy-2 is shown in Figure 3, A and B, and healthy-1 in Supplemental Figure 3, A and B). Higher mRNA and protein expression of maturation markers were found in control and aphidicolin-treated iPSC-RPE than in HPI4-treated iPSC-RPE (Figure 3C and Supplemental Figure 3, D–F). The baseline electrical response (TEP and TER) and its change to physiological treatments of 5 mM to 1 mM potassium (K+) or 100 μM adenosine triphosphate (ATP) on the apical side was significantly greater in aphidicolin-treated iPSC-RPE and significantly lower in HPI4-treated iPSC-RPE relative to control (Figure 3D and Supplemental Figure 3C). Further, iPSC-RPE maturation was evident from the presence of dense, native-like apical processes (Supplemental Figure 3, G and H, and ref. 21). From this set of experiments, it was concluded that (a) iPSC-RPE produced in clinical grade conditions had a mature epithelial phenotype, (b) weekly QBAM imaging did not affect iPSC-RPE maturation, and (c) differences in pigmentation between mature (control and aphidicolin) and immature (HPI4) iPSC-RPE could be quantified with QBAM imaging.
Figure 3. Prediction of healthy-2 iPSC-RPE function from QBAM images.
(A) Plot of the mean absorbance from 12 images collected in each well over time. Shaded region represents 95% SEM. (B) Representative QBAM images of live iPSC-RPE prior to treatment (week 1, top row) and after 8 weeks of maturation (bottom row) in the presence of a maturation promoter (aphidicolin), a maturation inhibitor (HPI4), or neither (control). Color calibration bar shows units in mAU. (C) Fluorescent labeling of a control sample from healthy-2 iPSC-RPE after 8 weeks of culture, where blue shows cell nuclei (DAPI), green shows cell borders (ZO-1), and red shows an RPE-specific maturation marker (RPE65). Scale bars: 100 μm (B); 50 μm (C). (D) Evaluation of iPSC-RPE TEP in response to an ATP challenge. ***P < 0.005. Whiskers represent 4 times the inner quartile range, and boxes show 25% and 75% quantiles. (E) Plot of TER over time for every replicate starting at week 3. Shaded region represents 95% SEM. (F) Plot of TER against mean image absorbance (R2 = 0.19, blue dashed line shows linear regression). (G) Plot of TER predictions from a DNN (DNN-F) against the measured TER (R2 = 0.97, black line represents a perfect prediction from the DNN). See also Supplemental Figure 3 for additional functional testing, and Supplemental Figure 4 for DNN-F prediction of VEGF secretion. n = 12 replicate wells per treatment and 12 images per replicate for all graphs. Linear mixed effect models controlling for repeated measures from a single well over time and for multiple images being taken per well were performed for A, D, and E.
The capacity to predict iPSC-RPE monolayer function and phenotype from QBAM images of iPSC-RPE was assessed next. For healthy donor iPSC-RPE, mean QBAM pixel value had little correlation with TER (Figure 3F, R2 = 0.19). However, the TER predictions by DNN-F highly correlated with actual TER values for the same samples (Figure 3G, R2 = 0.97) and these predictions had a RMSE of 70.6 Ω·cm2. To incorporate this methodology into a biomanufacturing setting, a TER of 400 Ω·cm2 was used as a stringent threshold to classify iPSC-RPE monolayers as immature (<400 Ω·cm2) or mature (>400 Ω·cm2). Red-shaded regions in Figure 3F indicate TER values associated with immature iPSC-RPE, and red-shaded regions in Figure 3G indicate false positives and negatives. Based on this TER threshold, the DNN-F was 94% accurate, sensitivity was 100%, and specificity was 90% for classifying iPSC-RPE maturity. Similar trends were observed for VEGF-ratios, where the polarized release of VEGF did not correlate well with QBAM mean pixel value (Supplemental Figure 4, A and B), but DNN-F predictions correlated highly with VEGF-ratio measurements (R2 = 0.89) and the RMSE of the VEGF-ratio predictions was less than 1.0 (Supplemental Figure 4C). The accuracy, sensitivity, and specificity of the VEGF-ratio were all 100% (Supplemental Figure 4C; samples with VEGF-ratio < 3.0 were considered immature). From these experiments, we conclude that (a) QBAM images of living cells can be used to predict TER and VEGF-ratios with high fidelity and (b) QBAM imaging could be used as a noninvasive means of functional validation of cells in lieu of measuring TER and/or VEGF-ratio.
Extraction of single-cell features from live QBAM images of iPSC-RPE monolayers.
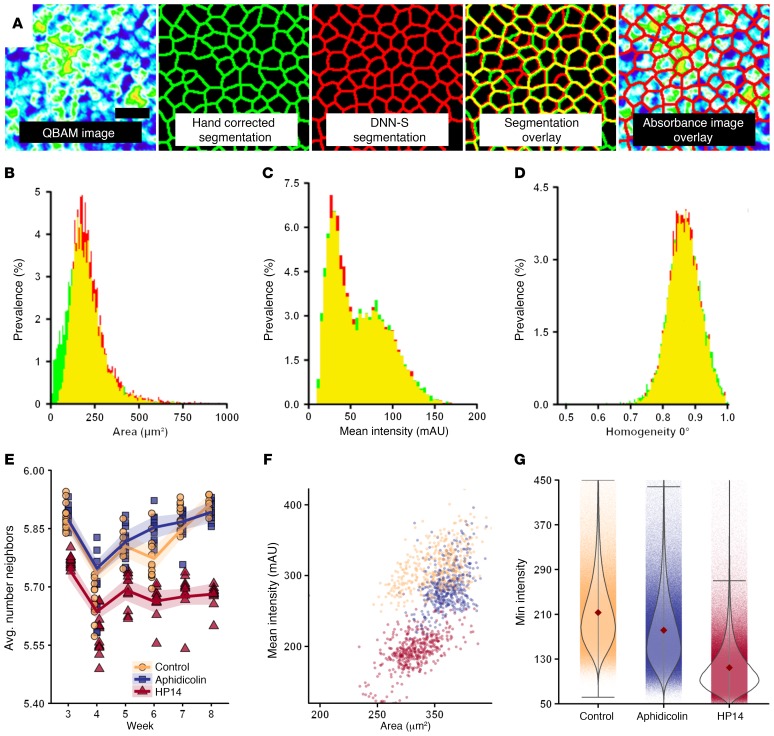
DNNs are known to have superior predictive power relative to other machine-learning algorithms, but it is difficult to determine what image features DNNs use to make predictions. To understand which cell image parameters of iPSC-RPE predict monolayer function, image features of individual iPSC-RPE cells in QBAM images were calculated and used to train TML algorithms to predict iPSC-RPE function. A DNN was created to segment individual living iPSC-RPE cells in QBAM images (DNN-S; Figure 4A). The DNN-S segmentation was validated by comparing cell features calculated from 12,750 iPSC-RPE with the same cell features calculated from ground-truth hand segmentations (Figure 4B; histograms show cell features from hand corrected and DNN-S segmentations). A comparison of 44 different features for DNN-S versus hand-corrected segmentations (Supplemental Figure 5 and Supplemental Table 2) showed a difference of 7.94% ± 4.42% (mean ± SD) between the feature histograms with good pixel-wise agreement (F-2 = 0.71) (Table 1).
Figure 4. DNN segmentation of iPSC-RPE in QBAM images.
(A) A DNN (DNN-S) was constructed to segment iPSC-RPE cells in absorbance images. To train the DNN, iPSC-RPE monolayers were fluorescently labeled for cell borders (ZO-1) and registered to absorbance images for hand labeling of cell borders. Scale bar: 25 μm. (B–D) A comparison of 3 of 42 cell feature histograms for hand segmented (green) and DNN segmented (red) images, where yellow is the overlap in the histograms. (E) Time course of the average number of cells bordering each cell for an entire well. Shaded region represents 95% SEM. Twelve wells per time per treatment are shown. (F) A scatterplot of mean cell area and mean intensity (absorbance) for each treatment group assessed for each microscope FOV. Each dot represents 1 of 864 fields of view (12 wells per treatment, 12 images per well, 6 time points). (G) Minimum intensity (absorbance) found for individual cells as a function of treatment. Whiskers represent 3 times SD and single dots behind the violin represent individual cells measured. n = 3,871,106 cells for control; n = 3,831,362 cells for aphidicolin; n = 4,146,927 cells for HPI4. A complete set of feature histogram comparisons is presented in Supplemental Figure 5, and results of statistical tests are in Supplemental Table 2. Red diamond indicates the mean.
Table 1. Analysis of all feature histograms to determine the difference between cell features in hand-corrected images compared with DNN segmented images.
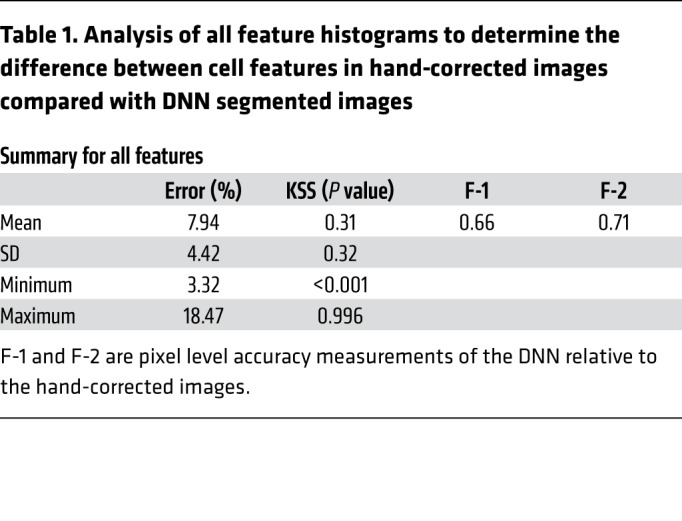
QBAM imaging and live-cell segmentation allow for hundreds of cell-image features to be measured and tracked noninvasively on individual cells throughout iPSC-RPE maturation. Thus, the trained DNN-S was used to segment QBAM images of living iPSC-RPE (healthy-1 and healthy-2 donors) treated with aphidicolin, HPI-4, or nothing (control). Previously published cell image features (22–24) and intensity metrics (20) known to correlate to RPE maturation and health were then assessed for significance. Figure 4C shows the average number of neighbors (22, 23) each iPSC-RPE cell had as a function of drug treatment and shows that HPI4 had a significantly lower (P < 0.001) mean number of neighbors across all time points. Importantly, this method allows for unprecedented hierarchical granularity to the data; enabling not just whole well “bulk” tissue measurements (Figure 4C), but also as a function of FOV, as shown in Figure 4D, or at an individual cell level, as shown in Figure 4E. Figure 4F shows clustering of treatments based on 2 features known to be important to RPE maturation and health, cell area (22, 24) and mean cell intensity (20). Figure 4Gshows cell minimum intensity, a new metric related to iPSC-RPE function identified using TML in Figure 4G. These results demonstrate (a) the accuracy of the DNN-S segmentation with respect to hand-drawn segmentations of individual cells and show that (b) the differences between iPSC-RPE treated with different molecules can be determined from discrete cell features.
Single-cell image features can predict iPSC-RPE maturation and function.
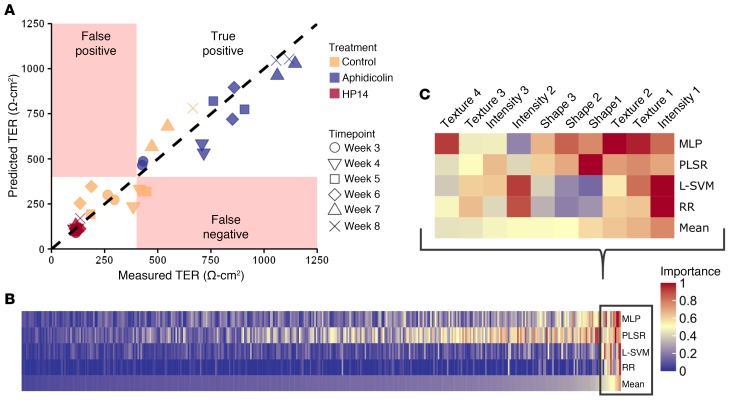
Five different TML methods (multilayer perceptron [MLP]; linear support vector machine [L-SVM]; random forest [RF]; principle least squares regression [PLSR]; and ridge regression [RR]) were used to predict TER and VEGF-ratios from the healthy-2 donor iPSC-RPE using cell features obtained from cell-border segmentations of QBAM images. Figure 5A shows TER predictions for the MLP, the most accurate TML approach (RMSE = 84.7 Ω·cm2 and R2 = 0.94). The red shaded regions represent false positives/negatives when using 400 Ω·cm2 as a quality assurance (QA) or quality control (QC) threshold. The MLP had an accuracy of 94%, sensitivity of 100%, and specificity of 90% (Supplemental Figure 6A). However, a comparison of all algorithms (Table 2 and Supplemental Figure 6A) showed the DNN-F was the most accurate predictor of TER, with the MLP’s RMSE being 14.1 Ω·cm2 higher than DNN-F (Table 2). For VEGF-ratio predictions, RF was the best TML method (RF, Supplemental Figure 6B), but DNN-F had a 1.4× lower RMSE (Supplemental Figure 6C).
Figure 5. Traditional machine-learning algorithms’ ability to predict iPSC-RPE function (healthy-2) from cell-image features isolated by segmentations of QBAM images.
(A) Plot of TER predictions from MLP against the measured TER (R2 = 0.94, black dashed line represents a perfect prediction from the MLP). Red regions indicate areas that would be less than 400 Ω·cm2, which was set as the lot release criteria for these cells. n = 12 replicate wells per treatment and 12 images per replicate. (B) Heatmap of all cell images feature importance sorted by mean importance across all features. (C) Top 10 most important features from the heatmap in B enlarged so that individual classes of features could be identified. Red indicates most important features for predicting cell TER, while blue indicates the least important features. See also Supplemental Figure 6.
Table 2. RMSE of each TML algorithm as compared with actual measures of the cells.
The benefit of predicting iPSC-RPE monolayer function from cell features is the ability to determine single-cell characteristics that indicate tissue-level function. For each TML method, cell features were ranked by importance. When comparing all TML models, there was similarity in the most important features for predicting TER (Figure 5, B and C) or VEGF-ratio regardless of which TML method was used. Interestingly, key cell image features for predicting TER were spread across intensity, texture, and shape of cells (Figure 5B) Of the 10 most important features, 3 related to the shape of cells, 3 to the intensity of pigment within cells, and 4 described the distribution of pigment within RPE (texture). Supplemental Table 3 and the online data (see details in regarding data and software availability in the Methods section) shows what metrics specifically these features represent and their 95% CI for each time point and drug treatment.
Taken together, the above indicates that using live-cell segmentation, feature extraction, and TML, tissue TER, and VEGF-ratio can be predicted with a level of accuracy approaching the prediction accuracy of DNNs to analyze QBAM images. The benefit to TML methods compared with DNNs is that TML models can identify discrete cell features that indicate iPSC-RPE monolayer function. This allows manufacturers and clinicians to better understand the models, determine why a culture has been predicted to have low function, and perhaps develop mitigation strategies based on the parameters that have shown to be predictive of the phenotype.
Accuracy of function predictions is robust across multiple clinical-grade AMD patient–derived iPSC-RPE.
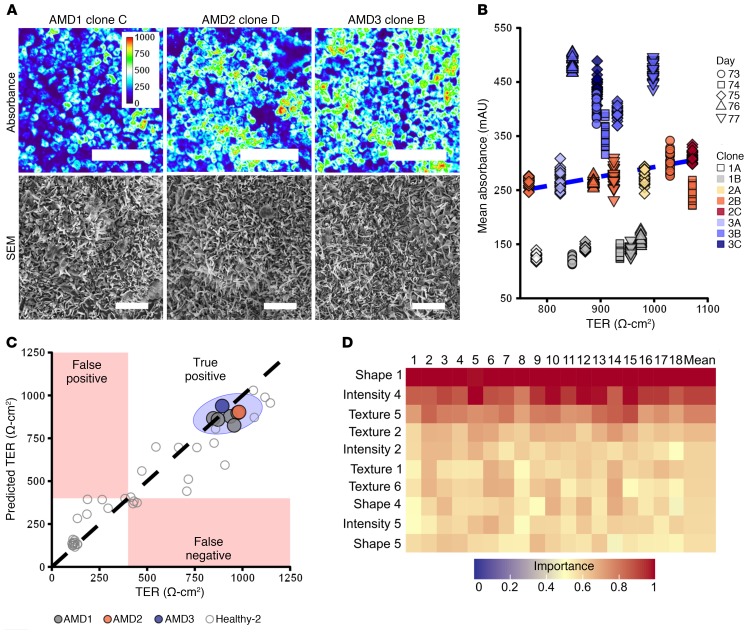
To determine whether the methodology was robust across multiple donors and multiple preparations, DNN-F and TMLs were used to predict TER and VEGF-ratios of clinical grade iPSC-RPE from 3 AMD patients across 8 iPSC clones. Figure 6A shows representative absorbance images of 1 iPSC-RPE sample from each of the AMD donors and corresponding SEM images of iPSC-RPE apical processes, confirming iPSC-RPE polarized phenotype. Monolayer maturation was assessed by TER (Figure 6B) and VEGF-ratio (Supplemental Figure 7A) as well as the assays shown in Sharma et al. (25). Mean QBAM pixel values of iPSC-RPE were measured for fully mature AMD-iPSC-RPE. As with the healthy donors, mean absorbance did not correlate well with TER (Figure 7B, R2 = 0.015) or VEGF-ratio (Supplemental Figure 7A, R2 = 0.50). However, the RF model was able to predict TER to a similar degree of accuracy (RMSE = 70.9 Ω·cm2, R2 = 0.92) as seen with healthy donors (Table 2). DNN-F was also used to model TER, and the predicted versus actual values correlated well (R2 = 0.91, Supplemental Figure 7B).
Figure 6. Prediction of cell TER from 8 AMD iPSC-RPE cell lines derived from 3 separate donors.
(A) Representative QBAM image and SEM image of day-75 iPSC-RPE from 1 clone from each donor. (B) Mean absorbance as assessed by QBAM imaging versus TER for n = 8 clones (3 replicate measures) across the last 5 days of cell maturation; blue dotted line represents linear best fit for these cells. (C) RF prediction of iPSC-RPE function across 3 clones that the algorithm had not seen previously. The black dashed line represents a perfect prediction. A 95% CI is shown as the blue region. (D) Heatmap of the important cell image features for predicting iPSC-RPE TER across 18 different clone combinations sorted by mean feature importance across all clone combinations. The top 10 cell image features of 315 analyzed are shown. Red indicates most important features, while blue represents least important features. Scale bars: 100 μm (A, top panels); 5 μm (A, bottom panels). Color calibration bar is shown in milli-absorbance units. See also Supplemental Figure 7 and Supplemental Table 4.
Figure 7. Identification of iPSC-RPE monolayer developmental outliers and donor identity using only QBAM images and either DNNs or TML algorithms.
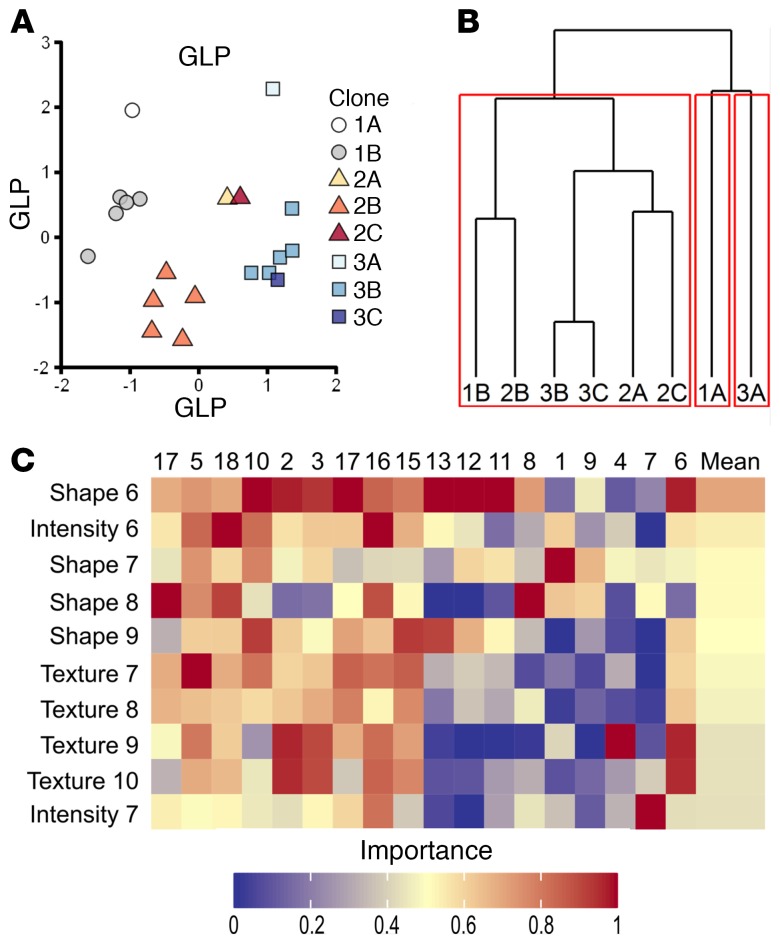
(A) Principle component analysis of the first principle component versus the second principle component of cell image features from QBAM images of all clones. (B) Hierarchical cluster of all clones to show similarity of clones from 3 donors; red boxes indicate the 3 least related groups from the total population. (C) Heatmap of all 18 clone combinations of all cell image features important for the L-SVM to classifying cell identity. The top 10 cell image features are shown (of 315); red indicates the features most important to predicted cell identity, while blue indicates the features least important. n = 8 clones with 3 replicate measures
To further assess the robustness of the methodology, TML models were trained on different combinations of AMD-iPSC-RPE monolayers. A total of 18 unique training image subsets were formed, where each image subset contained test data that had images of 1 iPSC-RPE sample from each donor (Supplemental Table 4 shows all combinations in detail). The mean TER RMSE was 86.9 Ω·cm2 ± 14.3 Ω·cm2 (Supplemental Table 4) across all clone subsets, showing that the prediction error was similar when scaled to a larger donor subset (8 AMD-iPSC-RPE samples; Figure 6) as compared with a single sample (healthy-2; Figure 5). From the measured and predicted values, a 95% CI was constructed and is shown as the blue regions in Figure 6C and Supplemental Figure 7C. iPSC-RPE falling outside of this region could be considered as “out of specification” in a biomanufacturing environment and would be recommended for further testing.
Finally, the most important cell features for predicting AMD-iPSC-RPE monolayer TER (Figure 6D) and VEGF-ratio across all donor/sample combinations were assessed to determine whether features used to predict AMD-iPSC-RPE function were similar to those of healthy-2 (Figure 5). Interestingly, only 4 features overlapped between these 2 groups: Zernike n4-m0 polynomial (shape 1), mass displacement (intensity 2), and the third inverse difference moment at 135° (texture 2) and at 45° (texture 1). Overall, the models derived from the clinical grade iPSC-RPE images were able to predict iPSC-RPE phenotype across multiple donors/samples and to determine the common cell-image features of living cells across multiple donors that predict iPSC-RPE monolayer function. Further, the differences in the feature importance from healthy-2 and the AMD-iPSC-RPE suggest there might be both donor-specific features for predicting function and features that are common to multiple donors.
Classification of developmental outliers and identity of iPSC-RPE donors using QBAM.
QBAM images were used to determine whether there were any developmental outliers based on cell-image features in the 8 clinical grade iPSC-RPE samples from 3 AMD patients. Developmental outliers are defined as an intradonor comparison in which iPSC-RPE monolayers that are different from other iPSC-RPE monolayers based on cell image features may warrant additional analysis to determine whether the monolayer developed properly. Figure 7A shows the principle component analysis of cell-image features from the QBAM images of the AMD donor/sample preparation. iPSC-RPE derived from a given donor clustered well together based on cell-image features, except AMD1 clone A (1A) and AMD3 clone A (3A), as identified in the hierarchical dendrogram of the PCA shown in Figure 7B. Analysis of clone 1A iPSC-RPE showed 894 changes in the oncoexome as compared with the starting donor material as shown by Sharma et al. (25). Clone 3A iPSC-RPE was found to have a lower pigment level than its “sibling” iPSC-RPE (Figure 6B). When the cell-image features were analyzed, the cell pigmentation and shape were found to be the 2 most dominant feature classes in identifying these iPSC-RPE as outliers; a full description of features can be seen in the online dataset (http://isg.nist.gov/deepzoomweb/data/RPEimplants).
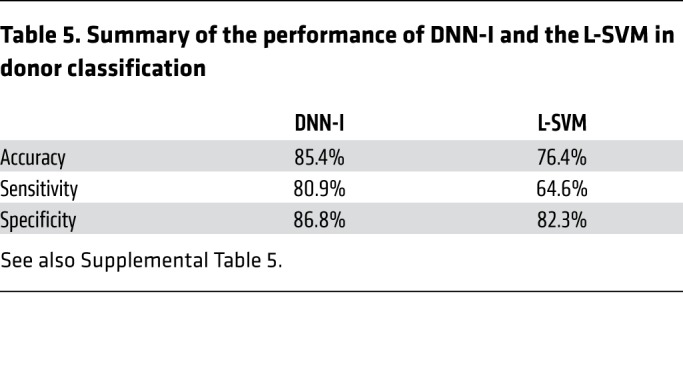
For each iPSC-RPE monolayer, the cell donor identity was predicted from QBAM images using multiple TML models. Additionally, a new DNN (DNN-I) was developed to determine whether 2 different iPSC-RPE images had the same identity (Tables 3 and 5). Donor identity is defined as an interdonor comparison to determine which images came from which donor (TML models) or to identify whether 2 images were from the same donor (DNN-I). The TML algorithms took the features derived from QBAM images as an input and gave a donor identification as an output. In comparison, DNN-I took 2 QBAM images as an input and classified the images as coming from the same or different donors. The TML approach was able to classify the donor identity of RPE cells derived from new clones of a donor when it had been trained on images of RPE cells derived from other clones of that same donor; it was not able to classify “new” donors that were not present in the training data. The DNN-I strategy for binary classification of 2 images as “same” or “not same” gives the DNN-I the potential to classify “new” donors that were not used during training. L-SVM was found to have the highest accuracy of all TML algorithms tested (Supplemental Table 5), with an accuracy of 76.4% (2.3× random chance), a sensitivity of 64.6%, and a specificity of 82.3%. Across all donor/sample combinations, DNN-I had better performance with an accuracy of 85.4% (2.6× random chance), a sensitivity of 80.9%, and a specificity of 86.8% (Tables 3 and 4). Interestingly, cell-image features that were key to distinguishing AMD iPSC-RPE from each other were similar across different iPSC-RPE combinations (Figure 7C) and consisted of features that were different from the features used to identify tissue function (compare Figure 5, B and C, with Figure 7C) and developmental outliers. A general difference between the top 50 features used in each application were as follows: shape features were important to identify clones as outliers (23 of the top 50 features); texture features were important for donor classification of clones (25 of the top 50 features); and shape and texture features were important to classify iPSC-RPE function (40 of the top 50 features).
Table 3. Classifying DNN (DNN-I) binary classification performance when determining whether 2 images were from the same donor or not.
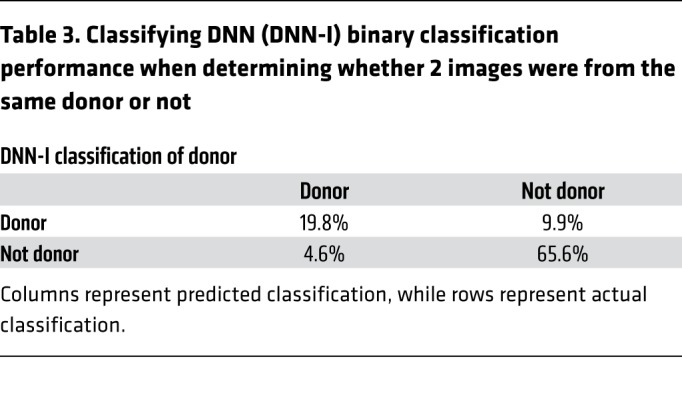
Table 4. L-SVM classification performance when determining which donor a QBAM image of an iPSC-RPE clone was from, having never seen images from that clone previously.
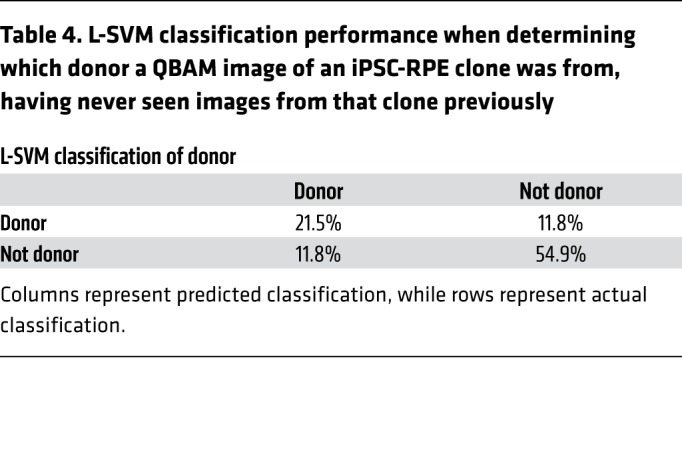
Table 5. Summary of the performance of DNN-I and the L-SVM in donor classification.
Discussion
Absorbance imaging.
Data inputs are critical to successful analysis. Thus, the methodology developed here starts with a rigorous, reproducible absorbance imaging method using a bright-field microscope. Absorption imaging has been reported in the literature (26–28), but the QBAM technology developed here can be implemented on any standard bright-field microscope, and it uses real-time, automated, statistically robust methods to provide high confidence in image quality and reproducibility. The advantage to using absorbance rather than raw pixel intensities is that absorbance is an absolute measure of light attenuation (29). Raw pixel intensities can vary with microscope configuration and settings (e.g., uneven lighting, bulb intensity and spectrum, camera, etc.) that make comparison of images difficult even when the images are captured on the same microscope. Converting to absorbance values overcomes many issues related to image reproducibility (explained in more detail in Methods). The combination of automation, converting pixel intensities to absorbance values, calculating absorbance confidence, and establishing microscope equilibrium through benchmarking ensures the quality of image data captured with QBAM.
The robustness of QBAM was validated in 3 systems to ensure the measurement could be used in multiple circumstances: (a) synthetic standards (Figure 2, A and B), (b) healthy biological samples (Figure 2C and Supplemental Figure 3), and (c) drug-induced models of iPSC-RPE maturity (Figure 3 and Supplemental Figure 3). Analysis of the QBAM images showed absorbance values agreed with “known” synthetic standards and could assess the development of pigment in both healthy and diseased RPE. The results shown in Figure 2 and Supplemental Figure 3 also highlight the robustness of the measurement across multiple microscopes or imaging configurations. Errors between different microscope measurements of the same sample were within 4.4% of the signal as compared with an average error of 31% on reference standards for VEGF ELISAs (30) and 100% for TER measurements in epithelium (31). This represents 1 to 2 orders of magnitude reduction in variability for a potential release assay for a cell-therapy product or when used in a drug screening methodology.
QBAM is optimized for determining absorbance for cell types that absorb light. However, results with nonpigmented (severe) albinism cells indicate possible applications on other nonpigmented cell types. Due to the signal-to-noise ratio in these cells being over twice the lower limit of detection, we hypothesize that either absorbance or transmittance data could be broadly applicable to any cell type in culture. Therefore, it may be suitable for assays in which light absorbance is used, such as viable cell counting using trypan blue staining, histological staining, or analysis of light-absorbing biological specimens such as pigmented skin cells or dopaminergic neurons that express neuromelanin. In cases in which transmittance values may be preferred, such as histology, the statistics can be modified to generate reproducible images of tissue sections. Also, this methodology is generalizable to any multispectral modality, since none of the calculations are wavelength specific. Finally, we expect that the methods could be suitable for hyperspectral autofluorescent imaging that can identify cell borders and subcellular organization in nonpigmented cells (32).
Prediction of iPSC-RPE function.
Neural networks and machine-learning algorithms were trained with a full range of cell phenotypes by using healthy iPSC-RPE and drugs that were known to inhibit (HPI4) and promote (aphidicolin) iPSC-RPE maturation (21). Having diverse phenotypes in the training set enhanced the robustness of the algorithms, as was expected from the literature (18). Additionally, the method worked on 2 different donors, not only as an end-point assay of tissue health, but also as a noninvasive tool for tracking tissue development during the long maturation period (approximately 35 days) (33). Importantly, the accuracy of the algorithms in predicting both TER and VEGF-ratio was close to the measurement uncertainty for both TER (31) and VEGF (30, 34). The generalizability of such metrics across cell lines, regardless of donor, adds to the broad utility of this work, as here we show that even with a limited data set, strong predictive ability, regardless of donor and clone, was shown (Figure 5).
The cut-off ratios for biomanufacturing, 400 Ω·cm2 for TER and 3.0 for VEGF-ratio, were chosen according to the literature (33, 35, 36). However, it is important to note that similar accuracies, sensitivities, and specificities were found when assessing a range of TER values from 200 Ω·cm2 to 1000 Ω·cm2 or VEGF-ratio from 1 to 5 and that thresholds should be set according to the manufacturer’s specifications. In this study, we observed a higher prediction error for the iPSC-RPE from healthy-2 compared with the prediction error of iPSC-RPE from multiple AMD donors. We hypothesize 2 reasons for this: (a) healthy-2 iPSC-RPE had a wider range of both TER and VEGF-ratio values due to the inclusion of positive and negative controls than did AMD-iPSC-RPE, which were manufactured using a cGMP-based process with the goal of reproducibly manufacturing healthy mature iPSC-RPE monolayers. (b) The AMD-iPSC-RPE had a larger data set for training, as it included all healthy-2 data as well as the training data from the AMD-iPSC-RPE. In machine learning, more data generally leads to more accurate models; however, implementation of our methodology in any application should give special consideration to ensuring a wide range of conditions (i.e., more donors and positive/negative controls) for training than presented in this proof-of-principle study to ensure the robustness of the model.
As expected, deep learning had a lower RMSE of prediction for both TER and VEGF-ratio as compared with the TML approaches. However, using TML approaches allowed discovery of important cell image features (Figure 5B and Figure 6D). These 2 approaches were chosen because we perceive 2 motivations for cellular product manufacturers, regulators, clinicians, and/or researchers. Motivation 1 is as follows: often in manufacturing, clinical settings, or high-throughput screens, time is a critical factor and a clear “go/no-go” or simple readout is desired. In these cases, algorithms that provide the highest accuracy and are most robust to noise should be used, and deep learning is an excellent tool for this application (13, 18). Motivation 2 is as follows: frequently in research, insight into underlying mechanisms of function are important. In these cases, more scrutable methods in which the importance of cell-image features can be determined are necessary. For this motivation TML approaches are desirable because their underlying architecture is simple enough to be understood and the importance of factors (here cell image features) to predicting tissue function can be obtained.
Feature extraction from QBAM images led to hundreds of features based on the shape, intensity and texture of cells at both the single-cell level and across larger cell populations. Many of these features are mathematical abstractions that lack meaningful connection to cell function. Therefore, even though TML models may be more interpretable than DNNs, the features that compose these models may not be relatable to the underlying biology (37–39). Nonetheless, for cell-manufacturing purposes, what these features are and how they relate to the underlying biology are less important than being able to identify their 95% CI and ensuring that future batches/clones from donors fall within this range, making their use here in TML models relevant regardless of their relationship to the underlying biology.
Identification and clustering of iPSC-RPE from clinically relevant donors.
Currently, there is a critical need to develop a noninvasive, clinically compatible assay to confirm the quality of cell-therapy products just prior to implantation. The PCA and cluster analysis shown in Figure 7, A and B, could serve this unmet need. Using this approach, or similar clustering techniques, the similarity of the to-be-implanted article to other technical replicates (or previous successful manufactured batches) can be noninvasively assessed for the first time. Additionally, the donor identification work done using DNN-I or the L-SVM shown in Tables 3–5 and Figure 7C can serve as a QA/QC step to detect simple culture errors, such as switched wells or a flipped plate, and to match identity of this implant to other replicates from the same donor. This will be especially important in a facility that manufactures thousands of autologous therapeutics and must confirm the identity of each patient’s dose. However, to determine a donor’s identity (as with the L-SVM), a reference differentiation and image data set is needed for each patient line generated. This can be partially mitigated by using longitudinal imaging sets during the first culture; however, these models will necessarily be less robust, as the training data will be limited.
The two most important features to identifying the developmental outliers in Figure 7, A and B, can be seen in Supplemental Figure 7E and were the SD of the maximum intensity (intensity 8) of the iPSC-RPE and the Zernike n5-m3 polynomial (shape 10). The deviation of the max intensity parameter agrees well with absorbance results showing that AMD3 clone A–derived iPSC-RPE had a lower absorbance than iPSC-RPE derived from other clones of AMD3. Zernike polynomials have been useful for detecting invasive cancer cell shapes (40) and in classifying tumors (41), which leads us to hypothesize these polynomials are also critical to detecting a difference between AMD1 iPSC clone A RPE, which had 894 oncoexome sequence alterations (25), and iPSC-RPE derived from other AMD clones/donors. We acknowledge that the cluster analysis performed in Figure 7B is not a conclusive proof that the development of oncogene sequence alterations can be identified with only QBAM imaging. However, in a cell therapy manufacturing setting, cluster analysis could be used to screen individual therapy replicates to determine whether there are outliers that might need additional scrutiny. Also, because the assay is noninvasive, this information will provide surgeons with additional confidence in the quality of the actual transplant being delivered to the patient, which has not been possible previously.
In conclusion, the methodology presented here shows that QBAM imaging can be used to assess the pigmentation development of healthy and diseased iPSC-RPE noninvasively. DNNs can analyze these images and accurately predict cell TER and VEGF-ratio across 10 different iPSC-RPE preparations. Additionally, QBAM images contain sufficient information to allow DNNs to accurately segment cell borders of live RPE cells. Once segmented, hundreds of features can be calculated per cell, and using these features, cell function can be predicted, outlier samples can be identified, and donor identity can be confirmed. All of this information can be obtained on the tissue that is being implanted into the patient with an automated bright-field microscope, without the need for expertise from a clinician, in just minutes. Thus, QBAM has potential application in a biomanufacturing setting where thousands of manufactured RPE units could be noninvasively tested and qualified for clinical use by a technician.
Methods
A complete Methods section is provided in the Supplemental Materials. Below is an abbreviated Methods section.
QBAM.
We developed a method of determining absorbance values from bright-field images called QBAM. The basic principle of QBAM imaging is absorbance, which is an absolute measurement of light attenuation. Absorbance is calculated using QBAM by capturing an image with the light off, then a second image with the light on but no sample on the stage, and finally an image of the sample. These 3 images are then used to calculate absorbance of every pixel in the image of the sample. To make the method microscope independent, it includes a protocol of benchmarking a microscope to ensure accuracy of the measurement. Statistical criteria were developed to ensure accurate measurements of absorbance based on metrics obtained from benchmarking. The statistical criteria define the number of images that must be captured to ensure an accuracy of 0.01 absorbance units and are calculated in real time as images are captured. If image data do not meet the criteria, then additional images are captured until there is sufficient information to obtain an accurate measurement. A thorough description of this method is provided in the Supplemental Methods.
Culture, assays, and imaging of iPSC-RPE.
After differentiation, healthy-1 and healthy-2 iPSC-RPE were placed on fresh Transwell plates for maturation. Beginning 2 weeks or 1 week from the start of the culture, iPSC-RPE were exposed to aphidicolin, HPI4, or neither drug. On the same day that cells were exposed to 1 of the 3 experimental conditions, cells were imaged weekly using QBAM for the duration of cell culture (8 weeks of total culture). A total of 12 images were captured in each well (4 × 3 overlapping grid, 1%–15% overlap). On the same day that cells were imaged, TER was measured and supernatant was collected to measure cytokine release (VEGF).
DNNs.
Three main DNNs were created for this work, and the development and training of each of them is described in detail in the Supplemental Methods. The first DNN (DNN-F) was trained to predict TER and VEGF release, where the input image was a 1024 × 1024 pixel, 3-color QBAM image and the output was a TER value and a VEGF value. The second DNN (DNN-S) was trained to identify borders of cells in QBAM images, where the input of the network was a 256 × 256 pixel, 3-color QBAM image and the output was a cell border segmentation. The third network (DNN-I) was trained to take 2 QBAM images of iPSC-RPE and determine whether the images came from the same donor. The training data for this network included iPSC-RPE from multiple donors prepared multiple times from iPSC reprogramming to maturation, and the network learned to identify iPSC-RPE from different preparations of the same donor.
Feature extraction and TML.
QBAM images segmented using DNN-S were used to extract cell features using the WIPP (19). A complete list of features is provided in Supplemental Table 1. Features were then used as inputs to traditional machine-learning algorithms (MLPs, PLSR, L-SVMs, RF). Details on preprocessing and training parameters are described in detail in the Supplemental Methods. Each of the traditional machine-learning algorithms was used to predict the same metrics of the DNNs (TER, VEGF, donor identity, not segmentation). The advantage of traditional machine-learning algorithms is that it is easier to identify specific cellular features that correlate to predicting cell function or identity.
Quantification and statistical analysis.
All significance between groups indicated for albino lines and for Figure 3, A, D, and E, was determined using a linear mixed effect model controlling for repeated measures from a single well over time and for multiple images being taken per well. These models were assessed using the multicomp and the nlme packages in R. R2 values, CIs, and Kolmogorov–Smirnov, F-1, and F-2 statistics were calculated in base R. P values of 0.005 or less were considered significant.
Study approval.
All iPSC lines were obtained from human subjects in IRB 11-EI-0245 protocol. A total of 15 iPSC-RPE cell lines, obtained from 10 different donors, were used in this paper. The iPSC-RPE lines were obtained from 3 types of patients: healthy, AMD patients, and OCA patients. The iPSC-RPE from healthy patients were derived from iPSC lines healthy-1 and healthy-2. The iPSC-RPE from AMD patients were referred to in the paper according to donor number and clone number. For example, AMD1A means the cells came from AMD donor no. 1 and clone A. The different clones for each donor were replicates, where each clone was completely replicated from generation of iPSCs to iPSC-RPE differentiation. The AMD clones were previously reported (25). A summary of the number of clones per donor is as follows: AMD1 had clone A and clone B; AMD2 had clone A, clone B, and clone C; and AMD3 had clone A, clone B, and clone C. The iPSC-RPE obtained from OCA patients (also referred to as albino patients) came from 5 different patients (a single clone each) and are indicated as OCA8, OCA26, OCA103, OCA9, and OCA71. All lines were provided via the NEI EYEGene intiative. No personally identifying information about patients was given from the EYEGene bank.
Data and software availability.
All image data used in this study is available online from the National Institute of Standards and Technology at the following address: http://isg.nist.gov/deepzoomweb/data/RPEimplants The QBAM method of collecting images on a microscope was implemented as a Micromanager plugin, and the source code for the plugin is available on Github: http://github.com/Nicholas-Schaub/SQuIRE The QBAM method of converting bright-field microscope images into absorbance values was implemented as an ImageJ plugin, and the source code is available on Github: http://github.com/Nicholas-Schaub/CARPE
Author contributions
NJS, NAH, CGS, PB, and KB conceived the study. NJS, NAH, PM, SP, PB, CGS, and KB developed the methodology. NJS, NAH, PM, SP, JC, MS, MO, and PB were responsible for software. NJS, NAH, PM, SP, and PB were responsible for validation. NJS, NAH, PM, SP, JC, and MS carried out formal analysis. NJS, NAH, PM, SP, QW, AG, and RS investigated. NJS, NAH, PM, SP, QW, AG, RS, JC, MS, PB, CGS, and KB contributed resources. NJS, NAH, PM, SP, and PB curated data. NJS and NAH wrote the original article draft, which NJS, NAH, CGS, PB, and KB reviewed and edited. NJS, NAH, and QW were responsible for visualization. CGS, PB, and KB supervised. Though both NJS and NAH contributed equally, NJS had worked on the project longer and thus was given the first author position.
Supplementary Material
Acknowledgments
The authors would like to thank the National Eye Institute Electron Microscopy core for help with transmitted electron microscopy micrographs, the National Heart, Lung, and Blood Institute flow cytometry core for the VEGF secretion measurement, and Arvydas Maminishkis for his insight in experimental design and imaging. We would like to give a special thanks to Davide Ortolan, Tareq Uddin, Nyusha Lin, Nikhil Etikela, Malika Nimmagadda, Peter Stewart, Helen Zhao, Marissa Coene, Tochi Ugweje, Jun Jeon, and Hannah Bush for their hard work manually segmenting cell borders. This work was supported by the National Institute of Standards and Technology under the computational science in metrology project, an NIH Common Fund Therapeutic Challenge Award to KB, and National Eye Institute IRP funds to KB. NJS was supported by the National Research Council Research Associateship Program and an NIH TEAM T32 tissue engineering training grant (2T32DE007057-41). Commercial products used in this work are only referenced to specify the experimental procedure adequately. Such identification of commercial products is not intended to imply recommendation or endorsement by the National Institute of Standards and Technology, nor is it intended to imply that the products identified are necessarily the best available for the purpose.
Version 1. 11/12/2019
In-Press Preview
Version 2. 01/21/2020
Electronic publication
Version 3. 02/03/2020
Print issue publication
Footnotes
Conflict of interest: The authors have declared that no conflict of interest exists.
Copyright: © 2020, American Society for Clinical Investigation.
Reference information: J Clin Invest. 2020;130(2):1010–1023.https://doi.org/10.1172/JCI131187.
See the related Commentary at Autologous cell replacement: a noninvasive AI approach to clinical release testing.
Contributor Information
Nicholas J. Schaub, Email: nick.schaub@nih.gov.
Nathan A. Hotaling, Email: nathan.hotaling@nih.gov.
Petre Manescu, Email: peter04xrt@gmail.com.
Sarala Padi, Email: Sarala.Padi@NIST.gov.
Qin Wan, Email: wanq@nei.nih.gov.
Ruchi Sharma, Email: ruchi.ruchi@nih.gov.
Aman George, Email: aman.george@nih.gov.
Joe Chalfoun, Email: Joe.Chalfoun@NIST.gov.
Mylene Simon, Email: Mylene.Simon@NIST.gov.
Mohamed Ouladi, Email: Mohamed.Ouladi@NIST.gov.
Peter Bajcsy, Email: Peter.Bajcsy@nist.gov.
Kapil Bharti, Email: kapil.bharti@nih.gov.
References
- 1.Mandai M, et al. Autologous induced stem-cell-derived retinal cells for macular degeneration. N Engl J Med. 2017;376(11):1038–1046. doi: 10.1056/NEJMoa1608368. [DOI] [PubMed] [Google Scholar]
- 2.Aijaz A, et al. Biomanufacturing for clinically advanced cell therapies. Nat Biomed Eng. 2018;2(6):362–376. doi: 10.1038/s41551-018-0246-6. [DOI] [PMC free article] [PubMed] [Google Scholar]
- 3.Giancola R, Bonfini T, Iacone A. Cell therapy: cGMP facilities and manufacturing. Muscles Ligaments Tendons J. 2012;2(3):243–247. [PMC free article] [PubMed] [Google Scholar]
- 4.Jones MK, Lu B, Girman S, Wang S. Cell-based therapeutic strategies for replacement and preservation in retinal degenerative diseases. Prog Retin Eye Res. 2017;58:1–27. doi: 10.1016/j.preteyeres.2017.01.004. [DOI] [PMC free article] [PubMed] [Google Scholar]
- 5.Arora S, et al. Analysis of human retinal pigment epithelium (RPE) morphometry in the macula of the normal aging eye. Invest Ophthalmol Vis Sci. 2013;54(15):2014. [Google Scholar]
- 6. Mazzitello KI, et al. Druse-induced morphology evolution in retinal pigment epithelium. http://arxiv.org/abs/1609.04496 Posted on arXiv September 15, 2016.
- 7.Rashid A, et al. RPE cell and sheet properties in normal and diseased eyes. Adv Exp Med Biol. 2016;854:757–763. doi: 10.1007/978-3-319-17121-0_101. [DOI] [PMC free article] [PubMed] [Google Scholar]
- 8.da Cruz L, et al. Phase 1 clinical study of an embryonic stem cell-derived retinal pigment epithelium patch in age-related macular degeneration. Nat Biotechnol. 2018;36(4):328–337. doi: 10.1038/nbt.4114. [DOI] [PubMed] [Google Scholar]
- 9. Thumann G, Dou G, Wang Y, Hinton DR. Chapter 16. Cell Biology of the Retinal Pigment Epithelium A2. In: Retina, 5th Ed. London, United Kingdom: W.B. Saunders; 2013:401–414. [Google Scholar]
- 10.Bonilha VL. Retinal pigment epithelium (RPE) cytoskeleton in vivo and in vitro. Exp Eye Res. 2014;126:38–45. doi: 10.1016/j.exer.2013.09.015. [DOI] [PubMed] [Google Scholar]
- 11.Buggenthin F, et al. An automatic method for robust and fast cell detection in bright field images from high-throughput microscopy. BMC Bioinformatics. 2013;14:297. doi: 10.1186/1471-2105-14-297. [DOI] [PMC free article] [PubMed] [Google Scholar]
- 12.Meijering E. Cell segmentation: 50 years down the road. IEEE Signal Process Mag. 2012;29(5):140–145. doi: 10.1109/MSP.2012.2204190. [DOI] [Google Scholar]
- 13.Litjens G, et al. A survey on deep learning in medical image analysis. Med Image Anal. 2017;42:60–88. doi: 10.1016/j.media.2017.07.005. [DOI] [PubMed] [Google Scholar]
- 14. Guo W, Xu Y, Feng X. DeepMetabolism: a deep learning system to predict phenotype from genome sequencing. http://arxiv.org/abs/1705.03094 Posted on arXiv May 8, 2017.
- 15. Abadi M, et al. TensorFlow: Large-scale machine learning on heterogeneous distributed systems. http://arxiv.org/abs/1603.04467 Posted on arXiv March 14, 2016.
- 16. Awan AA, Hamidouche K, Hashmi JM, Panda DK. S-Caffe: Co-designing MPI runtimes and caffe for scalable deep learning on modern GPU clusters. Paper presented at: 22nd ACM SIGPLAN Symposium on Principles and Practice of Parallel Programming; February 8, 2017; Austin, Texas, USA. http://ppopp17.sigplan.org/info/list-of-accepted-papers Accessed November 25, 2019.
- 17. Wolf L, Hassner T, Maoz I. Face recognition in unconstrained videos with matched background similarity. Paper presented at: IEEE Conference on Computer Vision and Pattern Recognition; June 20–25, 2011; Colorado Springs, Colorado, USA. https://www.cs.tau.ac.il/~wolf/ytfaces/WolfHassnerMaoz_CVPR11.pdf Accessed November 25, 2019.
- 18. Cho Y, Bianchi-Berthouze N, Julier SJ. DeepBreath: Deep learning of breathing patterns for automatic stress recognition using low-cost thermal imaging in unconstrained settings. Paper presented at: Seventh International Conference on Affective Computing and Intelligent Interaction (ACII); October 23–26, 2017; San Antonio, Texas, USA. http://acii2017.org/accepted_papers Accessed November 25, 2019.
- 19. Bajcsy P, Chalfoun J, Simon M. Web Microanalysis of Big Image Data. Basel, Switzerland: Springer International Publishing AG; 2018: [Google Scholar]
- 20.Kamao H, et al. Objective evaluation of the degree of pigmentation in human induced pluripotent stem cell-derived RPE. Invest Ophthalmol Vis Sci. 2014;55(12):8309–8318. doi: 10.1167/iovs.14-14694. [DOI] [PubMed] [Google Scholar]
- 21.May-Simera HL, et al. Primary cilium-mediated retinal pigment epithelium maturation is disrupted in ciliopathy patient cells. Cell Rep. 2018;22(1):189–205. doi: 10.1016/j.celrep.2017.12.038. [DOI] [PMC free article] [PubMed] [Google Scholar]
- 22.Bhatia SK, et al. Analysis of RPE morphometry in human eyes. Mol Vis. 2016;22:898–916. [PMC free article] [PubMed] [Google Scholar]
- 23.Ach T, et al. Quantitative autofluorescence and cell density maps of the human retinal pigment epithelium. Invest Ophthalmol Vis Sci. 2014;55(8):4832–4841. doi: 10.1167/iovs.14-14802. [DOI] [PMC free article] [PubMed] [Google Scholar]
- 24.Jiang Y, et al. Analysis of mouse RPE sheet morphology gives discriminatory categories. Adv Exp Med Biol. 2014;801:601–607. doi: 10.1007/978-1-4614-3209-8_76. [DOI] [PMC free article] [PubMed] [Google Scholar]
- 25.Sharma R, et al. Clinical-grade stem cell-derived retinal pigment epithelium patch rescues retinal degeneration in rodents and pigs. Sci Transl Med. 2019;11(475):eaat5580. doi: 10.1126/scitranslmed.aat5580. [DOI] [PMC free article] [PubMed] [Google Scholar]
- 26.Isono T, et al. Scan-free absorbance spectral imaging A(x, y, λ) of single live algal cells for quantifying absorbance of cell suspensions. PLoS ONE. 2015;10(6):e0128002. doi: 10.1371/journal.pone.0128002. [DOI] [PMC free article] [PubMed] [Google Scholar]
- 27.Lee JY, et al. Absorption-based hyperspectral imaging and analysis of single erythrocytes. IEEE J Sel Top Quantum Electron. 2012;18(3):1130–1139. doi: 10.1109/JSTQE.2011.2164239. [DOI] [Google Scholar]
- 28.Rieck J, Juuti-Uusitalo K, Autio R, Hytönen V, Skottman H. Quantitative pigment extraction analysis for human pluripotent stem cell derived retinal pigment epithelial cells. IFMBE Proceedings. 2017;65:61–64. doi: 10.1007/978-981-10-5122-7_16. [DOI] [Google Scholar]
- 29.Abitan H, Bohr H, Buchhave P. Correction to the Beer-Lambert-Bouguer law for optical absorption. Appl Opt. 2008;47(29):5354–5357. doi: 10.1364/AO.47.005354. [DOI] [PubMed] [Google Scholar]
- 30.Robinson CJ, Das RG, Stammers R, Rafferty B. The World Health Organization reference reagent for vascular endothelial growth factor, VEGF165. Growth Factors. 2006;24(4):285–290. doi: 10.1080/01674820601051034. [DOI] [PubMed] [Google Scholar]
- 31.Tosoni K, Cassidy D, Kerr B, Land SC, Mehta A. Using drugs to probe the variability of trans-epithelial airway resistance. PLoS ONE. 2016;11(2):e0149550. doi: 10.1371/journal.pone.0149550. [DOI] [PMC free article] [PubMed] [Google Scholar]
- 32.Valm AM, et al. Applying systems-level spectral imaging and analysis to reveal the organelle interactome. Nature. 2017;546(7656):162–167. doi: 10.1038/nature22369. [DOI] [PMC free article] [PubMed] [Google Scholar]
- 33.Miyagishima KJ, et al. In pursuit of authenticity: induced pluripotent stem cell-derived retinal pigment epithelium for clinical applications. Stem Cells Transl Med. 2016;5(11):1562–1574. doi: 10.5966/sctm.2016-0037. [DOI] [PMC free article] [PubMed] [Google Scholar]
- 34.Jansen F, et al. Assessment of the repeatability and border-plate effects of the B158/B60 enzyme-linked-immunosorbent assay for the detection of circulating antigens (Ag-ELISA) of Taenia saginata. Vet Parasitol. 2016;227:69–72. doi: 10.1016/j.vetpar.2016.07.027. [DOI] [PubMed] [Google Scholar]
- 35.Kokkinaki M, Sahibzada N, Golestaneh N. Human induced pluripotent stem-derived retinal pigment epithelium (RPE)cells exhibit ion transport, membrane potential, polarized vascular endothelial growth factor secretion, and gene expression pattern similar to native RPE. Stem Cells. 2011;29(5):825–835. doi: 10.1002/stem.635. [DOI] [PMC free article] [PubMed] [Google Scholar]
- 36.Brandl C, et al. In-depth characterisation of Retinal Pigment Epithelium (RPE) cells derived from human induced pluripotent stem cells (hiPSC) Neuromolecular Med. 2014;16(3):551–564. doi: 10.1007/s12017-014-8308-8. [DOI] [PMC free article] [PubMed] [Google Scholar]
- 37.Shan J, et al. Identification of small molecules for human hepatocyte expansion and iPS differentiation. Nat Chem Biol. 2013;9(8):514–520. doi: 10.1038/nchembio.1270. [DOI] [PMC free article] [PubMed] [Google Scholar]
- 38.Simm J, et al. Repurposed high-throughput image assays enable biological activity prediction for drug discovery. Cell Chem Biol. 2018;25(5):611–618. doi: 10.1016/j.chembiol.2018.01.015. [DOI] [PMC free article] [PubMed] [Google Scholar]
- 39.Singh S, et al. Morphological profiles of RNAi-induced gene knockdown are highly reproducible but dominated by seed effects. PLoS ONE. 2015;10(7):e0131370. doi: 10.1371/journal.pone.0131370. [DOI] [PMC free article] [PubMed] [Google Scholar]
- 40.Alizadeh E, Lyons SM, Castle JM, Prasad A. Measuring systematic changes in invasive cancer cell shape using Zernike moments. Integr Biol (Camb) 2016;8(11):1183–1193. doi: 10.1039/C6IB00100A. [DOI] [PubMed] [Google Scholar]
- 41.Tahmasbi A, Saki F, Shokouhi SB. Classification of benign and malignant masses based on Zernike moments. Comput Biol Med. 2011;41(8):726–735. doi: 10.1016/j.compbiomed.2011.06.009. [DOI] [PubMed] [Google Scholar]
Associated Data
This section collects any data citations, data availability statements, or supplementary materials included in this article.


