Abstract
Gene transcription by RNA polymerase II is regulated by activator proteins that recruit the coactivator complexes SAGA1,2 and TFIID2–4. SAGA is globally required for regulated transcription5 and conserved amongst eukaryotes6. SAGA contains four modules7–9, the activator-binding Tra1 module, the core module, the histone acetyltransferase (HAT) module, and the histone deubiquitination (DUB) module. Previous works provided partial structures10–14, but the structure of the central core module is unknown. Here we present the cryo-electron microscopy structure of SAGA from the yeast Saccharomyces cerevisiae and resolve the core module at 3.3 Å resolution. The core module consists of subunits Taf5, Sgf73 and Spt20, and a histone octamer-like fold. The octamer-like fold comprises the heterodimers Taf6-Taf9, Taf10-Spt7 and Taf12-Ada1, and two histone-fold domains in Spt3. Spt3 and the adjacent subunit Spt8 interact with the TATA box-binding protein (TBP)2,7,15–17. The octamer-like fold and its TBP-interacting region are similar in TFIID, whereas Taf5 and the Taf6 HEAT domain adopt distinct conformations. Taf12 and Spt20 form flexible connections to the Tra1 module, whereas Sgf73 tethers the DUB module. Binding of a nucleosome to SAGA displaces the HAT and DUB modules from the core module surface, allowing the DUB module to bind one face of an ubiquitinated nucleosome.
SAGA contains 19 subunits that are distributed over four modules18. The Tra1 module binds activators19,20, the core module recruits TBP21, the HAT module contains the histone H3 acetyltransferase Gcn51, and the DUB module comprises a histone H2B deubiquitinase22,23. To determine the structure of SAGA, we purified the endogenous complex from Saccharomyces cerevisiae using a strain with a C-terminal TAP-tag on subunit Spt20 (Methods). Purified SAGA contained all 19 subunits in apparently stoichiometric amounts (Extended Data Fig. 1a), and was subjected to cryo-electron microscopy (cryo-EM) and protein crosslinking analysis (Methods). We obtained a reconstruction of SAGA at an overall resolution of 3.9 Å (Extended Data Figure 1; Supplementary Video 1).
The two large SAGA modules, the Tra1 and the core module, were resolved at 3.4 Å and 3.3 Å resolution, respectively (Extended Data Figures 1d-e, 2a). We fitted the Tra1 structure13, built the core module and the protein regions connecting the two modules, and refined the structure in real space (Extended Data Tables 1, 2; Extended Data Figure 2b). The HAT and DUB modules were more flexible and showed resolutions of 9 Å and 12 Å, respectively. The structure of the DUB module12 could be fitted, but density for the HAT module could not be interpreted (Supplementary Video 1). Our protein-protein crosslinking and published crosslinking information7 confirmed our modelling and assigned subunit Spt8 to a remaining density located between the core and Tra1 modules (Supplementary Table 1; Extended Data Figure 2c, d).
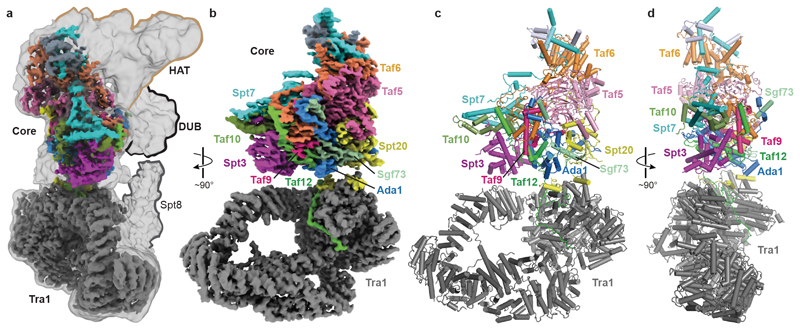
The structure confirms the overall topology of SAGA with four flexibly connected modules8,24, and reveals the intricate subunit architecture of the coactivator complex (Fig. 1). The SAGA structure contains only one copy of each subunit, in contrast to TFIID, which contains two copies of several subunits3,4. The SAGA core module occupies a central position and comprises the subunits Taf5, Taf6, Taf9, Taf10, Taf12, Spt3, Spt7, Spt20, and Ada1. The TBP-interacting subunit Spt8 is flexibly connected to the core module, as are the HAT and DUB modules (Fig. 1a). These three functional SAGA regions are lined up on one side of the complex that is predicted to face promoter DNA (Fig. 1a).
Figure 1. Overall structure of SAGA.
a. Overview of SAGA structure. Low-pass filtered and high-resolution composite cryo-EM maps of SAGA. The four SAGA modules Tra1, core, HAT and DUB are indicated.
b. High-resolution composite cryo-EM map reveals Tra1 and core modules. The subunit color code is used throughout.
c-d. Two views of the SAGA structure displayed as a ribbon model.
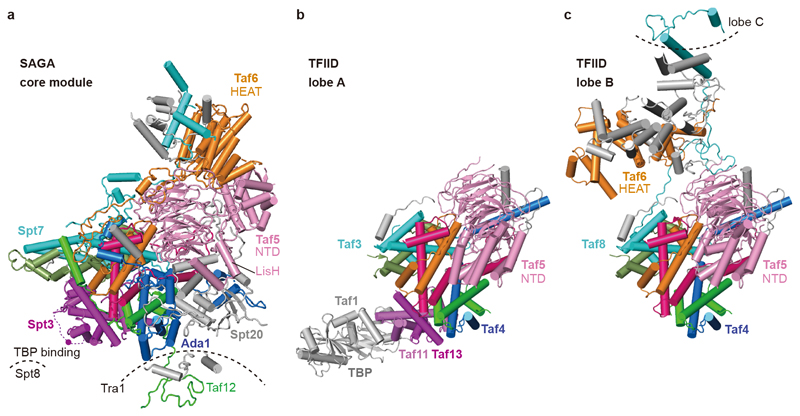
The core module contains a histone octamer-like fold and an adjacent submodule formed by subunits Taf5, Taf6 and Spt20 (Fig. 2). The octamer-like fold comprises three pairs of subunits that each contribute one histone fold (HF), namely Taf6-Taf9, Taf10-Spt7 and Taf12-Ada1, and by Spt3, which contributes two HFs. The presence of an octamer-like fold explains early observations of histone-like subunit pairs in SAGA25,26. In contrast to a canonical histone octamer, which shows two-fold symmetry, the SAGA octamer-like fold is fully asymmetric (Extended Data Fig. 3a).
Figure 2. SAGA core module structure.
a. Subunit domain architecture. Residues at domain boundaries are indicated. BD, bromodomain; HF, histone fold; HEAT, HEAT repeat domain; NTD, N-terminal domain; WD40, WD40 β-propeller domain; SEP, shp1-eyc-p47 domain; ZF, zinc finger domain; SCA7, SCA7 domain; CTD, C-terminal domain.
b. Ribbon model showing subunit arrangement and interactions. View and color code as in Fig. 1.
c. The Taf5 WD40 propeller domain interacts with six other SAGA subunits.
Subunit Taf5 connects the octamer-like fold to the remainder of the core module and is thus important for core module architecture (Fig. 2b). The N-terminal helical domain of Taf5 binds the C-terminal HEAT repeat region of Taf6. The C-terminal WD40 β-propeller of Taf5 docks to the HF pairs Taf6-Taf9 and Taf10-Spt7, and binds Spt20, which contains a SEP (shp1-eyc-p47) domain (Fig. 2c). Spt20 also contains an extended loop that forms a wedge between the two Taf5 domains, thereby stabilizing them in a defined orientation (Fig. 2b, Extended Data Fig. 3b). The Lis1 homology motif (LisH) helices of Taf5 interact with the SEP domain of Spt20 (Extended Data Fig. 3c). Taf6 contributes one β-strand to the Taf5 propeller, suggesting that Taf5 and Taf6 form an obligate heterodimer (Fig. 2c). The Taf5 propeller and the Taf6 HEAT region both interact with a stretch of Spt7 that extends from the octamer-like fold and continues into a bromodomain that is mobile.
SAGA has long been known to bind TBP15–17,27, implying a role in recruiting TBP to promoters. According to crosslinking7 and genetic data2, SAGA interacts with TBP using its subunits Spt3 and Spt8. These two subunits occupy adjacent locations at the edge of the octamer-like fold (Fig. 1, Fig. 3a). SAGA and TFIID share the subunits Taf5, Taf6, Taf9, Taf10, and Taf1218. TFIID consists of three lobes that were called lobe A, B, and C and were structurally defined recently3,4. Lobe A contains an octamer-like fold that resembles the fold observed in SAGA. However, Spt7 and Ada1 are replaced by TFIID subunits Taf3 and Taf4, respectively, and the two HF domains of Spt3 are replaced by the HF pair Taf11-Taf13 in TFIID (Fig. 3b). Despite these differences, the octamer-like folds in SAGA and TFIID bind TBP at the same relative position (Fig. 3a, b).
Figure 3. Comparison of SAGA core module with TFIID.
a. SAGA core module with subunits that are shared with TFIID in color. A magenta dot depicts lysine residue K190 of Spt3 that was crosslinked to TBP18 and is located in the loop between the two HFs of Spt3 (dashed magenta line).
b. Comparison with TBP-bound TFIID lobe A3 shows that TBP binds to the same relative position with respect to the histone-like fold in SAGA and TFIID. The histone-like folds are similar but differ in their subunit composition.
c. Comparison with TFIID lobe B3 reveals different structures of Taf5 and Taf6 that are due to complex-specific subunits.
We generated a model of the SAGA-TBP complex by superposing the TBP-containing TFIID structure lobe A onto the SAGA core structure (Extended Data Fig. 3d). The model is consistent with TBP bridging between SAGA subunits Spt3 and Spt8. In TFIID, the TFIID-specific subunit Taf1 also contributes to TBP binding, and this may explain an apparently higher affinity of TFIID for TBP compared to SAGA2. TFIID lobe B contains a hexamer of HF domains that lacks the Taf11-Taf13 pair and does not bind TBP, but otherwise resembles its counterpart in SAGA (Fig. 3c).
Structural comparisons also show how SAGA and TFIID form distinct structures despite sharing five subunits (Fig. 3). The shared subunits Taf5 and Taf6 have different structures in the two complexes. In TFIID, the Taf5 N-terminal domain docks to the octamer-like fold and is stabilized by the TFIID-specific subunit Taf4. In SAGA, Taf4 is absent and subunit Ada1 occupies its position. The Taf5 N-terminal domain occupies a position that is distant from the octamer-like fold, is stabilized by the SAGA-specific subunit Spt20, and contacts the Taf6 HEAT repeat domain, which also adopts a different position and structure compared to TFIID. Thus, incorporation of Ada1 or Taf4 into the octamer-like fold may trigger assembly of either SAGA or TFIID, respectively.
Our results also show that the core module forms flexible connections to the other modules of SAGA. The core subunits Taf12 and Spt20 contain Tra1-interacting regions (TIRs) that tether the Tra1 module. The Taf12 TIR (residues 353-410) meanders through a narrow surface groove formed by the TPR repeats of the FAT domain in Tra1, whereas Spt20 contains two TIRs (Extended Data Figure 4a, b, d). TIR1 (residues 398-416) forms a latch that retains the Taf12 TIR, and TIR2 (residue 474-488) forms a helix that binds Tra1 (Extended Data Figure 4a, b, d). These interactions are consistent with the known dissociation of Tra1 upon Spt20 deletion28. Further, subunit Sgf73 connects the core to the DUB module (Extended data Figure 4c, d). Whereas the central Sgf73 residues 353-437 are part of the core module (‘anchor helices’) and form interactions with Spt20, Ada1 Taf12, Taf6 and Taf9, the ~100 N-terminal residues are part of the DUB module10–12. Consistent with this, a Sgf73 region overlapping with the anchor helices is required to retain Sgf73 in SAGA7,29.
We next investigated how SAGA binds its nucleosome substrate. Modelling a nucleosome onto the DUB module with the use of the DUB-nucleosome structure12 resulted in a clash of the nucleosome with the core module. Therefore, SAGA needs to change conformation to bind the nucleosome. To investigate this, we prepared nucleosomes that were ubiquitinated at histone H2B residue K120 (corresponding to K123 of yeast H2B) and trimethylated at histone H3 residue K4 (Methods). We then formed a SAGA-nucleosome complex, and subjected this to cryo-EM analysis (Extended Data Figure 5).
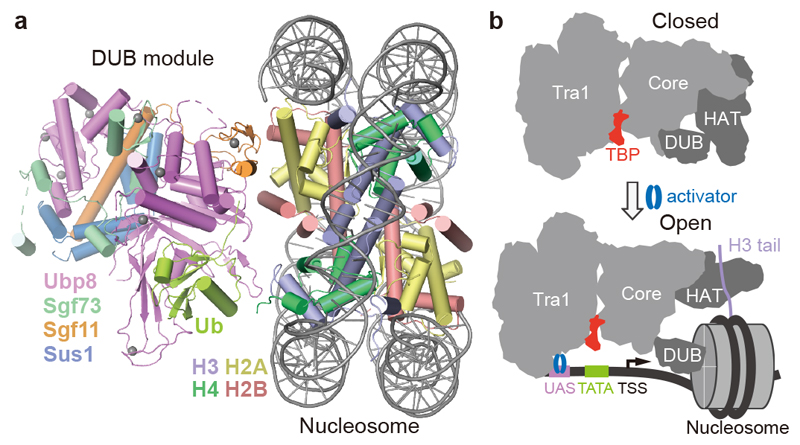
The cryo-EM data revealed the DUB module bound to the modified nucleosome at 3.7 Å resolution (Fig. 4a, Extended Data Figure 5d-f). The obtained structure of the DUB module is virtually identical to the known structure of the isolated DUB module10,11. The DUB module binds to one face of the nucleosome in a way that is identical to that observed in the isolated DUB-nucleosome complex, although DUB modules bound to both faces of the nucleosome in this structure (Extended Data Figure 5g)12. Further data processing resolved the Tra1 module at 4.2 Å resolution, whereas the core module showed low resolution, and the HAT module was invisible, suggesting it became flexible upon nucleosome binding (Extended Data Figure 4d).
Figure 4. Nucleosome binding induces changes in SAGA.
a. Structure of DUB-nucleosome complex within SAGA.
b. Model showing changes in SAGA module orientation upon nucleosome and promoter binding.
Comparison of low-pass filtered maps shows that nucleosome binding displaces the HAT and DUB modules from the SAGA core module (Extended Data Fig. 5h). This is likely important for SAGA to fulfil its different functions during transcription activation when it is recruited by an activator to the promoter (Fig. 4b). Whereas the HAT and DUB modules would deubiquitinate and acetylate a promoter-bound nucleosome around or downstream of the transcription start site (TSS), the core module and Spt8 recruit TBP to the promoter upstream of the TSS. Flexibility between the modules would allow SAGA to bridge between promoter regions and to accommodate changes in their distance at different promoters.
Finally, our results have implications for understanding the structure and function of related coactivators. The yeast complex SLIK is identical to SAGA but contains a C-terminally truncated version of Spt7 and lacks Spt830,31. In our SAGA structure, the Spt7 C-terminal region protrudes towards Spt8, suggesting it contacts Spt8 and explaining why SLIK lacks Spt8. SAGA is highly conserved in human cells and contains counterparts of all yeast SAGA subunits except Spt818 (Extended Data Table 3). Thus, our yeast SAGA structure is a very good model for yeast SLIK and human SAGA. In conclusion, the structure of SAGA integrates available data, reveals differences to TFIID, and provides a framework for studying the mechanisms used by this multifunctional coactivator to regulate transcription.
Methods
Purification of endogenous SAGA
Saccharomyces cerevisiae strain CB010 (MATa pep4::HIS3, prb1::LEU2, prc1::HISG, can1, ade2, trp1, ura3, his3, leu2-3,112) with a C-terminal TAP tag at Spt20 was grown in a 200 L fermenter (INFORS-HT) with 100 L YPD medium overnight and harvested at OD600=~5. Cell pellets were resuspended in lysis buffer (30 mM HEPES pH 7.5, 300 mM NaCl, 1.5 mM MgCl2, 0.05% NP40, 1 mM DTT, 0.284 μg/ml leupeptin, 1.37 μg/ml pepstatin A, 0.17 mg/ml PMSF, 0.33 mg/ml benzamidine) and frozen in liquid nitrogen. Frozen yeast cell beads were milled to powder using a cryogenic grinder (Spex sample prep 6875D). The lysed yeast powder was thawed and mixed with half the volume of lysis buffer. Lysates were cleared by centrifugation (4,000 g, 4 °C, 20 min and 235,000 g, 4°C, 60 min). The purification was performed as described28, with several modifications. Briefly, the supernatant was incubated with IgG Sepharose-6 Fast Flow resin (GE Healthcare) at 4 °C for 3 h, the resin was washed with 5 column volumes (CV) of lysis buffer followed by 5 CV of TEV cleavage buffer (30 mM HEPES pH 7.5, 150 mM NaCl, 1.5 mM MgCl2, 0.05% NP40, 1 mM DTT, 0.5 mM EDTA) and then resuspended in 5 ml of the TEV cleavage buffer. TEV cleavage was performed by incubating with His6-TEV protease for 16 h at 4°C. The eluate was loaded onto a 1mL HiTrap Q column (GE Healthcare) and eluted with a gradient using as high salt buffer 30 mM HEPES pH 7.5, 1 M NaCl, 1.5 mM MgCl2, 1 mM DTT. Peak fractions were concentrated to ~1 mg ml-1.
Preparation of modified nucleosomes
To generate the K120-ubiquitinylated histone H2B, we introduced a lysine-to-cysteine mutation (K120C) into the Xenopus H2B sequence and a glycine-to-cysteine mutation (G76C) to ubiquitin by site-directed mutagenesis. The dichloroacetone (DCA) cross-link was formed between ubiquitin and H2B-K120 as described12, with minor changes. Briefly, 100 μM H2B-K120C and 100 μM 6xHis-Ub-G76C proteins were incubated at 50°C in reaction buffer (50 mM borate pH 8.1, 1 mM tris(2-carboxyethyl) phosphine (TCEP)) for 1 hour to reduce cysteines, and were then cooled on ice for 1 hour. Dimethyl formamide (DMF) dissolved in dichloroacetone was added to the solution to a final concentration of 100 μM and incubated on ice for 1 hour. The reaction was quenched with 50 mM β-mercaptoethanol, frozen, and lyophilized. The resulting product mixture was resuspended in Ni-U buffer (20 mM HEPES pH 7.5, 500 mM NaCl, 6 M Urea, 2 mM β-mercaptoethanol, 20 mM imidazole) and applied to a HisTrap HP 5 ml column (GE Healthcare). The bound proteins were eluted with Ni buffer supplemented with 150 mM imidazole, and dialyzed into TEV cleavage buffer. After TEV cleavage for 16 hours at 4°C, the product was dialyzed into Ni-U buffer and reapplied to a HisTrap HP 5 ml column to remove uncleaved products. The flow-through from the column was applied to a HiTrap SP 5 ml column (GE Healthcare) and eluted with a gradient of Ni-U buffer with 1M NaCl. Peak fractions were pooled and dialyzed to water containing 5 mM β-mercaptoethanol, frozen and lyophilized.
H3K4me3 binding by the Sgf29 Tudor domain is required for chromatin targeting and histone H3 acetylation of SAGA32. To generate the K4-trimethylated histone H3 variant, a single lysine-to-cysteine mutation (K4C) was introduced into the H3 sequence by site-directed mutagenesis. Cysteine-engineered histone H3 K4C protein was alkylated as described33. Briefly, purified protein was reduced with DTT before addition of a 50-fold molar excess of trimethylammonium bromide (Sigma 117196–25G). The reaction mixture was incubated for 4 h at 50 °C before quenching with 5 mM β-mercaptoethanol. The modified protein was desalted using a PD-10 desalting column (GE Healthcare) pre-equilibrated in water supplemented with 2 mM β-mercaptoethanol and lyophilized. Successful alkylation was confirmed by MALDI-TOF mass spectrometry. The Widom 601 145 bp DNA was purified as described from the pUC19 8 × 145 bp 601-sequence plasmid using the restriction enzyme EcoRV to digest the DNA into fragments34. Nucleosomes were reconstituted with modified histones and the Widom 601 DNA as described34.
Cryo-EM sample preparation
Purified SAGA (or SAGA mixed with the modified nucleosome at a molar ratio of 1:2) was incubated with 3 mM BS3 for 1 hour on ice, quenched for 10 min using 10 mM Tris-HCl pH 7.5, 2 mM lysine and 8 mM aspartate. Quenched samples were applied to a 15-40% sucrose gradient in dialysis buffer (20 mM HEPES pH 7.5, 150 mM NaCl, 1.5 mM MgCl2, 1 mM TCEP, 2% glycerol), and ultracentrifuge at 32,000 rpm (SW60 rotor) for 16 h at 4 °C. Gradients were fractionated in 200 μl and analysed with native PAGE. The gels were stained with Syber Gold (Invitrogen) and Coomassie brilliant blue. Peak fractions containing SAGA or the SAGA-nucleosome complex were dialysed overnight, concentrated to ~0.2 mg ml-1, and used for grid preparation. 2 μL of sample was applied to glow-discharged UltrAuFoil 2/2 grids (Quantifoil, Jena, Germany) on each side of the grid. After incubation for 10 seconds, the sample was blotted for 4 seconds and vitrified by plunging into liquid ethane using a Vitrobot Mark IV (FEI Company) operated at 4 °C and 100 % humidity.
Cryo-EM data collection and image processing
Cryo-EM data of the SAGA and SAGA-NCP were acquired on a FEI Titan Krios transmission electron microscope operated at 300 keV, equipped with a K2 summit direct detector and a GIF quantum energy filter (Gatan, Pleasanton, CA, United States). Automated data acquisition was carried out using EPU software (FEI) at a nominal magnification of 130,000× or 105,000×, resulting in calibrated pixel sizes of -1.05 Å and -1.35 Å for SAGA and the SAGA-nucleosome complex, respectively. Movies of 40 frames were collected in counting mode over 9 seconds with a defocus range from 1.25-2.75 μm. The dose rate was 4.7 e- per Å2 per second resulting in 1.06 e- per Å2 per frame for SAGA, and 4.9 e- per Å2 per second resulting in 1.10 e- per Å2 per frame for the SAGA-nucleosome complex, respectively. A total of 4697 and 4866 movies were collected for SAGA and the SAGA-nucleosome complex, respectively. Movie stacks were motion-corrected, CTF-estimated, and dose-weighted using Warp35.
Particles of the SAGA data were auto-picked by Warp, yielding 250,368 particle images. Image processing was performed with RELION 3.0.536. Particles were extracted using a box size of 4002 pixels, and normalized. Reference-free 2D classification was performed to screen for good particles in the dataset. An ab initio model generated from cryoSPARC37 was used as an initial reference for subsequent 3D classification. All classes containing intact SAGA density were combined (107,759 particles) and used for a global 3D refinement resulting in a map at 4.7 Å resolution. To improve the map for the core module of SAGA, focused 3D classification without image alignment was performed employing a mask around the core module. The class that showed the best density for the core module was subjected to another round of 3D refinement resulting in an overall resolution of 4.1 Å. Focused refinement further improved the resolution to 3.4 Å and 3.3 Å for the Tra1 and the core module, respectively. Post-processing of refined reconstructions was performed using automatic B-factor determination in RELION and reported resolutions are based on the gold-standard Fourier shell correlation 0.143 criterion (B-factors of -107 Å2 and -91 Å2 for the Tra1 and the core module, respectively). Local resolution estimates were obtained using the built-in local resolution estimation tool of RELION using the estimated B-factors.
For the SAGA-nucleosome complex sample, 579,759 particles were auto-picked by Warp. Since the DUB-nucleosome and the remaining parts of SAGA were not present together during the classification steps, particles of SAGA in nucleosome-bound state and the DUB-nucleosome were processed separately. Otherwise, the processing procedure was the same as that for SAGA. However, focused 3D classification without alignment did not yield good core module particles from the SAGA-nucleosome dataset. A reconstruction at 6.1 Å overall resolution was obtained from 86,910 particles of SAGA in the nucleosome-bound state. Focused refinement further improved the resolution to 4.2 Å for the Tra1 lobe. For the DUB-nucleosome complex, a reconstruction at 3.7 Å overall resolution was obtained from 113,856 particles. Post-processing of the refined reconstructions was performed using automated B-factor determination in RELION and reported resolutions are based on the gold-standard Fourier shell correlation 0.143 criterion (B-factors of -149 Å2 and -115 Å2 for the Tra1 lobe and the DUB-nucleosome, respectively). Local resolution estimates were obtained using the built-in local resolution estimation tool of RELION using the previously estimated B-factors.
Crosslinking and mass spectrometry
Samples for crosslinking mass spectrometry were performed essentially in the same way as those for cryo-EM. Cross-linked samples were purified by sucrose gradient centrifugation and fractions containing fully assembled complexes were pooled for MS sample preparation. For in-solution digest, urea buffer (8 M urea, 50 mM NH4HCO3 pH 8) was added to pooled fractions to a final concentration of 1 M urea. Samples were reduced with 5 mM DTT (in 50 mM NH4HCO3 pH 8) for 30 min at 37°C, 300 rpm followed by alkylation with 20 mM iodoacetamide (in 50 mM NH4HCO3 pH 8) for 30 min at 37°C, 300 rpm, in the dark. The reaction was quenched by addition of 5 mM DTT (in 50 mM NH4HCO3 pH 8). Trypsin digest (Promega, V5111) was performed overnight at 37°C with 1:20 mass ratio (trypsin-complex). Tryptic peptides were desalted using C18 spin columns (Harvard Apparatus 74-4601), lyophilized and dissolved in 30 % [v/v] acetonitrile, 0.1 % [v/v] trifluoroacetic acid. The peptide mixture was separated on a Superdex Peptide 3.2/300 (GE Healthcare) column run at 50 μl/min with 30 % [v/v] acetonitrile, 0.1 % [v/v] trifluoroacetic acid. Cross-linked species are enriched by size exclusion chromatography based on their higher molecular weight compared to linear peptides. Therefore, 50 μl fractions were collected from 1.0 ml post-injection. Fractions from 1.0-1.6 ml post-injection were dried in a speed-vac and dissolved in 5 % [v/v] acetonitrile, 0.05 % [v/v] trifluoroacetic acid and subjected to LC-MS/MS.
LC-MS/MS analyses were performed on a Q Exactive HF-X hybrid quadrupole-orbitrap mass spectrometer (Thermo Scientific) coupled to a Dionex Ultimate 3000 RSLCnano system. Peptides were loaded on a Pepmap 300 C18 column (Thermo Fisher) at a flow rate of 10 μl/min in buffer A (0.1 % [v/v] formic acid) and washed for 3 min with buffer A. The sample was separated on an in-house packed C18 column (30 cm; ReproSil-Pur 120 Å, 1.9 μm, C18-AQ; inner diameter, 75 μm) at a flow rate of 300 nl/min. Sample separation was performed over 60 min (in-solution digest) or 120 min (in-gel digest) using a buffer system consisting of 0.1 % [v/v] formic acid (buffer A) and 80 % [v/v] acetonitrile, 0.08 % [v/v] formic acid (buffer B). The main column was equilibrated with 5 % B, followed by sample application and a wash with 5 % B. Peptides were eluted by a linear gradient from 15-48 % B or 20-50 % B. The gradient was followed by a wash step at 95 % B and re-equilibration at 5 % B. Eluting peptides were analyzed in positive mode using a data-dependent top 30-acquisition methods. MS1 and MS2 resolution were set to 120,000 and 30,000 FWHM, respectively. Precursors selected for MS2 were fragmented using 30 % normalized, higher-energy collision-induced dissociation (HCD) fragmentation. Allowed charge states of selected precursors were +3 to +7. Further MS/MS parameters were set as follows: isolation width, 1.4 m/z; dynamic exclusion, 10 sec; max. injection time (MS1/MS2), 60 ms/200 ms. The lock mass option (m/z 445.12002) was used for internal calibration. All measurements were performed in duplicates. The .raw files of all replicates were searched by the software pLink 1, version 2.3.138 and pLink 239 against a customized protein database containing the expressed proteins. Protein-protein crosslinks were filtered with 1 % FDR and plotted using xVis40.
Model building
The structure of the core module was built by first placing the known structure of the Taf5-Taf6-Taf9 trimer (PDB ID: 6F3T) into the density by rigid-body fitting in Chimera. Adjustments were made to the protein sequence in Coot41; insertions and deletions were manually built according to the density. The HF domains of Taf10, Spt7, Taf12, Ada1 and Spt3 and extensions from them were manually built. The structure of Taf5 NTD (PDB ID: 2J49) and Taf6 HEAT domain (PDB ID: 4ATG) were placed into the density and adjusted in Coot. The remaining parts were built manually. Secondary structure predictions from PSIPRED was used to assist de novo modelling. Alpha helices were generated using Coot and manually fitted into the density. Linkers between the helices were modelled where clear density was visible. Crosslinking restraints and densities from bulky residues such as Lys, Arg, Phe, Tyr and Trp were used to guide modeling. The SEP domain of Spt20 shares structural homology with human p47 (PDB: 1SS6), and this structure guided Spt20 modeling. The structure of the Tra1 module was built by placing the structure of Tra1(PDB ID: 5OJS) into the density by rigid-body fitting in Chimera, the TIR of Taf12 and Spt20 were manually built in Coot based on the density and crosslinking restraints. The DUB-nucleosome structure (PDB ID: 4ZUX) was placed into the corresponding densities by rigid-body fitting the DUB module and nucleosome in Chimera. All models were subjected to alternating manual adjustment and real-space refinement using Coot and PHENIX42, resulting in good stereochemistry as assessed by Molprobity43. Figures were generated in PyMOL (Schrödinger LLC, version 2.2.2) and UCSF Chimera (version 1.13).
Extended Data
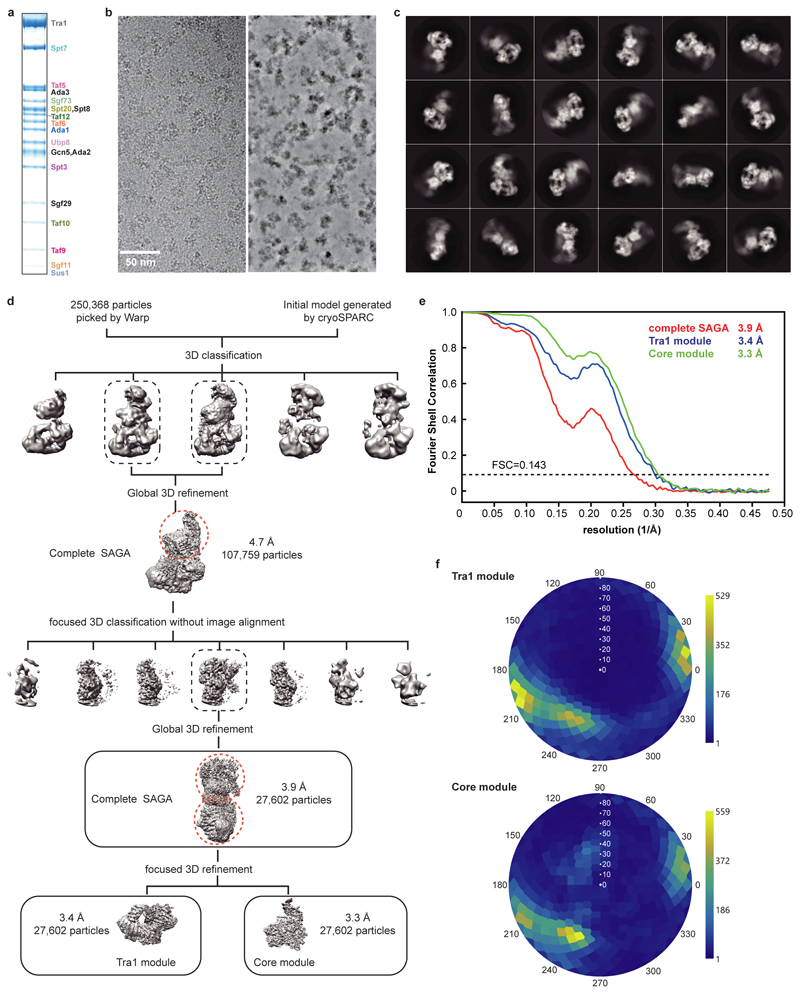
Extended Data Figure 1. Cryo-EM structure determination and analysis of SAGA. Related to Fig. 1.
a. Purification of endogenous SAGA from S. cerevisiae. SDS-PAGE of peak fraction used for cryo-EM grid preparation. Identity of the bands was confirmed by mass spectrometry. For gel source data, see Supplementary Figure 1.
b. Exemplary cryo-EM micrograph of data collection. The micrograph is shown before (left) and after denoising (right) using Warp35.
c. 2D class averages.
d. Sorting and classification tree used to reconstruct SAGA.
e. Fourier shell correlation (FSC) between half maps of the final reconstructions of the complete SAGA complex and the SAGA modules Tra1 and core. Resolutions for the gold-standard FSC 0.143 criterion are listed.
f. Angular distribution plot for all particles in the final reconstructions of the SAGA core (top) and Tra1 (bottom) modules. Color shading from blue to yellow correlates with the number of particles at a specific orientation as indicated.
Extended Data Figure 2. Quality of the SAGA structure. Related to Figs. 1 and 2.
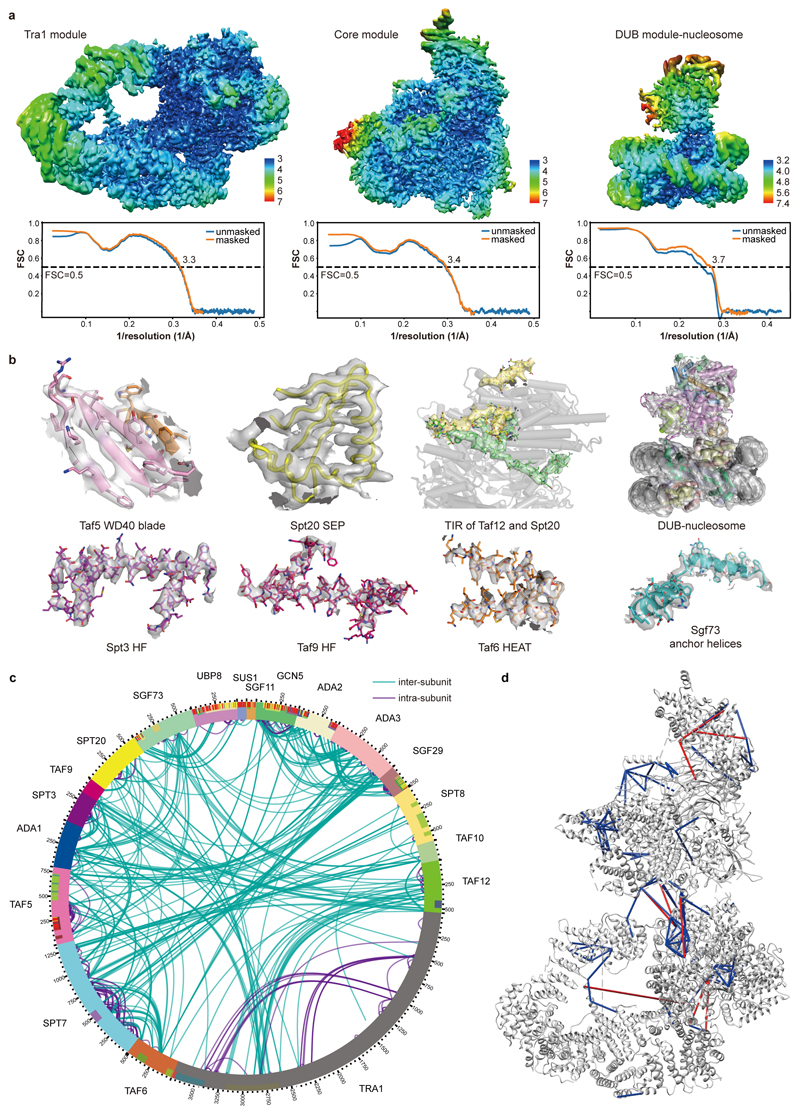
a. SAGA reconstruction colored according to local resolution43. Model-Map FSC curves calculated between the refined atomic models and maps are shown below.
b. Electron density (grey transparent surface) for various SAGA regions as indicated.
c. Overview of the crosslinking data. Circular plot of high-confidence lysine-lysine inter-subunit (green) and intra-subunit (purple) crosslinks obtained by mass spectrometry for the SAGA complex. The mass spectrometry measurement was repeated twice independently with similar results. A total of 396 unique inter-subunit crosslinks and 514 intra-subunit crosslinks were obtained.
d. Validated crosslinks mapped onto the SAGA structure. Out of 396 unique inter-subunit crosslinks, 120 could be mapped onto the core module structure, and 109 located within the 30 Å distance limit for the BS3 crosslinker. Blue lines depict the crosslinks with crosslinked sites within the 30 Å distance permitted by BS3, whereas red lines depict crosslinks over than 30 Å distance.
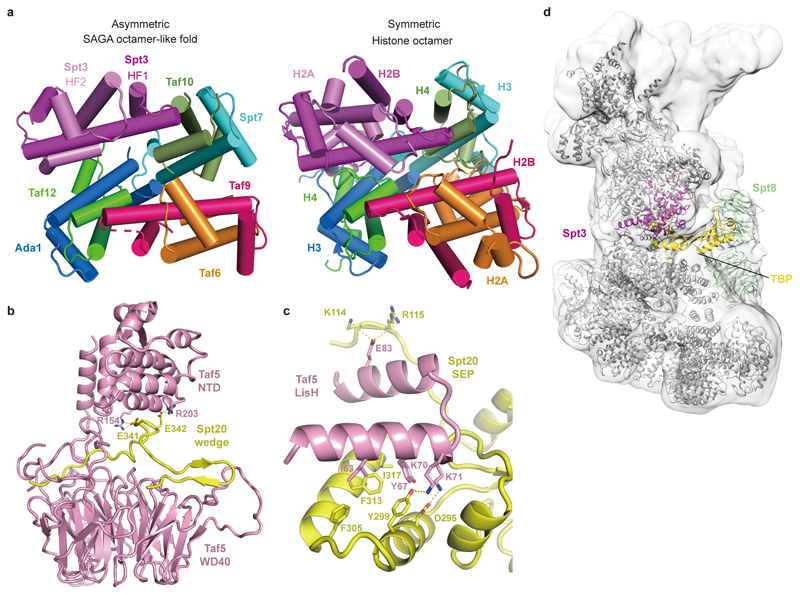
Extended Data Figure 3. Comparison of histone-like fold in SAGA with the histone octamer, details of Taf5-Spt20 interactions, and model of SAGA-TBP complex. Related to Figs. 1, 2, and 3.
a. Comparison of the SAGA core module histone octamer-like structure with the canonical histone octamer core (PDB code 1AOI). The canonical octamer core is rendered as the color for the SAGA octamer-like fold.
b. Details of Taf5-Spt20 wedge interactions. Residues involved in the interactions are shown in sticks and colored as indicted.
c. Details of interactions between Taf5 LisH domain and Spt20 SEP domain. Residues involved in the interactions are shown in sticks and colored as indicted.
d. Model of the SAGA-TBP complex. The model was generated by superposing the TBP-containing TFIID lobe A onto the SAGA core structure. A homology model for Spt8 was generated by I-TASSER server44.
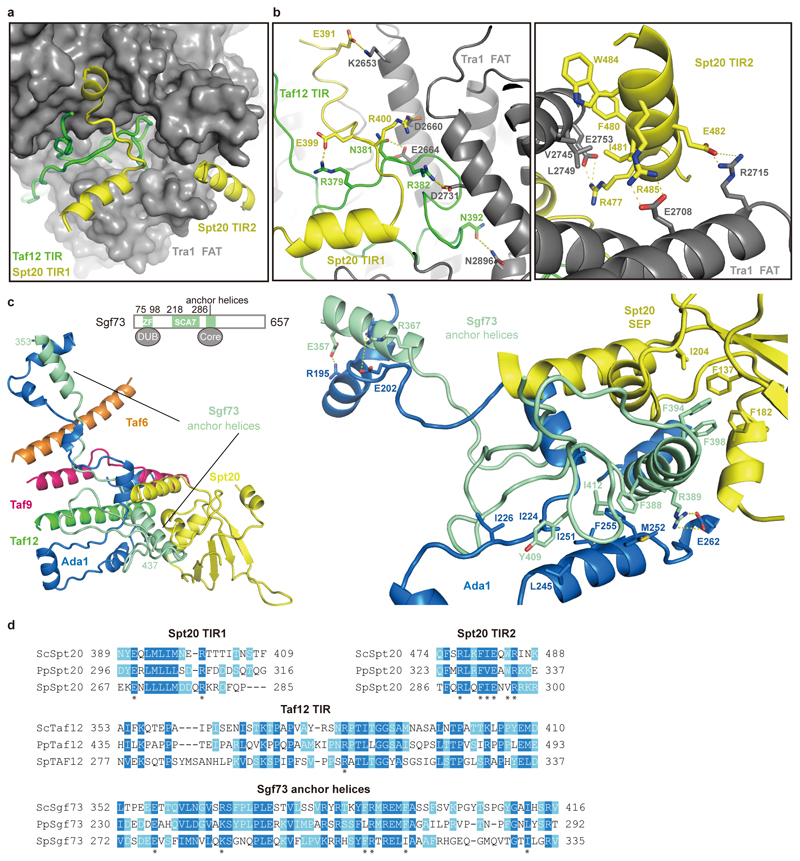
Extended Data Figure 4. Details of inter-module interactions. Related to Figs. 1, 2.
a. Binding interface between core and Tra1 modules. The Tra1 FAT domain (grey) is shown as a surface representation. The Tra1-interacting regions (TIRs) of Taf12 (green) and Spt20 (yellow) are shown in cartoon representation.
b. Details of the interactions depicted in panel a.
c. Sgf73 (turquoise) tethers the DUB module to the core module. Residues involved in the interactions are shown in sticks and colored as indicted.
d. Sequence alignment of SAGA subunit regions involved in inter-module interactions. Conserved residues are highlighted in blue. Key residues are labeled with asterisks45. Sc, Pp and Sp stand for Saccharomyces cerevisiae, Pichia Pastoris, and Schizosaccharomyces pombe, respectively.
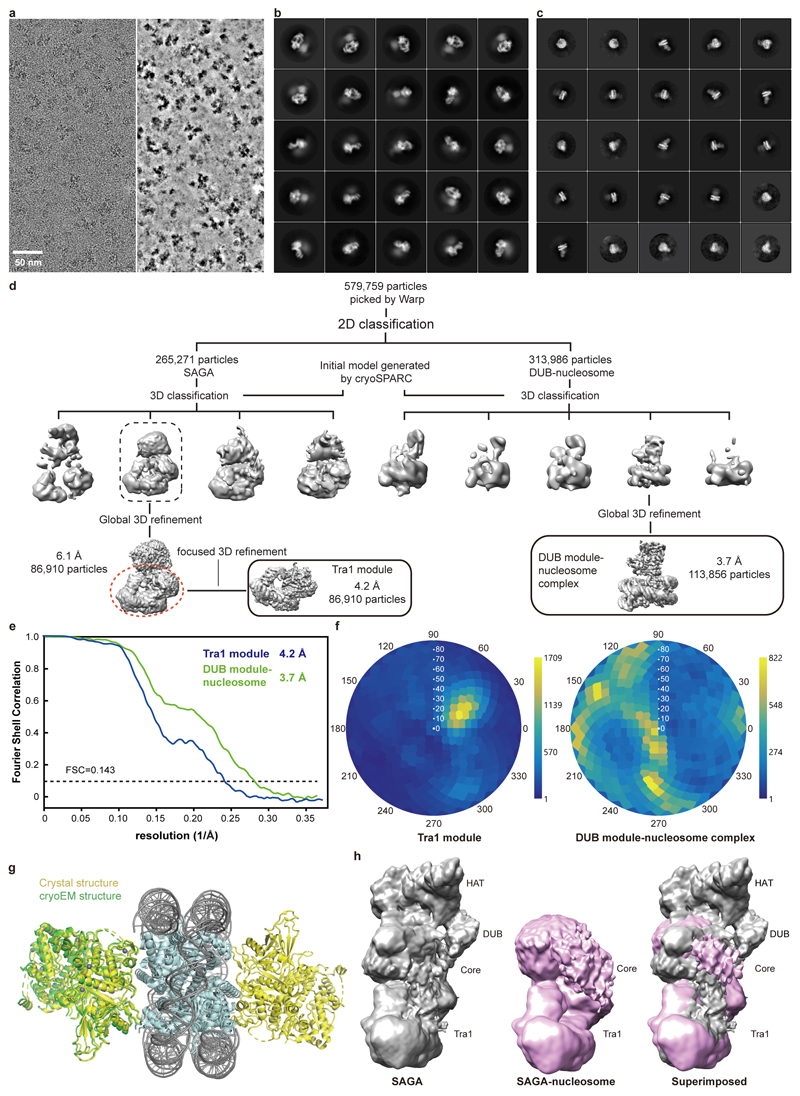
Extended Data Figure 5. Cryo-EM structure determination and analysis of the SAGA-nucleosome complex. Related to Fig. 4.
a. Exemplary cryo-EM micrograph of data collection. The micrograph is shown before (left) and after denoising (right) using Warp35.
b. 2D class averages for the SAGA-nucleosome complex.
c. 2D class averages for the DUB module-nucleosome subcomplex.
d. Sorting and classification tree used to reconstruct the DUB module-nucleosome complex at 3.7 Å resolution.
e. Fourier shell correlation (FSC) between half maps of the final reconstructions of the SAGA module Tra1 and the DUB module-nucleosome complex from SAGA-nucleosome complex data. Resolutions for the gold-standard FSC 0.143 criterion are listed.
f. Angular distribution plot for all particles in the final reconstruction of the SAGA DUB module-nucleosome complex. Color shading from blue to yellow correlates with the number of particles at a specific orientation as indicated.
g. Superposition of crystal structure of DUB-ubiquitinated nucleosome (4ZUX)12 onto the cryo-EM structure presented here. Structures are shown in cartoon and colored as indicated.
h. Comparison of the low-pass filtered overall cryo-EM maps of SAGA and the SAGA-nucleosome complex. Densities for HAT and DUB modules are lost upon nucleosome binding to SAGA.
Extended Data Table 1. Cryo-EM data collection, refinement and validation statistics.
| SAGA (EMD-10412) (PDB 6T9I) |
SAGA Tra1 module (EMD-10413) (PDB 6T9J) |
SAGA core module (EMD-10414) (PDB 6T9K) |
SAGA DUB module-nucleosome (EMD-10415) (PDB 6T9L) |
SAGA in nucleosome-bound state (EMD-10416) |
|
|---|---|---|---|---|---|
| Data collection and processing | |||||
| Magnification | 130,000 | 130,000 | 130,000 | 105,000 | 105,000 |
| Voltage (kV) | 300 | 300 | 300 | 300 | 300 |
| Electron exposure (e–/Å2) | 42.45 | 42.45 | 42.45 | 44.17 | 44.17 |
| Defocus range (μm) | 1.25 to 2.75 | 1.25 to 2.75 | 1.25 to 2.75 | 1.25 to 2.75 | 1.25 to 2.75 |
| Pixel size (Å) | 1.05 | 1.05 | 1.05 | 1.37 | 1.37 |
| Symmetry imposed | C1 | C1 | C1 | C1 | C1 |
| Initial particle images (no.) | 250,368 | 250,368 | 250,368 | 579,759 | 579,759 |
| Final particle images (no.) | 27,602 | 27,602 | 27,602 | 113,856 | 86,910 |
| Map resolution (Å) | 3.9 | 3.4 | 3.3 | 3.7 | 6.1 |
| FSC threshold | 0.143 | 0.143 | 0.143 | 0.143 | 0.143 |
| Map resolution range (Å) | 3.2 – 8.1 | 3.0 – 5.8 | 3.1 – 8.0 | 3.2 – 7.3 | -- |
| Refinement | |||||
| Initial models used (PDB code) | 5OJS, 6MZD, 6F3T, 2J49, 4ATG, 1SS6 |
5OJS | 6MZD, 6F3T, 2J49, 4ATG, 1SS6 |
4ZUX | |
| Model resolution (Å) | 3.3 | 3.2 | 3.3 | 3.6 | |
| FSC threshold | 0.5 | 0.5 | 0.5 | 0.5 | |
| Model resolution range (Å) | 2.6 – 3.2 | 2.7 – 3.2 | 2.8 – 3.4 | 3.4 – 3.8 | |
| Map sharpening B factor (Å2) | -137.1 | -107.119 | -90.9 | -114.6 | |
| Model composition | |||||
| Non-hydrogen atoms | 48822 | 29551 | 19241 | 18157 | |
| Protein residues | 6047 | 3617 | 2426 | 1532 | |
| Nucleotide | 0 | 0 | 0 | 290 | |
| Ligands | 0 | 0 | 0 | 8 | |
| B factor | |||||
| Protein | 58.5 | 66.3 | 46.6 | 20.6 | |
| Nucleic acid | - | - | - | 13.6 | |
| Ligand | - | - | - | 523.51 | |
| R.m.s. deviations | 0.007 | 0.008 | 0.006 | 0.002 | |
| Bond lengths (Å) | 1.295 | 1.353 | 1.211 | 0.455 | |
| Bond angles (°) | |||||
| Validation | |||||
| MolProbity score | 1.84 | 1.79 | 1.78 | 1.39 | |
| Clashscore | 6.70 | 5.51 | 5.85 | 7.11 | |
| Poor rotamers (%) | 0.9 | 0.9 | 0.43 | 0.07 | |
| Ramachandran plot | |||||
| Favored (%) | 92.48 | 91.97 | 92.81 | 98.93 | |
| Allowed (%) | 7.45 | 8.00 | 7.10 | 1.07 | |
| Disallowed (%) | 0.07 | 0.03 | 0.08 | 0 |
Extended Data Table 2. Modelling of yeast SAGA subunits, domains and regions.
| Subunit / Chain ID | Domain | Residue range | Modelling method | Notes |
|---|---|---|---|---|
| Spt20 / B | 112-134 | de novo modelling | ||
| SEP | 135-224 | homology-modelling: 1SS6 | 153-168 missing | |
| 277-322 | de novo modelling | |||
| Wedge | 323-360 | de novo modelling | ||
| TIR | 389-416 | de novo modelling | ||
| TIR | 474-488 | de novo modelling | ||
| Spt3 / C | HF1 | 3-86 | homology-modelling: 6MZD | |
| 140-154 | de novo modelling | |||
| 191-209 | de novo modelling | |||
| HF2 | 210-312 | homology-modelling: 6MZD | 266-297 missing | |
| C-term | 313-337 | de novo modelling | ||
| Taf5 / D | LisH | 56-88 | de novo modelling | |
| 89-125 | homology-modelling: 6MZD | |||
| NTD | 149-281 | Crystal structure: 2J49 | ||
| 430-454 | de novo modelling | |||
| WD40 | 455-798 | homology-modelling: 6F3T & de novo modelling | 737-742 missing | |
| Taf6 / E | HF | 8-77 | homology-modelling: 6F3T | |
| 78-176 | de novo modelling | |||
| 188-220 | de novo modelling | |||
| HEAT | 221-467 | homology-modelling: 4ATG & de novo modelling | 235-242 missing 435-442 missing |
|
| Taf9 / F | HF | 30-101 | homology-modelling: 6F3T | 79-87 missing |
| C-term | 102-149 | de novo modelling | ||
| Taf10 / G | 67-86 | de novo modelling | ||
| HF | 87-196 | homology-modelling: 6MZD & de novo modelling | insertion 136-178 | |
| C-term | 197-206 | de novo modelling | ||
| Adal / H | N-term. | 181-267 | de novo modelling | |
| HF | 268-350 | homology-modelling: 6MZD | 327-331 missing | |
| 351-418 | de novo modelling | 388-393 missing | ||
| Taf12 / I | TIR | 353-413 | de novo modelling | |
| HF | 415-486 | homology-modelling: 6MZD | ||
| C-term | 487-525 | de novo modelling | ||
| Spt7 / K | 152-187 | de novo modelling | ||
| 728-754 | de novo modelling | |||
| 849-930 | de novo modelling | |||
| 952-974 | de novo modelling | |||
| HF | 975-1047 | homology-modelling: 6MZD | ||
| 1048-1085 | de novo modelling | |||
| Sfg73 / Q | anchor helices | 353-398 | de novo modelling | |
| 399-436 | de novo modelling | |||
| Tra1 / T | Finger | 1-950 | homology-modelling: 5OJS | 160-213, 259-278, 523-557, 652-672 missing |
| N-Clasp | 951-1142 | homology-modelling: 5OJS | ||
| Ring | 1143-2445 | homology-modelling: 5OJS | 2017-2021, 2044-2088, 2108-2114, 2131-2137, 2147-2153 missing | |
| C-Clasp | 2446-2598 | homology-modelling: 5OJS | ||
| FAT | 2599-3219 | homology-modelling: 5OJS | 2925-2935, 3183-3201 missing | |
| Kinase | 3220-3744 | homology-modelling: 5OJS | ||
| Chain U | poly-alanine | de novo modelling | Unassigned regions | |
Extended Data Table 3. SAGA Conservation between yeast and human.
* The HHpred similarity scores are calculated between homologous regions only.
|
S.c. SAGA Subunits |
H.s. SAGA Subunits |
HHpred similarity* | |
|---|---|---|---|
| HAT module | Ada2 | TADA2B | 0.569 |
| Ada3 | TADA3 | 0.278 | |
| Gcn5 | GCN5/PCAF | 0.851/0.864 | |
| Sgf29 | SGF29 | 0.249 | |
| DUB module | Sgf11 | ATXN7L3 | 0.356 |
| Sgf73 | ATXN7 | 0.205 | |
| Sus1 | ENY2 | 0.518 | |
| Ubp8 | USP22 | 0.576 | |
| Core module | Taf5 | TAF5L | 0.578 |
| Taf6 | TAF6L | 0.344 | |
| Taf9 | TAF9 | 0.657 | |
| Taf10 | TAF10 | 0.688 | |
| Taf12 | TAF12 | 0.677 | |
| Ada1 | TADA1 | 0.190 | |
| Spt3 | SUPT3H | 0.378 | |
| Spt7 | SUPT7L | 0.167 | |
| Spt8 | -- | ||
| Spt20 | SUPT20H | 0.295 | |
| Tral | Tral | TRRAP | 0.464 |
Supplementary Material
Acknowledgements
We thank M. Ninov for help with mass spectrometry and T. Schulz for yeast fermentation. HW was supported by an EMBO Long-Term-Fellowship (ALTF 650-2017). HU was supported by the Deutsche Forschungsgemeinschaft (SFB860). ACMC was supported by Wellcome (102535/Z/13/Z). PC was supported by the Deutsche Forschungsgemeinschaft (SFB860, SPP1935, EXC 2067/1-390729940), the European Research Council (Advanced Investigator Grant TRANSREGULON, grant agreement No 693023), and the Volkswagen Foundation.
Footnotes
Data availability statement
The electron density reconstructions and models of the complete SAGA complex, the Tra1 module, the core module, the DUB module-nucleosome complex and the nucleosome-bound state of SAGA were deposited with the EM Data Base (accession codes EMD-10412, EMD-10413, EMD-10414, EMD-10415, and EMD-10416 respectively) and with the Protein Data Bank (accession codes 6T9I, 6T9J, 6T9K, and 6T9L, respectively). All the other relevant data is included in the Supplementary Information or is available from the authors upon request.
Author contributions HW carried out all experiments and data analysis except mass spectrometry analysis. CD assisted with cryo-EM data collection. ACMC contributed to developing the purification protocol and assisted with model building. AS and HU carried out mass spectrometry analysis. PC supervised research. HW and PC interpreted the data and wrote the manuscript, with input from all authors.
Author information The electron density reconstructions and final models were deposited with the EM Data Base (accession code EMD-10412, EMD-10413, EMD-10414, EMD-10415, and EMD-10416 respectively) and with the Protein Data Bank (accession code 6T9I, 6T9J, 6T9K, and 6T9L, respectively).
The authors declare no competing financial interest.
References
- 1.Grant PA, et al. Yeast Gcn5 functions in two multisubunit complexes to acetylate nucleosomal histones: characterization of an Ada complex and the SAGA (Spt/Ada) complex. Genes Dev. 1997;11:1640–1650. doi: 10.1101/gad.11.13.1640. [DOI] [PubMed] [Google Scholar]
- 2.Hahn S, Young ET. Transcriptional regulation in Saccharomyces cerevisiae: transcription factor regulation and function, mechanisms of initiation, and roles of activators and coactivators. Genetics. 2011;189:705–736. doi: 10.1534/genetics.111.127019. [DOI] [PMC free article] [PubMed] [Google Scholar]
- 3.Patel AB, et al. Structure of human TFIID and mechanism of TBP loading onto promoter DNA. Science. 2018;362 doi: 10.1126/science.aau8872. [DOI] [PMC free article] [PubMed] [Google Scholar]
- 4.Kolesnikova O, et al. Molecular structure of promoter-bound yeast TFIID. Nat Commun. 2018;9 doi: 10.1038/s41467-018-07096-y. 4666. [DOI] [PMC free article] [PubMed] [Google Scholar]
- 5.Baptista T, et al. SAGA Is a General Cofactor for RNA Polymerase II Transcription. Mol Cell. 2018;70:1163–1164. doi: 10.1016/j.molcel.2018.06.007. [DOI] [PubMed] [Google Scholar]
- 6.Spedale G, Timmers HT, Pijnappel WW. ATAC-king the complexity of SAGA during evolution. Genes Dev. 2012;26:527–541. doi: 10.1101/gad.184705.111. [DOI] [PMC free article] [PubMed] [Google Scholar]
- 7.Han Y, Luo J, Ranish J, Hahn S. Architecture of the Saccharomyces cerevisiae SAGA transcription coactivator complex. EMBO J. 2014;33:2534–2546. doi: 10.15252/embj.201488638. [DOI] [PMC free article] [PubMed] [Google Scholar]
- 8.Sharov G, et al. Structure of the transcription activator target Tra1 within the chromatin modifying complex SAGA. Nat Commun. 2017;8 doi: 10.1038/s41467-017-01564-7. 1556. [DOI] [PMC free article] [PubMed] [Google Scholar]
- 9.Liu G, et al. Architecture of Saccharomyces cerevisiae SAGA complex. Cell Discov. 2019;5:25. doi: 10.1038/s41421-019-0094-x. [DOI] [PMC free article] [PubMed] [Google Scholar]
- 10.Kohler A, Zimmerman E, Schneider M, Hurt E, Zheng N. Structural basis for assembly and activation of the heterotetrameric SAGA histone H2B deubiquitinase module. Cell. 2010;141:606–617. doi: 10.1016/j.cell.2010.04.026. [DOI] [PMC free article] [PubMed] [Google Scholar]
- 11.Samara NL, et al. Structural insights into the assembly and function of the SAGA deubiquitinating module. Science. 2010;328:1025–1029. doi: 10.1126/science.1190049. [DOI] [PMC free article] [PubMed] [Google Scholar]
- 12.Morgan MT, et al. Structural basis for histone H2B deubiquitination by the SAGA DUB module. Science. 2016;351:725–728. doi: 10.1126/science.aac5681. [DOI] [PMC free article] [PubMed] [Google Scholar]
- 13.Diaz-Santin LM, Lukoyanova N, Aciyan E, Cheung AC. Cryo-EM structure of the SAGA and NuA4 coactivator subunit Tra1 at 3.7 angstrom resolution. Elife. 2017;6 doi: 10.7554/eLife.28384. [DOI] [PMC free article] [PubMed] [Google Scholar]
- 14.Sun J, et al. Structural basis for activation of SAGA histone acetyltransferase Gcn5 by partner subunit Ada2. Proc Natl Acad Sci U S A. 2018;115:10010–10015. doi: 10.1073/pnas.1805343115. [DOI] [PMC free article] [PubMed] [Google Scholar]
- 15.Belotserkovskaya R, et al. Inhibition of TATA-binding protein function by SAGA subunits Spt3 and Spt8 at Gcn4-activated promoters. Mol Cell Biol. 2000;20:634–647. doi: 10.1128/mcb.20.2.634-647.2000. [DOI] [PMC free article] [PubMed] [Google Scholar]
- 16.Warfield L, Ranish JA, Hahn S. Positive and negative functions of the SAGA complex mediated through interaction of Spt8 with TBP and the N-terminal domain of TFIIA. Genes Dev. 2004;18:1022–1034. doi: 10.1101/gad.1192204. [DOI] [PMC free article] [PubMed] [Google Scholar]
- 17.Sermwittayawong D, Tan S. SAGA binds TBP via its Spt8 subunit in competition with DNA: implications for TBP recruitment. EMBO J. 2006;25:3791–3800. doi: 10.1038/sj.emboj.7601265. [DOI] [PMC free article] [PubMed] [Google Scholar]
- 18.Helmlinger D, Tora L. Sharing the SAGA. Trends Biochem Sci. 2017;42:850–861. doi: 10.1016/j.tibs.2017.09.001. [DOI] [PMC free article] [PubMed] [Google Scholar]
- 19.Larschan E, Winston F. The S. cerevisiae SAGA complex functions in vivo as a coactivator for transcriptional activation by Gal4. Genes Dev. 2001;15:1946–1956. doi: 10.1101/gad.911501. [DOI] [PMC free article] [PubMed] [Google Scholar]
- 20.Brown CE, et al. Recruitment of HAT complexes by direct activator interactions with the ATM-related Tra1 subunit. Science. 2001;292:2333–2337. doi: 10.1126/science.1060214. [DOI] [PubMed] [Google Scholar]
- 21.Dudley AM, Rougeulle C, Winston F. The Spt components of SAGA facilitate TBP binding to a promoter at a post-activator-binding step in vivo. Genes Dev. 1999;13:2940–2945. doi: 10.1101/gad.13.22.2940. [DOI] [PMC free article] [PubMed] [Google Scholar]
- 22.Daniel JA, et al. Deubiquitination of histone H2B by a yeast acetyltransferase complex regulates transcription. J Biol Chem. 2004;279:1867–1871. doi: 10.1074/jbc.C300494200. [DOI] [PubMed] [Google Scholar]
- 23.Henry KW, et al. Transcriptional activation via sequential histone H2B ubiquitylation and deubiquitylation, mediated by SAGA-associated Ubp8. Genes Dev. 2003;17:2648–2663. doi: 10.1101/gad.1144003. [DOI] [PMC free article] [PubMed] [Google Scholar]
- 24.Wu PY, Ruhlmann C, Winston F, Schultz P. Molecular architecture of the S. cerevisiae SAGA complex. Mol Cell. 2004;15:199–208. doi: 10.1016/j.molcel.2004.06.005. [DOI] [PubMed] [Google Scholar]
- 25.Gangloff YG, et al. The human TFIID components TAF(II)135 and TAF(II)20 and the yeast SAGA components ADA1 and TAF(II)68 heterodimerize to form histone-like pairs. Mol Cell Biol. 2000;20:340–351. doi: 10.1128/mcb.20.1.340-351.2000. [DOI] [PMC free article] [PubMed] [Google Scholar]
- 26.Birck C, et al. Human TAF(II)28 and TAF(II)18 interact through a histone fold encoded by atypical evolutionary conserved motifs also found in the SPT3 family. Cell. 1998;94:239–249. doi: 10.1016/s0092-8674(00)81423-3. [DOI] [PubMed] [Google Scholar]
- 27.Eisenmann DM, Arndt KM, Ricupero SL, Rooney JW, Winston F. SPT3 interacts with TFIID to allow normal transcription in Saccharomyces cerevisiae. Genes Dev. 1992;6:1319–1331. doi: 10.1101/gad.6.7.1319. [DOI] [PubMed] [Google Scholar]
- 28.Wu PY, Winston F. Analysis of Spt7 function in the Saccharomyces cerevisiae SAGA coactivator complex. Mol Cell Biol. 2002;22:5367–5379. doi: 10.1128/mcb.22.15.5367-5379.2002. [DOI] [PMC free article] [PubMed] [Google Scholar]
- 29.Kamata K, et al. C-terminus of the Sgf73 subunit of SAGA and SLIK is important for retention in the larger complex and for heterochromatin boundary function. Genes Cells. 2013;18:823–837. doi: 10.1111/gtc.12075. [DOI] [PubMed] [Google Scholar]
- 30.Sterner DE, Belotserkovskaya R, Berger SL. SALSA, a variant of yeast SAGA, contains truncated Spt7, which correlates with activated transcription. Proc Natl Acad Sci U S A. 2002;99:11622–11627. doi: 10.1073/pnas.182021199. [DOI] [PMC free article] [PubMed] [Google Scholar]
- 31.Pray-Grant MG, et al. The novel SLIK histone acetyltransferase complex functions in the yeast retrograde response pathway. Mol Cell Biol. 2002;22:8774–8786. doi: 10.1128/mcb.22.24.8774-8786.2002. [DOI] [PMC free article] [PubMed] [Google Scholar]
- 32.Bian C, et al. Sgf29 binds histone H3K4me2/3 and is required for SAGA complex recruitment and histone H3 acetylation. EMBO J. 2011;30:2829–2842. doi: 10.1038/emboj.2011.193. [DOI] [PMC free article] [PubMed] [Google Scholar]
- 33.Simon MD, et al. The site-specific installation of methyl-lysine analogs into recombinant histones. Cell. 2007;128:1003–1012. doi: 10.1016/j.cell.2006.12.041. [DOI] [PMC free article] [PubMed] [Google Scholar]
- 34.Dyer PN, et al. Reconstitution of nucleosome core particles from recombinant histones and DNA. Methods Enzymol. 2004;375:23–44. doi: 10.1016/s0076-6879(03)75002-2. [DOI] [PubMed] [Google Scholar]
- 35.Tegunov D, Cramer P. Real-time cryo-electron microscopy data preprocessing with Warp. Nature Methods. 2019 doi: 10.1038/s41592-019-0580-y. [DOI] [PMC free article] [PubMed] [Google Scholar]
- 36.Zivanov J, et al. New tools for automated high-resolution cryo-EM structure determination in RELION-3. Elife. 2018;7 doi: 10.7554/eLife.42166. [DOI] [PMC free article] [PubMed] [Google Scholar]
- 37.Punjani A, Rubinstein JL, Fleet DJ, Brubaker MA. cryoSPARC: algorithms for rapid unsupervised cryo-EM structure determination. Nat Methods. 2017;14:290–296. doi: 10.1038/nmeth.4169. [DOI] [PubMed] [Google Scholar]
- 38.Yang B, et al. Identification of cross-linked peptides from complex samples. Nat Methods. 2012;9:904–906. doi: 10.1038/nmeth.2099. [DOI] [PubMed] [Google Scholar]
- 39.Chen ZL, et al. A high-speed search engine pLink 2 with systematic evaluation for proteome-scale identification of cross-linked peptides. Nat Commun. 2019;10 doi: 10.1038/s41467-019-11337-z. 3404. [DOI] [PMC free article] [PubMed] [Google Scholar]
- 40.Combe CW, Fischer L, Rappsilber J. xiNET: cross-link network maps with residue resolution. Mol Cell Proteomics. 2015;14:1137–1147. doi: 10.1074/mcp.O114.042259. [DOI] [PMC free article] [PubMed] [Google Scholar]
- 41.Emsley P, Lohkamp B, Scott WG, Cowtan K. Features and development of Coot. Acta Crystallogr D Biol Crystallogr. 2010;66:486–501. doi: 10.1107/S0907444910007493. [DOI] [PMC free article] [PubMed] [Google Scholar]
- 42.Afonine PV, et al. Real-space refinement in PHENIX for cryo-EM and crystallography. Acta Crystallogr D Struct Biol. 2018;74:531–544. doi: 10.1107/S2059798318006551. [DOI] [PMC free article] [PubMed] [Google Scholar]
- 43.Chen VB, et al. MolProbity: all-atom structure validation for macromolecular crystallography. Acta Crystallogr D Biol Crystallogr. 2010;66:12–21. doi: 10.1107/S0907444909042073. [DOI] [PMC free article] [PubMed] [Google Scholar]
- 44.Yang J, et al. The I-TASSER Suite: protein structure and function prediction. Nat Methods. 2015;12:7–8. doi: 10.1038/nmeth.3213. [DOI] [PMC free article] [PubMed] [Google Scholar]
- 45.Elías-Villalobos A, et al. Chaperone-mediated ordered assembly of the SAGA transcription complex. bioRxiv. 2019 doi: 10.1101/524959. 524959. [DOI] [PMC free article] [PubMed] [Google Scholar]
Associated Data
This section collects any data citations, data availability statements, or supplementary materials included in this article.


