

SUMMARY
Saturated fatty acids (SFAs, the “bad” fat) especially palmitate (PA) in human diet are blamed for potential health risks such as obesity and cancer due to SFA-induced lipotoxicity. However, epidemiological results demonstrate a latent benefit of SFAs and it remains elusive whether a certain low level of SFAs is physiologically essential for maintaining cell metabolic hemostasis. Here, we demonstrate that although high-level PA (HPA) indeed induces lipotoxic effects in liver cells, low-level PA (LPA) increases mitochondrial functions and alleviates the injuries induced by HPA or by hepatoxic agent CCl4. LPA-treated mice enhance liver mitochondrial activity and reduce CCl4 hepatotoxicity with improved blood levels of AST, ALT, and m-AST. LPA-mediated mitochondrial homeostasis is regulated by CDK1-mediated SIRT3 phosphorylation which in turn deacetylates and dimerizes CPT2 to enhance fatty acid oxidation. Thus, an advantageous effect is suggested by consumption of low level palmate that augments mitochondrial metabolic homeostasis via CDK1-SIRT3-CPT2 cascade.
In brief
Liu and Xie et al. demonstrate that contrasted to the lipotoxic effects induced by high-level palmitate (the major saturated fatty acid in human diet), consumption of a low-level palmitate enhances mitochondrial metabolism and compromises high-level palmitate induced lipotoxicity and CC14-generated hepatotoxicity via a CDK1-SIRT3-CPT2 cascade.
INTRODUCTION
Overconsumption of fat in the human diet, especially SFAs such as PA, is associated with lipotoxicity-related disorders including obesity, cancer, cardiovascular diseases, diabetes, and nonalcoholic fatty liver diseases (NAFLD) (Forouhi et al., 2014; Mota et al., 2016; Xu et al., 2006). However, unreasonable limitations on SFA intake may be detrimental to normal cellular function, especially for mitochondrial integrity and metabolic homeostasis. Increasing evidence indicates that the connection between SFA consumption and SFA-induced health risks should be reconsidered based on epidemiological studies of energy consumption-associated health menaces (Mancini et al., 2015; Willett et al., 2014). In fact, SFAs have been exonerated of blame for all-cause mortality in cardiovascular diseases, ischemic stroke, or type 2 diabetes (T2D) (de Souza et al., 2015; Lee et al., 2008). A recent study of 27,296 adults from 8 European countries, including 12,132 T2D cases, demonstrates a reduced incidence of T2D in people with increased intake of individual fatty acids (FAs) (Imamura et al., 2017). Based on these findings, it has been strongly suggested that SFA-associated cardiovascular risk should be reevaluated (Siri-Tarino et al., 2010), and a revision of global dietary guidelines has been suggested (Dehghan et al., 2017). The Practice Guideline Committee of the American Association for the Study of Liver has cautioned that polyunsaturated FAs may promote alcohol-induced liver disease whereas consumption of SFAs is potentially protective (O’Shea et al., 2010). A diet high in fat and low in carbohydrates, with exercise, has been recommended for reversing NAFLD (Noakes and Windt, 2017). A cluster of endogenous lipids with antidiabetic and anti-inflammatory function is found to contain PA isomers including palmitic-acid-9-hydroxy-stearic-acid (Yore et al., 2014). Among other potential benefits, PA is known to increase membrane fluidity and glucose metabolism to inhibit hepatocellular carcinoma (Lin et al., 2017). These results, together with our epidemiological analysis on correlations of SFA-associated diseased burden and motility (Table S1), suggest that although overconsumption of SFAs indeed causes lipotoxicity, consumption of a certain level of SFAs appears to be necessary for mitochondrial metabolism and normal cellular function.
The metabolic homeostasis in mitochondria is essential for human health requiring efficient energy dynamics for carrying the fundamental cellular functions (Berardi and Chou, 2014; Graier et al., 2009; Senyilmaz et al., 2015). However, lipotoxicity-induced accumulation of PA especially in non-adipose cells could be a result of experimentally impairing mitochondrial oxidative capacity (Geng et al., 2015; Leamy et al., 2014). Such PA-mediated lipotoxic effects are usually generated by a range of high PA concentrations applied in both in vitro and in vivo study models (Table S2). Thus, although such HPA models have generated relevant information to mimic clinical lipotoxic effects, they may cause us to overlook a potential advantageous function of a physiological level of PA that is required in the evaluation of SFA-associated health issues. PA is the first product during FA synthesis and the major precursor for generation of long chain FAs, which are required for many fundamental cellular functions, such as palmitoylation to enhance the hydrophobicity and determine the localization of proteins (Linder and Deschenes, 2007). Therefore, defining a physiological level of PA required for maintaining mitochondrial homeostasis in non-adipose cells especially in liver will provide critical information for optimizing a well-balanced energy intake to prevent lipotoxicity-associated diseases.
SIRT3, primary mitochondrial deacetylase, plays a critical role in maintaining mitochondrial metabolic homeostasis via deacetylation of mitochondrial proteins (Qiu et al., 2010; Wang et al., 2019; Winnik et al., 2015; Yang et al., 2016). An array of key mitochondrial metabolic factors are under SIRT3 regulation including complex I (Brenmoehl and Hoeflich, 2013), MnSOD (Tao et al., 2010), and isocitrate dehydrogenase 2 (Yu et al., 2012). Recently, MnSOD-K68 acetylation mimic mutant that blocks SIRT3-mediated deacetylation is linked with pro-carcinogenesis (Zhu et al., 2019). SIRT3-mediated mitochondrial homeostasis is believed via preserving the balance between bioenergetic output and clearance of the reactive oxygen species (ROS) (Ozden et al., 2011; Yu et al., 2012). Fatty acids are transferred from the cytoplasm into the mitochondrial matrix by the carnitine O-palmitoyltransferases CPT1 and 2 (Corbet et al., 2016) for the synthesis of ketone bodies through fatty acid oxidation (FAO) and TCA cycle. SIRT3 is shown to regulate the activity of long-chain acyl coenzyme A dehydrogenase (LCAD) in FAO (Hirschey et al., 2010) and required for ameliorating hepatic lipotoxicity (Bao et al., 2010). In addition, CDK1 activates SIRT3 (Liu et al., 2015) and regulates mitochondrial protein influx and bioenergetics (Harbauer et al., 2014; Wang et al., 2014). These findings contribute to the hypothesis that the CDK1-SIRT3-FAO pathway could be essential for the potential metabolic benefits induced by consumption of a low level of SFAs. This study reveals an advantageous mitochondrial homeostasis in LPA-treated mouse liver cells with CRISPR-edited gene deficiency and in vivo mouse hepatotoxicity. LPA boosts mitochondrial metabolism and enhances the capacity to defend lipotoxicity in liver cells or CCl4 -induced mouse hepatotoxicity. SIRT3 is activated by CDK1-mediated phosphorylation in mitochondria followed by SIRT3-mediated deacetylation and dimerization CPT2. Thus, LPA generates a favorable effect in liver cells via CDK1-SIRT3-CPT2 cascade.
RESULTS
LPA promotes mitochondrial homeostasis and limits hepatotoxic injury
Referring WHO-recommendation and study-based suggestion (Dehghan et al., 2017) for a standard SFA consumption level (7-10%, marked green in Figure 1A), we used the Global Dietary Database to estimate the correlation between consumption level of SFAs and the disease burden of liver cirrhosis (Figure 1B, 1C) as well as the mortality from other lipotoxicity-related diseases (Figure S1). The burden of liver cirrhosis from all causes (alcohol use, pathogenic factors, hepatitis B and C, and all other causes) was reduced in populations with SFA energy intake between 7% and 10% compared to populations with SFA intake of either >10% or <7% (Figure 1B, 1C, and Table S1). The mortality of major lipotoxicity-related disease was indeed increased with the level of SFA-based energy intake >10%, however, no difference in mortality was detected in populations with SFA consumption of 7-10% and <7% (Figure S1). Refereeing to HPA being used to induce lipotoxicity to mimic clinical observations of SFA overconsumption, cellular response to the increased PA (≥100 μM) and lowered PA (< 100 μM) concentrations as well as animal tests on the liver response to a PA-enriched high-fat diet (HFD) were summarized in Table S2, which was referred to estimate the HPA and LPA concentrations in this study.
Figure 1. LPA promotes mitochondrial homeostasis.
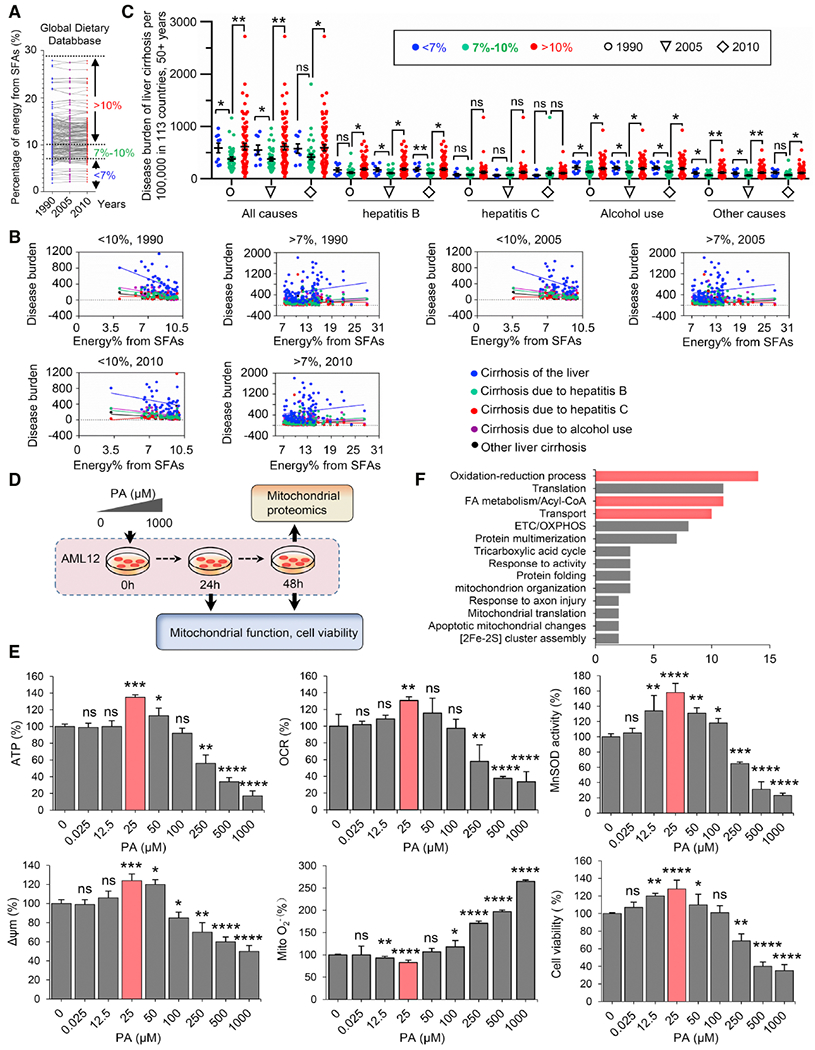
(A) Status of SFA energy consumption in 113 countries in 1990, 2005, and 2010.
(B) Correlation of the burden of liver cirrhosis (defined as in panel B) related to alcohol use and all other pathogenic factors (hepatitis B and C, and all other causes) with the percentage of energy derived from SFAs, based on the WHO’s 2015 report on the Global Burden of Liver Cirrhosis (http:www.who.int/en) and Global Dietary Database (https://www.globaldietarydatabase.org/).
(C) The burden of all-cause liver cirrhosis is reduced by consumption of a certain range of SFAs (7-10%) compared to either lower or higher consumption levels. Data points show the distribution of liver cirrhosis-specific disability-adjusted life year (DALYs) per 100,000 population aged 50 years and older in populations from 113 countries (mean ± SEM, *P < 0.05; **P < 0.01; ns, no significance).
(D) Schematic of the experiments characterizing the mitochondrial function and cell viability of mouse liver AML12 cells treated with a PA concentration gradient.
(E) Mitochondrial activities including ATP generation, OCR, MnSOD activity, Δψm, O2− and cell viability were measured in AML12 cells treated with PA at the indicated concentration for 48 h. Data were presented as the percentage of the control after normalization to the samples with BSA 0.05%. n = 3, mean ± SEM, *P < 0.05; **P < 0.01, ***P < 0.001, **** P < 0.0001, vs. BSA; ns, no significance. LPA treatment for 24 h is shown in Figure S2A.
(F) Mitochondrial proteomics of AML12 cells measured 48 h after LPA (25 μM) treatment vs. cells treated with 0.05% BSA. Data were categorized by DAVID bioinformatics, proteins in FA metabolism and redox balance were marked in red.
Regarding the lipotoxicity-associated major human diseases and mortality, our epidemiological analyses revealed a potential undiscovered benefit by consumption of a certain low level of SFA. We thus assumed that consumption of PA at a certain low level may benefit cellular metabolism especially in non-adipose cells such as liver cells that play the fundamental roles in lipid metabolism. Following this line of reasoning, we investigated mitochondrial function and cell viability in mouse liver AML12 cells exposed to a gradient of PA concentrations (0-1000 μM) for 24 h and 48 h (Figure 1D). Indeed, HPA-induced lipotoxicity was recapitulated with reduced mitochondrial functions including ATP generation, oxygen consumption rate (OCR), MnSOD activity, membrane potential (Δψm), and cell viability treated with HPA (>250 μM), and mitochondrial O2− increased proportionally with PA concentration (Figure 1E). In contrast, no detectable mitochondrial dysfunction was observed in cells treated with <100 μM PA. Surprisingly, ATP, OCR, MnSOD activity, and Δψm were enhanced by 35%, 30%, 58%, and 24%, respectively, with a corresponding reduction in mitochondrial O2− and increased cell viability, in cells treated with 25 μM PA (this PA concentration was determined as the LPA for liver cells; Figure 1E, Figure S2A). Similarly, the LPA-boosted mitochondrial functions were also observed in primary cultured mouse liver cells (Figure S2B). In addition, LC/MS-based proteomic analysis of LPA-treated AML12 cells further revealed about 170 proteins involved in LPA-induced reprogramming mitochondrial metabolism and homeostasis (Figure 1F). These proteins were involved in FAO, redox metabolism, and oxidative phosphorylation (OXPHOS) (Figure 1F, Figure S3) that appeared to be different from the key pathways induced in vivo response following diet with high calories from fat (Table S3), supporting a potential LPA benefit via a unique signaling pathway.
LPA alleviates mitochondrial injury induced by HPA
We then wondered if such LPA-enhanced mitochondrial activity could be defensive against the lipotoxic effects induced by overconsumption of SFAs. AML12 cells and primary mouse liver cells were pretreated with LPA for 48 h and then challenged with a dose of HPA (500 μM). Surprisingly, the entire index of mitochondrial functions tested was improved by LPA with reduced O2− levels and increased cell viability (Figure 2A, Figure S4A). However, the boosted levels of mitochondrial activity appeared to be time-dependent. LPA pretreatment for 24 h did not enhance MnSOD activity, cell viability, and FAO, although ATP generation, OCR, Δψm, and O2− levels were improved (Figure S4B and S4C). Consistently, accumulated free fatty acids (FFAs) and severe cellular damage were detected in cells treated with HP A, whereas LPA pretreatment prevented such changes (Figure 2B) and reduced FFAs (Figure 2C), suggesting that LPA-pretreated liver cells are able to attenuate lipid accumulation with increased FAO capacity. LPA was also shown to prevent HPA-induced cytochrome C release from mitochondria (Figure 2D), with well-maintained mitochondrial mass, number, and structural integrity compared with the cells treated with HP A alone (Figure 2E).
Figure 2. LPA pre-exposure prevents mitochondrial injury induced by HPA or CCl4.
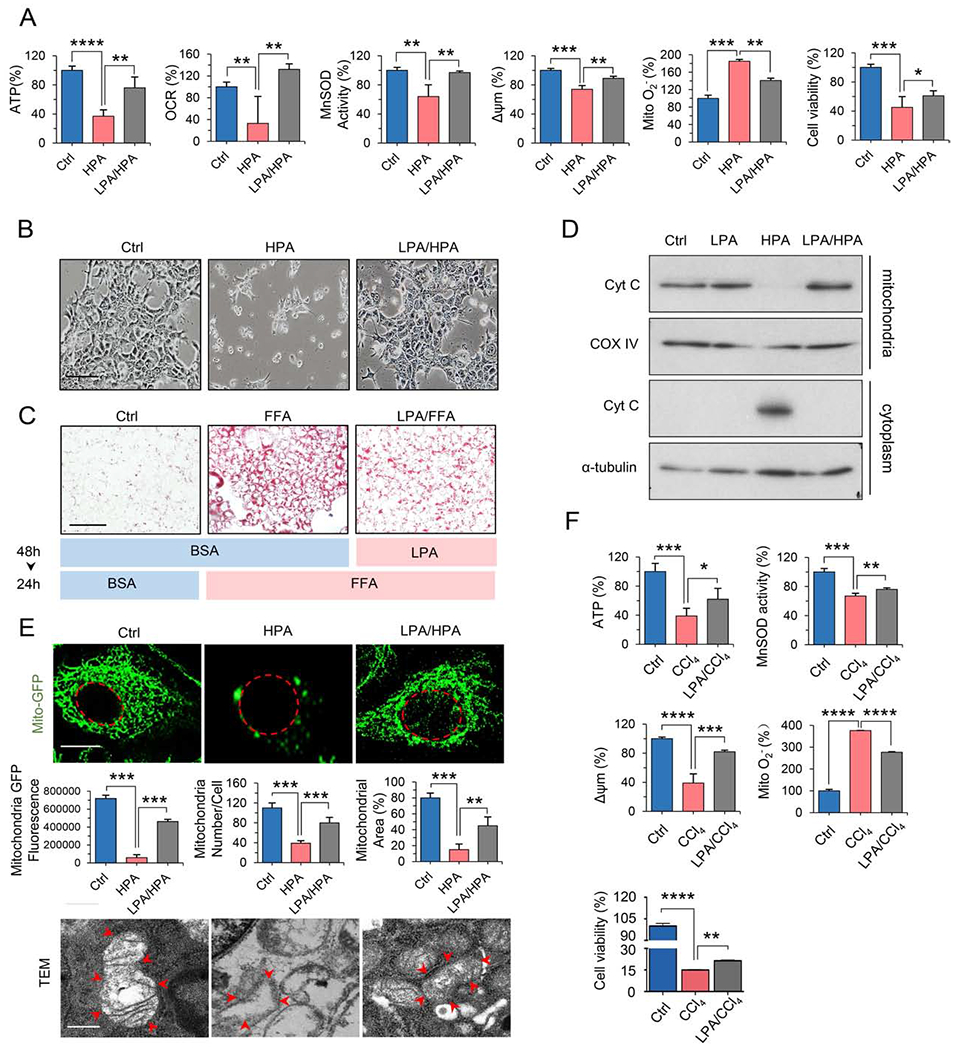
(A) Mitochondrial ATP, OCR, MnSOD activity, Δψm, O2− and cell viability measured in AML12 cells pretreated with BSA or LPA for 48 h, followed by HPA (500 μM) for 24 h. n = 3, mean ± SEM, *P < 0.05, **P < 0.01, ***P < 0.001, ****P < 0.0001, vs. HPA.
(B) Morphological alterations of AML12 cells treated with BSA (Ctrl), HPA, or HPA plus pretreatment with LPA. Scale bar, 100 μm.
(C) Oil red O staining of AML12 cells pretreated with BSA (Ctrl) or LPA for 48 h followed by BSA or free fatty acids (FFAs, OA: PA = 2:1) for 24 h. Scale bar, 100 μm.
(D) Western blotting of mitochondrial or cytoplasmic proteins of AML12 cells treated in (A). Cyt C, cytochrome C; COX IV, mitochondrial loading control.
(E) Mass and integrity analysis of mitochondria of AML12 cells treated as in (A). Upper panel: Fluorescence microscopy images of GFP-labeled mitochondria (Mito-GFP; nuclear membrane is indicated with a dashed red line). Quantification of mitochondrial mass with ImageJ.; n = 30, mean ± SEM, vs. HPA **P < 0.01, ***P < 0.001 (scale bar, 4 μm). Lower panel: Transmission electron microscopic (TEM) images of mitochondrial ultrastructure (mitochondrial membrane is indicated with red arrows (scale bar, 500 nm).
(F) Mitochondrial function and cell viability were measured in AML12 cells treated with LPA followed by CCl4 exposure (10 μM) for 3 h. n = 3, mean ± SEM, *P < 0.05, **P < 0.01, ***P < 0.001, ****P < 0.0001, vs. CCL4.
See also Figure S4.
LPA reduces mitochondrial injury and alleviates hepatotoxicity induced by CCl4
We next asked whether LPA-enhanced mitochondrial function could also be protective against ROS-mediated mitochondrial injury and hepatotoxicity. Mitochondrial function and cell viability were measured in AML12 cells with or without LPA pretreatment following exposure to CCl4, a well-studied toxic agent that impairs mitochondrial function via ROS generation (Domenicali et al., 2009). As expected, exposure to CCl4 decreased ATP generation, MnSOD activity, Δψm, and cell viability, and elevated levels of mitochondrial O2−; however, all of these changes were significantly ameliorated in cells pretreated with LPA (Figure 2F). Using GFP-labeled mitochondrial proteins and transmission electron microscopy, we showed that mitochondrial mass and ultrastructural integrity were markedly protected in LPA-pretreated cells compared to the control cells without LPA pretreatment (Figure S4D).
LPA-mediated hepatoprotective function was then tested using the established mouse model of CCl4-induced acute liver injury (Morales-Garza et al., 2017). The most effective in vivo PA concentration was determined based on tests in mice showing that intragastric gavage with 0.5 mg/mL PA, but not 5.0 mg/mL or 100 mg/mL, increased mitochondrial Δψm and reduced O2− in the liver (Figure S5A). Thus, 0.5 mg/mL PA was applied as the in vivo LPA. The optimized concentration of CCl4 was also established by exposure of mice to 100%, 50%, and 10% solutions of CCl4 (Figure S5B and S5C). The grade of hepatotoxicity and mitochondrial injury were then assessed in mice pretreated by intragastric gavage with 0.5 mg/mL PA for 3, 6, and 12 days, followed by treatment with 100% CCl4 (Figure S5G). Remarkably, mice receiving the pretreatment of LPA for 12 days significantly reduced the degree of mitochondrial damages induced by CCl4 measured by ATP generation, MnSOD activity, Δψm, and mitochondrial O2− (Figure 3A). The mice showed no significant alterations in blood levels of ALT (alanine transaminase) and m-AST (mitochondrial aspartate transaminase) in response to in vivo LPA treatment, though AST (aspartate aminotransferase) was slightly lowered (Figure 3B). However, the rise in blood levels of ALT, AST, and m-AST triggered by CCl4 (127%, 41%, and 553%, respectively) was markedly lowered in LPA-pretreated mice (Figure 3B). No obvious alterations in body weight and liver weight were observed in any group of mice (Figure S5D and S5E). LPA-mediated liver protection was further demonstrated by the inhibition of inflammatory infiltration in the CV area in the liver tissues (Figure 3C, top), and well-preserved mitochondrial structure and cristae (Figure 3C, bottom). In addition, no PA accumulation was detected in the livers of LPA-pretreated mice (Figure S5F). Interestingly, mice with LPA administration for 3 and 6 days did not show noticeable LPA-mediated protection against CCl4-mediated hepatotoxicity and metabolic damages (Figures S5H and S5I). Together with the in vitro data showing less protection by LPA pretreatment at 24 h versus 48 h (Figure S4B), these results indicate that a lag time is required for LPA to induce mitochondrial protection. In mice, a period of 12 days of LPA administration seems to be required to provide a protective effect.
Figure 3. LPA boosts mitochondrial activity and reduces CCl4-induced liver injury.
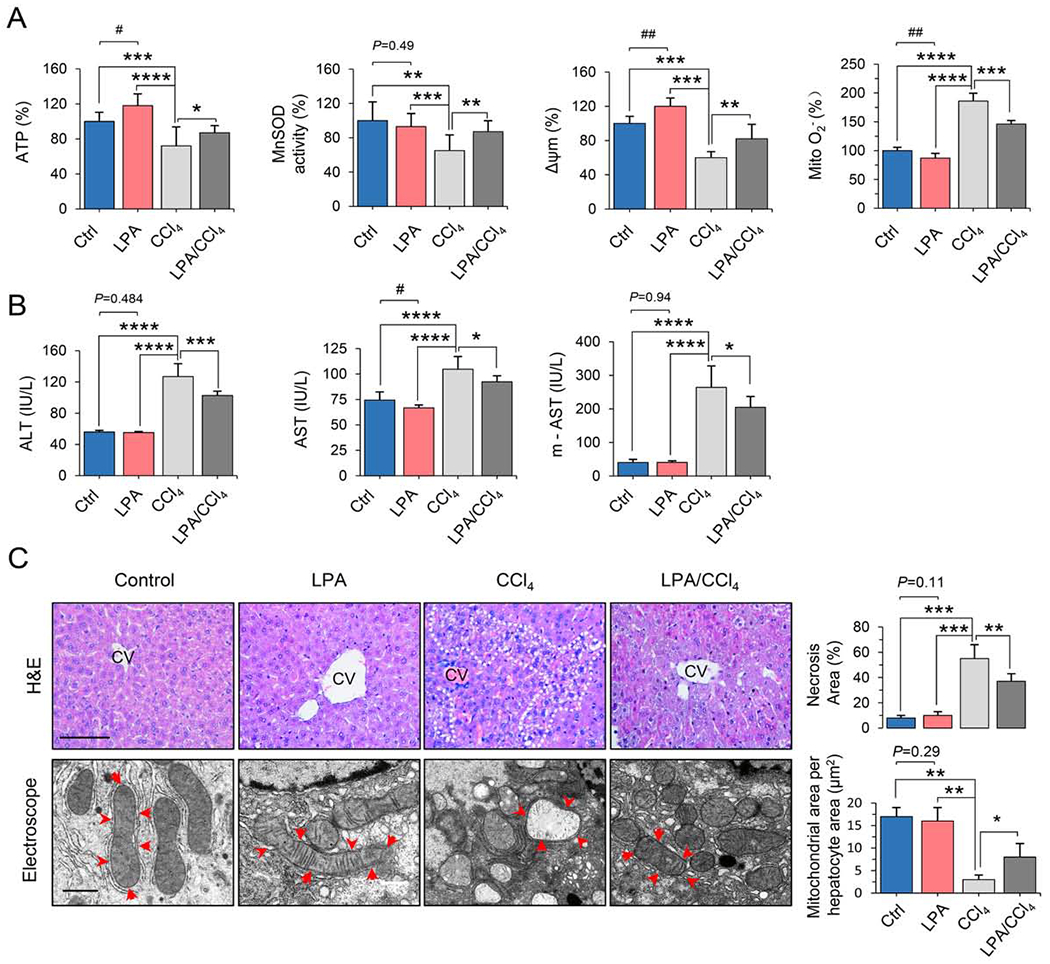
(A) Mitochondrial functions of primary liver cells isolated from the mice of control and treatments with LPA, CCl4 and LPA/CCl4 n = 8, mean ± SEM, *P < 0.05, ** P < 0.01, *** P < 0.001, ****P < 0.0001, vs. CCL4; #P < 0.05, ##P < 0.01 vs. Ctrl.
(B) Blood levels of AST, ALT, and mitochondrial AST (m-AST) in the animals of control, LPA, CCl4 and LPA/CCl4 groups. n = 8, mean ± SEM, *P < 0.05, ***P < 0.001, ****P < 0.0001, vs. CCL4; #P < 0.05. vs. Ctrl.
(C) Images of CCl4-induced inflammatory infiltration and necrotic lesions in liver tissue (H&E staining and quantification, top), and mitochondrial damage (TEM, bottom) in livers from mice from the control, LPA, CCl4, and LPA/CCl4 groups. The necrotic lesions in H&E staining were analyzed with ImageJ software, and the mitochondrial structural integrity was scored by mitochondrial area per hepatocyte, μm2. Top scale bar, 40 μm; bottom scale bar, 500 nm. n = 8, mean ± SEM, *P < 0.05; **P < 0.01, ***P < 0.001, vs. CCL4.
See also Figure S5.
CDK1 boosts SIRT3 activity in LPA-induced reprogramming mitochondrial metabolism
We and others have previously reported that CDK1 functions as a sensor for cellular energy demand and mitochondrial bioenergetics (Harbauer et al., 2014; Qin et al., 2015; Wang et al., 2014). Here we found that cyclin Bl, the partner of CDK1 for CDK1 activation, and the activated form of CDK1 (phosphorylated at T161; pCDK1-T161) were increased in the mitochondria of cells treated with LPA for 48 h but decreased in the mitochondria of cells incubated with HPA (Figure 4A, Figure S6A). To determine whether CDK1-mediated mitochondrial energy sensing is involved in LPA-promoted mitochondrial homeostasis, mitochondria-directed wild-type CDK1 and kinase-deficient CDK1 were separately transfected into AML12 cells (Figure S6B). Expression of mitochondria-directed wild-type CDK1 but not the kinase-deficient mutant enhanced mitochondrial function and cell viability (Figure 4B, Figure S6C). In CCl4 hepatotoxic tests (Figure 4C), surprisingly, pCDK1-T161 was totally abolished in the liver mitochondria of mice treated with CCl4 alone but a substantial amount of pCDK1-T161 and cyclin Bl were preserved in the liver mitochondria of mice pretreated with LPA for 12 days before CCl4 administration (Figure 4D).
Figure 4. LPA enhances mitochondrial homeostasis via CDK1-mediated SIRT3 activation.
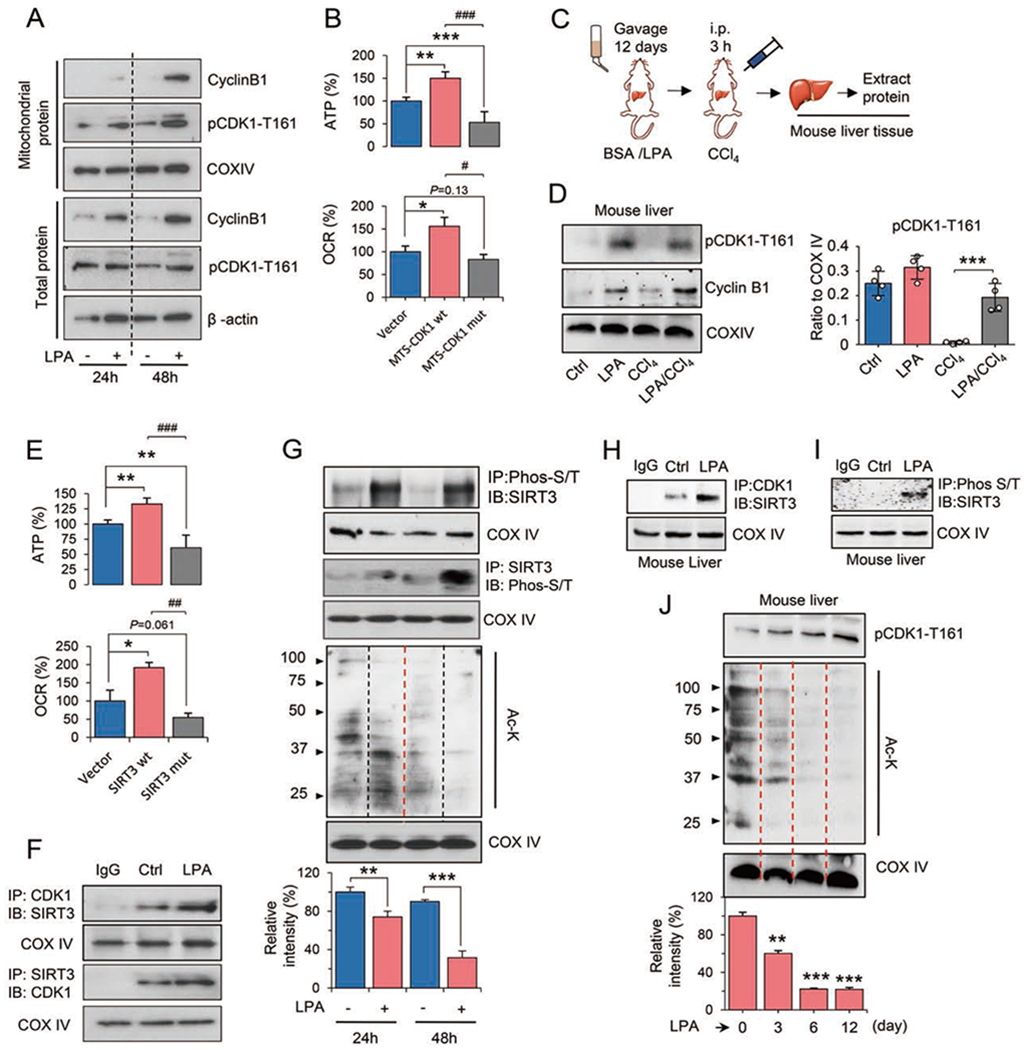
(A) Total and mitochondrial cyclin B1 and activated CDK1 (pCDK1-T161) in AML12 cells treated with LPA for 24 and 48 h.
(B) ATP and OCR measured in AML12 cells transfected with the mitochondria-targeted wild-type (wt) or kinase-deficient (mut) CDK1. n = 3, mean ± SEM, *P < 0.05, **P < 0.01, ***P < 0.001 vs. Vector; #P < 0.05, ###P < 0.001, vs. MTS-CDK1 wt.
(C) Experimental design for detecting the CDK1-SIRT3 pathway in mouse livers treated with LPA. The procedures for LPA gavage, CCl4 injury, and mitochondrial preparation from mouse livers were the same as in Figure S5A.
(D) Western blotting of mitochondrial cyclin B1 and pCDK1-T161 from pooled liver tissues of mice in the control, LPA, CCl4 and LPA/CCl4 groups. Right, relative levels of pCDK1-T161 were quantified by ImageJ. n = 4, mean ± SEM. ***P < 0.001.
(E) ATP and OCR of AML12 cells transfected with wild-type (wt) or double mutant (mut) SIRT3-T8A/S17A. n = 3, mean ± SEM, *P < 0.05, **P < 0.01, vs. Vector. ##P < 0.01, ###P < 0.001, vs. SIRT3 wt.
(F) Enhanced interaction between CDK1 and SIRT3 was detected by immunoprecipitation (IP) in mitochondrial fractions of LPA-treated AML12 cells. IB, immunoblot.
(G) Phosphorylated SIRT3 and acetylated proteins of mitochondrial fractions were detected in AML12 cells treated with or without LPA. Acetylated mitochondrial proteins were quantified by ImageJ. n = 4, mean ± SEM, **P < 0.01, ***P < 0.001.
(H) Interaction between CDK1 and SIRT3 in liver tissues of control and LPA-treated mice.
(I) Phosphorylated SIRT3 proteins detected in liver mitochondria of LPA-treated mice.
(J) pCDK1-T161 and acetylated proteins in liver mitochondria of mice treated with LPA for 0, 3, 6, and 12 days. Acetylated mitochondrial proteins were quantified by ImageJ. n = 4, mean ± SEM, **P < 0.01, ***P < 0.001, vs. day 0.
See also Figure S6.
Mitochondrial homeostasis is linked to the regulation of SIRT3, a well-defined mitochondrial deacetylase (Kim et al., 2010; Tao et al., 2010) that attenuates PA-induced ROS (Koyama et al., 2011). SIRT3 activity can be up-regulated by CDK1 by irradiation (Liu et al., 2015). As expected, mitochondrial ATP production and OCR were enhanced 50% and 56%, respectively, in AML12 cells harboring wild-type SIRT3 and reduced 33% and 91% in cells expressing the mutant of SIRT3-T8A/S17A (Figure 4E). Information on the SIRT3 double mutant and other mitochondrial functions including Δψm, O2−, and cell viability were shown in Figure S6F. A direct interaction between CDK1 and SIRT3 was detected in AML12 cells and was remarkably boosted by LPA treatment (Figure 4F). To determine whether the SIRT3 phosphorylation is also enhanced by LPA, immunoprecipitation was conducted first with anti-phospho-S/T antibody, followed by immunoblotting with anti-SIRT3 antibody, demonstrating that phosphorylated SIRT3 was noticeably elevated by LPA pretreatment for both 24 h and 48 h. At the same time, the acetylation level of mitochondrial proteins was reduced by 24 h and 48 h LPA incubation, confirming that incubation of AML12 cells with LPA activates SIRT3 (Figure 4G). This result again supports the pattern of time-dependent LPA-mediated mitochondrial homeostasis.
In vivo tests also demonstrated a striking enhancement of CDK1/SIRT3 complex formation (Figure 4H) and a remarkable elevation of phosphorylated SIRT3 (Figure 4I) in mice pretreated with LPA for 12 days. Levels of pCDK1-T161 and acetylated mitochondrial proteins showed a dependence on the duration of pretreatment with LPA, with the greatest difference at 12 days (Figure 4J). Although reduced acetylation of mitochondrial proteins and enhanced pCDK1-T161 were observed in the livers of mice treated with LPA for 3 and 6 days (Figure 4J), recall that no detectable improvement in blood levels of ALT and AST were observed at these time points (Figure S5G and S5H), indicating that a lag period is required for full enhancement of liver mitochondrial function via LPA-mediated SIRT3 activation. Together, these results clearly demonstrate that LPA can promote adaptive mitochondrial metabolism and homeostasis via CDK1-mediated SIRT3 activation.
CPT2 is deacetylated and activated following CDK1-SIRT3 activation
Following the finding of LPA-mediated activation of CDK1-SIRT3 pathway, we then determined the potential key enzymes in mitochondrial FAO. SIRT3 is shown to regulate mitochondrial FAO (Hirschey et al., 2010) and required for ameliorating hepatic lipotoxicity (Bao et al., 2010). CPT2 has been indented to be a critical FAO enzyme located on the inner mitochondrial membrane (Figure S6G) (Hsiao et al., 2006). Although CPT2 was not in the list of LPA-enhanced profile by proteomics analysis (Figure 1F, Figure S3A), and the protein level was not enhanced (Figure 5A), LPA increased the CPT2 enzymatic activity by 60% measured by 14C-radiochemical assay. Refereeing the reported SIRT3-mediated deacetylation residues (Tao et al., 2010; Zhu et al., 2019), two potential deacetylation candidate residues Lysine 453/457 (K453/457) in CPT2 were predicted by SWISS-MODEL (Figure S6G–I). Direct interaction of SIRT3 and CPT2 was detected and strikingly enhanced by LPA (Figure 5B), and the acetylated form of CPT2 was also reduced (Figure 5B). Furthermore, this result was recapitulated in mouse liver pretreated with LPA (Figure 5C). Thus both in vitro and in vivo results demonstrate that SIRT3-mediated CPT2 deacetylation is involved in LPA-induced mitochondrial metabolism.
Figure 5. SIRT3 S17 phosphorylation is required for deacetylation and activation of CPT2.
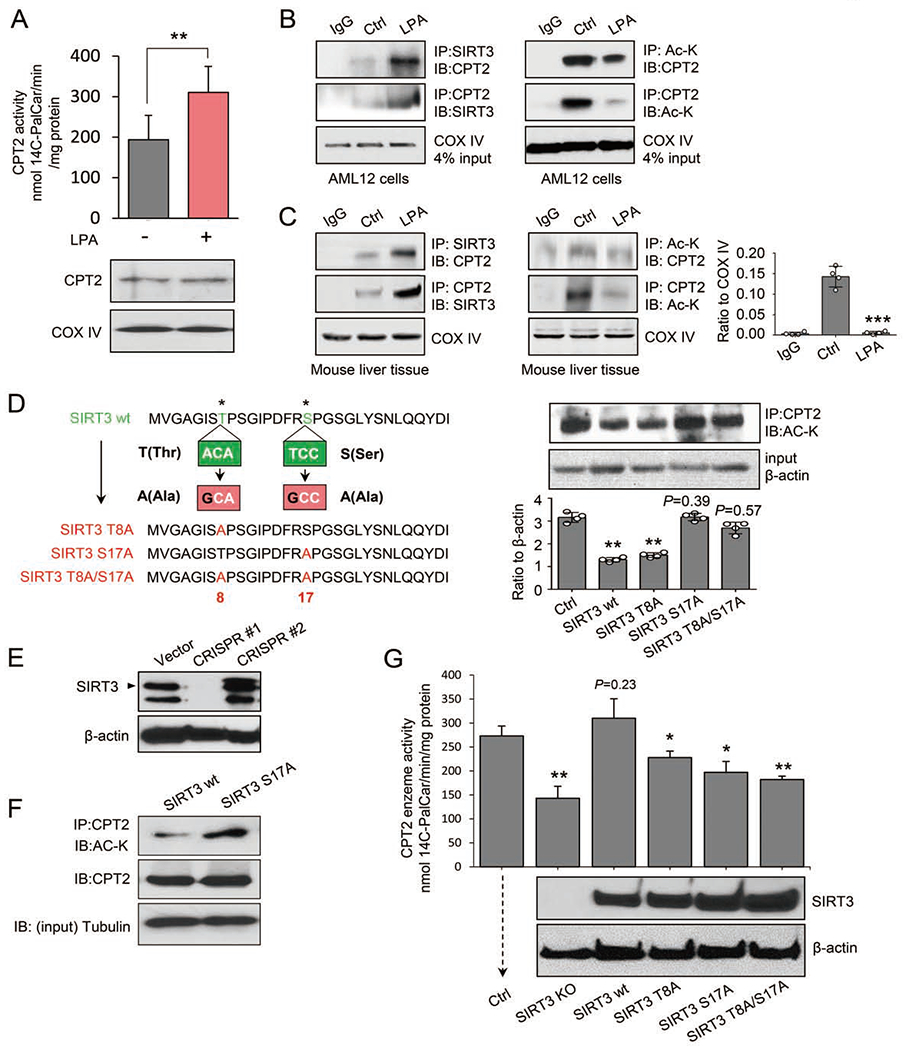
(A) Enzymatic activity was measured by radiochemical assay in LPA-treated AML12 cells, n = 3, mean ± SEM, **P < 0.01. Lower panel: Western blot showing the equal expression of CPT2 using COX IV as the mitochondrial protein marker.
(B) Interaction between SIRT3 and CPT2 (left) and reduced CPT2 acetylation (right) were detected in AML12 cells treated with LPA or control solution.
(C) Interaction between SIRT3 and CPT2 (left) and CPT2 acetylation (middle) were detected in primary mouse liver cells treated with LPA or control solution. CPT2 acetylation was quantified by ImageJ (right), n = 4, mean ± SEM, ***P < 0.001, vs. Ctrl.
(D) Left, schematic illustration of site-specific mutations of SIRT3: Thr8 → Ala8, Ser17 → Ala17, or Thr8/ Seri 7 → Ala8/Ala17 using a site-directed mutagenesis kit (New England BioLabs Inc, Cat# E0554). Right, the expression level of acetylated CPT2 detected in AML12 cells expressing wild-type SIRT3, SIRT3-T8A or SIRT-S17A mutant, or SIRT3-T8A/S17A double mutants. In ImageJ quantitation, n = 4, mean ± SEM, **P < 0.01, vs. Ctrl.
(E) Western blotting of SIRT3 in AML12 cells with two CRISPR/Cas9-mediated SIRT3 knockouts. CRISPR #1 (mSIRT3 #1 guide RNA) was used for subsequent experiments.
(F) Acetylated CPT2 proteins detected in SIRT3-KO AML12 cells rescued with wild-type SIRT3 (wt) or SIRT3-S17A mutant.
(G) CPT2 enzymatic activity measured by radiochemical assay in CRISPR/Cas9 SIRT3-KO AML12 cells re-expressing of wt and mutant SIRT3 treated by LPA. The re-expressed proteins of wild-type SIRT3 (SIRT3 wt), SIRT3-T8A, SIRT-S17A, or SIRT3-T8A/S17A were verified by Western blot of SIRT3 and β-actin as the loading control, n = 3, mean ± SEM, *P < 0.05, **P < 0.01, vs. Ctrl.
To verify that SIRT3 is specifically phosphorylated by CDK1 in LPA-mediated mitochondrial enhancement, we constructed lentiviral vectors expressing wild-type murine SIRT3, mutant SIRT3-T8A, mutant SIRT3-S17A, and double mutant SIRT3-T8A/S17A in AML12 cells (Figure 5D, Figure S6D and S6E). Interestingly, compared to cells expressing wild-type SIRT3, the acetylated CPT2 was not enhanced in cells expressing SIRT3-T8A, but cells harboring the SIRT3-S17A or SIRT3-T8A/S17A constructs showed increased CPT2 acetylation (Figure 5D), indicating that S17 of SIRT3 is specifically required for SIRT3-mediated CPT2 deacetylation.
Again, to determine whether the phosphorylation of SIRT3 at S17 is critical for CPT2 activation, CRISPR/Cas9-edited SIRT3 knockout cells (SIRT3-KO; clone CRISPR#1, Figure 5E; targeting sequences shown in Table S4) were reconstituted with wild-type SIRT3 or SIRT3-S17A, showing that the SIRT3 mutation at S17 (S to A) significantly increased the acetylation of CPT2 (Figure 5F), indicating that S17 is required for SIRT3-mediated CPT2 deacetylation. Moreover, CPT2 activity, which decreased by 59% in SIRT3-KO cells, was completely rescued (104%) by re-expressing wild-type SIRT3. In contrast, the rescuing capacity was severely hampered in cells transfected with the SIRT3-S17A or SIRT3-T8A/S17A mutants (Figure 5G).
SIRT3-mediated CPT2 dimerization is required for LPA-enhanced FAO
CPT1A is a carnitine-acylcarnitine translocase locating within the mitochondrial outer membrane. It self-assembles into an oligomeric complex and catalyzes the rate-limiting step in the transport of long chain acyl-CoAs. CPT1A and CPT2 share 50 % homology. We thus speculated that CPT2 functions as an oligomer enhanced by SIRT3-mediated deacetylation. Importantly, two potential acetylation sites K453 and K457 were located (Figure S6G) with p-values of 0.0009 and 0.0299 (http://bioinfo.bimu.edu.cn/huac/predict_p/) and highly conserved across species (Figure S6H). To test whether K453/K457 are required for the dimerization of CPT2, AML12 cells were transfected with a lentivirus expressing v5-tag-linked CPT2, and as expected, via native gel analysis, a band close to twice the expected size of CPT2 (68 kDa) was detected in control cells and remarkably enhanced by LPA pretreatment (Figure 6A). The role of deacetylation of K453/K457 was then tested by rescuing CPT2-KO cells (Figure 6B; CRISPR-2; sgRNA-targeting sequences were shown in Table S4) with expression of wild-type CPT2 or mutants K453Q, K457Q, or K453Q/K457Q (Figure 6C, Figure S6I). SIRT3-mediated CPT2 dimerization was indicted by a strong band of the v5-tag near 150 kDa detected in CRISPR-KO CPT2 cells reconstituted with v5-tag wild-type CPT2. However, such dimerization was greatly reduced in cells expressing CPT2-K453Q or CPT2-K457Q, where Q mimicked the constitutive acetylation that blocks deacetylation (Park et al., 2016), and absent in cells expressing the double CPT2-K453Q/K457Q mutant. In contrast, the dimerized CPT2 was enhanced in CPT2 cells with CPT2-K453R, K457R or K453R/K457R with Q-R mutation that enhances deacetylation (Figure 6D). CPT2 enzymatic activity measured by 14C-radiochemical assay further demonstrated that the 38% CPT2 activity remaining in the CPT2-KO cells was completely restored by expressing wild-type CPT2 and could be further enhanced by expression of deacetylation-mimic CPT2 mutants (K453R, K457R or K453R/K457R). In consistence, wild type CPT2 mediated restoration of CPT2 activity was absent in CPT2-KO cells reconstituted with acetylation mimics but restored in the deacetylation mimics (Figure 6E). Furthermore, FAO-driven oxygen consumption (Figure 6F), and mitochondrial ATP generation and OCR (Figure 6G) were completely enhanced by reconstitution of wile type CPT2 but absent in the acetylation mimics. The CPT2 deacetylation mimics were also shown to be able to enhance mitochondrial metabolism (ATP generation, OCR, MnSOD activity, Δψm, O2−) and cell viability in the absence of CDK1 and SIRT3 (Figure S6J–S6L). Collectively, these data provide the experimental evidence indicating that CPT2 K453/K457 are the sites of SIRT3-mediated CPT2 activation which is required for CPT2 dimerization in LPA-induced mitochondrial metabolic enhancement.
Figure 6. SIRT3-mediated CPT2 dimerization and activation via deacetylation at K453 and K457.
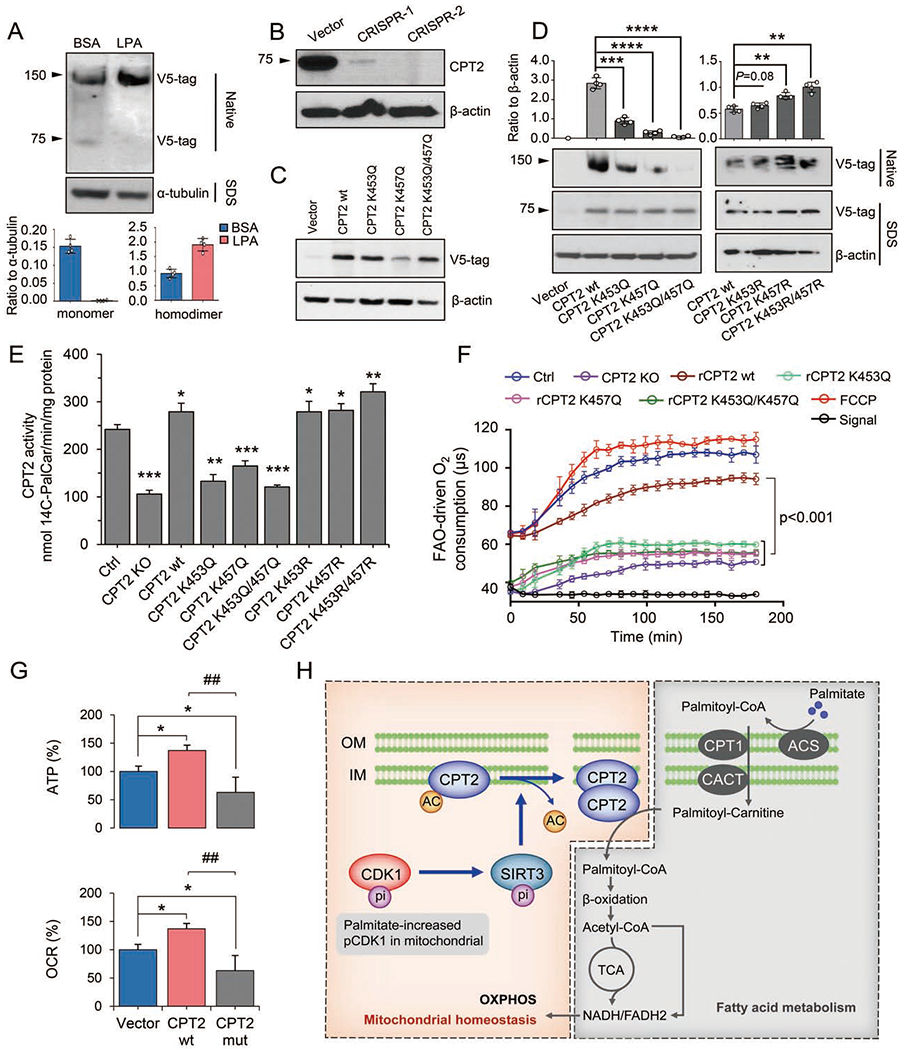
(A) Enhanced CPT2 dimerization in AML12 cells transfected with v5-tag-labeled CPT2 and treated with LPA for 48 h. In ImageJ analysis, n = 4, mean ± SEM.
(B) Western blot of CPT2 in CRISPR/Cas9-ediated CPT2 KO AML12 cells. CRISPR-2 with complete CPT2 knockout was selected for subsequent experiments.
(C) Western blot of CPT2 in CPT2 KO cells reconstituted with v5-tag-labeled wild-type CPT2 (CPT2 wt), mutants K453Q or K457Q, or double mutant K453Q/K457Q.
(D) Formation of CPT2 homodimers in CRISPR-CPT2 knockout cells rescued with wild-type CPT2, mutants K453Q, K457Q, K453Q/K457Q or K453R, K457R, K453R/K457R that mutated back from K453Q, K457Q and K453Q/K457Q, respectively. Homodimers were quantified with ImageJ and normalized to a-tubulin, n = 4, mean ± SEM, **P < 0.01, ***P < 0.001, ****P < 0.0001, vs. CPT2 wt.
(E) CPT2 enzymatic activity as measured by 14C-radiochemical assay in LPA-treated cells compared with CPT2 knockout cells (KO) rescued with wild-type CPT2, mutants K453Q, K457Q, K453Q/K457Q or K453R, K457R, K453R/K457R that mutated back from K453Q, K457Q and K453Q/K457Q, respectively, n = 3, mean ± SEM, *P < 0.05, **P < 0.01, ***P< 0.001, vs. Ctrl.
(F) FAO-driven oxygen consumption was measured in LPA-treated CPT2 KO cells and the KO cells re-expressed wt or mutant (K453Q, K457Q or K453Q/K457Q) CTP2. The uncoupler FCCP was used to induce maximal electron transport chain activity by dissipating Δψm. Signal and signal control (ctrl) were used to show the probe signal in the absence of cellular respiration.
(G) ATP and OCR in LPA-treated CRISPR-CPT2 knockout AML12 cells rescued with wild-type (wt) CPT2 or K453Q/K457Q mutant (mut). n = 3, mean ± SEM, *P< 0.05, vs. Vector; ##P < 0.01, ###P < 0.001, vs. CPT2 wt.
(H) CDK1-SIRT3-CPT2 cascade in LPA-promoted mitochondrial homeostasis. Findings from this study demonstrate a unique mechanism wherein mitochondrial homeostasis is maintained by a low concentration of PA (LPA). LPA enhances CDK1, which up-regulates SIRT3 in mitochondria via Serl7 phosphorylation. CPT2 activity is then boosted by SIRT3-mediated deacetylation of CPT2 at K453/K457, causing CPT2 dimerization to accelerate CPT2 activity and FAO. OM, outer membrane; IM, inner membrane.
DISCUSSION
In contrast to the popular conception of SFAs as deleterious to human health, this study reveals a beneficial effect induced by LPA on mitochondrial function and liver welfare. We report here that LPA promotes adaptive mitochondrial homeostasis that is able to ameliorate mitochondrial injuries induced by subsequent exposure to HPA or by exposure to hepatoxic agent CCl4. In the CCl4 mouse hepatotoxicity model, LPA-mediated adaptive mitochondrial activation lessens CCl4-inediated liver injury with improved blood levels of ALT, AST, and m-AST. The mechanistic insights of LPA-mediated mitochondrial homeostasis are revealed by uncovering two post-translational modifications in a unique CDK1-SIRT3-CPT2 cascade in which CDK1 activates SIRT3 via Thr8/Serl7 phosphorylation that in turn leads to dimerization and activation of CPT2 via SIRT3-mediated CPT2 K453/K457 deacetylation (schematic presentation in Figure 6H).
Our present study sheds light on a long-held debate over the potential risk by consumption of SFAs (Nettleton et al., 2016). Reduction of dietary SFAs is recommended although no evidence is indicated with SFAs-mediated risk in cardiovascular disease. A possible reason for the overlooked pro-homeostatic benefit of SFAs is likely due to the comprehensive epidemiologic studies on SFA-related health risks and lipotoxic diseases associated with consumption of high-level SFAs (Kim et al., 2015; Kurahashi et al., 2008; Sellem et al., 2018). These studies were conducted with SFAs as a part of a fat-heavy diet with a prolonged period such as the population-based analysis on SFAs-associated breast cancer risk (Sieri et al., 2014; Wakai et al., 2005). Another reason for the potentially advantageous function of SFAs being ignored may be the fact that ROS generated by SFAs cause widespread damage in cells (Yanagisawa et al., 2008). Therefore, it has been unclear whether an ideal physiological SFA consumption level required for maintaining normal mitochondrial and cellular function exists. Here, by lowering PA to a certain level, we reveal an obvious favorable function of PA for liver mitochondrial homeostasis. Compared to the enhanced ROS accumulation generated by HPA, mitochondrial superoxide is reduced with enhanced MnSOD, the major antioxidant enzyme in mitochondria, in LPA-mediated mitochondrial protection. (Broniarek et al., 2016) has found an enhanced MnSOD protein expression in endothelial cells induced by PA at 100 μM and 150 μM (Broniarek et al., 2016) which is consistent with our current finding that 100 μM PA increased MnSOD enzymatic activity by ~20% (Figure 1E). Importantly, the 25 μM seems to be close to physiological level allowing AML12 cells achieving the maximal mitochondrial and cellular protection. The doses near to 25 μM (12.5, 50 and 100 μM) also elevated MnSOD activity with related mitochondrial O2− alternations (Figure 1E). Such LPA-enhanced mitochondrial metabolism with boosted Δψm, OCR, and ATP generation are consistent with the findings that lowering the digestion of SFAs reduces health risk (Bueno et al., 2013). A small number of epidemiological studies of a low-fat diet (calories from fat <10%) show a benefit in weight loss and significantly reduction of blood pressure as well as in improving the ratio of total cholesterol to HDL cholesterol (Shai et al., 2008). SFA-mediated cancer inhibition has also been demonstrated in human breast cancer cells (Evans et al., 2009; Levi et al., 2015). However, our current study revealed little improvement in mitochondrial function in cells treated with the PA in the dose range 0-12.5 μM. These results seem to be consistent with the epidemical data showing that populations with less than 7% fat energy intake are no health benefit and, in most cases, an even worse disease burden (Figures 1A–C; Figure S1, Table S1). Although the exact definition of the physiology level of SFA consumption for human will continue to debate and define, health benefits is evidenced by lowering fat intake (Tobias et al., 2015). Lieber et al. has demonstrated that 10% of total dietary calories intake from FA, rather than either below or above such level, generates the least hepatic triglyceride accumulation in rat liver (Lieber and DeCarli, 1970). A relative low-fat diet (<30% of energy) with 10% energy from SFAs is also recommended by WHO (https://www.who.int/en/news-room/fact-sheets/detail/healthy-diet), whereas dietary intake of <7% of energy from SFAs may be harmful (Dehghan et al., 2017).
The mitochondrial protein deacetylation plays a critical role in cell metabolism (De Marchi et al., 2019; Peek et al., 2013). SIRT3 is a NAD(+)-dependent deacetylase in the mitochondrial matrix to regulate the acetylation levels of metabolic enzymes. Hirschey et al. has reported that long-chain acyl coenzyme A dehydrogenase (LCAD) is the metabolic substrate in SIRT3-regulated FAO metabolism during animal fasting (Hirschey et al., 2010). The current study further reveals that SIRT3-mediated dimerization is required for activation of another key FAO enzyme CPT2 via SIRT3-mediated deacetylation. The enhanced mitochondrial homeostasis was achieved at 48 h in cell culture and 12 days in animal tests, indicating that LPA exerts detectable cellular benefits in a time-dependent manner. Consistently, a similar lag time has been demonstrated in nutrition-derived cellular homeostasis (Morgan et al., 1998). In AMPK-mediated mitochondrial metabolism, non-glucose carbon sources limit mitochondrial biogenesis and OXPHOS capacity (Chaube et al., 2015), suggesting that a lag time is required for translating nutrition intake to detectable cellular benefits (Wang et al., 2011). In present study, both phosphorylation and acetylation are involved in the LPA-mediated CDK1-SIRT3-CPT2 cascade, which may contribute to the lag time for orchestrating the mitochondrial homeostasis. CDK can regulates FA for cell cycle progression (Santos-Rosa et al., 2005), phosphorylates Drp1 to control mitochondrial dynamics (Tahbaz et al., 2011) and to boost mitochondrial bioenergetics (Wang et al., 2014) and protein influx (Harbauer et al., 2014) for cell cycle progression. The mitochondrial CDK1, further defined in the current study, is enhanced by LPA to augment SIRT3 function via Thr8/Ser17 phosphorylation (Wang et al., 2014). Thus, CDK1-mediated SIRT3 phosphorylation may present the first rate-limiting step in LPA-promoted mitochondrial homeostasis. SIRT3-mediated deacetylation and activation of CPT2 may also contribute to the lag time for LPA-mediated mitochondrial activation. In addition, the cluster of mitochondrial proteins including factors for redox balance and FA metabolism detected from our proteomics analysis suggests multiple metabolic mechanisms involved in LPA-mediated mitochondrial function. Further elucidation of such pro-homeostatic factors related to CDK1-SIRT3-CPT2 cascade will be necessary to reveal more mechanistic insight in LPA-mediated mitochondrial homeostasis.
The LPA-mediated protective function against the injuries induced by HPA or CCl4 may have a critical clinical impact. SIRT3 is the central regulator of mitochondrial homeostasis (Newman et al., 2012) that can regulate FAO metabolism (Hallows et al., 2011) and MnSOD activation (Tao et al., 2010), as well as long-chain acyl-CoA dehydrogenase (Bharathi et al., 2013). Increased risk of developing metabolic syndrome is observed in humans with a deficiency of SIRT3 (Hirschey et al., 2011). The reported SIRT3-mediaed MnSOD activation (Tao et al., 2010) is also involved in the LPA-mediated mitochondrial homeostasis probably due to the requirement of detoxifying the enhanced O2− level of FAO and mitochondrial respiration. Thus, SIRT3-mediated MnSOD activation may play a key role in LPA-mediated mitochondrial protective function against lipotoxicity induced by high level PA or the hepatotoxic effect induced by CCL4.
SIRT3 is reported to be involved in FAO metabolism (Hirschey et al., 2010). Additional two recent works are supportive to our current findings indicating the important of fatty acid turnover rate in keeping human weight and health (Arner et al., 2019) and the critical role of SIRT3 in controlling mitochondrial metabolism via protein deacetylation (Wang et al., 2019). Our results further demonstrate that CPT2 is directly controlled by SIRT3 in LPA-mediated mitochondrial homeostasis via deacetylation-controlled dimerization enzyme activity. CPT2 located in the inner mitochondrial membrane functions in lipid mitochondrial transportation and oxidization which is connected to TCA cycle and mitochondrial bioenergetics. CPT2-mediated FA metabolism is demonstrated in an array cellular functions (Gonzalez-Hurtado et al., 2018; Xiong et al., 2018). Defects in the CPT2 gene are associated with deficiency in mitochondrial FAO and impair the functions of complexes I and V (Haorah et al., 2013). SIRT3-mediated deacetylation is found to be necessary for CPT2 dimerization and enzymatic activation. Such post-translational modification of CPT2 in mitochondrial does not require gene transcription and thus CPT2 protein levels are not necessarily enhanced in LPA-treated cells. Thus, the SIRT3-mediated deacetylation and dimerization of CPT2 indicates a quick regulatory mechanism on FAO enhancement. In addition, SIRT3-mediated CPT2 deacetylation and activation is nonetheless related to the CPT1 activity that regulates the rate of FA import into the mitochondria from the cytoplasm. The mechanistic insights regulating the coupling between CPT1 and CPT2 in LPA-mediated mitochondrial FAO is to be further elucidated.
In conclusion, this study uncovered an overlooked beneficial effect of SFAs on mitochondrial homeostasis that alleviates HPA-induced lipotoxic effect and CCL4-induced hepatotoxicity. A unique pathway CDK1-SIRT3-CPT2 is identified in LPA-mediated mitochondrial metabolic enhancement.
STAR ★METHODS
LEAD CONTACT AND MATERIALS AVAILABILITY
Further information and requests for resources and reagents should be directed to and will be fulfilled by the Lead Contact, Jian Jian Li (jijli@ucdavis.edu). All unique/stable reagents generated in this study are available from the Lead Contact with a completed Materials Transfer Agreement.
EXPERIMENTAL MODEL AND SUBJECT DETAILS
Cells
The AML12 mouse hepatocyte cell line was obtained from the American Type Culture Collection (ATCC) and maintained in Dulbecco’s modified Eagle medium (DMEM) supplemented with 1 × ITS, (Insulin-Transferrin-Selenium Supplement), 40 ng/mL dexamethasone, 100 U/mL penicillin, 100 μg/ML streptomycin, 0.25 g/L glutamine, and 10% fetal bovine serum (FBS) at 37 °C with 95% air and 5% CO2. The 293T cell line was cultured with DMEM supplemented with 10% FBS, 100 U/mL penicillin, and 100 μg/mL streptomycin at 37 °C in 5% CO2. Mouse primary hepatocytes were isolated from 100 mg of fresh liver tissue harvested from the same position in each mouse and placed in a tube containing 1 mL of Hank’s balance salt solution (HBSS) serum-free medium. The tissue was crushed gently with a tissue grinding rod 16-25 times. Then, 2 mL of 37 °C prewarmed serum-free DMEM was added to scatter the cells. The mixture was filtered through a 40-mesh cell sieve to purify the cell solution. The primary cell pellet was collected after centrifugation (500 × g for 5 min at 4 °C). The red blood cells (RBCs) were removed by adding 1 mL of 37 °C prewarmed RBC lysis buffer according to the volume of the cell pellet (10:1, v/v). Then, the primary cell pellet was resuspended for 2 min at room temperature (25 °C) and pelleted with centrifugation (500 × g for 5 min at 4 °C), washing twice. Cells were plated on culture medium (DMEM with 10% FBS, 100 U/mL penicillin and 100 μg/mL streptomycin) and incubated in a 37 °C water-saturated incubator with 95% air and 5% CO2 for further analysis within 3 h. The animal use and care protocol of mouse liver cell preparation were approved by the Institutional Animal Use and Care Committee of the University of California Davis (IACUC 15315).
Animals
C57BL/6 mice (8 weeks old) were purchased from Shanghai Laboratory Animal Center of the Chinese Academy of Sciences (SYXK: 2016-0069, Shanghai, China). The in vivo tests of palmate and CCL4 protocol were reviewed and approved by Institutional Animal Care and Use Committee at Shuguan Hospital, Shanghai University of Traditional Chinese Medicine in accordance with the approved guidelines (Approval number: AEEI-2016-131). Four mice were housed per cage and provided with a controlled environment (12 h light/12 h dark cycle, light intensity ~350 lux) as well as ad libitum access to double-distilled water (ddH2O) and a normal diet (XIETONG ORGANISM, Jiang Su, China). All animal experiments were performed in compliance with the NIH Guide for the Care and Use of Laboratory Animals and the Animal Welfare Act.
Preparation and administration of palmitate
For the in vitro studies, sodium palmitate was first dissolved in 50% ethanol at 60 °C for 30 min to yield a stock concentration of 100 mM. The stock solution was then diluted 10 times with ddH2O containing 2% bovine serum albumin (BSA), and the PA-BSA solution was incubated in a 37 °C warm water bath for 1 h and then sterilized through a 0.22 μm filter and kept at −20 °C. For the in vivo studies, we initially determined the tolerable/beneficial dose of PA in C57BL/6 mice (8 weeks old; body weight ~ 20 g). Referring the established PA level in the high fat diet (HFD) (Kim et al., 2007), the percentage calorie in HFD diet used in tests with rats and mice (Table S3), and the standard volume of intragastric gavage in mice (0.4 mL/20 g mouse body weight), we estimated that the in vivo mouse HPA to be 100 mg/mL. Then based on the ratio of PA generated by in vitro mouse liver cells, we set a range of PA concentration for in vivo tests (100 mg/mL, 5 mg/mL, and 0.5 mg/mL) and our results demonstrated that only the 0.5 mg/mL pretreatment showed hepatoprotective effects, thus this setting was chosen to be the in vivo LPA for in vivo mouse tests. The mice in the LPA/CCl4 group were gavaged with a solution containing 0.5 mg/mL PA and 0.5% BSA. The mice in the control groups were gavaged with 0.5% BSA in the same volume. The potential protective effects of PA were determined by evaluating the liver mitochondrial functions and blood levels of liver metabolic enzymes.
CCl4-induced cytotoxicity and hepatotoxicity
In the in vitro studies, after being administered media with LPA-BSA or BSA alone, the cells in the CCl4 and LPA/CCl4 groups were incubated with medium containing 10 mM CCl4 for 1 h, followed by measurements of cell viability and mitochondrial function. Cells in the control group were administered fresh medium at the same volume and for the same period. For detecting LPA-mediated mitochondrial protection in CCl4-induced mice liver toxicity. Thirty-six C57BL/6 mice (8 weeks old weighing about 20 g) were first divided into LPA and control groups. In the LPA group, PA was delivered at 0.1 mL/kg/day via intragastric gavage with a solution containing 0.5 mg/mL PA, 0.05% BSA for 3, 6, and 12 days. Mice in the control group were gavaged with the same solution without PA for the same period. Immediately after the last gavage on days 3, 6, and 12, the animals in the LPA and control groups were further divided into groups of CCl4 and control with sham-CCl4. In the CCl4 group, CCl4 was delivered via i.p. injection of 2.5 mL/kg (2.5 g/kg) 100% CCl4. Mice in the sham-CCl4 control group were injected i.p. with the same amount of 0.9% NS (normal saline) solution. (Knockaert et al., 2012). The experiments were terminated 3 h after CCl4 treatment.
METHOD DETAILS
Mitochondrial protein preparation
Cells were suspended in ice-cold IBc buffer (10 mM Tris-MOPS, 1 mM EGTA/Tris and 20 mM sucrose, pH 7.4) and homogenized with a glass/Teflon homogenizer (Teflon pestle in a glass mortar) for 15 min on ice. Then, the homogenate solution was then transferred into a 15 mL tube and centrifuged at 600 × g for 10 min at 4 °C. The supernatant was collected and centrifuged at 10,000 × g for 10 min at 4 °C to collect the mitochondrial precipitate. The mitochondria were further purified by suspending the pellet in ice-cold IBc buffer and centrifuging at 7000 × g for 10 min at 4 °C. The supernatant was discarded, and the mitochondrial pellet was stored at −80 °C for future use.
LPA-mediated mitochondrial proteomics
The mitochondrial protein mixtures from control and LPA-treated AML12 cells were treated with dithiothreitol and iodoacetamide for cysteine reduction and alkylation, followed by digestion with modified sequencing-grade trypsin (Roche Applied Science) at an enzyme/substrate ratio of 1:100 in 50 mM NH4HCO3 buffer (pH 8.5) at 37 °C overnight. The peptide mixture was subsequently dried in a Speed-Vac, desalted using OMIX C18 pipet tips (Agilent Technologies), reconstituted in water and subjected to LC-MS and MS/MS analyses on a Q Exactive Plus mass spectrometer equipped with a nanoelectrospray ionization source. Samples were automatically loaded from a 48-well microplate autosampler using an EASY-nLC 1200 system (Thermo Fisher Scientific) at 3 μL/min onto a biphasic precolumn (150 μm i.d.) comprising a 3.5 cm column packed with 5 μm of C18 120 Å reversed-phase material (ReproSil-Pur 120 C18-AQ). The biphasic trapping column was connected to a 20 cm fused-silica analytical column (PicoTip Emitter, New Objective, 75 μm i.d.) with 3 μm of C18 beads. The peptides were then separated using a 180-min linear gradient of 2-45% acetonitrile in 0.1% formic acid at a flow rate of 250 nL/min. The mass spectrometer was operated in a data-dependent scan mode. Full-scan mass spectra were acquired in the range of m/z 350-1500 using an Orbitrap analyzer with a resolution of 70,000. Up to 25 of the most abundant ions found in the mass spectrometry (MS) analysis with a charge state of 2 or above were sequentially isolated and collisionally activated in an HCD cell with a collision energy of 27 to yield MS/MS. MaxQuant, version 1.5.2.8, was used to analyze the LC-MS and MS/MS data for the identification and quantification of proteins in LFQ mode (Cox and Mann, 2008). The maximum number of missed cleavages for trypsin was two per peptide. Cysteine carbamidomethylation was set as a fixed modification. Methionine oxidation and phosphorylation of serine, threonine, and tyrosine were set as variable modifications. The tolerances in mass accuracy for MS and MS/MS were both 20 ppm. Maximum false discovery rates were set to 0.01 at both peptide and protein concentrations, and the minimum required peptide length was six amino acids.
Data analysis on mitochondrial proteomics
Of the 2,719 signatures, proteins with altered expression levels were submitted to DAVID Bioinformatics Resources v6.7 (https://david.ncifcrf.gov/). Functional annotation analysis was performed using the Gene Ontology tool for biological function (GOTERM_BP_FAT). Parameters were established for our functions of interest with a cutoff of p < 0.05. Within each functional category, the protein lists from the DAVID classification were organized, and overlapping proteins were removed.
ATP generation
The cellular ATP concentrations were determined by using a luciferase-based ATP assay. Cells grown in 96-well plates were rinsed twice with cold phosphate-buffered saline (PBS) and incubated with shaking in cold 0.5% (w/v) trichloroacetic acid (TCA) on ice for 20 min to extract the ATP from the adherent cell. To neutralize the TCA extract, add 10 μL of the extracts into a tube with 140 μL of 250 mM Tris-acetate buffer (pH 7.75) and vortexed well. The cellular ATP concentrations were determined by mixing 10 μL of the neutralized extracts with 40 μL of fresh luciferin-luciferase reagent (Invitrogen) under a Turner Biosystems 20/20 Luminometer (Promega) and normalized to the protein concentration using the BCA method.
OCR
Mitochondrial OCR was measured with a Clark-type oxygen electrode (Digital Model 20; Rank Brothers) in a 1.5 mL chamber at 30 °C. Exponentially growing cells (1.5 × 10⁶ cells per well) were suspended in 300 μL of respiration buffer (20 mM HEPES, pH 7.1, 250 mM D-sucrose, 10 mM MgCl2, and 2 mM phosphate buffer consisting of NaH2PO4 and Na2HPO4, pH 7.4). Oxygen consumption was monitored at 30 °C with succinate (a complex II substrate). Permeabilization was carried out by adding digitonin (0.001% per 106 cells) to the chamber under constant stirring. ADP (0.5 mM) was added to measure state 3 (phosphorylating) respiration. Oxygen utilization traces and rate determinations were obtained by using Pico software (PicoLog Recorder and Technology, Interworld Electronics).
MnSOD enzyme activity
Total SOD activity was determined using the method contributed by D. R. Spitz and L. W. Oberley (Spitz and Oberley, 2001). Briefly, cells were rinsed with PBS, scraped and harvested, followed by centrifuging for 5 min at 400 xg. The cell pellet was then suspended in 1.34 mM DETAP AC buffer and sonicated with five 10-s bursts from Sonic Dismembrator at 70% output. The homogenization with a protein concentration of 5mg/ml were used for the activity assay. Ten microliters of the homogenization (20-50 μg protein) was transferred in well of 96-well plate and add 80 μL of assay solution (1.34 mM, DETAP AC buffer supplemented with 0.13 mg/mL BSA, 1.25 U/mL catalase, 50 μM xanthine, 74.6 μM NBT, and 50 μM BCS) to the wells of blanks, standards, and samples. To inhibit the CuZnSOD activity, 5 mM of NaCN (CuZnSOD activity inhibitor) was added and incubated in room temperature for 45 min. To initiate the reaction, Xanthine oxidase (XO) was added and immediately read within 1-3 minutes. The absorbance was monitored at 560 nm every 15 s for 2.5 min using the Spectra Max M2e plate reader (Molecular Devices Co.). MnSOD activity was determined by percent inhibition of CuZn inhibition.
Mitochondrial membrane potential, Λψm
Δψm was measured by mitochondria-specific fluorescent JC-1 staining (Invitrogen). Briefly, cells were cultured in 96-well plates with 80% confluence and treated for an indicated period time. Following two washes with PBS, the cells were incubated with JC-1 containing (2 μg/mL) medium for 30 min. The fluorescence intensity of JC-1 red and JC-1 green was detected using a Spectra Max M2e plate reader at excitation/emission wavelengths of 485 nm/595 nm and 485 nm/525 nm, respectively. The ratio of the fluorescence intensity of JC-1 red to JC-1 green was used as an indicator of Δψm. The results were normalized to the protein concentration from the BCA assay using the cell debris of each sample.
Mitochondrial O2− production
Cells were incubated with MitoSOX Red (Molecular Probes)-containing medium at a final concentration of 5 μM (37 °C, 5% CO2) for 10 min. Following two times washes of the cells with PBS, the fluorescence intensity was measured with a Spectra Max M2e plate reader at an excitation wavelength of 510 nm and an emission wavelength of 580 nm. Mitochondrial O2− production was determined by the increase in fluorescence intensity. Data were expressed as the fold difference in fluorescence generated compared to control cells. The results were normalized to the protein concentration from the BCA assay using the cell debris of each sample.
MTT assay
PA-mediated cell viability was tested at different PA concentrations. The cells grown overnight in 96-well plates at a density of 50% were treated with the indicated concentrations of sodium PA treatment for 24, 48, or 72 h. Cell viability was measured by using 5 mg/mL MTT reagent (Sigma) dissolved in PBS (Sigma-Aldrich). Briefly, the cell culture medium was changed to fresh medium with diluted MTT (1:10, v/v) and incubated for 3 h. After removing the incubation medium, formazan crystals were dissolved in 50 μL of /DMSO. MTT reduction was quantified by measuring the light absorbance at 570 nm using a Spectra Max M2e plate reader.
Oil red O staining and quantitation
Cell lipid accumulation assays were conducted in AML12 hepatocytes cultured in 96-well plates (0.8 × 10⁴ cells per well, triplicate for each group), exposed to 25 μM PA or BSA for 24 or 48 h, and then incubated with DMEM containing BSA with or without 250 μM FFAs (OA: PA = 2:1) for an additional 24 h. The accumulation of lipid droplets was visualized by Oil red O staining and quantified by DMSO extraction. Briefly, cells in 96-well plates were rinsed with cold PBS and fixed in 4% paraformaldehyde at room temperature for 30 min. After the cells were rinsed with distilled water, oil red O was added, and the incubated for 15 min followed by rinsing with 60% isopropanol for 20 s. The plates were then rinsed with distilled water before taking images under the microscope (at least 3 images for each sample). For quantification, Oil Red O dye was washed with water once and then added 50 μl DMSO to each well and incubated for 10 min with gently shaking followed by measurement of OD at 510 nm.
Detection of PA in mouse liver tissue by UPLC-TQMS
To determine the dynamics of LPA, the PA concentration in mouse liver tissues were measured with ultra-performance liquid chromatography/triple quadruple MS (UPLC-TQMS; ACQUITY UPLC H-Class/Xevo G2 TQ-XS MS/MS) following a standard protocol (Kwan et al., 2013). All liver samples were stored at −80 °C until UPLC-TQMS was performed. First, 10 mg of liver tissue was homogenized with 50 μL of water and extracted with 200 μL of methanol. The extraction was performed at −20 °C for 10 min after 2 min of vertexing. The extraction mixture was centrifuged at 12,000 rpm for 20 min at 4 °C. Then, the supernatant was transferred to a sampling vial for further analysis, and a 1 μL aliquot of the sample was injected into an ACQUITY BEH C18 column at 40 °C. The elution solvents were water (A) and acetonitrile (B) at a flow rate of 0.4 mL/min. The elution gradient was as follows: 0 min (5% B), 0-2 min (50% B), 2-4 min (100% B), and 4-8.5 min (100% B). The mass spectrometer was operated in negative ion mode with the following optimal conditions: 2.5 kV capillary voltage, 19.0 Vextraction cone, and 20 v collision energy. The desolvation and cone gas flow rates were 1000 and 150 L·h−1, respectively. The source temperature was 130 °C, and the desolvation temperature was 500 °C. Quantitation was performed using multiple reaction monitoring of the product ion transitions, m/z 255/255 for PA. The chromatograms of PA standards and the PA in the tissue were shown in the supplementary information, and the standard curve equation (Y = 4.31 × 10⁴X + 4.55 × 10⁵(r2 = 0.993949)) was established using the PA concentration as the abscissa and the peak area as the ordinate. Then, the PA concentration in each sample was calculated according to the above the equation with the MRM chromatogram peak area obtained by the external standard method.
Coimmunoprecipitation and western blotting
Protein extracts (300 μg) in 300 μL of RIP A buffer were precleared with 30 μL of protein A/G-agarose beads and normal IgG at 4 °C for 1 h. After centrifugation at 1000 rpm for 30 s, the supernatants were incubated with primary antibodies overnight at 4 °C. Subsequently, 40 μL of protein A/G-agarose beads were added, with gentle rocking for 1 h at 4 °C. After 3 washes of the protein-captured beads with PBS, protein sample buffer was added and boiled at 95 °C for 10 min to denature the proteins and separate them from the beads. The proteins were separated in SDS-PAGE and transferred onto PVDF membranes. After blocking with 5% milk for 2 h, the membranes were probed with primary antibodies at 4 °C overnight, followed by secondary antibody conjugation. Then, the membranes were visualized using the ECL Western Blotting detection system (GE Healthcare).
Mitochondrial–GFP confocal microscopy
Cells carrying the mitochondria-targeting plasmid pEGFP–MTS were seeded on 35 mm glass-bottom dishes (AGC Techno Glass, Shizuoka, Japan) and cultured overnight. After 24 h of pretreatment with LPA or BSA, CCl4 or BSA was added, and the mixture was incubated for 3 h. Cells were washed twice with serum-free medium. High-resolution fluorescence images were acquired with a Personal DV microscope (Applied Precision Inc., a GE Healthcare Company, Issaquah, WA). The deconvoluted images were produced using a proprietary software package (SoffWoRx v5.0, Applied Precision Inc., Issaquah, WA) to enhance the resolution. To quantify mitochondrial morphology, a cell was judged to have fragmented mitochondria if >75% of the mitochondria visible in the cell were punctate or circular and fused mitochondria if <25% of the mitochondria were punctate or circular. The fraction of fused mitochondria was subdivided into highly connected or tubular morphology, depending on the length of the mitochondrial filaments (“highly connected” mitochondria appear more elongated than “tubular” mitochondria). If cells presented mitochondria with mixed morphologies, we classified the cells as intermediate. In each experiment, >50 cells/condition were randomly chosen and classified as described, and the percentage of each category was calculated. Experiments were repeated three times.
Transmission electron microscopy
Cells were collected by centrifugation at 500 × g for 5 min, prewashed with cold PBS once and transferred to a new 1.5 mL tube along with 2.5% pre-chilled neutral glutaraldehyde (taking care not to break up cell pellets). The cell pellets were incubated on ice for 15 min. For in vivo studies, fresh liver tissues were cut into pieces of approximately 1 mm3. The samples were fixed in fresh (or thawed) 4% paraformaldehyde for 1 h at room temperature. After dehydration through a series of ethanol concentrations from 70% to 100%, samples were infiltrated with a solution of 100% ethanol and resin (100% ethanokresin = 1:1) for 2 h. Once polymerized, samples were sectioned into slices 50-70 nm thick that were collected on metal mesh ‘grids’ and stained with electron-dense stains before observation. The images were acquired using transmission microscopy (Philips CM120, Biotwin lens, model 794/20, digital camera of 2K×2K). There were 4 samples for each group (5 tissue specimens for each sample).
Measurements of ALT, AST, and m-AST
Serum levels of ALT and AST were measured by using Alanine Aminotransferase Assay Kits (Nanjing Jincheng Institute of Biotechnology, Jiangsu, China). ALT was measured with 5 μl of serum with the substrate including alanine and α-ketoglutaric acid and incubated for 30 min at 37 °C to generate pyruvate and glutamate. Then, 2,4-dinitrophenylhydrazine was added to the solution to react with pyruvate to form 2,4-dinitrophenylhydrazone. To measure the AST concentration, a substrate including aspartate amino and keto groups and α-ketoglutaric acid was applied to the sample of serum followed by incubation for 30 min at 37 °C to generate glutamic acid and oxaloacetate which can decarboxylate into pyruvate. The reaction was stopped by adding 0.4 mol/L NaOH. The 2,4-dinitrophenylhydrazone turns red-brown under alkaline conditions and pyruvate production was confirmed by measuring the light absorbance at 505 nm. The enzyme vitality (UI/L) was calculated according to a standard curve. The m-AST isoenzyme in the serum was measured by using the Aspartate Aminotransferase Mitochondrial Isoenzyme (ASTm) Assay Kit (Beijia Biochem. Reagent Co. Shanghai, China). These enzymes catalyze reversible transamination, and the products were measured by absorbance at 575 nm. All the ALT, AST and ASTm enzyme concentrations were expressed in international units.
Hematoxylin and eosin (H&E) staining
The liver tissues obtained from different animal groups were fixed with 4% formaldehyde, embedded in paraffin, cut into 4 μm sections and stained with H&E following the standard procedure. Tissues were sliced (0.5 h before sectioning, the wax block was placed in a −20 °C freezer), and sections were baked at 70 °C for 4 h, dewaxed, hydrated in distilled water, stained with hematoxylin (1 min), differentiated in hydrochloric acid alcohol, blued in ammonia water, counterstained with eosin (7 s), dehydrated with ethanol at different concentrations (75%, 90%, and anhydrous ethanol), transparentized with xylene I and xylene II, and finally mounted in neutral gum.
CPT2 activity
CPT2 activity was measured by [14C]-carnitine. A total of 200 μg of proteins were prepared in 200 μL of homogenization buffer (150 mM KCl, 5 mM Tris, pH 7.2) and were sonicated for 3 s on ice. Each sample and blank were administered 20 μL of 20% n-octyl-β-D-glucopyranoside and incubated on ice for 30 min with vertexing every 5 min before reaction. For the reaction, 100 μL of homogenate was transferred into a mixture containing 100 μL of substrate mixture (0.2 mM L-carnitine, 0.013 μCi [14C]-carnitine, 0.05 mM palmitoyl-CoA), 700 μL of assay cocktail (1.3% BSA, 2 mM KCN, 4.73 mM ATP, 4.2 mM MgCl2, 244 μM glutathione, 100 mM rotenone, and 0.15 M Tris buffer, pH 7.4), and 100 μM malonyl coenzyme (CPT1 fraction bio-inhibitor). The blank was prepared with 200 μL of 0.15 M KCl, 700 μL of assay cocktail, and 1 mL of 1.2 M HC1. All the reaction mixtures of samples and blanks were incubated at 30 °C for 30 min and vortexed for 15 s. The reaction was terminated by adding 1 M HC1; 1 mL of 1-butanol was then added, and the sample was centrifuged (1000 × g, 5 min at room temperature) to extract the palmitoyl carnitine formed (the top layer). Then, 500 μL of the top layer solution was transferred into a new tube along with 100 μL of H2O, vortexed, and centrifuged (1000 × g, 5 min, room temperature). For counting, 200 μL of the top layer solution was transferred into scintillation vials with 4 mL of scintillation cocktail and counted in a Multi-Purpose Scintillation Counter (Beckman). Each sample was counted for 5 min, and the results were normalized to the corresponding protein concentrations. For the following calculations, 10 μL of the substrate mix (20 nmol) was counted: specific activity (SA) = (CPM - background)/20 nmol = CPM/nmol; CPT2 activity = sample CPM-blank CPM) * 10/SA * time (min) * 0.1 mL of homogenate * protein (mg/mL).
CRISPR/Cas9-mediated gene editing
Single guide RNAs (sgRNAs; Table S4) were designed as reported by the Zhang lab’s CRISPR design software (http:crispr.mit.edu) according to the established protocol that has been described in previous publications (Wang et al., 2016). Oligos corresponding to the sgRNAs were synthesized and cloned into lenti-CRISPRv2 vectors, following the lenti-CRISPRv2 and lenti-Guide oligo cloning protocol (Addgene, plasmid #52961). Lentiviral particles were packaged using 293T cells following the protocol from Addgene. Cells were plated at 2 × 10⁵ cells per well in 6-well plates. Sixteen h later, 1 mL of virus-containing supernatant with 10 ng of polybrene was added to the cells. After 12 h, the medium was exchanged with regular medium and cultured for another 48 h. Genomic DNA was isolated from cells using the PureLink Genomic DNA kit (Life Technology). PCR was performed using the indicated primers flanking the sgRNA target sites and verified by sequencing (Wang et al., 2016).
Native PAGE and western blotting
Cells were suspended in cell lysis buffer (20 mM Tris, 150 mM NaCl, 1 mM EDTA, 1 mM EGTA, 1% Triton X-100, 2.5 mM sodium pyrophosphate, 1 mM a-glycerophosphate, 1 mg/mL leupeptin and 1 mM PMSF, pH 7.5) and sonicated for 30 s. Total protein extracts were obtained after centrifugation at 12,000 × g for 10 min at 4 °C. Then, 100 μg total protein extracts were loaded onto a 5% non-denaturing polyacrylamide gel and run at 100 volts for 3 h in SDS-free buffer (25 mM Tris and 192 mM glycine). Proteins were transferred onto PVDF membranes (Millipore) and then immunoblotted via conventional western blotting.
FAO-driven oxygen consumption
FAO-driven oxygen consumption was analyzed using Acid Oxidation Assay kits (Abeam, Cat# ab217602 and Cat# abl97243, MA, EISA). Exponentially growing AML12 cells (6×10⁴ cells per well) were seeded in 96-well plates and incubated overnight in 5% CO2 at 37 °C. Cells were then rinsed twice with 37 °C prewarmed FA-free medium (base measurement medium), then 90 μL FA measurement medium and 10 μL extracellular O2 consumption reagent were added to each well, and FA measurement medium without cells was used as signal control. Additional 1 μL FAO activator FCCP (0.625 μM) was subsequently supplemented into wells of FCCP control. Each well was sealed with 100 μL 37 °C prewarmed High Sensitivity Mineral Oil (component from ab 197243), taking care to avoid bubbles. Plates were read immediately at excitation/emission wavelengths of 380 nm/650nm at 1.5 min intervals for 180 min in a fluorescence microplate reader (Molecular Devices, Sunnyvale, CA, USA).
Plasmid construction
MTS-CyclinB1, MTS-CDK1-wt, and MTS-CDK1-dnD146N were constructed in lentiviral vector PLX304V5 from RsrII/Nhe restriction enzyme sites. Briefly, inserts were generated from original plasmids pEGFP-N1-MTS-CyclinB1, pERFP-N1-MTS-Cdk1 and pERFP-N1-MTS-Cdk1-dnD146 by PCR (Wang et al., 2014). Mouse SIRT3 cDNA was generated by RT-PCR and cloned into lentiviral vector PLX304V5 from RsrII/Nhe restriction enzyme sites. The SIRT3 mutations of Thr8 to alanine, Ser17 to alanine and double mutations Thr8/Ser17 to alanine were created from the PLX304V5-SIRT3-wt expression vector using the QuikChange Site-Directed Mutagenesis Kit (Stratagene). The mouse CPT2 cDNA was generated by RT-PCR and cloned into lentiviral vector PLX304V5 from RsrII/Nhe restriction enzyme sites. All CPT2 mutations of K453Q, K457Q, K453Q/K457Q, K453R, K457R and K453R/K457R were created from the PLX304V5-CPT2-wt expression vector as a template. CPT2 K453Q was generated using Pfu Turbo DNA polymerase from a mutagenesis kit (Stratagene), and the other mutants were made using a site-directed mutagenesis kit from NEB. All primer oligoes were presented in Table S4.
QUANTIFICATION AND STATISTICAL ANALYSIS
Statistical analysis was performed using the Microsoft Excel and GraphPad Prism 7 software. The results were presented as the mean ± S.E.M. A two-tailed unpaired t-test or adjusted-t test was used to assess statistical differences according to the criteria for normality or variance homogeneity. P values less than 0.05 were considered to be significant and indicated by asterisks as follows: *P < 0.05, **P < 0.01, ***P < 0.001, ****P < 0.0001, #P < 0.05, ##P < 0.01, ###P < 0.001.
DATA AND CODE AVAILABILITY
The proteomics database generated with LPA-treated AML12 cells are available upon request.
Supplementary Material
Figure S1. SFAs intake-related global diseases mortality. Related to Figure 1A, B, C.
Figure S2. Mitochondrial functions in mouse liver AML12 cells or primary liver cells treated with gradient PA. Related to Figure 1D, E, F.
Figure S3. LPA enhances mitochondrial protein influx. Related to Figure 1F.
Figure S4. LPA prevents HPA and CC14-induced mitochondrial injury. Related to Figure 2.
Figure S5. Pretreatment with LPA for 3 or 6 days does not prevent CC14-induced mouse hepatotoxicity and mitochondrial dysfunction. Related to Figure 3.
Figure S6. Multiple sequence alignments of SIRT3 and CPT2 and mutant construction of CDK1, SIRT3 and CPT2. Related to Figure 4, 5 and 6.
Table S2. Palmitate-induced cellular effects on multiple cell types (in vitro palmitate ≥100 μM). Related to Figure 1D, E, F.
Table S3. High fat diet-induced lipotoxic effects tested by in vivo models. Related to Figure 1D, E, F, and Figure 2
Table S4. sgRNA sequences and primers used in this study, related to Figures 4 and 5 and 6.
Table S1. SFAs intake-related global disease burden and mortality. Related to Figure 1A–C and Figure S1.
KEY RESOURCES TABLE
| REAGENT or RESOURCE | SOURCE | IDENTIFIER |
|---|---|---|
| Antibodies | ||
| Rabbit polyclonal anti-COX IV | Cell Signaling | Cat# 4844; RRID: AB_2085427 |
| Rabbit monoclonal anti-Cdc2 | Cell Signaling | Cat# 77055; RRID: AB_2716331 |
| Rabbit polyclonal anti-Phospho-Cdc2 (Thr161) | Cell Signaling | Cat# 9114; RRID: AB_2260040 |
| Rabbit polyclonal anti-Acetylated-Lysine | Cell Signaling | Cat# 9441; RRID: AB_331805 |
| Rabbit monoclonal anti-SirT3 | Cell Signaling | Cat# 5490; RRID: AB_10828246 |
| Mouse monoclonal anti-Phospho-Threonine | Cell Signaling | Cat# 9386; RRID: AB_331239 |
| Mouse monoclonal anti-α-Tubulin | Sigma-Aldrich | Cat# T6074 |
| Mouse monoclonal anti-β-Actin | Sigma-Aldrich | Cat# A5441 |
| Mouse monoclonal anti-Phospho-Serine | Sigma-Aldrich | Cat# A8076 |
| Rabbit polyclonal anti-Phospho-CDK1 (Thr161) | Abcam | Cat# ab47329; RRID: AB_2260040 |
| Mouse monoclonal anti-CPT2 | Abcam | Cat# ab110293; RRID: AB_10860357 |
| Rabbit polyclonal anti-Cyclin B1 | Santa Cruz | Cat# sc-752 |
| Mouse monoclonal anti-Cytochrome C | Santa Cruz | Cat# sc-13560 |
| Mouse monoclonal anti-CPT2 | Santa Cruz | Cat# sc-377294 |
| Mouse monoclonal anti-V5 | Proteintech Group Inc. | Cat# 66007-1 |
| Bacterial and Virus Strains | ||
| Lenti-CRISPRv2 | Addgene | Cat# 52961 |
| PLX304V5 | Addgene | Cat# 25890 |
| psPAX2 | Addgene | Cat# #12260 |
| pMD2.G | Addgene | Cat# 12259 |
| Chemicals, Peptides, and Recombinant Proteins | ||
| Fetal Bovine Serum (FBS) | Corning CellGro | Cat# 35010CV |
| Penicillin Streptomycin | Corning CellGro | Cat# 30-002-CI |
| Bovine Serum Albumin (BSA) | Sigma-Aldrich | Cat# 9048-46-8 |
| Insulin-Transferrin-Selenium Supplement (ITS, 100X) | Life Technologies | Cat# 41400-045 |
| Sodium Palmitate (PA) | Sigma-Aldrich | Cat# A9767 |
| Oleic acid (OA) | Sigma-Aldrich | Cat# O1008 |
| Carbon tetrachloride (CCl4) | Sigma-Aldrich | Cat# 270652 |
| Ethanol | Acros Organics | Cat# 615100010 |
| Diethyl Ether | Sigma-Aldrich | Cat# 60-29-7 |
| 3-Morpholine Propyl Sulfonic Acid (MOPS) | EMD | Cat# 6310 |
| Ethylene glycol-bis(2-aminoethylether)-N, N, N’, N’-tetraacetic acid (EGTA) | Sigma-Aldrich | Cat# 324628 |
| Sucrose | IBI Scientific | Cat# IB37160 |
| RBC Lysis Solution | Applichem | Cat# A46170100 |
| Hanks’ Balanced Salt Solution (HBSS) | Corning CellGro | Cat# 23-21-020-CV |
| Trichloroacetic acid (TCA) | VWR | Cat# AAA14695-14 |
| TRIS (base) | Sigma-Aldrich | Cat# T4258 |
| Triton X-100 | Sigma-Aldrich | Cat# X100-500ML |
| D-Luciferin Potassium Salt | Synchem | Cat# BC219 |
| Luciferase | Sigma-Aldrich | Cat# L9506 |
| Sodium Acetate, Trihydrate | Alfa Aesar | Cat# AAAL03425-14 |
| Ethylenediaminetetraacetic acid (EDTA) | Corning CellGro | Cat# 46034CI |
| 4-(2-hydroxyethyl)-1-piperazineethanesulfonic acid (HEPES) | Alfa Aesar | Cat# A1477718 |
| Magnesium Chloride Hexahydrate (MgCl2) | EMD | Cat# 5980 |
| Digitonin | Fisher | Cat# D3200 |
| Potassium Chloride (KCN) | Mallinckrodt | Cat# 6858-04 |
| Sodium Succinate | Alfa Aesar | Cat# AA33386-30 |
| Adenosine 5-diphosphate (ADP) | Acros Organic | Cat# 16178-48-6 |
| Dimethyl Sulfoxide (DMSO) | Sigma-Aldrich | Cat# D2650 |
| MitoSOX Red Mitochondrial Superoxide | Invitrogen | Cat# M36008 |
| Sodium Chloride (NaCl) | Mallinckrodt | Cat# 7581-06 |
| Sodium Pyrophosphate | Lonza Walkerscille Inc. | Cat# 12001-636 |
| Leupeptin | VWR | Cat# A260-009-M005 |
| Phenylmethylsulfonyl Fluoride (PMSF) | Sigma-Aldrich | Cat# P7626 |
| Sodium Cyanide (NaCN) | Sigma-Aldrich | Cat# 1345 |
| Catalase | Sigma-Aldrich | Cat# 380973 |
| Bathocuproinedisulfonic Acid (BCS) | Acros Organic | Cat# AC16406-0010 |
| Thiazolyl Blue Tetrazolium Bromide (MTT) | Sigma-Aldrich | Cat# M-2128 |
| Oil Red O | Sigma-Aldrich | Cat# O-0625 |
| Formaldehyde | Pharmacy | Cat# 08-385510 |
| Isopropanol | Sigma-Aldrich | Cat# Y0001728 |
| Glycerol | Sigma-Aldrich | Cat# G5516 |
| Hydrochloric acid (HCl) | BIO RAD | Cat# 161-0801 |
| Methanol | Fisher | Cat# A452-4 |
| Tween 20 | VWR | Cat# 9005-64-5 |
| Halt Phosphatase Inhibitor Cocktail | Fisher | Cat# 78420 |
| Dry Milk | Research Products International Corp. | M17200-1000.0 |
| Sodium Pyrophosphate (Na4P2O7) | Alfa Aesar | Cat# 7722-88-5 |
| Sodium Orthovanadate (Na3VO4) | Mallinckrodt Inc. | Cat# 7917-04 |
| Sodium Dodecyl Sulfate (C12H25SO4Na) | BIO RAD | Cat# 161-0302 |
| 30% Acrylamide | BIO RAD | Cat# 161-0156 |
| Ammonium Persulfate (APS) | BIO RAD | Cat# 161-0700 |
| Tetramethylethylenediamine (TEMED) | Mallinckrodt Inc. | Cat# 4931-02 |
| Protease Inhibitor Cocktail | Sigma-Aldrich | Cat# P8340 |
| Hematoxylin | Ricca Chemical Co. | Cat# 3530-32 |
| Eosin | Acros Organics | Cat# 152881000 |
| Xylene | Invitrogen | Cat# 460509 |
| Prolong Gold Anti-Fade Reagent | Molecular Probes | Cat# P36934 |
| Glutaraldehyde 25% | Alfa Aesar | Cat# AAAL14351-AE |
| Protein G magnetic beads | GenScript | Cat# L00274 |
| Protein G Resin | GenScript | Cat# L00209 |
| Protein A Agarose, Fast flow | Millipore | Cat# 16-156 |
| L-carnitine | MP Biomedicals | Cat# 195031 |
| Carnitine Hydrochloride, L-[N-Metyyl-14C] | PerkinElmer | Cat# MEC797010UC |
| Palmitoyl CoA | Sigma-Aldrich | Cat# P9716 |
| Adenosine 5’-triphodphate (ATP) | TCI Co., Ltd | Cat# 101107-918 |
| Acetone | Sigma-Aldrich | Cat# 650501 |
| 10% n-Octyl-β-D-glucopyranoside | Calbiochem | Cat# 48712 |
| 1-Butanol | Sigma-Aldrich | Cat# B7906 |
| Rotenone | MP Biomedicals | Cat# IC15015401 |
| Palmitic acid | Sigma-Aldrich | Cat# P5585 |
| Acetonitrile | MERCK | Cat# 100030 |
| Critical Commercial Assays | ||
| KitHipure Plasmid Filter Midiprep Kit | Invitrogen | Cat# K2100-14 |
| Lipofectamine 3000 | Invitrogen | Cat# L3000008 |
| Peroxidase Substrate Kit | Vector Laboratories | Cat# SK-4100 |
| Avidin/Biotin Blocking Kit | Vector Laboratories | Cat# SP-2001 |
| ATP Determination Kit | Molecular Probes | Cat# A22066 |
| Superoxide Dismutase Assay Kit | Cayman Chemical | Cat# 706002 |
| Site–Directed Mutagenesis Kit | New England Bio Labs Inc. | Cat# E0554 |
| Quikchange site-directed mutagenesis kit | Stratagene | Cat# 200519-5 |
| Alanine aminotransferase (ALT) Assay Kit | Nanjing Jiancheng Bioengineering Institute | Cat# C009-2 |
| Aspartate aminotransferase (AST) Assay Kit | Nanjing Jiancheng Bioengineering Institute | Cat# C010-1 |
| Aspartate aminotransferase Mitochondrial isoenzyme (ASTm) Assay Kit | Shanghai Beijia Biochemical Reagent Co., Ltd | Cat# 3400572 |
| Experimental Models: Cell Lines | ||
| AML12 | Dr. Tianguang Li’s Lab, University of Kansas Medical Center, Kansas, USA | ATCC® CRL-2254™ |
| 293T | Dr. Hongwu Chen, University of California at Davis, California, USA | ATCC® CRL-3216™ |
| Experimental Models: Mouse | ||
| C57BL/6 (male) | Shanghai SLAC Laboratory Animal Co., Ltd | SYXK: 2016-0069 |
| Oligonucleotides | ||
| Cytochrome c oxidase subunit 8A, mitochondrial (MTS) (ref. NM_004074.2) | IDT | ATGTCCGTCCTGACGCCGCTGCTGCTGCGGGGCTTGACAGGCTCGGCCCGGCGGCTCCCAGTGCCGCGCGCCAAGATCCATTCGTTG |
| See Table S4 for constructing recombinant DNA | This paper | N/A |
| Recombinant DNA | ||
| Plasmid: pLX304 v5-MCS (N-term v5)/MTS-mutCDK1 | (Wang et al., 2014) | N/A |
| Plasmid: pLX304 v5-MCS (N-term v5)/MTS-CDK1 | (Wang et al., 2014) | N/A |
| Plasmid: pLX304 v5-MCS (N-term v5)/mSirt3wt | This paper | N/A |
| Plasmid: pLX304 v5-MCS (N-term v5)/mSirt3/T8A | This paper | N/A |
| Plasmid: pLX304 v5-MCS (N-term v5)/mSirt3/S17A | This paper | N/A |
| Plasmid: pLX304 v5-MCS (N-term v5)/mSirt3/S17A/T8A | This paper | N/A |
| Plasmid: pLX304 v5-MCS (N-term v5)/mCPT2wt | This paper | N/A |
| Plasmid: pLX304 v5-MCS (N-term v5)/mCPT2k453Q | This paper | N/A |
| Plasmid: pLX304 v5-MCS (N-term v5)/mCPT2k457Q | This paper | N/A |
| Plasmid: pLX304 v5-MCS (N-term v5)/mCPT2K453/457Q | This paper | N/A |
| Plasmid: pLX304 v5-MCS (N-term v5)/mCPT2K453/457R | This paper | N/A |
| Software and Algorithms | ||
| WHO Report | Global Burden of Liver Cirrhosis | http://www.who.int/en |
| WHO Report | Global Dietary Database | https://www.globaldietarydatabase.org/ |
| Image J | NIH Image | https://imagej.net/ImageJ |
| Immunofluorescence image capture | LSM 53.2 | https://www.zeiss.com/microscopy/int/website/landingpages/zen-intellesis.html |
| MetaMorph | MetaMorph Software | https://www.moleculardevices.com/ |
| Crispr design | Genome Engineering 5.0 | http://www.genome-engineering.org/ |
| Group-Based Prediction System Version 3.0 (GPS 3.0) | Phosphorylation site predictive software | http://gps.biocuckoo.org/wsresult.php |
| KAT-specific Acetylation Sites Database and Predictor | http://bioinfo.bjmu.edu.cn/huac/predict_p/ | |
| SWISS-MODEL | SWISS-MODEL Online Software | https://swissmodel.expasy.org/ |
| RCSB PDB | RCSB PDB Online Software | https://www.rcsb.org/ |
| Protein Homology/Analogy Recognition Engine V 2.0 | Phyre2 Online Software | http://www.sbg.bio.ic.ac.uk/phyre2/html/page.cgi?id=index |
| Image Studio | Image Studio™ Lite | http://www.licor.com/bio/blog/software-and-accessories/free-download-image-studio-lite-software/ |
| DAVID Bioinformatics Resources 6.8 | DAVID Bioinformatics Resources Software | https://david.ncifcrf.gov |
| Microsoft Excel | Microsoft | https://products.office.com |
| GraphPad Prism 7 | GraphPad Software, Inc. | https://www.graphpad.com/scientific-software/prism/ |
Highlights.
Unlike high levels, low-level palmitate (LPA) enhances mitochondrial metabolism
LPA-treated mice increase mitochondrial activity and alleviate CCl4-hepatotoxicity
LPA activates CDK1-SIRT3 pathway to enhance mitochondrial metabolism
SIRT3 deacetylates and dimerizes CPT2 to augment fatty acid oxidation
ACKNOWLEDGEMENTS
This work was supported in part by National Cancer Institute grant R01 CA213830 (to JL), Natural Science Foundation of China grant NSFC 81673765 (to YH), the UC Davis Comprehensive Cancer Center Support Grant (CCCSG) awarded by the National Cancer Institute (NCI P30CA093373) for sharing facilities. The authors thank Dr. Andrew Vaughan, Dr. John Rutledge, Mr. Jie Hunter Huang, and Dr. Aris Alexandrou for their critical review of the manuscript and technique assistance.
Footnotes
Publisher's Disclaimer: This is a PDF file of an unedited manuscript that has been accepted for publication. As a service to our customers we are providing this early version of the manuscript. The manuscript will undergo copyediting, typesetting, and review of the resulting proof before it is published in its final form. Please note that during the production process errors may be discovered which could affect the content, and all legal disclaimers that apply to the journal pertain.
DECLARATION OF INTERESTS
All authors declare no conflict of interest and have not received any funding or benefits from industry or any for-profit organization for this work.
REFERENCES
- Akazawa Y, Cazanave S, Mott JL, Elmi N, Bronk SF, Kohno S, Charlton MR, and Gores GJ (2010). Palmitoleate attenuates palmitate-induced Bim and PUMA up-regulation and hepatocyte lipoapoptosis. J. Hepatol 52, 586–593. [DOI] [PMC free article] [PubMed] [Google Scholar]
- Arner P, Bernard S, Appelsved L, Fu KY, Andersson DP, Salehpour M, Thorell A, Ryden M, and Spalding KL (2019). Adipose lipid turnover and long-term changes in body weight. Nat. Med 25, 1385–1389. [DOI] [PubMed] [Google Scholar]
- Bao J, Scott I, Lu Z, Pang L, Dimond CC, Gius D, and Sack MN (2010). SIRT3 is regulated by nutrient excess and modulates hepatic susceptibility to lipotoxicity. Free Radic. Biol. Med 49, 1230–1237. [DOI] [PMC free article] [PubMed] [Google Scholar]
- Barreyro FJ, Kobayashi S, Bronk SF, Werneburg NW, Malhi H, and Gores GJ (2007). Transcriptional regulation of Bim by FoxO3A mediates hepatocyte lipoapoptosis. J. Biol. Chem 282, 27141–27154. [DOI] [PubMed] [Google Scholar]
- Berardi MJ, and Chou JJ (2014). Fatty acid flippase activity of UCP2 is essential for its proton transport in mitochondria. Cell Metab. 20, 541–552. [DOI] [PMC free article] [PubMed] [Google Scholar]
- Bharathi SS, Zhang Y, Mohsen AW, Uppala R, Balasubramani M, Schreiber E, Uechi G, Beck ME, Rardin MJ, Vockley J, et al. (2013). Sirtuin 3 (SIRT3) protein regulates long-chain acyl-CoA dehydrogenase by deacetylating conserved lysines near the active site. J. Biol. Chem 288, 33837–33847. [DOI] [PMC free article] [PubMed] [Google Scholar]
- Borradaile NM, Buhman KK, Listenberger LL, Magee CJ, Morimoto ET, Ory DS, and Schaffer JE (2006a). A critical role for eukaryotic elongation factor 1A-1 in lipotoxic cell death. Mol. Cell. Biol 77, 770–778. [DOI] [PMC free article] [PubMed] [Google Scholar]
- Borradaile NM, Han X, Harp JD, Gale SE, Ory DS, and Schaffer JE (2006b). Disruption of endoplasmic reticulum structure and integrity in lipotoxic cell death. J. Lipid Res 47, 2726–2737. [DOI] [PubMed] [Google Scholar]
- Brenmoehl J, and Hoeflich A (2013). Dual control of mitochondrial biogenesis by sirtuin 1 and sirtuin 3. Mitochondrion 13, 755–761. [DOI] [PubMed] [Google Scholar]
- Brookheart RT, Michel CI, Listenberger LL, Ory DS, and Schaffer JE (2009). The non-coding RNA gadd7 is a regulator of lipid-induced oxidative and endoplasmic reticulum stress. J. Biol. Chem 284, 7446–7454. [DOI] [PMC free article] [PubMed] [Google Scholar]
- Broniarek I, Koziel A, and Jarmuszkiewicz W (2016). The effect of chronic exposure to high palmitic acid concentrations on the aerobic metabolism of human endothelial EA.hy926 cells. Pflugers Arch. 468, 1541–1554. [DOI] [PMC free article] [PubMed] [Google Scholar]
- Bueno NB, de Melo IS, de Oliveira SL, and da Rocha Ataide T (2013). Very-low-carbohydrate ketogenic diet v. low-fat diet for long-term weight loss: a meta-analysis of randomised controlled trials. Br. J. Nutr 110, 1178–1187. [DOI] [PubMed] [Google Scholar]
- Bunn RC, Cockrell GE, Ou Y, Thrailkill KM, Lumpkin CK Jr., and Fowlkes JL (2010). Palmitate and insulin synergistically induce IL-6 expression in human monocytes. Cardiovasc. Diabetol 9, 73. [DOI] [PMC free article] [PubMed] [Google Scholar]
- Cacicedo JM, Benjachareowong S, Chou E, Ruderman NB, and Ido Y (2005). Palmitate-induced apoptosis in cultured bovine retinal pericytes: roles of NAD(P)H oxidase, oxidant stress, and ceramide. Diabetes 54, 1838–1845. [DOI] [PubMed] [Google Scholar]
- Cazanave SC, Mott JL, Elmi NA, Bronk SF, Werneburg NW, Akazawa Y, Kahraman A, Garrison SP, Zambetti GP, Charlton MR, et al. (2009). JNK1-dependent PUMA expression contributes to hepatocyte lipoapoptosis. J. Biol. Chem 284, 26591–26602. [DOI] [PMC free article] [PubMed] [Google Scholar]
- Chaube B, Malvi P, Singh SV, Mohammad N, Viollet B, and Bhat MK (2015). AMPK maintains energy homeostasis and survival in cancer cells via regulating p38/PGC-1alpha-mediated mitochondrial biogenesis. Cell Death Discov. 1, 15063. [DOI] [PMC free article] [PubMed] [Google Scholar]
- Corbet C, Pinto A, Martherus R, Santiago de Jesus JP, Polet F, and Feron O (2016). Acidosis Drives the Reprogramming of Fatty Acid Metabolism in Cancer Cells through Changes in Mitochondrial and Histone Acetylation. Cell Metab. 24, 311–323. [DOI] [PubMed] [Google Scholar]
- Cox J, and Mann M (2008). MaxQuant enables high peptide identification rates, individualized p.p.b.-range mass accuracies and proteome-wide protein quantification. Nat. Biotechnol 26, 1367–1372. [DOI] [PubMed] [Google Scholar]
- De Marchi U, Galindo AN, Thevenet J, Hermant A, Bermont F, Lassueur S, Domingo JS, Kussmann M, Dayon L, and Wiederkehr A (2019). Mitochondrial lysine deacetylation promotes energy metabolism and calcium signaling in insulin-secreting cells. FASEB J. 33, 4660–4674. [DOI] [PubMed] [Google Scholar]
- de Souza RJ, Mente A, Maroleanu A, Cozma AI, Ha V, Kishibe T, Uleryk E, Budylowski P, Schunemann H, Beyene J, et al. (2015). Intake of saturated and trans unsaturated fatty acids and risk of all cause mortality, cardiovascular disease, and type 2 diabetes: systematic review and meta-analysis of observational studies. B.M.J 351, h3978. [DOI] [PMC free article] [PubMed] [Google Scholar]
- Dehghan M, Mente A, Zhang X, Swaminathan S, Li W, Mohan V, Iqbal R, Kumar R, Wentzel-Viljoen E, Rosengren A, et al. (2017). Associations of fats and carbohydrate intake with cardiovascular disease and mortality in 18 countries from five continents (PURE): a prospective cohort study. Lancet 390, 2050–2062. [DOI] [PubMed] [Google Scholar]
- Domenicali M, Caraceni P, Giannone F, Baldassarre M, Lucchetti G, Quarta C, Patti C, Catani L, Nanni C, Lemoli RM, et al. (2009). A novel model of CCl4-induced cirrhosis with ascites in the mouse. J. Hepatol 51, 991–999. [DOI] [PubMed] [Google Scholar]
- Evans LM, Toline EC, Desmond R, Siegal GP, Hashim AI, and Hardy RW (2009). Dietary stearate reduces human breast cancer metastasis burden in athymic nude mice. Clin. Exp. Metastasis 26, 415–424. [DOI] [PMC free article] [PubMed] [Google Scholar]
- Egnatchik RA, Leamy AK, Jacobson DA, Shiota M, and Young JD (2014). ER calcium release promotes mitochondrial dysfunction and hepatic cell lipotoxicity in response to palmitate overload. Mol. Metab 3, 544–553. [DOI] [PMC free article] [PubMed] [Google Scholar]
- El-Assaad W, Buteau J, Peyot ML, Nolan C, Roduit R, Hardy S, Joly E, Dbaibo G, Rosenberg L, and Prentki M (2003). Saturated fatty acids synergize with elevated glucose to cause pancreatic beta-cell death. Endocrinology 144, 4154–4163. [DOI] [PubMed] [Google Scholar]
- Esposito E, Iacono A, Bianco G, Autore G, Cuzzocrea S, Vajro P, Canani RB, Calignano A, Raso GM, and Meli R (2009). Probiotics reduce the inflammatory response induced by a high-fat diet in the liver of young rats. J. Biol. Chem 139, 905–911. [DOI] [PubMed] [Google Scholar]
- Forouhi NG, Koulman A, Sharp SJ, Imamura F, Kroger J, Schulze MB, Crowe FL, Huerta JM, Guevara M, Beulens JW, et al. (2014). Differences in the prospective association between individual plasma phospholipid saturated fatty acids and incident type 2 diabetes: the EPIC-InterAct case-cohort study. Lancet Diabetes Endocrinol. 2, 810–818. [DOI] [PMC free article] [PubMed] [Google Scholar]
- Gao D, Nong S, Huang X, Lu Y, Zhao H, Lin Y, Man Y, Wang S, Yang J, and Li J (2010). The effects of palmitate on hepatic insulin resistance are mediated by NADPH Oxidase 3-derived reactive oxygen species through JNK and p38MAPK pathways. J. Biol. Chem 285, 29965–29973. [DOI] [PMC free article] [PubMed] [Google Scholar]
- Geng T, Sutter A, Harland MD, Law BA, Ross JS, Lewin D, Palanisamy A, Russo SB, Chavin KD, and Cowart LA (2015). Sphingosine Kinase 1 mediates hepatic inflammation in a mouse model of Nonalcoholic Steatohepatitis induced by high saturated fat feeding and initiates proinflammatory signaling in hepatocytes. J. Lipid Res 56, 2359–2371 [DOI] [PMC free article] [PubMed] [Google Scholar]
- Gonzalez-Hurtado E, Lee J, Choi J, and Wolfgang MJ (2018). Fatty acid oxidation is required for active and quiescent brown adipose tissue maintenance and thermogenic programing. Mol. Metab 7, 45–56. [DOI] [PMC free article] [PubMed] [Google Scholar]
- Graier WF, Malli R, and Kostner GM (2009). Mitochondrial protein phosphorylation: instigator or target of lipotoxicity? Trends Endocrinol. Metab 20, 186–193. [DOI] [PMC free article] [PubMed] [Google Scholar]
- Hallows WC, Yu W, Smith BC, Devries MK, Ellinger JJ, Someya S, Shortreed MR, Prolla T, Markley JL, Smith LM, et al. (2011). Sirt3 promotes the urea cycle and fatty acid oxidation during dietary restriction. Mol. Cell 41, 139–149. [DOI] [PMC free article] [PubMed] [Google Scholar]
- Haorah J, Rump TJ, and Xiong H (2013). Reduction of brain mitochondrial beta-oxidation impairs complex I and V in chronic alcohol intake: the underlying mechanism for neurodegeneration. PLoS One 8, e70833. [DOI] [PMC free article] [PubMed] [Google Scholar]
- Harbauer AB, Opalinska M, Gerbeth C, Herman JS, Rao S, Schonfisch B, Guiard B, Schmidt O, Pfanner N, and Meisinger C (2014). Mitochondria. Cell cycle-dependent regulation of mitochondrial preprotein translocase. Science 346, 1109–1113. [DOI] [PubMed] [Google Scholar]
- Hirschey MD, Shimazu T, Goetzman E, Jing E, Schwer B, Lombard DB, Grueter CA, Harris C, Biddinger S, Ilkayeva OR, et al. (2010). SIRT3 regulates mitochondrial fatty-acid oxidation by reversible enzyme deacetylation. Nature 464, 121–125. [DOI] [PMC free article] [PubMed] [Google Scholar]
- Hirschey MD, Shimazu T, Jing E, Grueter CA, Collins AM, Aouizerat B, Stancakova A, Goetzman E, Lam MM, Schwer B, et al. (2011). SIRT3 deficiency and mitochondrial protein hyperacetylation accelerate the development of the metabolic syndrome. Mol. Cell 44, 177–190. [DOI] [PMC free article] [PubMed] [Google Scholar]
- Hsiao YS, Jogl G, Esser V, and Tong L (2006). Crystal structure of rat carnitine palmitoyltransferase II (CPT-II). Biochem. Biophys. Res. Commun 346, 974–980. [DOI] [PMC free article] [PubMed] [Google Scholar]
- Igoillo-Esteve M, Marselli L, Cunha DA, Ladriere L, Ortis F, Grieco FA, Dotta F, Weir GC, Marchetti P, Eizirik DL, et al. (2010). Palmitate induces a pro-inflammatory response in human pancreatic islets that mimics CCL2 expression by beta cells in type 2 diabetes. Diabetologia 53, 1395–1405. [DOI] [PubMed] [Google Scholar]
- Imamura F, Sharp SJ, Koulman A, Schulze MB, Kroger J, Griffin JL, Huerta JM, Guevara M, Sluijs I, Agudo A, et al. (2017). A combination of plasma phospholipid fatty acids and its association with incidence of type 2 diabetes: The EPIC-InterAct case-cohort study. PLoS Med. 14, e1002409. [DOI] [PMC free article] [PubMed] [Google Scholar]
- Inoguchi T, Li P, Umeda F, Yu HY, Kakimoto M, Imamura M, Aoki T, Etoh T, Hashimoto T, Naruse M, et al. (2000). High glucose level and free fatty acid stimulate reactive oxygen species production through protein kinase C--dependent activation of NAD(P)H oxidase in cultured vascular cells. Diabetes 49, 1939–1945. [DOI] [PubMed] [Google Scholar]
- Inoue M, Ohtake T, Motomura W, Takahashi N, Hosoki Y, Miyoshi S, Suzuki Y, Saito H, Kohgo Y, and Okumura T (2005). Increased expression of PPARgamma in high fat diet-induced liver steatosis in mice. Biochem. Biophys. Res. Comm 336, 215–222. [DOI] [PubMed] [Google Scholar]
- Kim F, Pham M, Luttrell I, Bannerman DD, Tupper J, Thaler J, Hawn TR, Raines EW, and Schwartz MW (2007). Toll-like receptor-4 mediates vascular inflammation and insulin resistance in diet-induced obesity. Circ. Res 100, 1589–1596. [DOI] [PubMed] [Google Scholar]
- Kim HS, Patel K, Muldoon-Jacobs K, Bisht KS, Aykin-Burns N, Pennington JD, van der Meer R, Nguyen P, Savage J, Owens KM, et al. (2010). SIRT3 is a mitochondria-localized tumor suppressor required for maintenance of mitochondrial integrity and metabolism during stress. Cancer Cell 17, 41–52. [DOI] [PMC free article] [PubMed] [Google Scholar]
- Kim SR, Jeon SY, and Lee SM (2015). The association of cardiovascular risk factors with saturated fatty acids and fatty acid desaturase indices in erythrocyte in middle-aged Korean adults. Lipids Health Dis. 14, 133. [DOI] [PMC free article] [PubMed] [Google Scholar]
- Knockaert L, Berson A, Ribault C, Prost PE, Fautrel A, Pajaud J, Lepage S, Lucas-Clerc C, Begue JM, Fromenty B, et al. (2012). Carbon tetrachloride-mediated lipid peroxidation induces early mitochondrial alterations in mouse liver. Lab Invest. 92, 396–410. [DOI] [PubMed] [Google Scholar]
- Koyama T, Kume S, Koya D, Araki S, Isshiki K, Chin-Kanasaki M, Sugimoto T, Haneda M, Sugaya T, Kashiwagi A, et al. (2011). SIRT3 attenuates palmitate-induced ROS production and inflammation in proximal tubular cells. Free Radic. Biol. Med 51, 1258–1267. [DOI] [PubMed] [Google Scholar]
- Kurahashi N, Inoue M, Iwasaki M, Sasazuki S, Tsugane AS, and Japan Public Health Center-Based Prospective Study, G. (2008). Dairy product, saturated fatty acid, and calcium intake and prostate cancer in a prospective cohort of Japanese men. Cancer Epidemiol. Biomarkers Prev 17, 930–937. [DOI] [PubMed] [Google Scholar]
- Kwan HY, Hu YM, Chan CL, Cao HH, Cheng CY, Pan SY, Tse KW, Wu YC, Yu ZL, and Fong WF (2013). Lipidomics identification of metabolic biomarkers in chemically induced hypertriglyceridemic mice. J. Proteome Res 12, 1387–1398. [DOI] [PubMed] [Google Scholar]
- Leamy AK, Egnatchik RA, Shiota M, Ivanova PT, Myers DS, Brown HA, and Young JD (2014). Enhanced synthesis of saturated phospholipids is associated with ER stress and lipotoxicity in palmitate treated hepatic cells. J. Lipid Res 55, 1478–1488. [DOI] [PMC free article] [PubMed] [Google Scholar]
- Lee JE, Spiegelman D, Hunter DJ, Albanes D, Bernstein L, van den Brandt PA, Buring JE, Cho E, English DR, Freudenheim JL, et al. (2008). Fat, protein, and meat consumption and renal cell cancer risk: a pooled analysis of 13 prospective studies. J. Natl. Cancer Inst 100, 1695–1706. [DOI] [PMC free article] [PubMed] [Google Scholar]
- Levi L, Wang Z, Doud MK, Hazen SL, and Noy N (2015). Saturated fatty acids regulate retinoic acid signalling and suppress tumorigenesis by targeting fatty acid-binding protein 5. Nat. Commun 6, 8794. [DOI] [PMC free article] [PubMed] [Google Scholar]
- Lieber CS, and DeCarli LM (1970). Quantitative relationship between amount of dietary fat and severity of alcoholic fatty liver. Am. J. Clin. Nutr 23, 474–478. [DOI] [PubMed] [Google Scholar]
- Lin L, Ding Y, Wang Y, Wang Z, Yin X, Yan G, Zhang L, Yang P, and Shen H (2017). Functional lipidomics: Palmitic acid impairs hepatocellular carcinoma development by modulating membrane fluidity and glucose metabolism. Hepatology 66, 432–448. [DOI] [PubMed] [Google Scholar]
- Linder ME, and Deschenes RJ (2007). Palmitoylation: policing protein stability and traffic. Nat. Rev. Mol. Cell Biol 8, 74–84. [DOI] [PubMed] [Google Scholar]
- Listenberger LL, Ory DS, and Schaffer JE (2001). Palmitate-induced apoptosis can occur through a ceramide-independent pathway. J. Biol. Chem 276, 14890–14895. [DOI] [PubMed] [Google Scholar]
- Liu R, Fan M, Candas D, Qin L, Zhang X, Eldridge A, Zou JX, Zhang T, Juma S, Jin C, et al. (2015). CDK1-Mediated SIRT3 Activation Enhances Mitochondrial Function and Tumor Radioresistance. Mol. Cancer Ther 14, 2090–2102. [DOI] [PMC free article] [PubMed] [Google Scholar]
- Malhi H, Bronk SF, Werneburg NW, and Gores GJ (2006). Free fatty acids induce JNK-dependent hepatocyte lipoapoptosis. J. Biol. Chem 281, 12093–12101. [DOI] [PubMed] [Google Scholar]
- Mancini A, Imperlini E, Nigro E, Montagnese C, Daniele A, Orru S, and Buono P (2015). Biological and Nutritional Properties of Palm Oil and Palmitic Acid: Effects on Health. Molecules 20, 17339–17361. [DOI] [PMC free article] [PubMed] [Google Scholar]
- Mantena SK, Vaughn DP, Andringa KK, Eccleston HB, King AL, Abrams GA, Doeller JE, Kraus DW, Darley-Usmar VM, and Bailey SM (2009). High fat diet induces dysregulation of hepatic oxygen gradients and mitochondrial function in vivo. Biochem. J 417, 183–193. [DOI] [PMC free article] [PubMed] [Google Scholar]
- Marwarha G, Claycombe K, Schommer J, Collins D, and Ghribi O (2016). Palmitate-induced Endoplasmic Reticulum stress and subsequent C/EBPalpha Homologous Protein activation attenuates leptin and Insulin-like growth factor 1 expression in the brain. Cell. Sig 28, 1789–1805. [DOI] [PMC free article] [PubMed] [Google Scholar]
- Morales-Garza LA, Puche JE, Aguirre GA, Munoz U, Garcia-Magarino M, De la Garza RG, and Castilla-Cortazar I (2017). Experimental approach to IGF-1 therapy in CCl4-induced acute liver damage in healthy controls and mice with partial IGF-1 deficiency. J. Transl. Med 15, 96. [DOI] [PMC free article] [PubMed] [Google Scholar]
- Morgan L, Arendt J, Owens D, Folkard S, Hampton S, Deacon S, English J, Ribeiro D, and Taylor K (1998). Effects of the endogenous clock and sleep time on melatonin, insulin, glucose and lipid metabolism. J. Endocrinol 157, 443–451. [DOI] [PubMed] [Google Scholar]
- Mota M, Banini BA, Cazanave SC, and Sanyal AJ (2016). Molecular mechanisms of lipotoxicity and glucotoxicity in nonalcoholic fatty liver disease. Metabolism 65, 1049–1061. [DOI] [PMC free article] [PubMed] [Google Scholar]
- Nettleton JA, Lovegrove JA, Mensink RP, and Schwab U (2016). Dietary Fatty Acids: Is it Time to Change the Recommendations? Ann. Nutr. Metab 68, 249–257. [DOI] [PubMed] [Google Scholar]
- Newman JC, He W, and Verdin E (2012). Mitochondrial protein acylation and intermediary metabolism: regulation by sirtuins and implications for metabolic disease. J. Biol. Chem 287, 42436–42443. [DOI] [PMC free article] [PubMed] [Google Scholar]
- Noakes TD, and Windt J (2017). Evidence that supports the prescription of low-carbohydrate high-fat diets: a narrative review. Br. J. Sports Med 51, 133–139. [DOI] [PubMed] [Google Scholar]
- O’Shea RS, Dasarathy S, McCullough AJ, Practice Guideline Committee of the American Association for the Study of Liver Diseases, Practice Parameters Committee of the American College of, Gastroenterology. (2010). Alcoholic liver disease. Hepatology 51, 307–328. [DOI] [PubMed] [Google Scholar]
- Ozden O, Park SH, Kim HS, Jiang H, Coleman MC, Spitz DR, and Gius D (2011). Acetylation of MnSOD directs enzymatic activity responding to cellular nutrient status or oxidative stress. Aging (Albany NY) 3, 102–107. [DOI] [PMC free article] [PubMed] [Google Scholar]
- Park EJ, Lee JH, Yu GY, He G, Ali SR, Holzer RG, Osterreicher CH, Takahashi H, and Karin M (2010). Dietary and genetic obesity promote liver inflammation and tumorigenesis by enhancing IL-6 and TNF expression. Cell 140, 197–208. [DOI] [PMC free article] [PubMed] [Google Scholar]
- Park SH, Ozden O, Liu G, Song HY, Zhu Y, Yan Y, Zou X, Kang HJ, Jiang H, Principe DR, et al. (2016). SIRT2-Mediated Deacetylation and Tetramerization of Pyruvate Kinase Directs Glycolysis and Tumor Growth. Cancer Res. 76, 3802–3812. [DOI] [PMC free article] [PubMed] [Google Scholar]
- Peek CB, Affinati AH, Ramsey KM, Kuo HY, Yu W, Sena LA, Ilkayeva O, Marcheva B, Kobayashi Y, Omura C, et al. (2013). Circadian clock NAD+ cycle drives mitochondrial oxidative metabolism in mice. Science 342, 1243417. [DOI] [PMC free article] [PubMed] [Google Scholar]
- Pfaffenbach KT, Gentile CL, Nivala AM, Wang D, Wei Y, and Pagliassotti MJ (2010). Linking endoplasmic reticulum stress to cell death in hepatocytes: roles of C/EBP homologous protein and chemical chaperones in palmitate-mediated cell death. Am. J. Physiol. Endoc. Metabol 298, E1027–1035. [DOI] [PMC free article] [PubMed] [Google Scholar]
- Pfluger PT, Herranz D, Velasco-Miguel S, Serrano M, and Tschop MH (2008). Sirt1 protects against high-fat diet-induced metabolic damage. Proc. Nat. Acad. Sci. USA 105, 9793–9798. [DOI] [PMC free article] [PubMed] [Google Scholar]
- Qin L, Fan M, Candas D, Jiang G, Papadopoulos S, Tian L, Woloschak G, Grdina DJ, and Li JJ (2015). CDK1 Enhances Mitochondrial Bioenergetics for Radiation-Induced DNA Repair. Cell Rep. 13, 2056–2063. [DOI] [PMC free article] [PubMed] [Google Scholar]
- Qiu X, Brown K, Hirschey MD, Verdin E, and Chen D (2010). Calorie restriction reduces oxidative stress by SIRT3-mediated SOD2 activation. Cell Metab. 12, 662–667. [DOI] [PubMed] [Google Scholar]
- Santos-Rosa H, Leung J, Grimsey N, Peak-Chew S, and Siniossoglou S (2005). The yeast lipin Smp2 couples phospholipid biosynthesis to nuclear membrane growth. EMBO J. 24, 1931–1941. [DOI] [PMC free article] [PubMed] [Google Scholar]
- Sellem L, Srour B, Gueraud F, Pierre F, Kesse-Guyot E, Fiolet T, Lavalette C, Egnell M, Latino-Martel P, Fassier P, et al. (2018). Saturated, mono- and polyunsaturated fatty acid intake and cancer risk: results from the French prospective cohort NutriNet-Sante. Eur. J. Nutr 58, 1515–1527 [DOI] [PubMed] [Google Scholar]
- Senyilmaz D, Virtue S, Xu X, Tan CY, Griffin JL, Miller AK, Vidal-Puig A, and Teleman AA (2015). Regulation of mitochondrial morphology and function by stearoylation of TFR1. Nature 525, 124–128. [DOI] [PMC free article] [PubMed] [Google Scholar]
- Shai I, Schwarzfuchs D, Henkin Y, Shahar DR, Witkow S, Greenberg I, Golan R, Fraser D, Bolotin A, Vardi H, et al. (2008). Weight loss with a low-carbohydrate, Mediterranean, or low-fat diet. N. Engl. J. Med 359, 229–241. [DOI] [PubMed] [Google Scholar]
- Sieri S, Chiodini P, Agnoli C, Pala V, Berrino F, Trichopoulou A, Benetou V, Vasilopoulou E, Sanchez MJ, Chirlaque MD, et al. (2014). Dietary Fat Intake and Development of Specific Breast Cancer Subtypes. J. Natl. Cancer Inst 106, dju068. [DOI] [PubMed] [Google Scholar]
- Siri-Tarino PW, Sun Q, Hu FB, and Krauss RM (2010). Meta-analysis of prospective cohort studies evaluating the association of saturated fat with cardiovascular disease. Am. J. Clin. Nutr 91, 535–546. [DOI] [PMC free article] [PubMed] [Google Scholar]
- Spitz DR, and Oberley LW (2001). Measurement of MnSOD and CuZnSOD activity in mammalian tissue homogenates. Curr. Protoc. Toxicol Chapter 7, Unit 7.5. [DOI] [PubMed] [Google Scholar]
- Tahbaz N, Subedi S, and Weinfeld M (2011). Role of polynucleotide kinase/phosphatase in mitochondrial DNA repair. Nucleic Acids Res. 8, 3484–3495 [DOI] [PMC free article] [PubMed] [Google Scholar]
- Tao R, Coleman MC, Pennington JD, Ozden O, Park SH, Jiang H, Kim HS, Flynn CR, Hill S, Hayes McDonald W, et al. (2010). Sirt3-mediated deacetylation of evolutionarily conserved lysine 122 regulates MnSOD activity in response to stress. Mol. Cell 40, 893–904. [DOI] [PMC free article] [PubMed] [Google Scholar]
- Tobias DK, Chen M, Manson JE, Ludwig DS, Willett W, and Hu FB (2015). Effect of low-fat diet interventions versus other diet interventions on long-term weight change in adults: a systematic review and meta-analysis. Lancet Diabetes Endocrinol. 3, 968–979. [DOI] [PMC free article] [PubMed] [Google Scholar]
- Wakai K, Tamakoshi K, Date C, Fukui M, Suzuki S, Lin Y, Niwa Y, Nishio K, Yatsuya H, Kondo T, et al. (2005). Dietary intakes of fat and fatty acids and risk of breast cancer: a prospective study in Japan. Cancer Sci. 96, 590–599. [DOI] [PMC free article] [PubMed] [Google Scholar]
- Wang D, Wei Y, and Pagliassotti MJ (2006). Saturated fatty acids promote endoplasmic reticulum stress and liver injury in rats with hepatic steatosis. Endocrinology 147, 943–951. [DOI] [PubMed] [Google Scholar]
- Wang J, Zou JX, Xue X, Cai D, Zhang Y, Duan Z, Xiang Q, Yang JC, Louie MC, Borowsky AD, et al. (2016). ROR-gamma drives androgen receptor expression and represents a therapeutic target in castration-resistant prostate cancer. Nat. Med 22, 488–496. [DOI] [PMC free article] [PubMed] [Google Scholar]
- Wang R, Dillon CP, Shi LZ, Milasta S, Carter R, Finkelstein D, McCormick LL, Fitzgerald P, Chi H, Munger J, et al. (2011). The transcription factor Myc controls metabolic reprogramming upon T lymphocyte activation. Immunity 35, 871–882. [DOI] [PMC free article] [PubMed] [Google Scholar]
- Wang T, Cao Y, Zheng Q, Tu J, Zhou W, He J, Zhong J, Chen Y, Wang J, Cai R, et al. (2019). SENP1-Sirt3 Signaling Controls Mitochondrial Protein Acetylation and Metabolism. Mol. Cell 75, 823–834. e5. [DOI] [PubMed] [Google Scholar]
- Wang Y, Ausman LM, Russell RM, Greenberg AS, and Wang XD (2008). Increased apoptosis in high-fat diet-induced nonalcoholic steatohepatitis in rats is associated with c-Jun NH2-terminal kinase activation and elevated proapoptotic Bax. J. Nutri 138, 1866–1871. [DOI] [PMC free article] [PubMed] [Google Scholar]
- Wang Z, Fan M, Candas D, Zhang TQ, Qin L, Eldridge A, Wachsmann-Hogiu S, Ahmed KM, Chromy BA, Nantajit D, et al. (2014). Cyclin B1/Cdk1 coordinates mitochondrial respiration for cell-cycle G2/M progression. Dev. Cell 29, 217–232. [DOI] [PMC free article] [PubMed] [Google Scholar]
- Wei Y, Wang D, Gentile CL, and Pagliassotti MJ (2009). Reduced endoplasmic reticulum luminal calcium links saturated fatty acid-mediated endoplasmic reticulum stress and cell death in liver cells. Mol. Cell. Biochem 331, 31–40. [DOI] [PMC free article] [PubMed] [Google Scholar]
- Wei Y, Wang D, and Pagliassotti MJ (2007). Saturated fatty acid-mediated endoplasmic reticulum stress and apoptosis are augmented by trans-10, cis-12-conjugated linoleic acid in liver cells. Mol. Cell. Biochem 303, 105–113. [DOI] [PubMed] [Google Scholar]
- Weigert C, Brodbeck K, Staiger H, Kausch C, Machicao F, Haring HU, and Schleicher ED (2004). Palmitate, but not unsaturated fatty acids, induces the expression of interleukin-6 in human myotubes through proteasome-dependent activation of nuclear factor-kappaB. J. Biol. Chem 279, 23942–23952. [DOI] [PubMed] [Google Scholar]
- Wen H, Gris D, Lei Y, Jha S, Zhang L, Huang MT, Brickey WJ, and Ting JP (2011). Fatty acid-induced NLRP3-ASC inflammasome activation interferes with insulin signaling. Nature Immunol. 12, 408–415. [DOI] [PMC free article] [PubMed] [Google Scholar]
- Willett WC, Stampfer MJ, and Sacks FM (2014). Association of dietary, circulating, and supplement fatty acids with coronary risk. Ann. Intern. Med 161, 453. [DOI] [PubMed] [Google Scholar]
- Winnik S, Auwerx J, Sinclair D, and Matter C (2015). Protective effects of sirtuins in cardiovascular diseases: from bench to bedside. Eur. Heart J 36, 3404–3412. [DOI] [PMC free article] [PubMed] [Google Scholar]
- Xiong J, Kawagishi H, Yan Y, Liu J, Wells QS, Edmunds LR, Fergusson MM, Yu ZX, Rovira II, Brittain EL, et al. (2018). A Metabolic Basis for Endothelial-to-Mesenchymal Transition. Mol. Cell 69, 689–698. e7. [DOI] [PMC free article] [PubMed] [Google Scholar]
- Xu J, Eilat-Adar S, Loria C, Goldbourt U, Howard BV, Fabsitz RR, Zephier EM, Mattil C, and Lee ET (2006). Dietary fat intake and risk of coronary heart disease: the Strong Heart Study. Am. J. Clin. Nutr 84, 894–902. [DOI] [PubMed] [Google Scholar]
- Xu ZJ, Fan JG, Ding XD, Qiao L, and Wang GL (2010). Characterization of high-fat, diet-induced, non-alcoholic steatohepatitis with fibrosis in rats. Diges. Dis. Sci 55, 931–940 [DOI] [PMC free article] [PubMed] [Google Scholar]
- Yanagisawa N, Shimada K, Miyazaki T, Kume A, Kitamura Y, Sumiyoshi K, Kiyanagi T, Iesaki T, Inoue N, and Daida H (2008). Enhanced production of nitric oxide, reactive oxygen species, and pro-inflammatory cytokines in very long chain saturated fatty acid-accumulated macrophages. Lipids Health Dis. 7, 48. [DOI] [PMC free article] [PubMed] [Google Scholar]
- Yang W, Nagasawa K, Munch C, Xu Y, Satterstrom K, Jeong S, Hayes SD, Jedrychowski MP, Vyas FS, Zaganjor E, et al. (2016). Mitochondrial Sirtuin Network Reveals Dynamic SIRT3-Dependent Deacetylation in Response to Membrane Depolarization. Cell 167, 985–1000. e21. [DOI] [PMC free article] [PubMed] [Google Scholar]
- Yore MM, Syed I, Moraes-Vieira PM, Zhang T, Herman MA, Homan EA, Patel RT, Lee J, Chen S, Peroni OD, et al. (2014). Discovery of a class of endogenous mammalian lipids with antidiabetic and anti-inflammatory effects. Cell 159, 318–332. [DOI] [PMC free article] [PubMed] [Google Scholar]
- Yu W, Dittenhafer-Reed KE, and Denu JM (2012). SIRT3 protein deacetylates isocitrate dehydrogenase 2 (IDH2) and regulates mitochondrial redox status. J. Biol. Chem 287, 14078–14086. [DOI] [PMC free article] [PubMed] [Google Scholar]
- Zhu Y, Zou X, Dean AE, Brien JO, Gao Y, Tran EL, Park SH, Liu G, Kieffer MB, Jiang H, et al. (2019). Lysine 68 acetylation directs MnSOD as atetrameric detoxification complex versus a monomeric tumor promoter. Nat. Commun 10, 2399. [DOI] [PMC free article] [PubMed] [Google Scholar]
Associated Data
This section collects any data citations, data availability statements, or supplementary materials included in this article.
Supplementary Materials
Figure S1. SFAs intake-related global diseases mortality. Related to Figure 1A, B, C.
Figure S2. Mitochondrial functions in mouse liver AML12 cells or primary liver cells treated with gradient PA. Related to Figure 1D, E, F.
Figure S3. LPA enhances mitochondrial protein influx. Related to Figure 1F.
Figure S4. LPA prevents HPA and CC14-induced mitochondrial injury. Related to Figure 2.
Figure S5. Pretreatment with LPA for 3 or 6 days does not prevent CC14-induced mouse hepatotoxicity and mitochondrial dysfunction. Related to Figure 3.
Figure S6. Multiple sequence alignments of SIRT3 and CPT2 and mutant construction of CDK1, SIRT3 and CPT2. Related to Figure 4, 5 and 6.
Table S2. Palmitate-induced cellular effects on multiple cell types (in vitro palmitate ≥100 μM). Related to Figure 1D, E, F.
Table S3. High fat diet-induced lipotoxic effects tested by in vivo models. Related to Figure 1D, E, F, and Figure 2
Table S4. sgRNA sequences and primers used in this study, related to Figures 4 and 5 and 6.
Table S1. SFAs intake-related global disease burden and mortality. Related to Figure 1A–C and Figure S1.
Data Availability Statement
The proteomics database generated with LPA-treated AML12 cells are available upon request.