Abstract
Metaproteomics represent an important tool for the taxonomic and functional investigation of microbial communities in humans, environment, and technical applications. Due to the high complexity of the microbial communities, protein, and peptide fractionation is applied to improve the characterization of taxonomic and functional composition of microbial communities. In order to target scientific questions regarding taxonomic and functional composition adequately, a tradeoff between the number of fractions analyzed and the required depth of information has to be found. Two samples of a biogas plant were analyzed by either single LC‐MS/MS measurement (1D) or LC‐MS/MS measurements of fractions obtained after SDS‐PAGE (2D) separation. Fractionation with SDS‐PAGE increased the number of identified spectra by 273%, the number of peptides by 95%, and the number of metaproteins by 59%. Rarefaction plots of species and metaproteins against identified spectra showed that 2D separation was sufficient to identify most microbial families but not all metaproteins. More reliable quantitative comparison could be achieved with 2D. 1D separation enabled high‐throughput analysis of samples, however, depth in functional descriptions and reliability of quantification were lost. Nevertheless, the proteotyping of multiple samples was still possible. 2D separations provided more reliable quantitative data combined with a deeper insight into the taxonomic and functional composition of the microbial communities. Regarding taxonomic and functional composition, metaproteomics based on 2D is just the tip of an iceberg.
Keywords: Anaerobic digestion, Fractionation, Metaproteomics, Microbial community, Rarefaction curve
Abbreviations
- BGP
biogas plant
- BLAST
basic local alignment search tool
- KEGG
Kyoto encyclopedia of genes and genomes
- MPA
MetaProteomeAnalyzer
- PCA
principal component analysis
1. Introduction
Human health 1, 2 as well as global elemental cycles 3 and technical processes 4 depend on microbial communities and their metabolic functions. Each microbial community may consist of up to 1000 different species 5 expressing numerous proteins and using various metabolic pathways. The comprehensive investigation of microbial proteins (metaproteomics) represents a promising tool for the identification of actually existing metabolic pathways and allows the taxonomic composition of microbial communities 6 to be revealed.
Crucial steps of a metaproteomic workflow are (i) protein extraction and purification from the contaminating sample matrix, (ii) tryptic digestion to peptides, and (iii) acquisition of peptide spectra by high‐resolution LC‐MS/MS. Subsequently, the measured spectra and peptides, respectively, are identified by comparison with theoretical spectra calculated in silico from protein sequence databases 4. Due to both contaminations of samples with humic compounds and the high sample complexity in metaproteomics, the setting‐up of an efficient workflow is very challenging. On the one hand, a data‐dependent MS/MS workflow using the top 10 to 20 most abundant peptide ions does not cover all available peptide ions. On the other hand, spectra of coeluting isobaric peptides may impede successful protein identification. Thus, the cleanup of samples and characterization of peptides and proteins in metaproteomics requires time and labor intensive purification and prefractionation methods. For example, ten‐fold more proteins were identified after prefractionation of proteins from a biogas plant (BGP) by SDS‐PAGE (2D) in comparison to the investigation of the entire sample by one single LC‐MS/MS measurement (1D) 7. However, the use of a comprehensive prefractionation method increased the time required for LC‐MS/MS measurements. Accordingly, depending on the number of fractions and the required level of insight into the structure of a microbial community, a compromise has to be found. And, finally, the use of different workflows raises the question of whether the data is still comparable, even when the same samples are being analyzed.
The present study compares high‐resolution metaproteomics (SDS‐PAGE prefractionation, 2D) and high‐throughput proteotyping (without prefractionation, 1D) as previously published by Heyer et al. (2016) 8. Two samples from a BGP in the interval of 11 weeks were used to investigate differences in the depth of analysis and respective insights into microbial community composition and metabolic pathways provided by both approaches.
2. Materials and methods
2.1. Chemicals
All chemicals were at least of analysis grade. For LC‐MS/MS, MS grade solvents were used.
2.2. Metaproteomics workflow
Two samples (sample 1 and sample 2) were taken from the main fermenter of a mesophilic (40°C) BGP Wittgensdorf (“Sachsenland” e.G.) in an interval of 11 weeks and stored at –80°C until further usage. Process parameters were provided by the biogas plant operator (Supporting Information Table S1, Supporting Information Fig. S6).
Cell disruption and protein extraction were carried out in triplicate according to Heyer et al. (2013) 9 using a ball mill and phenol extraction. Afterwards proteins were dissolved in urea buffer (7 M urea, 2 M thio urea, and 0.01 g/mL DTT) 9. The protein concentration was measured by amido black assay 10, 11. For protein separation, a SDS‐PAGE 12 with a 12% separating gel was carried out. Therefore, 100 μg of protein were precipitated with ice‐cold acetone. For LC‐MS/MS measurement, the lanes from the first and the second sample were divided into 10 fragments and digested tryptically (2D) 13. Subsequently, the peptides were dissolved in 12 μL loading A, centrifuged (30 min, 13 000 × g, 4°C) and transferred to an HPLC vial.
In addition, a second SDS‐PAGE was carried out using 100 μg acetone precipitated protein. However, the SDS‐PAGE was stopped when proteins entered 0.5 cm of the separating gel (1D) 7. The samples were digested and prepared for LC‐MS/MS measurement, as described above.
Peptides were analyzed by LC‐MS/MS using a UltiMate 3000 RSLCnano splitless LC system coupled online to an Elite Hybrid Ion Trap Orbitrap Mass Spectrometer (both from Thermo Fisher Scientific, Bremen, Germany) using a 120 min gradient. For further details, please refer to Heyer et al. (2016) 8.
Before protein identification, the MS result files (*.raw files) were converted to .mgf (mascot generic format) files using Proteome Discoverer™ Software (Thermo Fisher Scientific, Bremen, Germany, version 1.4). For protein identification, the software ProteinScape (Bruker Daltonics, Bremen, Germany, version 3.1.3) and the search engine MASCOT (Matrix Science, London, England, version 2.5.1) were used along with a metagenome database including UniProtKB/Swiss‐Prot (version: 23.10.2014) and seven metagenomes 11, 14, 15, 16. The following parameters for the protein database search were applied: trypsin, one missed cleavage, monoisotopic mass, carbamidomethylation (cysteine), and oxidation (methionine) as variable modifications, ±10 ppm precursor and ±0.5 Da MS/MS fragment tolerance, 113C and +2/+ 3 charged peptide ions, and 1% false discovery rate. Protein hits were considered to be identified with at least one identified peptide.
For further taxonomic and functional result interpretation, the software MetaProteomeAnalyzer (MPA) was used 17 (Version 1.0.8d). Unknown protein sequences from the metagenome were identified by the basic local alignment search tool (BLAST, NCBI‐Blast‐version 2.2.30) 18 against UniProtKB/Swiss‐Prot 19 with a maximum e‐value of 10−4. Redundant homologous proteins were grouped into metaproteins (groups of redundant homologous proteins) according to their Uniref50 clusters 20. The taxonomy of a metaprotein was assigned using the lowest common ancestor of all proteins in a group.
Finally, profiles of the metaproteins, taxonomic orders as well as biological processes (UniProtKB keyword) were exported from the MPA software as comma separated files and fused to combined matrices using a Matlab script (The MathWorks GmbH, Ismaningen, Germany, version 8.3.0.532 (R2014a); Supporting Information 1).
For the rarefaction curves, the identified spectra, their peptides, metaproteins, and taxonomies were received from the MPA software using a Java program (Supporting Information 2). All spectra of each MS measurement were sorted by spectra intensity, and the cumulative sums of the spectra were plotted against the cumulative sum of metaproteins and species. The rarefaction curves were used for calculating the maximal number of possible identifications. The following equation was used:
| (1) |
where y denotes the number of identified metaproteins or species, x the number of spectra, and a and b represent two fitted parameters (Matlab script, Supporting Information 3) 21.
Furthermore, a t‐test was used for the comparison of either 1D or 2D for the two samples or the two samples with respect to 1D or 2D. Only changes with a p‐value of 0.05 and at least a two‐fold decrease or increase were considered significant.
Principle component analysis (PCA) was used to investigate the similarity of the two samples either by 1D or 2D with 40 other biogas plant samples (1D approach) 8. PCA was performed with Matlab using the “Statistics and machine learning toolbox.”
3. Results
3.1. Taxonomic and functional coverage of microbial communities using 1D and 2D
Metaproteomics takes aim at the taxonomic and functional description of microbial communities. In order to compare both approaches, two samples taken from biogas plants were analyzed either by 1D or 2D. For 1D, the SDS‐PAGE was stopped after proteins entered 0.5 cm of the separation gel. Therefore, only broad protein bands were observed in the stained gel (Supporting Information Fig. S1A). On the contrary, 2D is already comprised of a complete SDS‐PAGE (Supporting Information Fig. S1B). The protein profiles exhibited several intense bands and a strong blue background. This background could also be related to a light brown color before Coomassie Blue staining indicating humic compounds as contaminants. The fact that the brown contaminants remained in the gel after tryptic digestion pointed to a cleaning effect of both gel‐based approaches. A subsequent LC‐MS/MS measurement identified 1921 spectra for 1D and 7165 spectra for 2D, respectively. For 1D, the identified spectra could be assigned to 887 peptides, 4363 proteins, 420 metaproteins and 1141 species. For 2D, 1727 peptides, 6167 proteins, 666 metaproteins, and 1328 species were obtained.
Analogous to the rarefaction curves in metagenomics 22, cumulative sums of metaproteins (Fig. 1A) and species (Fig. 1B) were plotted against the cumulative sum of the identified spectra. The 1D‐derived curves showed a steeper slope than the 2D‐derived curves. The slope for identified metaproteins (Fig. 1A) was lower than for identified species (Fig. 1B). The species curves for 2D showed a saturation, whereas for all other curves, in particular for metaproteins, no saturation was observed. This indicates that not even 2D prefractionation is sufficient to reveal the majority of microbial proteins within the microbial community.
Figure 1.
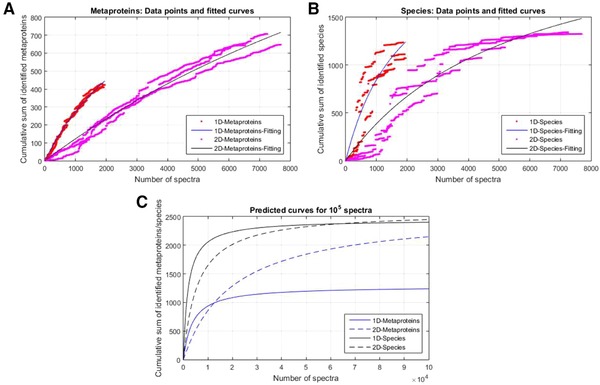
The rarefaction curves show the cumulative sum of identified metaproteins (A) and species (B) against the number of identified spectra sorted by intensity for sample 1. For each dataset, a curve fitting was carried out using Equation (1) 21. (C) Estimated number of identified metaproteins (blue) and species (black) for 100 000 spectra. The data is based on the calculated parameters a and b from curve fitting.
To estimate the required resolution of the metaproteomic workflow, rarefaction curves were fitted (Fig. 1A and B) and the maximum number of possible metaproteins and species were extrapolated (Fig. 1C, Table 1).
Table 1.
Number of identified spectra, peptides, proteins, metaproteins, and species as well as the predicted number of metaproteins and species for 1D and 2D of sample 1
| Spectra | Peptides | Proteins | Meta proteins | Species | |
|---|---|---|---|---|---|
| Identifications 1D (% of saturation) | 1921 | 887 | 4363 | 420(33%) | 1141(47%) |
| Estimated number of identifications (1D) | − | 1283 | 2446 | ||
| Identifications 2D (% of saturation) | 7164 | 1727 | 6167 | 666 (26%) | 1328 (51%) |
| Estimated number of identifications (2D) | 2579 | 2587 |
Table 2.
Assignment of gene names from Fig. 7 to metaproteins and the corresponding relative abundance based on spectral counts of each sample
| Gene name | Metaprotein | Relative abundance 1D | Relative abundance 2D | ||
|---|---|---|---|---|---|
| Sample 1 | Sample 2 | Sample 1 | Sample 2 | ||
| cdhC2 | Acetyl‐CoA decarbonylase/synthase complex subunit beta 2 | 0.0016 | 0.0008 | 0.001 | 0.0016 |
| coaX | Type III pantothenate kinase | 0 | 0.0008 | 0.0003 | 0.00017 |
| fhs | Formate–tetrahydrofolate ligase | 0.002 | 0.008 | 0.0006 | 0.0037 |
| fmdC | Molybdenum‐containing formylmethanofuran dehydrogenase 1 subunit C | 0.0007 | 0 | 0.0013 | 0.00026 |
| folD | Bifunctional protein FolD | 0.0004 | 0.0018 | 0 | 0 |
| fprA | Nitric oxide reductase | 0 | 0.00078 | 0.00039 | 0.00074 |
| frhG | Coenzyme F420 hydrogenase subunit gamma | 0.0053 | 0.0028 | 0.0037 | 0.00076 |
| gcvPB | Probable glycine dehydrogenase (decarboxylating) subunit 2 | 0 | 0.002 | 0.00019 | 0.0012 |
| gcvT | Aminomethyltransferase | 0.00046 | 0.0021 | 0.0013 | 0.0024 |
| GND1 | 6‐phosphogluconate dehydrogenase, decarboxylating 1 | 0.0014 | 0.0002 | 0 | 0 |
| grdB | Glycine reductase complex component B subunit gamma | 0.0002 | 0.0027 | 0.0021 | 0.0047 |
| hdrB1 | CoB–CoM heterodisulfide reductase subunit B 1 | 0.00067 | 0.0033 | 0.001 | 0.0013 |
| MJ0742 | Uncharacterized protein MJ0742 | 0.0002 | 0.0003 | 0.0015 | 0.0001 |
| MJ1114 | Uncharacterized protein MJ1114 | 0.0022 | 0.0002 | 0.0023 | 0.00049 |
| psbA/psbA2 | Photosystem II protein D1/Photosystem II protein D1 2 | 0.0027/0.0027 | 0.001/0.001 | 0.003/0.0029 | 0.0022/0.002 |
| thlA | Acetyl‐CoA acetyltransferase | 0 | 0.001 | 0.0006 | 0.0008 |
| thsB | Thermosome subunit beta | 0.0041 | 0.0018 | 0.0018 | 0.0015 |
| tmpC | Membrane lipoprotein TmpC | 0.0018 | 0.0005 | 0.0003 | 0.0006 |
| tuf | Elongation factor Tu | 0.0064 | 0.0046 | 0.0082 | 0.01 |
| tufA | Elongation factor Tu‐A | 0.003 | 0.0012 | 0.0005 | 0.0007 |
Based on this extrapolation, about 33% of the predicted metaproteins were identified with 1D and 26% with 2D, respectively (Table 1). Regarding the predicted number of species, 47% were detected for 1D and 51% for 2D, respectively. Whereas the estimated number of identifications by 1D and 2D was similar for the species, the estimated number of identifications was about two times higher for metaproteins using the 2D approach.
The taxonomic profiles were investigated for 1D and 2D using the Krona visualization tool 23 based on the spectral count of the metaproteins and the corresponding taxonomic annotations. The Krona plots for samples 1 and 2 showed similar profiles (Fig. 2, Supporting Information Fig. S1). Using 1D, 28% Bacteria, 35% Archaea, 0.02% Viruses, and 36% unassigned taxonomies were observed (Fig. 2A) for sample 1. In contrast, 2D revealed 34% Bacteria, 27% Archaea, 0.08% Viruses, and 38% unassigned taxonomies (Fig. 2B). The main bacterial orders in both Krona plots were Bacillales (1D: 4%/2D: 3%), Bacteroidales (1D: 2%/2D: 3%) and Clostridiales (1D: 1%/1D: 2%). Furthermore, larger amounts of the archaeal orders Methanosarcinales (1D: 7%/ 2D: 4%), Methanococcales (1D: 7%/ 2D: 5%), Methanobacteriales (1D: 7%/2D: 3%), and Methanomicrobiales (1D: 4%/2D: 3%) were identified with 1D. All archaeal orders appeared to be less abundant with 2D.
Figure 2.
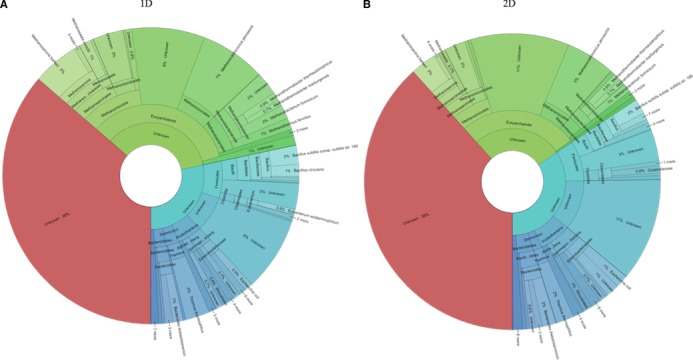
Taxonomic profile of sample 1. (A) Taxonomic profile of 1D prefractionation without Eukaryotes. (B) Taxonomic profile of 2D prefractionation without Eukaryotes. The profile was visualized using Krona tools 23.
Based on the Krona plots, the abundances of taxonomic ranks were counted (Supporting Information Table S5). The deeper the taxonomic rank, the higher the differences between 1D and 2D would be. For 1D, 84 species were identified in both samples. 2D revealed up to 148 species in sample 1 and 136 species in sample 2.
To confirm the differences between both approaches regarding the species composition, a t‐test (Supporting Information Table S2) was carried out (Supporting Information Fig. S4). Only four orders were found to be significantly underestimated by the 1D approach in contrast to the 2D approach. These include the low abundant orders Sulfolobales, Cytophages, Campylobacterales, and Chroococcales.
For the comparison of the detected microbial functions identified by 1D and 2D, the Kyoto encyclopedia of genes and genomes (KEGG) ontology and Enzyme Commission numbers of identified metaproteins were considered. As an example, the impact of the separation method (1D vs 2D) on the enzyme identifications of the central carbon metabolism (KEGG map 01200) is shown in Fig. 3 24.
Figure 3.
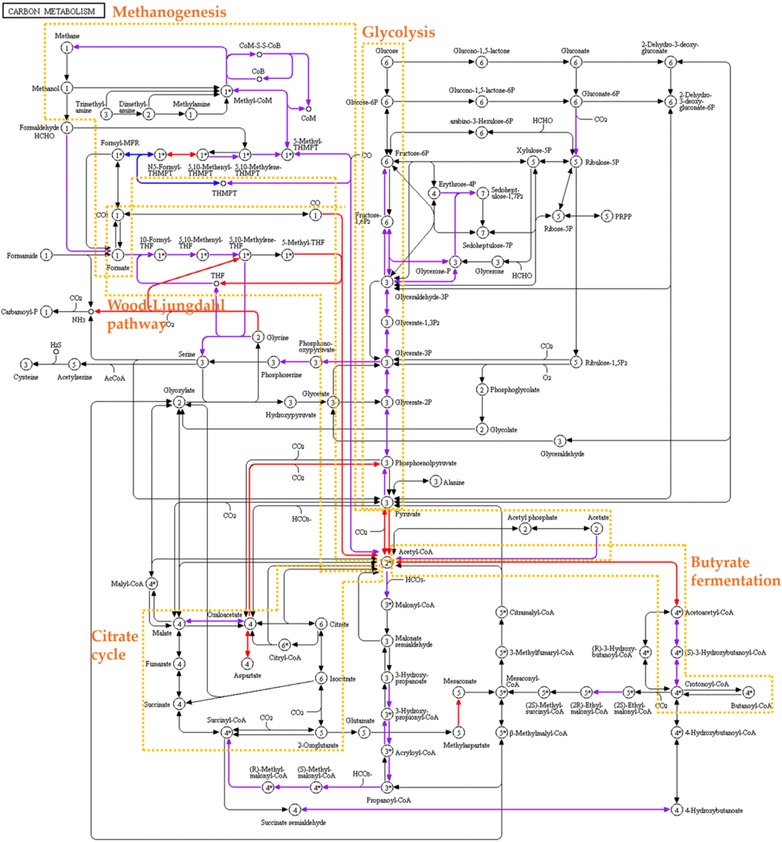
KEGG pathway map of the central carbon metabolism (map 01200) 24 using KEGG Ontologies and Enzyme Commission numbers identified by 1D or 2D of sample 1. Blue: Identified in 1D; Red: Identified in 2D; Purple: Identified in both 1D and 2D.
Metaproteins of methanogenesis, glycolysis, citrate cycle, butyrate fermentation, and Wood‐Ljungdahl pathway were present in both approaches. However, 2D covered more steps of the central carbon metabolism. For instance, more enzymes of Wood‐Ljungdahl pathway and butyrate fermentation were identified.
In order to investigate further biological functions found to be different between 1D and 2D, the biological processes (UniProtKB Keywords) were compared by means of a t‐test (Supporting Information Table S3) and visualized in a scatter plot (Fig. 4).
Figure 4.
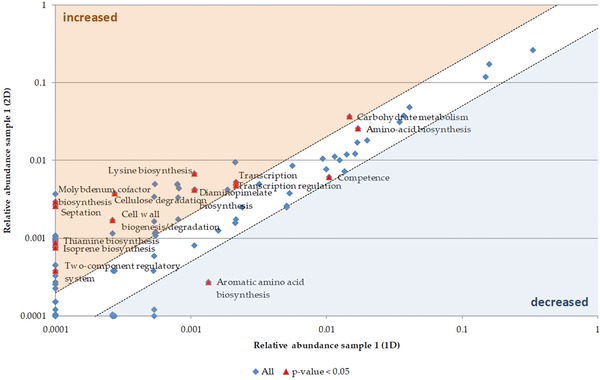
Scatter plot for biological processes comparing 1D and 2D of sample 1. The mean spectral counts of 2D were plotted against the mean spectral counts of 1D. Significant changes between 1D and 2D were determined by a t‐test. The red colored points indicate a p‐value less than 0.05. The points in the blue or the orange area are at least decreased (blue) or increased (orange) two‐fold. Description of biological processes is based on UniProtKB Keywords for biological processes.
The most significant differences were observed for biological processes showing low mean abundances in both approaches. Aromatic amino acid biosynthesis decreased in the 2D‐approach. In contrast, the abundance of transcription, transcriptional regulation, lysine biosynthesis, diaminopimelate biosynthesis, carbohydrate metabolism, cellulose degradation, and cell wall biogenesis/degradation increased. Metaproteins for septation, two‐component regulatory systems as well as thiamine‐, isoprene‐, and molybdenum cofactor biosynthesis could only be identified by the 2D‐approach.
3.2. Application of 1D and 2D for quantitative comparison of samples
The two samples of the BGP were compared either by 1D or 2D to investigate the impact of a reduction in feeding volume on the taxonomic and functional structure of the microbial communities.
Comparing the biological processes of both samples, the application of 1D and 2D prefractionation resulted in different outcomes (Fig. 5). The coenzyme A biosynthesis was newly detected for sample 2 in 1D. In 2D, coenzyme A biosynthesis decreased. However, a low mean abundance in spectral counts was detected for both methods. Histidine‐ and methionine biosynthesis were also significantly increased for sample 2 for the 1D, but not for the 2D approach.
Figure 5.
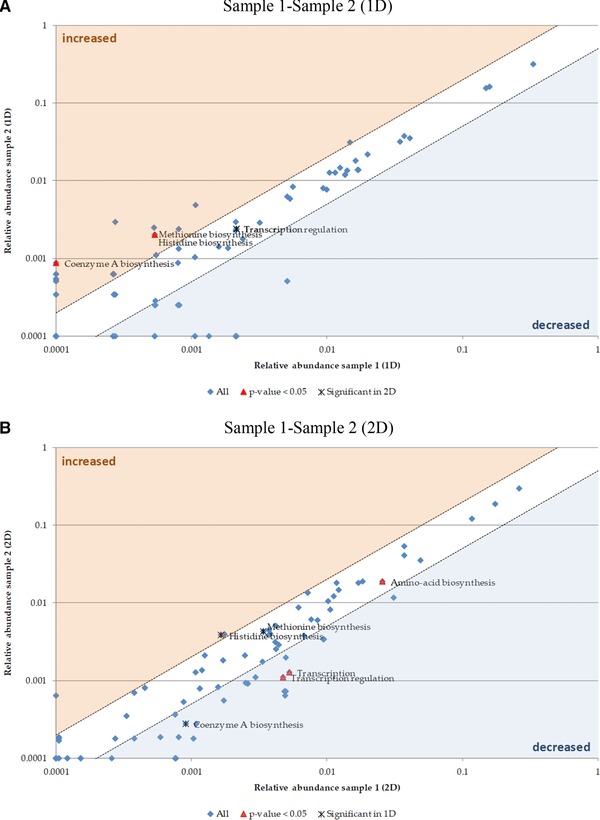
Scatter plot for biological processes comparing the two samples of BGP. The mean spectral counts of sample 2 were plotted against the mean spectral counts of sample 1. Significant changes between sample 1 and sample 2 for 1D (A) or 2D (B) were determined by a t‐test. The red colored points indicate a p‐value less than 0.05. The points in the blue or orange area are at least decreased two‐fold (blue) or increased two‐fold (orange). The description of biological processes is based on UniProtKB Keywords for biological processes.
A PCA was performed with all 1D and 2D samples. In addition, samples obtained from a previous study comprising 40 other biogas plant samples (Fig. 6) were included 8. The latter were prefractionated using the 1D approach. The samples of 1D and 2D clustered with the other mesophilic BGP, but remained separated indicating that mixing 1D and 2D in subsequent statistic approaches (e.g. PCA) is not applicable. Furthermore, the position of both individual samples of each BGP was slightly different for the 1D approach.
Figure 6.
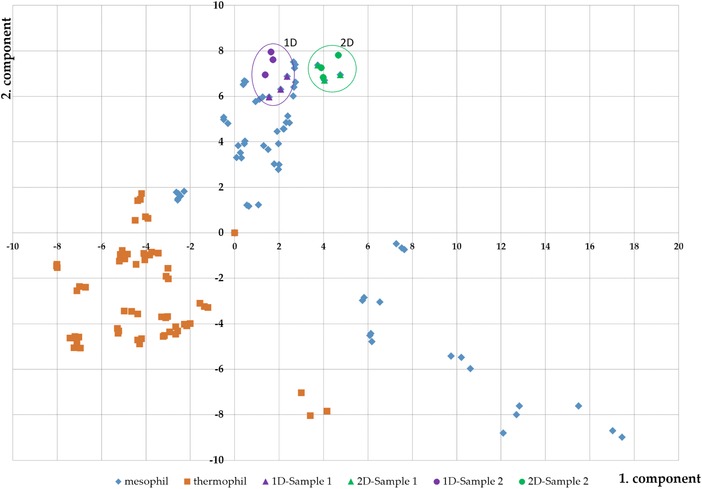
Principle component analysis is based on all metaproteins, which represent in at least one BGP one percent of the identified spectra. For comparability, the two investigated samples (sampe 1: triangle; sample 2: point) with 1D (purple) and 2D (green) were plotted together with 40 other biogas plant samples 8. The mesophilic BGP were plotted in blue and the thermophilic BGP in orange.
The comparison of samples 1 and 2 for either 1D or 2D revealed some inconsistent findings for the identified metaproteins (Fig. 7). Twelve significantly increased or decreased metaproteins were found in 1D (Fig. 7A). These metaproteins were not significant for 2D, except for the metaproteins MJ1114, fhs, gcvPB, and grdB (Fig. 7B). It is also noticeable that three metaproteins from Archaea are found to have decreased in sample 2 for 2D. For 1D, only one of the metaproteins from Archaea had decreased in sample 2. Three metaproteins for the amino acid synthesis are found to have increased for sample 2 in the 1D and 2D approach.
Figure 7.
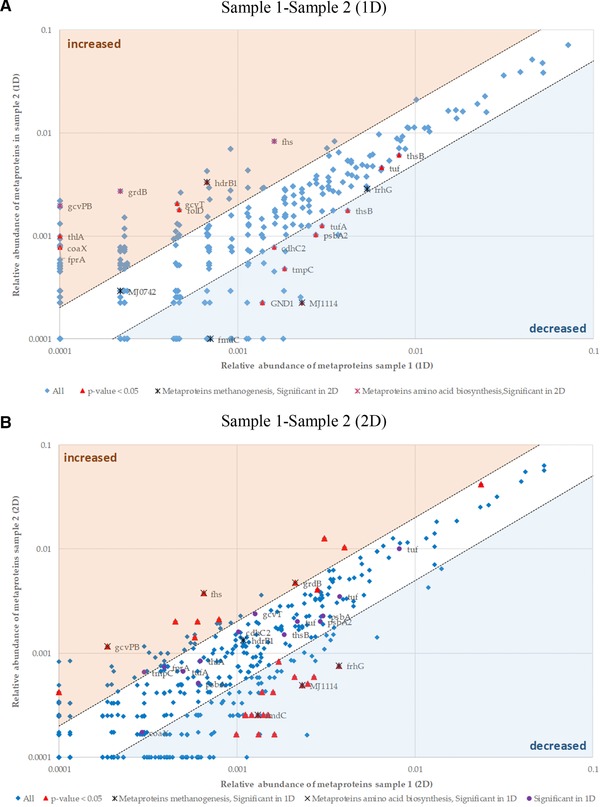
Scatter plot for metaproteins comparing the two samples of BGP. The mean spectral counts of sample 2 were plotted against the mean spectral counts of sample 1. Significant changes between sample 1 and sample 2 for 1D (A) or 2D (B) were determined by a t‐test (Supporting Information Table S4). The metaproteins with a p‐value of at most 0.05 were labeled red. Metaproteins of methanogenic Archaea are colored red. The relative abundances and protein names are shown in Table 2.
4. Discussion
Setting up metaproteomics studies, researches have to consider the number of samples to be prepared and analyzed including the required depth of analysis to target appropriately their scientific questions. For the elucidation of metabolic pathways or specific microbial interactions, sample prefractionation is applied frequently to increase the resolution of the experiments. However, sample prefractionation (and replicate measurements) multiply the effort and are therefore not suitable for high‐throughput studies. Benchmarking 1D and 2D regarding the depth of taxonomic and functional results, the quantification of results and the application of statistical data analysis is the main target of the study.
The present study compares 2D prefractionation for high‐resolution metaproteomics and a 1D approach for high‐throughput proteotyping. As expected, 1D resulted in a lower number of identified spectra, peptides, and metaproteins as previously observed by Kohrs et al. (2014) 7. The application of a more sensitive Orbitrap Elite mass spectrometer compared to that used in Kohrs et al. (2014) 7 resulted in about 10‐fold more identifications that provided a depth of data that allows for a functional and taxonomic analysis of 1D data. 2D separation of the sample before tryptic digestion in 10 fractions allowed for a 2.73‐fold increase in the number of identified spectra, resulting in 95% more peptides, 59% more metaproteins, and 16% more taxonomies. A higher numbers of species than metaproteins were observed in rarefaction curves (Fig. 1), presumably because many spectra were identified as peptides matching to more than one and in worst case hundreds of homologs proteins from different species. Thus, the number of species is overestimated due to the similarity of homologous proteins in the database. Nevertheless, rarefaction curves provide information about the coverage of all species and metaproteins within the sample. Whereas 1D failed to cover the most abundant species, the saturation of 2D curves pointed to a high coverage of species. Different numbers of expected species in 1D and 2D might be attributed to the random occurrence of spectra matching to multiple homolog proteins influencing strongly the curve fit. Counting species based on metaproteins and the respective lowest common ancestors confirms the relation between taxonomies and functions of metaproteins 17. Furthermore, it seemed to be more accurate with 84 species for 1D and showed an increase of 60% for 2D. The numbers of identified species were in the same range as in previous metaproteomic studies of BGP, but lower than species observed with metagenomic approaches 5. The lower abundance of Archaea in 2D was most likely related to the selection of most abundant top N precursors in LC‐MS/MS measurements preferring abundant proteins. Most likely, the higher diversity of Bacteria corresponds to various less abundant species suppressed the detection of bacterial proteins in 1D due to few highly abundant Archaea as previously shown by other studies 4, 25. However, the higher taxonomic resolution of 2D does not always justify the higher effort, in particular in high‐throughput studies.
But considering the higher number of detected metaproteins and their related functions could change this point of view. A ten‐fold higher effort of 2D resulted in 60% more metaproteins, more reliability in quantifying biological processes and single metaproteins. This is advantageous, in particular for in‐depth metabolic pathway studies. A major reason for a low amplification of identified metaproteins within 2D was the high redundancy of detected peptides. On the one hand, this could indicate the required improvement of data‐dependent precursor ions selection for MS/MS. On the other hand, the separation of the LC system or the SDS‐PAGE may not have been optimal. Due to contaminating humic compounds, the latter has been observed for biogas samples showing smearing of proteins in SDS‐PAGE resulting in redundant hits in several fractions 7. In contrast, SDS‐PAGE fractionation of mitochondrial proteins resulted in a higher multiplicity of identifications due to better separation 26. Instead of SDS‐PAGE as ion exchange chromatography of tryptic peptides could be applied as an alternative fractionation step 27. Based on the fitted curve of the rarefaction plot (Fig. 1, Table 1), the expected number of metaproteins at 100% saturation is approximately 2600 metaproteins. This number appeared to be very small considering the number of detected species where each expressed 1000 proteins 28. But removing redundancy by generating metaproteins could be a reason for the underestimation of metaproteins in comparison to taxonomic variety. Here, the application of the corresponding metagenomes and the binning of the most abundant species could optimize the bioinformatic processing of data 6.
The comparison of samples taken eleven weeks apart employing the t‐test and the data from 1D and 2D showed inconsistent results. The results of 2D appeared to be more reliable due to the higher number of spectra used for quantification. Due to temporarily reduced feeding volume of the BGP sampled, the metaproteins of methanogenesis were found to be downregulated and nearly the same proteins of the amino acid metabolism were found to be increased by both approaches. In contrast, the results for the taxonomies and biological processes differed. According to Old et al. (2005), a quantitative comparison of spectral abundance is valid above four identified spectra per LC‐MS/MS measurement 29. Besides other quality criteria in label‐free quantification 30, this fact should be respected when analyzing data quantitatively. Thus, the low resolution of 1D seems to be more appropriate for proteotyping samples from high‐throughput analyses. PCA of 1D data of both samples and previously published 1D data from BGPs 8 assigned both samples to mesophilic BGPs. The shift between all samples for 1D and the 2D approach for sample 1 and 2 in PCA could be caused by a different analysis depth indicating that mixing the data prepared by means of different experimental and bioinformatic workflows is not applicable. This fact should be also considered when discussing the occurrence of specific taxonomies or functions from related publications.
In conclusion, the results obtained with 1D and 2D prefractionation of samples differ slightly. 1D enables high‐throughput analysis of samples losing depth in functional description and reliability in quantification based on spectral count, but still allowing proteotyping multiple samples. 2D provides more reliable quantitative data combined with a better insight into the composition and metabolic pathways of the microbial community. Nevertheless, metaproteomics is so far only hitting the tip of an iceberg. Extensive fractionation adding a third separation step prior to MS, e.g. 2D‐LC 31 or liquid isoelectric focusing prior to SDS‐PAGE 7, could provide potentially more insight into the structure and function of microbial communities. However, increasing the redundancy of identified metaproteins in multiple fractions could limit the efficiency of this approach. Here, recent developments in MS, e.g. the separation of tryptic peptides by ion mobility separation 32, 33 prior MS, could be more efficient, because a higher sampling rate and a higher sensitivity will increase the identification without an extensive fractionation of samples.
Practical application
Metaproteomics is a well‐established method for the taxonomic and functional investigation of complex microbial communities. Due to a high complexity, prefractionation is necessary to achieve a deeper insight into the taxonomic and functional composition of microbial communities. The research in this study compares two methods by either single LC‐MS/MS measurement (1D) or LC‐MS/MS measurements of 10 fractions obtained after SDS‐PAGE (2D) regarding their resolution for taxonomic and functional composition. It has been shown that 1D is suitable for proteotyping multiple samples but not sufficient for taxonomic and functional investigation or quantitative analysis. Therefore, the use of 2D proves to be a more promising method.
Röbbe Wünschiers and Lucy Löser provided the biogas samples and process parameters of the BGP. Experiments were performed by Lisa Wenzel. The data analysis was carried out by Lisa Wenzel and Robert Heyer. Data for the rarefactions curves were generated by Kay Schallert. The manuscript was written by Lisa Wenzel and Robert Heyer with the help of Dirk Benndorf and Udo Reichl.
The authors have declared no conflict of interest.
Supporting information
Supporting Information
Supporting Information
Supporting Information
Supporting Information
Supporting Information
Supporting Information
Supporting Information
Supporting Information
Supporting Information
Supporting Information
Acknowledgments
This work was supported by the Federal Ministry of Food and Agriculture (BMEL) communicated by the Agency for Renewable Resources (FNR), grant no. 22404115 (Biogas Measurement Program III), Federal Ministry of Education and Research (BMBF) communicated by the Project Management Jülich (PtJ), grant no. 031L0103 (de.NBI‐partner‐project MetaProteomeAnalyzer Service) and by PhD fellowship to Lucy Löser funded by Sächsische Aufbaubank (SAB) and funding from the Sächsisches Staatsministerium für Wissenschaft und Kunst (SMWK)to Röbbe Wünschiers.
Compiled in honour of the 80th birthday of Professor Wolfgang Babel.
5 References
- 1. Heintz‐Buschart, A. , May, P. , Laczny, C. C. , Lebrun, L. A. et al., Integrated multi‐omics of the human gut microbiome in a case study of familial type 1 diabetes. Nat. Microbiol. 2016, 2, 16180. [DOI] [PubMed] [Google Scholar]
- 2. Erickson, A. R. , Cantarel, B. L. , Lamendella, R. , Darzi, Y. et al., Integrated metagenomics/metaproteomics reveals human host‐microbiota signatures of Crohn's disease. PloS One 2012, 7, e49138. [DOI] [PMC free article] [PubMed] [Google Scholar]
- 3. Püttker, S. , Kohrs, F. , Benndorf, D. , Heyer, R. et al., Metaproteomics of activated sludge from a wastewater treatment plant ‐ a pilot study. Proteomics 2015, 15, 3596–3601. [DOI] [PubMed] [Google Scholar]
- 4. Heyer, R. , Kohrs, F. , Reichl, U. , Benndorf, D. , Metaproteomics of complex microbial communities in biogas plants. Microbial Biotechnol. 2015, 8, 749–763. [DOI] [PMC free article] [PubMed] [Google Scholar]
- 5. Schlüter, A. , Bekel, T. , Diaz, N. N. , Dondrup, M. et al., The metagenome of a biogas‐producing microbial community of a production‐scale biogas plant fermenter analysed by the 454‐pyrosequencing technology. J. Biotechnol. 2008, 136, 77–90. [DOI] [PubMed] [Google Scholar]
- 6. Heyer, R. , Schallert, K. , Zoun, R. , Becher, B. et al., Challenges and perspectives of metaproteomic data analysis. J. Biotechnol. 2017, 261, 24–36. [DOI] [PubMed] [Google Scholar]
- 7. Kohrs, F. , Heyer, R. , Magnussen, A. , Benndorf, D. et al., Sample prefractionation with liquid isoelectric focusing enables in depth microbial metaproteome analysis of mesophilic and thermophilic biogas plants. Anaerobe 2014, 29, 59–67. [DOI] [PubMed] [Google Scholar]
- 8. Heyer, R. , Benndorf, D. , Kohrs, F. , Vrieze de, J. et al., Proteotyping of biogas plant microbiomes separates biogas plants according to process temperature and reactor type. Biotechnol. Biofuels 2016, 9, 155. [DOI] [PMC free article] [PubMed] [Google Scholar]
- 9. Heyer, R. , Kohrs, F. , Benndorf, D. , Rapp, E. et al., Metaproteome analysis of the microbial communities in agricultural biogas plants. New Biotechnol. 2013, 30, 614–622. [DOI] [PubMed] [Google Scholar]
- 10. Popov, N. , Schmitt, M. , Schulzeck, S. , Matthies, H. , Eine störungsfreie Mikromethode zur Bestimmung des Proteingehaltes in Gewebehomogenaten. Acta Biologica et Medica Germanica 1975, 34, 1441–1446. [PubMed] [Google Scholar]
- 11. Hanreich, A. , Schimpf, U. , Zakrzewski, M. , Schlüter, A. et al., Metagenome and metaproteome analyses of microbial communities in mesophilic biogas‐producing anaerobic batch fermentations indicate concerted plant carbohydrate degradation. Syst. App. Microbiol. 2013, 36, 330–338. [DOI] [PubMed] [Google Scholar]
- 12. Laemmli, U. K. , Cleavage of structural proteins during the assembly of the head of bacteriophage T4. Nature 1970, 227, 680–685. [DOI] [PubMed] [Google Scholar]
- 13. Shevchenko, A. , Tomas, H. , Havlis, J. , Olsen, J. V. et al., In‐gel digestion for mass spectrometric characterization of proteins and proteomes. Nat. Protocols 2006, 1, 2856–2860. [DOI] [PubMed] [Google Scholar]
- 14. Info—Metagenome, metatranscriptome and single cell genome sequencing to uncover the microbiology and functional potential of biogas‐producing microbial communities from production‐scale biogas plants: Biogas Plant 1 DNA1 [Internet] [cited 2018 Mar 22]. Available from: https://genome.jgi.doe.gov/portal/BioPla1DNA1_FD/BioPla1DNA1_FD.info.html.
- 15. Rademacher, A. , Zakrzewski, M. , Schlüter, A. , Schönberg, M. et al., Characterization of microbial biofilms in a thermophilic biogas system by high‐throughput metagenome sequencing. FEMS Microbiol. Ecol. 2012, 79, 785–799. [DOI] [PubMed] [Google Scholar]
- 16. Zakrzewski, M. , Goesmann, A. , Jaenicke, S. , Jünemann, S. et al., Profiling of the metabolically active community from a production‐scale biogas plant by means of high‐throughput metatranscriptome sequencing. J. Biotechnol. 2012, 158, 248–258. [DOI] [PubMed] [Google Scholar]
- 17. Muth, T. , Behne, A. , Heyer, R. , Kohrs, F. et al., The MetaProteomeAnalyzer: A powerful open‐source software suite for metaproteomics data analysis and interpretation. J. Proteome Res. 2015, 14, 1557–1565. [DOI] [PubMed] [Google Scholar]
- 18. Altschul, S. F. , Gish, W. , Miller, W. , Myers, E. W. et al., Basic local alignment search tool. J. Mol. Biol. 1990, 215, 403–410. [DOI] [PubMed] [Google Scholar]
- 19. Apweiler, R., Bairoch, A., Wu, C. H., Barker, W. C. et al., UniProt: the universal protein knowledgebase. Nuc. Acids Res. 2017, 45, D158–D169. [DOI] [PMC free article] [PubMed] [Google Scholar]
- 20. Suzek, B. E. , Huang, H. , McGarvey, P. , Mazumder, R. et al., UniRef: Comprehensive and non‐redundant UniProt reference clusters. Bioinformatics 2007, 23, 1282–1288. [DOI] [PubMed] [Google Scholar]
- 21. Kirk, D. , Saturation curve analysis and quality control. The Shot Peener 2006, 24–30. [Google Scholar]
- 22. Wooley, J. C. , Godzik, A. , Friedberg, I. , A primer on metagenomics. PLoS Comput. Biol. 2010, 6, e1000667. [DOI] [PMC free article] [PubMed] [Google Scholar]
- 23. Ondov, B. D. , Bergman, N. H. , Phillippy, A. M. , Interactive metagenomic visualization in a Web browser. BMC Bioinformatics 2011, 12, 385. [DOI] [PMC free article] [PubMed] [Google Scholar]
- 24. Kanehisa, M. , Furumichi, M. , Tanabe, M. , Sato, Y. et al., KEGG: new perspectives on genomes, pathways, diseases and drugs. Nuc. Acids Res. 2017, 45, D353–D361. [DOI] [PMC free article] [PubMed] [Google Scholar]
- 25. Maus, I. , Koeck, D. E. , Cibis, K. G. , Hahnke, S. et al., Unraveling the microbiome of a thermophilic biogas plant by metagenome and metatranscriptome analysis complemented by characterization of bacterial and archaeal isolates. Biotechnol. Biofuels 2016, 9, 171. [DOI] [PMC free article] [PubMed] [Google Scholar]
- 26. Jafari, M. , Primo, V. , Smejkal, G. B. , Moskovets, E. V. et al., Comparison of in‐gel protein separation techniques commonly used for fractionation in mass spectrometry‐based proteomic profiling. Electrophoresis 2012, 33, 2516–2526. [DOI] [PMC free article] [PubMed] [Google Scholar]
- 27. Delahunty, C. , Yates, J. R. , Protein identification using 2D‐LC‐MS/MS. Methods 2005, 35, 248–255. [DOI] [PubMed] [Google Scholar]
- 28. Schmidt, A. , Kochanowski, K. , Vedelaar, S. , Ahrné, E. et al., The quantitative and condition‐dependent Escherichia coli proteome. Nat. Biotechnol. 2016, 34, 104–110. [DOI] [PMC free article] [PubMed] [Google Scholar]
- 29. Old, W. M. , Meyer‐Arendt, K. , Aveline‐Wolf, L. , Pierce, K. G. et al., Comparison of label‐free methods for quantifying human proteins by shotgun proteomics. Mol. Cell. Proteomics 2005, 4, 1487–1502. [DOI] [PubMed] [Google Scholar]
- 30. Arike, L. , Peil, L. , Spectral counting label‐free proteomics In: D Martins‐de‐Souza. (Ed.). Shotgun Proteomics. Methods in Molecular Biology (Methods and Protocols), vol. 1156 Humana Press, New York, NY: 2014. [DOI] [PubMed] [Google Scholar]
- 31. Davis, M. T. , Beierle, J. , Bures, E. T. , McGinley, M. D. et al., Automated LC–LC–MS–MS platform using binary ion‐exchange and gradient reversed‐phase chromatography for improved proteomic analyses. J. Chrom. B Biomed. Sci. App. 2001, 752, 281–291. [DOI] [PubMed] [Google Scholar]
- 32. Valentine, S. J. , Kulchania, M. , Barnes, C. A. , Clemmer, D. E. , Multidimensional separations of complex peptide mixtures: A combined high‐performance liquid chromatography/ion mobility/time‐of‐flight mass spectrometry approach. Internat. J. Mass Spectrometry 2001, 212, 97–109. [Google Scholar]
- 33. Helm, D. , Vissers, J. P. C. , Hughes, C. J. , Hahne, H. et al., Ion mobility tandem mass spectrometry enhances performance of bottom‐up proteomics. Mol. Cell. Proteomics 2014, 13, 3709–3715. [DOI] [PMC free article] [PubMed] [Google Scholar]
Associated Data
This section collects any data citations, data availability statements, or supplementary materials included in this article.
Supplementary Materials
Supporting Information
Supporting Information
Supporting Information
Supporting Information
Supporting Information
Supporting Information
Supporting Information
Supporting Information
Supporting Information
Supporting Information


