

Abstract
Background
With dry eye, the ratio of cholesteryl ester (CE) to wax ester (WE) decreases substantially in meibum, but the functional and structural consequences of this change are speculative. The aim of this study is to confirm this finding and to bridge this gap in knowledge by investigating the effect of varying CE/WE ratios on lipid structure and thermodynamics.
Methods
Infrared spectroscopy was use to quantify CE and WE in human meibum and to measure hydrocarbon chain conformation and thermodynamics in a cholesteryl behenate, stearyl stearate model system.
Results
The CE/WE molar ratio was 36% lower for meibum from donors with dry eye due to meibomian gland dysfunction compared with meibum from donors without dry eye. CE (5 mol %) dramatically increased the phase transition temperature of pure WE from -0.12 °C to 63 °C in the mixture. Above 5 mol % CB, the phase transition temperature increased linearly, from 68.5 °C to 85 °C. In the ordered state, CE caused an increase in lipid order from about 72% trans rotamers to about 86% trans rotamers. Above 10% CE, the hydrocarbon chains were arranged in a monoclinic geometry.
Conclusions
The CE/WE is lower in meibum from donors with dry eye due to meibomian-gland dysfunction. Major conformational changes in the hydrocarbon chains of wax and cholesteryl ester mixtures begin to occur with just 5% CB and above.
General significance
CE-WE interactions may be important for in understanding lipid layer structure and functional relationships on the surface of tears, skin and plants.
Supplementary Keywords: Cholesteryl ester, Dry eye, Infrared spectroscopy, Meibum, Wax ester
Abbreviations: CB, cholesteryl behenate; CE, cholesteryl ester; FTIR, Fourier transform infrared; OO, oleyl oleate; TFLL, tear film lipid layer; ν̃sym, the frequency of the infrared symmetric stretching band; WE, wax ester
Highlights
-
•
The CE/WE is lower in meibum from donors with meibomian-gland dysfunction.
-
•
CE may be important for the tear film lipid layer structure and function.
-
•
CE-WE interactions may be important on the surface of tears, skin and plants.
-
•
Conformational changes in WE and CE mixtures begin to occur with just 5% CE.
-
•
CE, cholesteryl ester; WE, wax ester.
1. Introduction
Elucidating wax ester (WE) and cholesteryl ester (CE) compositional, structural and functional relationships is key to our understanding of how these lipids are involved in natural and pathological processes. WE and CE are neutral lipids (Fig. 1) found in abundance in: sebum, produced by sebaceous glands in the skin [1,2]; meibum [3,4], produced by the meibomian glands in the eyelids; the spermaceti of whales [5], the exoskeleton coating of insects [6] and the cuticle of plants [7,8]. Meibum CE have unusually long hydrocarbon chains [3,9] and are not miscible in phospholipid membranes [10,11].
Fig. 1.

Structure of a) the wax ester oleyl oleate and b) the cholesteryl ester cholesteryl behenate.
The function of CE in many systems has been studied. In humans, CE regulates the cellular levels of free cholesterol [12] and transports cholesterol to specific organs [13]. Regulation of cholesterol by CE in in the ocular lens could be important as cholesterol levels are extremely high in the human lens, and ocular cholesterol levels are related to lifespan and cataract formation [[14], [15], [16]]. CE became widely studied when it was discovered that the concentration of CE increases to 50% with age in human aortic intima [17] and may contribute to plaque formation that plays a role in atherosclerosis [18,19]. Patients with sensitive scalp, a dermatological condition recently linked to abnormal amounts of sebum and have higher amounts of CE in their skin lipid than those without the condition [20].
The functions of WE are diverse. Epicuticular wax protects plants from ultraviolet radiation, pathogens and transpiration [6]. WE on the exoskeleton of some desert insects prevents water loss and serves to reflect sun light [21]. In humans, ‘ear wax’ protects the eardrum from debris [22]. In many marine species such as some whales, WE provides buoyancy, is a storage depot for lipids and plays a role in the reception and transmission of sound [5].
With dry eye, one of the most prevalent ophthalmologic complaints encountered by ophthalmologists [23,24], the ratio of CE to WE decreases substantially in meibum, but the functional and structural consequences of this change are speculative [4,25]. CE and WE constitute a majority of the human tear film lipid [[25], [26], [27], [28], [29], [30]]. Upon blinking, lipid from the meibomian glands in the eyelid spreads onto the ocular surface [[31], [32], [33]] and it is thought to influence tear stability [26,[34], [35], [36], [37]]. Relevant to the current study, the structural relationships between CE and WE could be important to understanding the function of tear lipids and dry eye disease as well as dermatological conditions. Synthetic CE at 50 mol % increased the phase transition temperature [38] of synthetic WE, but the relationship between the amount of CE and structural changes is unknown. The aim of this study is to bridge this gap in knowledge by investigating the effect of varying CE/WE ratios on lipid structure and thermodynamics using Fourier transform infrared spectroscopy (FTIR) as in previous studies [39,40]. Knowing the concentration-structural relationships could lead to a better understanding of the natural roles of CE and WE and their contribution to diseases, especially those related to meibum and sebum abnormalities where the percentage of CE changes.
2. Materials and methods
2.1. Materials
Oleyl oleate (OO) was obtained from Sigma-Aldrich Corp. (St. Louis, MO, USA), cholesteryl behenate (CB) from Santa Cruz Biotech (Dallas, TX, USA), and CHCl3 from Fisher Chemical (Pittsburgh, PA, USA). Potassium chloride crystal optic discs were obtained from Alfa Aesar (Haverhill, MA, USA).
2.2. Sample preparation
CE - WE mixtures: 0, 5, 10, 34, 40, 53, 65 and 100 mol % CE were made from stock solutions of CB and OO in CHCl3 (20 mM). Mixtures and stock solutions were stored at -70 °C under argon to prevent oxidation.
2.3. Fourier transform infrared spectroscopy, CE/WE standards
FTIR samples were prepared by placing 100 μL of each sample (0 to 100 mol % CB) onto a 13 × 2 mm, KCl infrared sample window. These were placed in a vacuum chamber for 5 min to evaporate off any remaining CHCl3. The KCl windows were placed within a temperature controlled infrared cell holder containing an insulated water coil connected to a Neslab RTE-111 (NESLAB Instruments, Newton, NH) circulating water bath. A thermistor touching the cell window enabled measurement and control of the sample cell temperature. The water bath unit was programmed to measure the temperature of the thermistor and to adjust the bath temperature so that the desired sample cell temperature was reached. Temperatures were maintained within ±0.01 °C.
Infrared spectra were obtained using a Thermo Nicolet Nexus 670 FTIR instrument (Thermo Fischer Scientific, Waltham, MA). They were acquired using 50 scans and a resolution of 1.0 cm-1. Analysis of the data was carried out using GRAMS/386 software (Galactic Industries Salem, NH).
The frequency of the infrared CH2 symmetric stretching band near 2850 cm-1, ν̃sym, was used to estimate the content of trans and gauche rotamers in the hydrocarbon chains as described previously [39,40]. In order to calculate the frequency of the symmetric stretch, ν̃sym, the baseline of the OH–CH stretching region near 3500 and 2700 cm-1 was leveled. Next, the center of mass of the CH2 symmetric stretching band was calculated by integrating the top 10% of the intensity of the band. The baseline for integrating the top 10% of the intensity of the band was parallel to the OH–CH region baseline. Lipid CH2 groups can present as either trans rotamers, which appear in ordered hydrocarbon chains, or gauche rotamers, prevalent in disordered hydrocarbon chains. Therefore, lipid hydrocarbon chain order can be evaluated based on the amount of CH2 trans rotamers present. As such, ν̃sym, which is dependent on the respective amount of gauche and trans rotamers [39,40], can be used to characterize lipid phase transitions [[39], [40], [41], [42], [43], [44], [45], [46], [47], [48], [49]] and to measure the trans rotamer content of lipid hydrocarbon chains with changes in temperature [39,[41], [42], [43], [44]]. Since rotamers are either trans or gauche, phase transitions can be described by a 2-state sigmoidal equation [40]. The percentage of trans rotamer data was used to calculate the phase transition enthalpy and entropy from the slopes of Arrhenius plots [40]. Arrhenius plots from tear-lipid phase transitions were linear with correlation coefficients greater than 0.998.
2.4. Fourier transform infrared spectroscopy, CE/WE molar ratio from human meibum
A standard curve from the infrared spectra of 34, 40, 53, 65 and 100% CB mixed with OO was used to determine the mole % of cholesteryl ester from infrared spectra of meibum. The area of the vibrational modes of the cholesterol sterol ring [50] near 800 cm-1 divided by the area of the CH2 twisting modes [51] of the hydrocarbon chains near 720 cm-1 (area ratio) was plotted on the Y axis. The mole % CB mixed with OO was plotted on the X axis. Infrared spectra from the CB/OO mixtures of standards described above were used to construct a standard curve to be used to measure the relative amount of CE/WE in human meibum samples. The area ratios of the standards were averaged from 11 infrared spectra for each concentration measured above 20 °C. Infrared spectra of human meibum were analyzed retrospectively from infrared spectra used to measure meibum lipid phase transitions [52]. Written informed consent was obtained from all donors. Protocols and procedures were reviewed by the University of Louisville Institutional Review Board as well as the Robley Rex Veterans Affairs Institutional Review Board. All procedures were in accord with the Declaration of Helsinki.
2.5. Statistics
Data are represented as the average ± the standard error of the mean. Significance was determined using the Student's t test. Values of P < 0.01 were considered statistically significant.
3. Results
Infrared spectra were analyzed retrospectively from infrared spectra used to measure meibum lipid phase transitions [52]. Patient demographics are presented in Table 1. The cohort of controls without dry eye was younger with less Blacks and males and more Asians compared with the cohort with meibomian gland dysfunction (MGD).
Table 1.
Patient demographics.
| Parameter | Control No Dry Eye | Meibomian Gland Dysfunction |
|---|---|---|
| Average Age ± Standard Deviation (y) | 35 ± 17 | 66 ± 13 |
| Median Age (y) | 27 | 68 |
| Race (%) | Caucasian (77.8) | Caucasian (77.8) |
| Hispanic (3.7) | Hispanic (2.8) | |
| Black (3.7) | Black (11.1) | |
| Asian (14.8) | Unknown (8.3) | |
| Gender (%) | Male (59.3) | Male (72.2) |
| Unknown (2) | ||
| Number | 27 | 36 |
The % CE for meibum samples (Fig. 2) was interpolated from a standard curve from CB/OO mixtures (see Methods). The standard curve was linear with a correlation coefficient of 0.9987, an intercept of 0.087 area ratio and a slope of 2.37 area ratio/% CB. The average relative standard deviation of the area ratios for a given value % of CB was ±13% of the average value. The CE/WE molar ratio was 36% lower for meibum from donors with dry eye due to meibomian gland dysfunction compared with meibum from donors without dry eye (Fig. 2). There was no correlation between age and the CE/WE molar ratio for meibum from donors with dry eye due to MGD compared with meibum from donors without dry eye, r = 0.013 and 0.13, respectively.
Fig. 2.
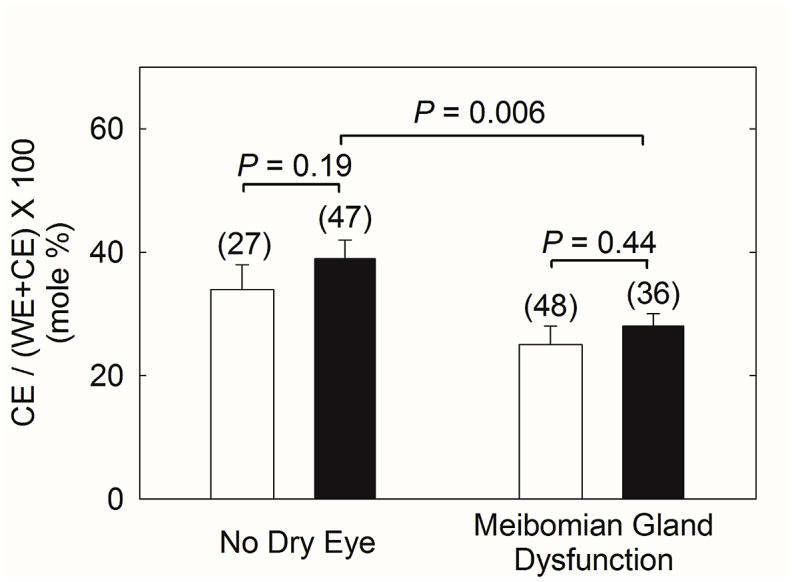
Cholesteryl ester content of human meibum calculated from infrared spectra (see Methods and Results) from the current study (open bars) compared with that calculated using NMR spectroscopy reported previously (filled bars) [4].
Phase transitions may be used to measure lipid-lipid thermodynamic interactions. As expected, ν̃sym increased with increasing temperature indicating a phase transition from an ordered, gel phase to a disordered liquid crystalline phase (Fig. 3). CB at a concentration of as low as 5 mol % dramatically increased the phase transition temperature of pure OO from -0.12 °C to 63 °C in the mixture (Fig. 4, Table 2, P < 0.001). Above 5 mol % CB, the phase transition temperature increased linearly and significantly (P < 0.01), from 68.5 °C to 85 °C (Fig. 4 and Table 2), but relatively smaller than the change from 0 to 5% CB.
Fig. 3.

Phase transitions of cholesteryl behenate (CB) and oleyl oleate mixtures. The CH2 symmetric stretching frequency was used to measure lipid order (stiffness). The higher the frequency the more disordered are the hydrocarbon chains. (●) 0% CB, (Δ) 5% CB, (★) 10% CB, (✰) 34% CB, (O) 40% CB, (□) 53% CB, (▲) 65% CB and (■)100% CB.
Fig. 4.

The change in the phase transition temperature with the mole % cholesteryl behenate mixed with oleyl oleate. The line is the linear regression fit to the data. The phase transition temperature is the temperature at the midpoint of the phase transition from an ordered gel phase to a disordered liquid crystalline phase.
Table 2.
Phase transition data for mixtures of cholesteryl behenate (CB) in oleyl oleate (OO).
| Phase Transition Parameter (CB mol %) | 0 | 5 | 10 | 34 | 40 | 53 | 65 |
|---|---|---|---|---|---|---|---|
| Minimum Wavenumber (cm-1) | 2850.0 ± 0.1 | 2850.2 ± 0.5 | 2850.20 ± 0.02 | 2849.74 ± 0.04 | 2849.56 ± 0.09 | 2849.49 ± 0.08 | 2849.11 ± 0.04 |
| Maximum Wavenumber (cm-1) | 2854.0 ± 0.1 | 2854.7 ± 0.3 | 2854.37 ± 0.3 | 2854.98 ± 0.3 | 2854.03 ± 0.10 | 2854.2 ± 0.1 | 2854.03 ± 0.28 |
| Phase Transition Temperature (°C) | -0.1 ± 0.2 | 63 ± 2 | 71.0 ± 0.7 | 68.5 ± 0.7 | 75.7 ± 0.1 | 75.1 ± 0.4 | 81 ± 1 |
| Cooperativity (relative) | -17 ± 2 | -32 ± 15 | -20 ± 2 | -17 ± 2 | -98 ± 17 | -26 ± 4 | -26 ± 4 |
| Order at 25.8 °C (% trans) | 24.8 ± 0.4 | 69.43 ± 0.01 | 70 ± 2 | 76.4 ± 0.6 | 79 ± 1 | 80 ± 1 | 84.9 ± 0.6 |
| Temperature at 50% order (°C) | -0.6 ± 0.2 | 61 ± 2 | 69.2 ± 0.6 | 66.6 ± 0.6 | 75.6 ± 0.1 | 74.8 ± 0.4 | 81 ± 1 |
With increasing amounts of CB, the minimum ν̃sym decreased (Table 2) indicating that in the ordered state, increasing CB concentration caused an increase in lipid order (% trans rotamers) from about 72% trans rotamers to about 86% trans rotamers (Fig. 5, r = 0.9165, P < 0.01). There was no statistical difference (P > 0.05) between the Δ enthalpy and Δ entropy of all of our samples which averaged 378 ± 20 kcal/mol and 1.1 ± 0.1 kcal/mol/oC, respectively.
Fig. 5.

With increasing amounts of CE, the minimum ν̃sym decreased indicating that in the ordered state, increasing CE concentration caused an increase in lipid order (% trans rotamers) from about 72% trans rotamers to about 86% trans rotamers. The line is the linear regression fit to the data.
The band(s) between 1450 and 1480 cm-1 (Fig. 6a) were assigned to C–H in-plane bending of the hydrocarbon groups. While only a single peak is visible in the spectra of 0% and 10% CB, a second band near 1477 cm-1 appears in the spectra above 10% CB. The band(s) between 700 and 740 cm-1 were assigned to methylene rocking modes (Fig. 6b). For 0% and 10% CB mixtures, only one peak is discernible. Above 10% CB, peak splitting becomes apparent, with the peaks becoming increasingly distinct with greater amounts of CB. The splitting of the CH2 bending band and rocking bands is due to correlation field splitting and suggest that the hydrocarbon chains are arranged in an orthrombic or monoclinic geometry [40,53].
Fig. 6.

a) Infrared spectra of CH2 bending region for different concentrations of cholesteryl behenate (CB) mixed with oleyl oleate at room temperature. From top to bottom (mole %): 0% CB at 23.33C; 10 %CB at 24.63C; 34% CB at 26.37C; 40% CB at 24.01C; 53% CB at 23.00C; 65% CB at 24.05C; 100% CB at 21.27C. b) Infrared spectra of the CH2 rocking region of CB mixed with oleyl oleate at room temperature. From bottom to top (mole %): 0% CB at 23.33C; 10 %CB at 24.63C; 34% CB at 26.37C; 40% CB at 24.01C; 53% CB at 23.00C; 65% CB at 24.05C; 100% CB at 21.27C.
4. Discussion
There are two major findings of the current study: The 36% decrease in the meibum CE/WE ratio with MGD was confirmed and major packing and conformational changes in the hydrocarbon chains begin to occur with just 5% CB and above. As little as 5 mol % CB raised the phase transition temperature of the wax OO from -0.1 °C to 65 °C. In a relatively ordered wax ester mixture, CE at 50% increased the phase transition of WE by 14 °C [38]. The finding from the current study that only 5% CB can do so with a greater magnitude change is a new finding. Above 5 mol % CB, the phase transition temperature increased linearly with increasing CB, but the change was not as great as the change between 0 and 5% CB.
The idea that CE increases the lipid phase transition temperature and lipid hydrocarbon order, depending on the temperature, could be important to the function of the tear film lipid layer (TFLL). Upon blinking, tears are distributed across the surface of the cornea, which then ‘break up’ after about 10 s (tear breakup time) in normal individuals [54]. The TFLL is believed to aid the spreading of aqueous tears and contributes to their stability. The TFLL must be stiff enough to withstand the sheer force of a blink but fluid enough to spread across the aqueous tear layer [55]. The current study indicates that a small percentage, 5%, of CE would be expected contribute to the overall stiffness of the TFLL that enables it to withstand the sheer force of a blink.
Splitting of the CH2 bending modes near 1470 and CH2 rocking modes near 720 above 10% CE indicates a change in packing from a hexagonal to an orthorhombic or monoclinic geometry. The correlation between the splitting of CH2 bending and rocking bands and orthorhombic/monoclinic packing geometry has been made with phospholipids [60,61], triglycerides [62,63], monolaurin [64], and fatty acids [65]. The TFLL is thought to be multilayered and consist of a polar lipid region and a non-polar lipid region [66]. While the polar lipid layer seems to play a crucial role in stabilizing tears, CE was shown to change orientation under increase lateral pressure, potentially impacting tear film stability [67]. Tighter lipid packing or altered packing geometry could lead to less potential for reorientation within the non-polar lipid layer and therefore affect normal TFLL elasticity properties.
Although stiff ordered lipids are probably important for tear film stability, too much order may be detrimental, as it may keep meibum from flowing out of the meibomian glands. Meibum lipid order correlates with tear film stability with age between 0 and 25 years old [63], MGD [52,56], and with donors who have had hematopoietic stem cell transplantation [52,57]. Correlation does not necessitate cause, but the relationship between hydrocarbon chain order and tear film stability is intriguing. When tear film stability is restored with treatment, lipid order is also restored to normal levels [58] suggesting the relationship between lipid order and tear film stability may be more than coincidental. A more ordered lipid could contribute to the formation of a discontinuous patchy tear film lipid layer, which in turn results in deteriorated spreading [59], and decreased surface elasticity. One may speculate that more ordered lipid results in attenuated capability to restore tear film lipid layer structure between blinks. A detailed review on the topic has been published [37].
In the current study, the CE/WE molar ratio was shown to be 36% lower for meibum from donors with dry eye due to MGD compared with meibum from donors without dry eye, confirming a previous study in which lipid was quantified using nuclear magnetic resonance spectroscopy [4]. Concurrent with a decrease in the CE/WE ratio, lipid order increases with dry eye due to MGD [52,56]. The current study can address the question, is the decrease in lipid order with dry eye due to the observed decrease in the CE/WE ratio with dry eye? The current study showed that a decrease in very ordered CE from 46%, similar to the ratio measured for normal meibum, to 20%, similar to the molar percentage in meibum from donors with dry eye, would decrease lipid order of a fluid WE and ordered CE mixture from 80% trans to 74% trans. Thus, based on our data using synthetic lipids, a decrease in CE cannot be responsible for increased meibum order with dry eye due to MGD.
However, unlike the disordered synthetic WE used in the current study, human meibum WE would be expected to be very ordered due to long hydrocarbon chains and high saturation levels. Several species of CE and WE have been identified in meibum [3,9,28,30,[68], [69], [70], [71], [72]], and these could produce effects not accounted for in the current study. For ordered synthetic WE below the phase transition, CE linearly increased the order of the hydrocarbon chains, but had no effect on fluid WE above the phase transition temperature. Based on these observations, a decrease in CE could contribute to the increase in lipid order observed with dry eye [52,56,57].
In addition to the contribution of CE to lipid order discussed above, more CH2 moieties (fewer CH3 moieties) [73] could contribute to the higher order of meibum from donors with dry eye [52,56,57]. Fewer CH3 moieties may be due to less hydrocarbon chain branching [76]. As double bonds also contribute to lipid disorder [74,75], fewer double bonds could also contribute to a more ordered meibum. Experiments are currently underway to isolate CE and WE from human meibum so that they can be used for experiments under more physiological conditions.
5. Conclusions
The CE/WE is lower in meibum from donors with meibomian-gland dysfunction.
CE may be important for the tear film lipid layer structure and function. Major conformational changes in the hydrocarbon chains of wax and cholesteryl ester mixtures begin to occur with just 5% CB and above.
CRediT authorship contribution statement
Zofia A. Hetman: Conceptualization, Data curation, Formal analysis, Investigation, Methodology, Validation, Writing - original draft. Douglas Borchman: Conceptualization, Data curation, Formal analysis, Funding acquisition, Investigation, Methodology, Project administration, Resources, Software, Supervision, Validation, Visualization, Writing - original draft, Writing - review & editing.
Acknowledgements
Major support was obtained from the National Institute of Health R01EY026180 and an unrestricted grant from Research to Prevent Blindness Inc. New York, NY, USA, GN151619B.
References
- 1.Robosky L.C., Wade K., Woolson D., Baker J.D., Manning M.L., Gage D.A., Reily M.D. Quantitative evaluation of sebum lipid components with nuclear magnetic resonance. J. Lipid Res. 2008;49:686–692. doi: 10.1194/jlr.D700035-JLR200. [DOI] [PubMed] [Google Scholar]
- 2.Mudgil P., Borchman D., Gerlach D., Yappert M.C. Sebum/meibum surface film interactions and phase transitional differences. Investig. Ophthalmol. Vis. Sci. 2016;57:2401–2411. doi: 10.1167/iovs.16-19117. [DOI] [PMC free article] [PubMed] [Google Scholar]
- 3.Nicolaides N., Kaitaranta J.K., Rawdah T.N., Macy J.I., Boswell T.M., Smith R.E. Meibomian gland studies: comparison of steer and human lipids. Investig. Ophthalmol. Vis. Sci. 1981;20:522–536. [PubMed] [Google Scholar]
- 4.Borchman D., Ramasubramanian A., Foulks G.N. Human meibum cholesteryl and wax ester variability with age, sex, and meibomian gland dysfunction. Investig. Ophthalmol. Vis. Sci. 2019;60:2286–2293. doi: 10.1167/iovs.19-26812. [DOI] [PMC free article] [PubMed] [Google Scholar]
- 5.Koopman H.N. Function and evolution of specialized endogenous lipids in toothed whales. J. Exp. Biol. 2018;221 doi: 10.1242/jeb.161471. jeb161471. [DOI] [PubMed] [Google Scholar]
- 6.Sharma P., Kothari S.L., Rathore M.S., Gour V.S. Properties, variations, roles, and potential applications of epicuticular wax: a review. Turk. J. Bot. 2018;42:135–149. [Google Scholar]
- 7.Turkish A.R., Sturley S.L. The genetics of neutral lipid biosynthesis: an evolutionary perspective. Am. J. Physiol. Endocrinol. Metab. 2009;297:E19–E27. doi: 10.1152/ajpendo.90898.2008. [DOI] [PMC free article] [PubMed] [Google Scholar]
- 8.Dyas L., Goad L.J. Steryl fatty acyl esters in plants. Phytochemistry. 1992;34:17–29. [Google Scholar]
- 9.Butovich I.A. Fatty acid composition of cholesteryl esters of human meibomian gland secretions. Steroids. 2010;75:726–733. doi: 10.1016/j.steroids.2010.04.011. [DOI] [PMC free article] [PubMed] [Google Scholar]
- 10.Janiak M.J., Smal D.M., Shipley G.G. Interactions of cholesterol esters with phospholipids – cholesteryl myristate and dimyristoyl lecithin. J. Lipid Res. 1979;20:183–199. [PubMed] [Google Scholar]
- 11.Souza S.L., Hallock K.J., Funari S.S., Vaz W.L.C., Hamilton J.A., Melo E. Study of the miscibility of cholesteryl oleate in a matrix of ceramide, cholesterol and fatty acid. Chem. Phys. Lipids. 2011;164:664–671. doi: 10.1016/j.chemphyslip.2011.06.011. [DOI] [PubMed] [Google Scholar]
- 12.Brown M.S., Ho Y.K., Goldstein J.L. The cholesteryl ester cycle in macrophage foam cells. Continual hydrolysis and re-esterification of cytoplasmic cholesteryl esters. J. Biol. Chem. 1980;255:9344–9352. [PubMed] [Google Scholar]
- 13.Franceschini G., Maderna P., Sirtori C.R. Reverse cholesterol transport: physiology and pharmacology. Atherosclerosis. 1991;88:99–107. doi: 10.1016/0021-9150(91)90073-c. [DOI] [PubMed] [Google Scholar]
- 14.Borchman D., Stimmelmayr R., George J.C. Whales, lifespan, phospholipids, and cataracts. J. Lipid Res. 2017;58:2289–2298. doi: 10.1194/jlr.M079368. [DOI] [PMC free article] [PubMed] [Google Scholar]
- 15.Stimmelmayr R., Borchman D. Lens lipidomes among phocidae and odobenidae. Aquat. Mamm. 2018;44:506–518. [Google Scholar]
- 16.Borchman D., Yappert M.C. Lipids and the ocular lens. J. Lipid Res. 2010;51:2473–2488. doi: 10.1194/jlr.R004119. [DOI] [PMC free article] [PubMed] [Google Scholar]
- 17.Katz S.S. The lipids of grossly normal human aortic intima from birth to old age. J. Biol. Chem. 1981;256:12275–12280. [PubMed] [Google Scholar]
- 18.Small D.M., Shipley G.G. Physical-chemical basis of lipid deposition in atherosclerosis. Science. 1974;185:222–229. doi: 10.1126/science.185.4147.222. [DOI] [PubMed] [Google Scholar]
- 19.Small D.M. George Lyman Duff memorial lecture. Progression and regression of atherosclerotic lesions. Insights from lipid physical biochemistry. Arteriosclerosis. 1988;8:103–129. doi: 10.1161/01.atv.8.2.103. [DOI] [PubMed] [Google Scholar]
- 20.Ma L., Guichard A., Cheng Y Y., Li J., Qin O., Wang X., Liu W., Tan Y. Sensitive scalp is associated with excessive sebum and perturbed microbiome. J. Cosmet. Dermatol. 2019;18:922–928. doi: 10.1111/jocd.12736. [DOI] [PubMed] [Google Scholar]
- 21.Cerkowniak M., Puckowski A., Stepnowski P., Golebiowski M. The use of chromatographic techniques for the separation and the identification of insect lipids. J. Chromatogr. 2013;937:67–78. doi: 10.1016/j.jchromb.2013.08.023. [DOI] [PubMed] [Google Scholar]
- 22.Okuda I., Bingham B., Stoney P., Hawke M. The organic composition of earwax. J. Otolaryngol. 1991;20:212–215. [PubMed] [Google Scholar]
- 23.Gayton J.L. Etiology, prevalence, and treatment of dry eye disease. Clin. Ophthalmol. 2009;3:405–412. doi: 10.2147/opth.s5555. [DOI] [PMC free article] [PubMed] [Google Scholar]
- 24.O'Brien P.D., Collum L.M. Dry eye: diagnosis and current treatment strategies. Curr. Allergy Asthma Rep. 2004;4:314–319. doi: 10.1007/s11882-004-0077-2. [DOI] [PubMed] [Google Scholar]
- 25.Shrestha R.K., Borchman D., Foulks G.N., Yappert M.C. Analysis of the composition of lipid in human meibum from normal infants, children, adolescents, adults and adults with meibomian gland dysfunction using 1H-NMR spectroscopy. Investig. Ophthalmol. Vis. Sci. 2011;52:7350–7358. doi: 10.1167/iovs.11-7391. [DOI] [PMC free article] [PubMed] [Google Scholar]
- 26.Pucker A.D., Nichols J.J. Analysis of meibum and tear lipids. Ocul. Surf. 2012;10:230–250. doi: 10.1016/j.jtos.2012.07.004. [DOI] [PubMed] [Google Scholar]
- 27.Brown S.H., Kunnen C.M., Duchoslav E., Dolla N.K., Kelso M.J., Papas E.B., Lazon de la Jara P., Willcox M.D., Blanksby S.J., Mitchel T.W. A comparison of patient matched meibum and tear lipidomes. Investig. Ophthalmol. Vis. Sci. 2013;54:7417–7424. doi: 10.1167/iovs.13-12916. [DOI] [PubMed] [Google Scholar]
- 28.Chen J., Green K.B., Nichols K.K. Quantitative profiling of major neutral lipid classes in human meibum by direct infusion electrospray ionization mass spectrometry. Investig. Ophthalmol. Vis. Sci. 2013;54:5730–5753. doi: 10.1167/iovs.12-10317. [DOI] [PMC free article] [PubMed] [Google Scholar]
- 29.Butovich I.A. Tear film lipids. Exp. Eye Res. 2013;117:4–27. doi: 10.1016/j.exer.2013.05.010. [DOI] [PMC free article] [PubMed] [Google Scholar]
- 30.Chen, J., K. B. Green-Church, and K. K. Nichols. Shotgun lipidomic analysis of human meibomian gland secretions with electrospray ionization tandem mass spectrometry. Investig. Ophthalmol. Vis. Sci. 51: 6220-6231. [DOI] [PMC free article] [PubMed]
- 31.King-Smith P.E., Hinel E.A., Nichols J.J. Application of a novel interferometric method to investigate the relation between lipid layer thickness and tear film thinning. Investig. Ophthalmol. Vis. Sci. 2010;51:2418–2423. doi: 10.1167/iovs.09-4387. [DOI] [PMC free article] [PubMed] [Google Scholar]
- 32.King-Smith P.E., Fink B.A., Fogt N., Nichols K.K., Hill R.M., Wilson G.S. The thickness of the human precorneal tear film: evidence from reflection spectra. Investig. Ophthalmol. Vis. Sci. 2000;41:3348–3359. [PubMed] [Google Scholar]
- 33.Glasgow B.J., Abduragimov A.R. Interaction of ceramides and tear lipocalin. Biochim. Biophys. Acta. 2018;1863:399–408. doi: 10.1016/j.bbalip.2018.01.004. [DOI] [PMC free article] [PubMed] [Google Scholar]
- 34.Butovich I.A., Millar T.J., Ham B.M. Understanding and analyzing meibomian lipids--a review. Curr. Eye Res. 2008;33:405–420. doi: 10.1080/02713680802018419. [DOI] [PMC free article] [PubMed] [Google Scholar]
- 35.Knop E., Knop N., Millar T., Obata H., Sullivan D.A. The international workshop on Meibomian gland dysfunction: report of the subcommittee on anatomy, physiology, and pathophysiology of the meibomian gland. Investig. Ophthalmol. Vis. Sci. 2011;52:1938–1978. doi: 10.1167/iovs.10-6997c. [DOI] [PMC free article] [PubMed] [Google Scholar]
- 36.Murube J. The origin of tears. III. The lipid component in the XIX and XX centuries. Ocul. Surf. 2013;10:200–209. doi: 10.1016/j.jtos.2012.08.001. [DOI] [PubMed] [Google Scholar]
- 37.Georgiev G.A., Eftimov P., Yokoi N. Structure-function relationship of tear film lipid layer: a contemporary perspective. Exp. Eye Res. 2017;163:17–28. doi: 10.1016/j.exer.2017.03.013. [DOI] [PubMed] [Google Scholar]
- 38.Borchman D., Yappert M.C., Milliner S., Duran D., Cox G.W., Smith R.J., Bhola R. 13C and 1H NMR ester region resonance assignments and the composition of human infant and child meibum. Exp. Eye Res. 2013;112:151–159. doi: 10.1016/j.exer.2013.04.017. [DOI] [PubMed] [Google Scholar]
- 39.Borchman D., Foulks G.N., Yappert M.C., Tang D., Ho D.V. Spectroscopic evaluation of human tear lipids. Chem. Phys. Lipids. 2007;147:87–102. doi: 10.1016/j.chemphyslip.2007.04.001. [DOI] [PubMed] [Google Scholar]
- 40.Borchman D., Foulks G.N., Yappert M.C., Ho D.V. Temperature-induced conformational changes in human tear lipid hydrocarbon chains. Biopolymers. 2007;87:124–133. doi: 10.1002/bip.20798. [DOI] [PubMed] [Google Scholar]
- 41.Kòta Z., Debreczeny M., Szalontai B. Separable contributions of ordered and disordered lipid fatty acyl chain segments to CH2 bands in model and biological membranes: a Fourier transform infrared spectroscopic study. Biospectroscopy. 1999;5:169–178. doi: 10.1002/(SICI)1520-6343(1999)5:3<169::AID-BSPY6>3.0.CO;2-#. [DOI] [PubMed] [Google Scholar]
- 42.Borchman D., Yappert M.C., Herrell P. Structural characterization of human lens membrane lipid by infrared spectroscopy. Investig. Ophthalmol. Vis. Sci. 1991;32:2404–2416. [PubMed] [Google Scholar]
- 43.Borchman D., Tang D., Yappert M.C. Lipid composition, membrane structure relationships in lens and muscle sarcoplasmic reticulum membranes. Biospectroscopy. 1999;5:151–167. doi: 10.1002/(SICI)1520-6343(1999)5:3<151::AID-BSPY5>3.0.CO;2-D. [DOI] [PubMed] [Google Scholar]
- 44.Borchman D., Yapper M.C., Afzal M. Lens lipids and maximum lifespan. Exp. Eye Res. 2004;79:761–768. doi: 10.1016/j.exer.2004.04.004. [DOI] [PubMed] [Google Scholar]
- 45.Borchman D., Cenedella R.I., Lamba O.P. Role of cholesterol in the structural order of lens membrane lipid. Exp. Eye Res. 1996;62:191–197. doi: 10.1006/exer.1996.0023. [DOI] [PubMed] [Google Scholar]
- 46.Moore D.J., Wyrwa M., Reboulleau C.P., Mendelsohn R. Quantitative IR studies of acyl chain conformational order in fatty acid homogeneous membranes of live cells of Acholeplasma laidlawii B. Biochemistry. 1993;32:6281–6287. doi: 10.1021/bi00075a023. [DOI] [PubMed] [Google Scholar]
- 47.Popova A.V., Hincha D.K. Intermolecular interactions in dry and rehydrated pure and mixed bilayers of phosphatidylcholine and digalactosyldiacylglycerol: a Fourier transform infrared spectroscopy study. Biophys. J. 2003;85:1682–1690. doi: 10.1016/S0006-3495(03)74598-6. [DOI] [PMC free article] [PubMed] [Google Scholar]
- 48.Casal H.L., Mantsch H.H. Polymorphic phase behaviour of phospholipid membranes studied by infrared spectroscopy. Biochim. Biophys. Acta. 1984;779:381–401. doi: 10.1016/0304-4157(84)90017-0. [DOI] [PubMed] [Google Scholar]
- 49.Mantsch H.H., McElhaney R.N. Phospholipid phase transitions in model and biological membranes as studied by infrared spectroscopy. Chem. Phys. Lipids. 1991;57:213–226. doi: 10.1016/0009-3084(91)90077-o. [DOI] [PubMed] [Google Scholar]
- 50.Le Cacheux P., Menard G., Quang H.N., Dao N.Q., Roach A.G., Dron D. Quantitative determination of free and esterified cholesterol concentrations in cholesterol-fed rabbit aorta using near-infrared-Fourier transform-Raman spectroscopy. Spectrochemica Acta. 1996;A52:1619–1627. [Google Scholar]
- 51.Vist M.R., Davis J.H. Phase equilibria of cholesterol/dipalmitoylphosphatidylcholine mixtures: 2H nuclear magnetic resonance and differential scanning calorimetry. Biochemistry. 1990;29:451–464. doi: 10.1021/bi00454a021. [DOI] [PubMed] [Google Scholar]
- 52.Borchman D. The optimum temperature for the heat therapy for meibomian gland dysfunction. Ocul. Surf. 2019;17:360–364. doi: 10.1016/j.jtos.2019.02.005. [DOI] [PMC free article] [PubMed] [Google Scholar]
- 53.Zhang Y.P., Lewis R.N., McElhaney R.N. Calorimetric and spectroscopic studies of the thermotropic phase behavior of the n-saturated 1,2-diacylphosphatidylglycerols. Biophys. J. 1997;72:779–793. doi: 10.1016/s0006-3495(97)78712-5. [DOI] [PMC free article] [PubMed] [Google Scholar]
- 54.Yokoi N., Georgiev G.A. Tear film-oriented diagnosis and tear film-oriented therapy for dry eye based on tear film dynamics. Investig. Ophthalmol. Vis. Sci. 2018;59:DES13–DES22. doi: 10.1167/iovs.17-23700. [DOI] [PubMed] [Google Scholar]
- 55.Mudgil P., Borchman D., Ramasubramanian A. Insights into tear film stability from babies and young adults; a study of human meibum lipid conformation and rheology. Int. J. Mol. Sci. 2018;19:E3502. doi: 10.3390/ijms19113502. [DOI] [PMC free article] [PubMed] [Google Scholar]
- 56.Borchman D., Foulks G.N., Yappert M.C., Bell J., Wells E., Neravetla S., Greenstone V. Human meibum lipid conformation and thermodynamic changes with meibomian-gland dysfunction. Investig. Ophthalmol. Vis. Sci. 2011;52:3805–3817. doi: 10.1167/iovs.10-6514. [DOI] [PMC free article] [PubMed] [Google Scholar]
- 57.Ramasubramanian A., Blackburn R., Sledge S.M., Yeo H., Yappert M.C., Gully Z.N., Singh S., Mehta S., Mehta A., Borchman D. Structural differences in meibum from donors after hematopoietic stem cell transplantations. Cornea. 2019;38 doi: 10.1097/ICO.0000000000001935. Press. [DOI] [PMC free article] [PubMed] [Google Scholar]
- 58.Foulks G.N., Borchman D., Yappert M.C., Sung-Hye K., McKay J.W. Topical azithromycin therapy of meibomian gland dysfunction: clinical response and lipid alterations. Cornea. 2010;29:781–788. doi: 10.1097/ICO.0b013e3181cda38f. [DOI] [PMC free article] [PubMed] [Google Scholar]
- 59.Nencheva Y., Ramasubramanian A., Eftimov P., Yokoi N., Borchman D., Georgiev G. Effects of lipid saturation on the surface properties of human meibum films. Int. J. Mol. Sci. 2018;19:E2209. doi: 10.3390/ijms19082209. [DOI] [PMC free article] [PubMed] [Google Scholar]
- 60.Wong P.T.T., Siminovitch D.J., Mantsch H.H. Structure and properties of model membranes: new knowledge from high-pressure vibrational spectroscopy. Biochim. Biophys. Acta. 1988;947:139–171. doi: 10.1016/0304-4157(88)90023-8. [DOI] [PubMed] [Google Scholar]
- 61.Siminovich D.J., Wong P.T.T., Mantsch H.H. Effects of cis and trans unsaturation on the structure of phospholipid bilayers: a high-pressure infrared spectroscopic study. Biochemistry. 1987;26:3277–3287. doi: 10.1021/bi00386a006. [DOI] [PubMed] [Google Scholar]
- 62.Wong P.T.T., Chagwedera T.E., Mantsch H.H. Effect of cholesterol on structural and dynamic properties of tripalmitoyl glyceride. A high-pressure infrared spectroscopic study. Biophys. J. 1989;56:845–850. doi: 10.1016/S0006-3495(89)82730-4. [DOI] [PMC free article] [PubMed] [Google Scholar]
- 63.Kodali D.R., Atkinson D., D Small D.M. Polymorphic behavior of 1,2-dipalmitoyl-3-lauroyl(PP12)- and 3-myristoyl(PP14)-sn-glycerols. J. Lipid Res. 1990;31:1853–1864. [PubMed] [Google Scholar]
- 64.Kanesaka I., Makiko I., Shimizu I. Infrared intensity of 1-monolaurin-water systems in the gel phase. Spectrochim. Acta A. 2000;56:2413–2416. doi: 10.1016/s1386-1425(00)00292-4. [DOI] [PubMed] [Google Scholar]
- 65.Kaneko F., Ishikawa E., Kobayashi M., Suzuki M. Structural study on polymorphism of long-chain dicarboxylic acids using oblique transmission method for micro FT-IR spectrometers. Spectrochim. Acta A. 2004;60:9–18. doi: 10.1016/s1386-1425(03)00181-1. [DOI] [PubMed] [Google Scholar]
- 66.Petrov P.G., Thompson J.M., Rahman I.B.A., Ellis R.E., Green E.M., Miano F., Winlove C.P. Two-dimensional order in mammalian pre-ocular tear film. Exp. Eye Res. 2007;84:1140–1146. doi: 10.1016/j.exer.2007.02.012. [DOI] [PubMed] [Google Scholar]
- 67.Telenius J., Koivuniemi A., Kulovesi P., Holopainen J.M., Vattulainen I. Role of neutral lipids in tear fluid lipid layer: coarse-grained simulation study. Langmuir. 2012;28:17092–17100. doi: 10.1021/la304366d. [DOI] [PubMed] [Google Scholar]
- 68.Lam S.M., Tong L., Yong S.S., Li B., Chaurasia S.S., Shui G., Wenk M.R. Meibum lipid composition in Asians with dry eye disease. PLoS One. 2011;6 doi: 10.1371/journal.pone.0024339. [DOI] [PMC free article] [PubMed] [Google Scholar]
- 69.Butovich I.A. Cholesteryl esters as a depot for very long chain fatty acids in human meibum. J. Lipid Res. 2009;50:501–513. doi: 10.1194/jlr.M800426-JLR200. [DOI] [PMC free article] [PubMed] [Google Scholar]
- 70.Butovich I.A., Wojtowicz J.C., Molai M. Human tear film and meibum. Very long chain wax esters and (O-acyl)-omega-hydroxy fatty acids of meibum. J. Lipid Res. 2009;50:2471–2485. doi: 10.1194/jlr.M900252-JLR200. [DOI] [PMC free article] [PubMed] [Google Scholar]
- 71.Chen J., Nichols K.K. Comprehensive shotgun lipidomics of human meibomian gland secretions using MS/MS all with successive switching between acquisition polarity modes. J. Lipid Res. 2018;59:2223–2236. doi: 10.1194/jlr.D088138. [DOI] [PMC free article] [PubMed] [Google Scholar]
- 72.Brown S.H., Kunnen C.M., Papas E.B., Lazon de la Jara P., Willcox M.D., Blanksby S.J., Mitchell T.W. Intersubject and interday variability in human tear and meibum lipidomes: a pilot study. Ocul. Surf. 2016;14:43–48. doi: 10.1016/j.jtos.2015.08.005. [DOI] [PubMed] [Google Scholar]
- 73.Borchman D., Ramakrishnan V., Henry C. Differences in meibum and tear lipid composition and conformation. Cornea. 2020;39:122–128. doi: 10.1097/ICO.0000000000002095. [DOI] [PMC free article] [PubMed] [Google Scholar]
- 74.Sledge S., Henry C., Borchman D. Human meibum age, lipid-lipid interactions and lipid saturation in meibum from infants. Int. J. Mol. Sci. 2017;18:E1862. doi: 10.3390/ijms18091862. [DOI] [PMC free article] [PubMed] [Google Scholar]
- 75.Mudgil P., Borchman D., Yappert M.C., Duran D., Cox G.W., Smith R.J., Bhola R., Dennis G.R., Whitehall J.S. Human meibum saturation and lipid order. Exp. Eye Res. 2013;116C:7985. doi: 10.1016/j.exer.2013.08.012. [DOI] [PubMed] [Google Scholar]
- 76.Borchman D., Ramasubramanian A. Human meibum chain branching variability with age, gender and meibomian gland dysfunction. Ocul. Surf. 2019;17:327–339. doi: 10.1016/j.jtos.2018.12.005. [DOI] [PMC free article] [PubMed] [Google Scholar]