

Summary
Pyruvate kinase (PK) catalyzes the conversion of phosphoenolpyruvate to pyruvate during glycolysis. The PK isoform PKM2 has additional roles in regulation of gene transcription and protein phosphorylation. PKM2 has been shown to control macrophage metabolic remodeling in inflammation, but its role in T cell biology is poorly understood. Here, we report PKM2 upregulation, phosphorylation, and nuclear accumulation in murine and human CD4+ T cells following activation in vitro. Treatment of T cells with TEPP-46, an allosteric activator that induces PKM2 tetramerization and blocks its nuclear translocation, strongly reduces their activation, proliferation, and cytokine production by inhibiting essential signaling pathways and thus preventing the engagement of glycolysis. TEPP-46 limits the development of both T helper 17 (Th17) and Th1 cells in vitro and ameliorates experimental autoimmune encephalomyelitis (EAE) in vivo. Overall, our results suggest that pharmacological targeting of PKM2 may represent a valuable therapeutic approach in T cell-mediated inflammation and autoimmunity.
Keywords: immunometabolism, PKM2, Th1, Th17, inflammation, autoimmunity
Graphical Abstract
Highlights
-
•
PKM2 translocates into the nucleus of CD4+ T cells upon TCR stimulation
-
•
TEPP-46 induces PKM2 tetramerization and blocks PKM2 nuclear translocation
-
•
TEPP-46 limits T cell activation by inhibiting glycolysis in T cells
-
•
TEPP-46 inhibits Th17 and Th1 polarization and EAE development in vivo
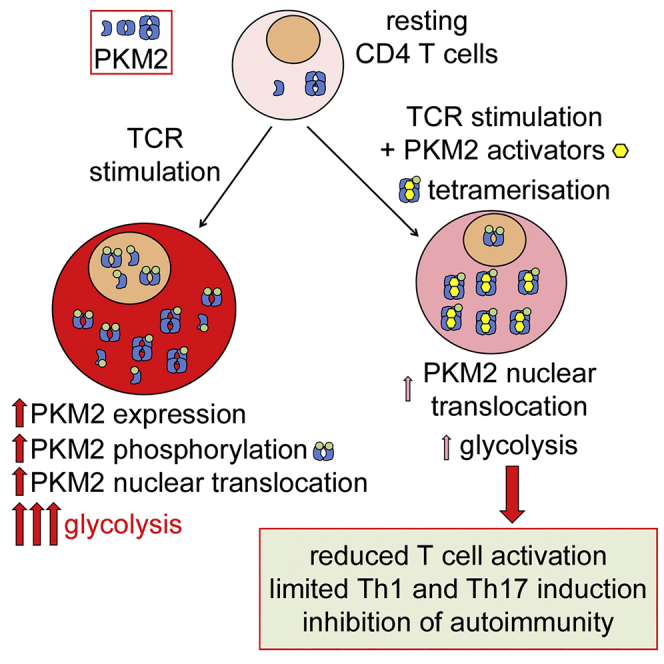
Angiari et al. show that the glycolytic enzyme PKM2 translocates into the nucleus of CD4+ T cells upon TCR stimulation. PKM2 tetramerization by small-molecule PKM2 activators blocks its nuclear translocation and engagement of glycolysis, inhibiting T cell activation, Th17 and Th1 polarization, and development of EAE in vivo.
Context and Significance
CD4+ T cells represent an immune cell population essential to remove pathogens from the organism and for long-term immunity, for example, after vaccination. However, over-activation of CD4+ T cells may be harmful for the body, causing development of immune-related pathologies such as autoimmune and allergic diseases. The protein pyruvate kinase (PK) is important for the function of certain types of immune cells, but its role in T cells is currently unknown. Researchers at the Trinity College in Dublin, Ireland, show that targeting PK activity, in particular of its isoform PKM2, limits excessive activation of CD4+ T cells and prevents the development of autoimmunity. The authors thus identify PKM2 as a potential therapeutic target for the treatment of inflammatory diseases caused by T cell over-activation.
Introduction
Both innate and adaptive immune cells undergo substantial metabolic reprogramming following activation (Pearce and Pearce, 2013, O'Neill et al., 2016). In particular, complex regulation of the intracellular metabolic profile has been observed in T lymphocytes. It is now well established that naive T cells preferentially use oxidative phosphorylation (OXPHOS) and fatty acid oxidation (FAO) in their catabolic metabolism (Geltink et al., 2018). However, upon T cell receptor (TCR) ligation and costimulation, T cells engage aerobic glycolysis and Warburg metabolism, which are crucial for proper commitment of effector functions (Pearce and Pearce, 2013, O'Neill et al., 2016, Geltink et al., 2018). Of note, among CD4+ T cell subsets, sustained aerobic glycolysis was observed in activated effector T cells such as T helper 1 (Th1), Th2, and Th17 cells, whereas memory T cells present a naive-like metabolic profile, preferentially using OXPHOS and FAO for their energy supply. This suggests that specific metabolic profiles govern the phenotype of T cell subsets (Geltink et al., 2018). Importantly, previous studies indicate that interfering with intracellular metabolic pathways in immune cells represents a novel attractive therapeutic approach in inflammation (O'Neill et al., 2016, Freitag et al., 2016, Bettencourt and Powell, 2017).
The enzyme pyruvate kinase (PK) plays a crucial role in glycolysis, as it catalyzes the irreversible conversion of phosphoenolpyruvate to pyruvate, that can in turn be used to fuel the tricarboxylic acid cycle (TCA) or converted to lactate, which is then secreted. In mammals, four different isoforms of PK were identified, but immune cells preferentially express the isoforms PKM1 and PKM2, which are generated by alternative splicing of the PKM gene (Israelsen and Vander Heiden, 2015, Palsson-McDermott et al., 2015). PKM1 is present in cells as a tetrameric protein that is highly active enzymatically and efficiently converts PEP to pyruvate and is usually expressed in terminally differentiated tissues, which require a large supply of ATP generated from pyruvate oxidation in the TCA cycle and OXPHOS (Israelsen and Vander Heiden, 2015, Dong et al., 2016). PKM2 is mainly present as a monomer/dimer in tissues with anabolic functions, including proliferating cells and cancer cells, and is subject to complex allosteric regulation that controls its enzymatic activity (Israelsen and Vander Heiden, 2015, Dong et al., 2016, Dayton et al., 2016). Monomeric/dimeric PKM2 is enzymatically less active than the tetrameric isoform, and its expression is essential in proliferating cells to divert glycolytic intermediates to pathways such as the pentose phosphate pathway (PPP) for nucleotide synthesis necessary for cell activation and proliferation (Lunt et al., 2015).
In recent years, so-called moonlighting activities of monomeric/dimeric PKM2 beyond its canonical enzymatic function have been discovered, such as regulation of gene expression and protein kinase activity (Israelsen and Vander Heiden, 2015, Dayton et al., 2016, Prakasam et al., 2018). In particular, monomeric/dimeric PKM2 was shown to translocate into the nucleus of cancer cells to stabilize the transcription factor hypoxia-inducible factor 1-alpha (HIF-1α) and to favor the expression of genes associated with glycolysis (Luo et al., 2011). Dimeric PKM2 has also been shown to play a critical role in inflammatory macrophage activation (Palsson-McDermott et al., 2015). The importance of PKM2 in T cell biology is however largely unknown. Previous work has shown that, upon TCR activation, T cells upregulate PKM2 expression (Wang et al., 2011, Cao et al., 2014). Furthermore, a role for PKM2 in T cell activation and function was suggested by a recent paper reporting that deletion of PKM2 in T cells inhibits production of interferon (IFN)-γ following activation with homocysteine (Lü et al., 2018). However, the possibility of controlling T cell activation and pathogenic potential upon TCR stimulation by modulating PKM2 activity pharmacologically has not been investigated thus far. In this study, we report that induction of tetrameric PKM2 with the small molecule activator TEPP-46 blocks the nuclear translocation of PKM2 and severely impacts T cell activation and pathogenicity both in vitro and in vivo. TEPP-46 limited Th17 and Th1 cell development in vitro and inhibited the development of experimental autoimmune encephalomyelitis (EAE). Our work suggests that pharmacological targeting of PKM2 may represent a valuable approach to control T cell-mediated inflammation and autoimmunity.
Results
PKM2 Upregulation, Phosphorylation, and Nuclear Translocation in CD4+ T Cells upon TCR Activation
To evaluate a potential role for PKM2 in T cell activation and functionality, we first analyzed PKM2 expression in murine CD4+CD62L+ T cells before and after CD3/CD28 stimulation in vitro. As previously reported (Wang et al., 2011, Cao et al., 2014), following TCR activation, we observed a time-dependent upregulation of PKM2 at both mRNA and protein levels (Figures 1A and 1B). Interestingly, isoform PKM1 mRNA and protein were also upregulated upon stimulation, but the expression levels of Pkm2 were much higher in both resting and activated T cells, compared to Pkm1, being at least 30-fold higher (Figures S1A–S1C), indicating that T cells preferentially express PKM2 over PKM1. Of note, at all stages of activation, a significant proportion of PKM2 was found to be phosphorylated on tyrosine 105 (Y105), a modification that is known to limit the formation of the PKM2 tetrameric isoform (Figure 1C) (Prakasam et al., 2018, Hitosugi et al., 2009). Accordingly, we observed an increase in both the monomeric/dimeric and the tetrameric forms of PKM2 upon T cell activation (Figure 1D). PKM2 upregulation was also paralleled by its time-dependent phosphorylation on serine 37 (S37) (Figure 1E), a modification that was reported to facilitate its translocation into the nucleus (Prakasam et al., 2018, Yang et al., 2012a). In accordance, CD3/CD28 stimulation led to the time-dependent accumulation of PKM2 in the nucleus, with a concomitant upregulation of PKM2 expression also in the cytoplasm (Figure 1F). Overall, these data indicate a potential role for PKM2 moonlighting functions in T cell activation.
Figure 1.

CD3/CD28 Activation Induces PKM2 Expression and Nuclear Accumulation in Murine CD4+CD62L+ T Cells
Murine CD4+CD62+ T cells were stimulated in vitro for 3 days with CD3/CD28 antibodies and collected at different time points of activation.
(A) Quantification of Pkm2 mRNA in resting versus activated murine CD4+CD62L+ T cells by qRT-PCR (n = 5–6 from 4 independent experiments). ∗p < 0.05 and ∗∗∗∗p < 0.0001 compared to resting condition, by one-way ANOVA with Dunnett's post-hoc test.
(B) Left, western blot showing upregulation of PKM2 protein in CD4+CD62L+ T cells following activation. Right, quantification of PKM2 expression by densitometry analysis (n = 2–3 mice from 2 independent experiments).
For (A and B), data are the mean ± standard deviation (SD).
(C) Western blots showing time-dependent increase in PKM2 phosphorylation on tyrosine 105 (Tyr105) in activated murine CD4+ T cells. One representative experiment out of two is shown.
(D) Cells were collected at different time points of activation, crosslinked with DSS, and analyzed for PKM2 expression. A representative western blot displaying upregulation of monomeric/dimeric and tetrameric PKM2 in activated T cells is shown.
(E) Western blots showing time-dependent increase in PKM2 phosphorylation on serine 37 (Ser37) in activated murine CD4+ T cells.
(F) Cells were collected at different time points of activation. Nuclear and cytoplasmic fractions were isolated by cell fractionation and analyzed for PKM2 expression by western blot. A representative blot showing accumulation of PKM2 in the nucleus and its upregulation in the cytoplasm of activated murine CD4+CD62L+ T cells is presented.
For (D), (E), and (F), one representative experiment out of two-three is shown.
Induction of PKM2 Tetramerization Blocks Murine CD4+ T Cell Activation
Given the induction of monomeric/dimeric PKM2 and its nuclear localization in activated CD4+ T cells, we sought to determine the effect of the PKM2 modulator TEPP-46 on T cell function. TEPP-46 is a well-characterized allosteric activator of PKM2 that causes its tetramerization, blocks its translocation into the nucleus, and increases its canonical enzymatic activity (Palsson-McDermott et al., 2015, Anastasiou et al., 2012). To test its impact on T cell function, we treated resting CD4+CD62L+ T cells with TEPP-46 at 50 and 100 μM, doses that were shown to limit PKM2-mediated activation of inflammatory macrophages in vitro (Palsson-McDermott et al., 2015). We initially confirmed that treatment of murine CD4+CD62L+ T cells with TEPP-46 during CD3/CD28 activation-induced PKM2 tetramerization, which was increased at 50 μM and especially at 100 μM (Figure S2A). Notably, TEPP-46 also reduced the nuclear levels of PKM2 in activated T cells, in a dose-dependent manner (Figure S2B), and had no cytotoxic effect on T cells at both the concentrations used (Figure S2C). We then investigated the effect of TEPP-46 treatment on T cell functionality. We first observed a dramatic reduction in the early levels of interleukin-2 (IL-2) mRNA in TEPP-46-treated cells, compared to control (CTRL) cells, 24 h after CD3/CD28 stimulation (Figure 2A). In accordance, TEPP-46-treated T cells produced much less IL-2 following restimulation in vitro, suggesting a defect in early T cell activation associated with TEPP-46 treatment (Figure 2B). We next found that TEPP-46 inhibited the proliferation of murine CD4+ T cell in a dose-dependent manner (Figure 2C). TEPP-46 also significantly blocked T cell activation, as evident by increased CD62L and reduced CD44 and CD25 expression in CD4+ T cells treated with TEPP-46, compared to control treatment (Figure 2D). Consistent with these results, induction of PKM2 tetramerization inhibited the expression of tumor necrosis factor-alpha (TNF-α) mRNA by T cells, which indeed produced less TNF-α protein upon restimulation in vitro (Figures 2E and 2F). Importantly, we also observed reduced T cell proliferation, activation, and IL-2 production upon treatment with DASA-58, another well-characterized PKM2 allosteric activator (Figures S3A–S3C) (Anastasiou et al., 2012). Strikingly, TEPP-46 treatment also enhanced the expression of forkhead box P3 (Foxp3) mRNA in activated unpolarized T cells (Figure S4A). This was associated with a small but significant increase in the percentage of Foxp3+CD25+ cells induced by TEPP-46 (Figure S4B). Importantly, we also observed TEPP-46-dependent induction of Foxp3+CD25+ cells from CD3/CD28-activated naive CD25− T cells, which are depleted of the naturally occurring regulatory T cell (Treg) population (Figures S4C and S4D). Surprisingly, despite inducing Tregs under non-polarizing conditions, TEPP-46 inhibited the generation of Tregs induced by TGF-β in vitro, by blocking the phosphorylation of signal transducer and activator of transcription 5 (Stat5) induced by TGF-β (Figures S4E and S4F). These results suggest that, by inducing PKM2 tetramerization and blocking its nuclear translocation, TEPP-46 inhibits T cell activation and may favor the generation of Tregs under non-polarizing conditions.
Figure 2.

PKM2 Tetramerization Blocks T Cell Activation In Vitro
Murine CD4+CD62+ T cells were stimulated in vitro with CD3/CD28 antibodies in the presence of DMSO (CTRL), TEPP-46 50 μM, or 100 μM.
(A and B) Cells were collected after 24 h of stimulation.
(A) Quantification of Il2 mRNA in activated T cells by qRT-PCR (n = 9 from three independent experiments).
(B) Cells were re-stimulated in vitro with PMA and ionomycin in the presence of brefeldin A. IL-2 production was then evaluated by flow cytometry after intracellular cytokine staining. Left, representative plot showing reduced IL-2 production by TEPP-46-treated cells. Right, quantification of the percentage of IL-2-producing cells and IL-2 mean fluorescence intensity (MFI) in CTRL versus TEPP-46-treated cells (n = 8 from 3 independent experiments).
(C–F) Cells were collected after 3 days of stimulation.
(C) Top, representative flow cytometry plot displaying T cell proliferation assessed as CellTrace violet dilution. Bottom, a division index was calculated with FlowJo software to quantify T cell proliferation (n = 5 from four independent experiments).
(D) Expression of surface CD62L, CD44, and CD25 was evaluated by flow cytometry. The percentage of expressing cells and the MFI are shown (n = 3 from 2 independent experiments).
(E) Quantification of Tnfa mRNA levels in activated T cells by qRT-PCR (n = 6 from 6 independent experiments).
(F) Cells were re-stimulated in vitro with PMA and ionomycin in the presence of brefeldin A. TNF-α production was then evaluated by flow cytometry after intracellular cytokine staining. Left, representative plot showing reduced TNF-α production by TEPP-46 treated cells. Right, quantification of the percentage of TNF-α-producing cells and TNF-α MFI in CTRL versus TEPP-46-treated cells (n = 5 from 2 independent experiments). For all panels, data are the mean ± SD. ∗p < 0.05, ∗∗p < 0.01, ∗∗∗p < 0.001, or ∗∗∗∗p < 0.0001 compared to CTRL condition, by one-way ANOVA with Dunnett's post-hoc test.
TEPP-46 Reduces Myc, HIF-1α, and mTORC1 Signaling and Engagement of Glycolysis in T Cells
To evaluate the overall impact of TEPP-46 treatment on the activation and functionality of CD4+ T cells, we performed global gene expression analysis by RNA sequencing (RNA-seq), comparing TEPP-46-treated T cells to activated CTRL cells and resting T cells. We first observed that treatment with TEPP-46 was associated with a global change in gene expression in T cells, compared to CTRL cells (Figures S5A and S5B). Unbiased analysis confirmed the modulation of T cell activation by TEPP-46, with TEPP-46-treated cells showing an expression profile similar to that of resting cells (Figure S5C). Importantly, TEPP-46 treatment did not induce skewing of T cells to a specific T cell subset and did not favor the development of memory T cells (data not shown). Our data also indicated that TEPP-46 did not induce a global regulatory phenotype in T cells, suggesting that the induction of Foxp3+CD25+ cells observed in the presence of TEPP-46 might not lead to the generation of functional Treg cells (Figure S5D). Notably, unbiased pathway analysis predicted downregulation of key signaling pathways involved in T cell activation by TEPP-46, among which were the Myc, HIF-1α, and the mammalian target of rapamycin (mTOR) pathways (Figure 3A). In accordance, gene expression analysis confirmed that TEPP-46 treatment severely impaired the upregulation of Myc-, HIF-1α-, and mTOR-induced genes in CD4+ T cells upon activation in vitro (Figure 3B).
Figure 3.

PKM2 Tetramerization Limits HIF1-α, Myc, and mTORC1 Signaling and Engagement of Glycolysis in CD4+ T Cells
Murine CD4+ T cells were collected after 72 h of in vitro activation with CD3/CD28 antibodies in the presence of DMSO (CTRL condition) or TEPP-46 100 μM.
(A) Results of unbiased Ingenuity Pathway Analysis predicting downregulation of Myc-, Hif-1-α-, and mTOR-regulated pathways by TEPP-46.
(B) Heatmaps showing expression of Myc-, Hif-1-α-, and mTOR-regulated genes in resting T cells and T cells activated in the presence of DMSO (Th0 Ctrl) or TEPP-46 (Th0 TEPP).
(C) Heatmap showing expression of glycolytic genes in resting, Th0 Ctrl, and Th0 TEPP-46 cells.
(D and E) Cells were tested for their glycolytic capacity and oxygen consumption rate (OCR) on a Seahorse XFe96 Analyzer.
(D) Quantitative analysis of glycolytic rate and glycolytic capacity of CTRL and TEPP-46-treated cells (n = 4 from 2 independent experiments).
(E) Quantitative analysis of basal OCR, maximum respiration and spare respiratory capacity of CTRL and TEPP-46-treated cells (n = 7 from three independent experiments). For (D) and (E), data are the mean ± SD. ∗∗p < 0.01 or ∗∗∗p < 0.001, compared to CTRL condition, by two-tailed unpaired Student’s t test.
As Myc, HIF-1α, and mTOR are essential players in T cell activation and functionality (Geltink et al., 2018), we focused on these pathways, and we confirmed their inhibition in TEPP-46-treated T cells. We first checked for early Myc protein and mRNA expression 24 h after CD3/CD28 stimulation, and we observed a reduction in both Myc protein and mRNA levels following TEPP-46 treatment (Figures S6A and S6B). We then evaluated the functionality of mTOR, in particular the mTORC1 complex, in TEPP-46-treated cells, analyzing the phosphorylation of p70 S6 and p85 S6 kinases, a well-established readout of mTORC1 activity. We found that TEPP-46 treatment led to a strong reduction in the phosphorylation of these proteins 24 h after activation in vitro, suggesting that PKM2 tetramerization might block mTORC1 activity in T cells (Figure S6C). We then observed that TEPP-46-treated murine CD4+ T cells displayed a strongly reduced HIF-1α expression after 3 days of in vitro activation, compared to control cells (Figure S6D). Importantly, TEPP-46 did not affect the levels of Hif1a mRNA (Figure S6E), supporting a role for nuclear PKM2 in HIF-1α stabilization rather than transcription (Luo et al., 2011).
HIF-1α, Myc, and mTORC1 are key regulators of aerobic glycolysis and Warburg-like metabolism in T cells (Geltink et al., 2018). We thus speculated that TEPP-46 might modulate T cell activation by limiting the engagement of glycolysis. We, therefore, analyzed the effect of TEPP-46 on the glycolytic potential of T cells. First, analysis of RNA-seq data and qRT-PCR experiments indicated that TEPP-46 treatment significantly blocked the induction of several glycolytic genes in T cells upon activation, including the glucose transporter Slc2a1 (Glut-1), which controls glucose uptake upon TCR activation and is essential for engagement of aerobic glycolysis in T cells (Figures 3C and S6F) (Geltink et al., 2018, Macintyre et al., 2014). Second, by performing Seahorse analysis, we confirmed that TEPP-46 treatment severely impaired glycolysis in T cells, in terms of both glycolytic rate and glycolytic capacity, while oxygen consumption rate (OCR) in TEPP-46-treated cells was similar to that of CTRL cells, confirming that TEPP-46 treatment specifically affects glycolysis engagement in T cells (Figures 3D and 3E). Overall, these results indicate that induction of PKM2 tetramerization blocks essential signaling pathways necessary for the engagement of aerobic glycolysis, a crucial step for T cell activation and effector functions.
PKM2 Tetramerization Constrains Th17 and Th1 Cell Development
HIF-1α, Myc, and mTORC1 activity and engagement of aerobic glycolysis are necessary for the generation of pro-inflammatory T cell subsets such as Th17 and Th1 cells (Geltink et al., 2018). Therefore, we next evaluated the impact of TEPP-46 treatment on the development of such T cell populations. For this purpose, we polarized resting murine CD4+CD62L+ T cells to Th17 or Th1 phenotypes in the presence of increasing concentrations of TEPP-46. We first confirmed that, as in unpolarized T cells, both Th17 and Th1 cells had increased PKM2 expression upon in vitro activation (Figures S7A and S7B). We next observed that TEPP-46 severely inhibited the generation of Th17 cells in a dose-dependent manner, as revealed by the strongly reduced percentage of IL-17A-producing cells upon TEPP-46 treatment (Figure 4A). In accordance with results obtained in unpolarized cells (Figure 2), TEPP-46 also limited the production of TNF-α by Th17 cells (Figure 4A). The block of Th17 induction was also confirmed at the mRNA level, with TEPP-46 reducing the expression of Tnfa and Th17 subset-specific cytokines Il17a, Il17f, Il21, whereas Il22 was not modulated by the treatment (Figure 4B). Similar results were observed with DASA-58, which blocked Th17 cells development compared to CTRL treatment (Figure S3D). Strikingly, rather than inducing a global downregulation of transcription factors controlling Th17 development, TEPP-46 selectively impacted the expression levels of RAR-related orphan receptor alpha (Rorα; Rora gene), Interferon regulatory factor 4 (Irf4), and Runt-related transcription factor 1 (Runx1) (Figure 4C). mRNA levels of other transcription factors important for Th17 polarization such as RORγt (Rorc gene), aryl hydrocarbon receptor (Ahr), NF-kappa-B inhibitor zeta (Nfkbiz), and basic leucine zipper transcription factor, ATF-like (Batf) were not affected by the treatment (Figure 4C). Notably, PKM2 tetramerization led to a significant induction of Foxp3 mRNA and Foxp3+CD25+ T cells in Th17-polarizing conditions (Figures S7C and S7D), confirming the data obtained with unpolarized cells (Figure S4).
Figure 4.

TEPP-46 Limits Th17 Cell Polarization
Murine CD4+CD62+ T cells were activated in vitro for 3 days with CD3/CD28 antibodies under Th17-polarizing conditions in the presence of DMSO (CTRL condition), TEPP-46 50 μM, or 100 μM.
(A) Flow cytometry evaluation of IL-17A and TNF-α production by Th17 cells after intracellular cytokine staining. Left, representative plots showing reduced IL-17A and TNF-α production by TEPP-46 treated cells. Right, quantification of the percentage of IL-17A/TNF-α-producing cells and of IL-17A/TNF-α MFI in CTRL versus TEPP-46-treated cells (n = 6–9 from 3 independent experiments).
(B and C) Quantification of the mRNA levels of Th17 signature cytokines (B) and transcription factors (C) by qRT-PCR (n = 6–8 from 3–4 independent experiments). For all panels, data are the mean ± SD. ∗p < 0.05, ∗∗p < 0.01, ∗∗∗p < 0.001, or ∗∗∗∗p < 0.0001 compared to CTRL condition, by one-way ANOVA with Dunnett's post-hoc test.
We next analyzed the impact of PKM2 tetramerization on Th1 development. As with Th17 cells, TEPP-46 treatment strongly inhibited the generation of Th1 cells in vitro, reducing the production of IFN-γ and TNF-α at both protein and mRNA levels (Figures 5A and 5B). Similar to Th17 cells, DASA-58 also limited Th1 cell development in vitro (Figure S3E). Somewhat surprisingly, TEPP-46 did not affect the expression of T-box transcription factor TBX21 (T-bet; Tbx21 gene), but strongly reduced the mRNA levels of Eomesodermin (Eomes), a key transcription factor controlling Th1 cell development (Figure 5C) (Yang et al., 2008). Finally, as in unpolarized and Th17 cells, TEPP-46 treatment induced Foxp3 expression and the generation of Foxp3+CD25+ cells also in Th1-polarized cells (Figures S7E and S7F). Overall, these results indicate that PKM2 modulates Th17/Th1 development by controlling the activity of specific transcription factors and demonstrate the potential of PKM2 tetramerization in inducing Treg cells under pro-inflammatory conditions.
Figure 5.

TEPP-46 Constrains Th1 Cell Development
Murine CD4+CD62+ T cells were activated in vitro for 3 days with CD3/CD28 antibodies under Th1-polarizing conditions in the presence of DMSO (CTRL condition) or TEPP-46 50 μM or 100 μM.
(A) Flow cytometry evaluation of IFN-γ and TNF-α production by Th1 cells after intracellular cytokine staining. Left, representative plots showing reduced IFN-γ and TNF-α production by TEPP-46 treated cells. Right, quantification of the percentage of IFN-γ/TNF-α-producing cells and of IFN-γ/TNF-α MFI in CTRL versus TEPP-46-treated cells (n = 5–6 from 4 independent experiments).
(B and C) Quantification of Tnfa/Ifng (B) and Tbx21/Eomes (C) mRNA levels by qPCR (n = 5–6 from 3 independent experiments). For all panels, data are the mean ± SD. ∗∗∗p < 0.001 or ∗∗∗∗p < 0.0001 compared to CTRL condition, by one-way ANOVA with Dunnett's post-hoc test.
TEPP-46 Inhibits the Development of EAE
Given the ability of PKM2 tetramerization to inhibit Th17/Th1 induction with a possible concurrent induction of Tregs in vitro, we tested the therapeutic potential of TEPP-46 in the autoimmune model EAE, in which Th1/Th17-mediated responses are essential for the induction of neuroinflammation (Kipp et al., 2017). We treated EAE mice every other day from day 0 to day +14 post-immunization with 50 mg/kg of TEPP-46 and evaluated disease development. We found that TEPP-46 markedly inhibited the development of EAE, with a significant reduction of the mean clinical score and prevention of weight loss, when compared to vehicle treatment (Figure 6A). This was accompanied by a substantial delay in the day of onset associated with TEPP-46 treatment (Figure 6B). Extending the treatment with TEPP-46 until day +20 post-immunization maintained the protective effect, but the results were not significant, as CTRL mice eventually recovered (data not shown). We then analyze the cellular infiltrates in the central nervous system (CNS; brain and spinal cord) of EAE mice. We first observed a significant reduction in the number of CD45+ cells in the CNS of TEPP-46-treated mice, compared to vehicle-injected mice, suggesting a reduced leukocyte trafficking to the CNS associated with TEPP-46-treatment (Figure 6C). Strikingly, we observed no increase in the percentage of Foxp3+CD25+ T cells in the CNS of TEPP-46-treated animals (Figure 6D), suggesting that in vivo induction of Tregs is unlikely to be the mechanism of EAE inhibition by TEPP-46. However, the percentage of both CD4+IL-17A+ and CD4+IFN-γ+ cells was reduced in the CNS of TEPP-46-treated mice (Figure 6E). Of note, TEPP-46 treatment also reduced the percentage of granulocyte-macrophage colony-stimulating factor (GM-CSF)-producing CD4+ T cells, which are crucial for the development of EAE (Kostic et al., 2018), as well as Ki67+ cells, indicating a lower number of pathogenic and actively proliferating CD4+ T cells in the CNS of TEPP-46-treated mice (Figure 6E). Of note, TEPP-46-treated mice also displayed a reduction in CD8+ cells producing IFN-γ, IL-17A, and GM-CSF in the CNS, suggesting that PKM2 tetramerization may also block CD8+ T cell pathogenic potential (Figure 6E). Overall, our data indicate a global anti-inflammatory effect of TEPP-46 in EAE and confirm the potential of PKM2 tetramerization as a novel therapeutic approach for the treatment of Th17/Th1-mediated pathologies.
Figure 6.

TEPP-46 Inhibits EAE Development
(A and B) C56Bl/6 mice were immunized with MOG35–55 peptide emulsified in complete Freund adjuvant. Mice were treated every other day from day 0 to day +14 post-immunization (red arrows) with vehicle (PBS + 40% cyclodextrin) or TEPP-46 50 mg/kg in vehicle.
(A) Mean clinical score (left) and percentage of weight loss (right) in EAE mice treated with vehicle or TEPP-46.
(B) Mean day of onset in vehicle and TEPP-46-treated EAE mice. N = 14–16 mice per group (A) or 12–16 mice/group (B) from 3 independent experiments.
(C–E) Vehicle- and TEPP-46-treated EAE mice were sacrificed 11 days post-immunization. CNS infiltrates were isolated, stained, and analyzed by flow cytometry as described in the STAR Methods section.
(C) Total number of CD45+ cells in the CNS of vehicle- and TEPP-46-treated EAE mice.
(D) Percentage of Foxp3+CD25+ cells in the CD4+ T cells population isolated from the CNS of EAE mice.
(E) Percentages of IL-17A-, IFN-γ-, and GM-CSF-producing and Ki67+ cells in the CNS CD4+ and CD8+ T populations of vehicle and TEPP-46-treated mice. For (C–E), n = 9–11 from 2 independent experiments.
(F) Transfer EAE was induced in C57BL/6 mice by injection of MOG35–55-primed CD3+ T cells re-stimulated in vitro as described in STAR Methods section. N = 7–9 mice/group from 2 independent experiments. For panels (A) and (F), data are the mean ± standard error of the mean (SEM). For panels (B–E), data are the mean ± SD. p values were calculated by two-tailed unpaired Student’s t test. #p < 0.01, ∗p < 0.05, and ∗∗∗∗p < 0.0001, compared to vehicle condition (A–E) or CTRL cell condition (F).
To confirm that the effect of TEPP-46 in vivo is due to a direct block of T cell pathogenicity, we induced passive-transfer EAE in C56Bl/6 mice. We isolated CD3+ T cells from myelin oligodendrocyte glycoprotein (MOG)35–55-immunized mice, treated them with DMSO (CTRL cells) or TEPP-46 in vitro, and re-stimulated them with CD3− splenocytes in the presence of MOG35–55 and IL-1β/IL-23 cytokines. This protocol induces the generation of MOG35–55-specific, IL-17A/IFN-γ-producing T cells able to induce EAE in C57Bl/6 recipient mice (Raverdeau et al., 2016). Our data indicate that TEPP-46-pre-treated T cells induced a less severe EAE, compared to CTRL cells, in terms of both disease severity and percentage weight loss (Figure 6F). These results confirm that specific inhibition of T cell pathogenicity with TEPP-46 is sufficient to limit the development of T cell-mediated autoimmunity.
Human CD4+ T Cells Upregulate PKM2 upon TCR Stimulation and TEPP-46 Limits Their Activation
We next evaluated PKM2 expression in human CD4+ T cells. Time-dependent PKM2 upregulation was observed in human naïve CD4+ T cells activated with CD3/CD28 antibodies (Figures 7A and 7B). As murine cells, human CD4+ T cells also upregulated PKM1 upon activation, but PKM2 mRNA levels were higher at all time points analyzed (Figures S1D–S1F), confirming a preferential expression of PKM2 over PKM1 in CD4+ T cells. We also detected an increase in Y105 phosphorylation, tetrameric and monomeric/dimeric PKM2 in activated human T cells (Figures 7C and 7D). Human CD4+ T cells activation also led to increased PKM2 S37 phosphorylation as well as PKM2 nuclear accumulation in activated T cells (Figures 7E and 7F). We finally evaluated the impact of PKM2 tetramerization on human CD4+ T cells activation. First, we found that treatment with TEPP-46 limited IL2 mRNA expression and IL-2 production by human T cells 48 h upon CD3/CD28 activation, suggesting an inhibition of early T cell activation (Figures 7G and 7H). TEPP-46 also blocked human CD4+ T cell proliferation and upregulation of CD71, a well-established human T cell activation marker (Figures 7I and 7J), while TNF-α production by activated human cells was not affected (data not shown). Finally, as in murine cells, PKM2 tetramerization induced the generation of FOXP3+CD25highCD127neg human Tregs (Figure 7K). Overall, these results suggest that modulation of PKM2 activity may represent a valuable approach to limit T cell activation in human inflammatory diseases.
Figure 7.

TCR Stimulation Induces PKM2 Upregulation and Nuclear Translocation in Human T Cells, and TEPP-46 Limits Their Activation
Human naive CD4+ T cells were stimulated in vitro for 4 days with CD3/CD28 antibodies and collected at different time points of activation.
(A) Quantification of PKM2 mRNA in resting versus activated human CD4+ T cells by qRT-PCR (n = 5–6 from three independent experiments).
(B) Left, western blot showing upregulation of PKM2 protein in human CD4+ cells following activation. Right, quantification of PKM2 expression by densitometry analysis (n = 3 from 2 independent experiments).
(C) Western blots showing time-dependent increase in PKM2 phosphorylation on Tyr105 in activated human T cells. One representative experiment out of two is shown.
(D) Cells were collected at different time points of activation, crosslinked with DSS, and analyzed for PKM2 expression by western blot. A representative blot showing the upregulation of monomeric/dimeric and tetrameric PKM2 in activated human CD4+ T cells is presented.
(E) Western blots showing time-dependent increase in PKM2 phosphorylation on Ser37 in activated human CD4+ T cells.
(F) Cells were collected at different time points of activation. Nuclear and cytoplasmic fractions were isolated by cell fractionation and analyzed for PKM2 expression by western blot. A representative blot showing accumulation of PKM2 in the nucleus of activated human CD4+ T cells is presented. For (D–F), one representative experiment out of three is shown.
(G–K) Human naïve CD4+ T cells were stimulated in vitro for 48 h (G and H) or 4 days (I–K) with CD3/CD28 antibodies, in the presence of DMSO (CTRL condition) or TEPP-46 100 μM.
(G) Quantification of IL2 mRNA in activated human cells by qRT-PCR (n = 9 from five independent experiments).
(H) IL-2 production evaluated by flow cytometry after intracellular cytokine staining. Left, representative plot showing reduced IL-2 production by TEPP-46 treated cells. Right, quantification of the percentage of IL-2-producing cells and IL-2 MFI in CTRL versus TEPP-46-treated cells (n = 5 from 3 independent experiments).
(I) Human CD4+ T cells proliferation evaluated as in Figure 2C (n = 5 from 2 independent experiments).
(J) Percentage of CD71+ cells (left) and CD71 MFI (right) in CTRL and TEPP-46-treated activated human T cells (n = 7 from three independent experiments).
(K) Percentage of FOXP3+CD25highCD127neg cells in CTRL and TEPP-46-treated activated CD4+ human T cells (n = 8 from 3 independent experiments). For all panels, data are the mean ± SD. ∗p < 0.05, ∗∗p < 0.01, ∗∗∗p < 0.001, or ∗∗∗∗p<0.0001, compared to CTRL condition. p values were calculated by one-way ANOVA with Dunnett's post-hoc test (A) or by two-tailed paired (G) or unpaired (H–K) Student’s t test.
Discussion
The metabolic reprogramming happening in lymphocytes is not a novel concept. Early studies indeed showed engagement of aerobic glycolysis in lymphocytes upon activation, which was characterized by increased expression of glycolytic enzymes that preceded the proliferative phase (Wang et al., 1976, Hume et al., 1978, Marjanovic et al., 1991). Among these, previous work showed that, upon TCR stimulation, T cells upregulate PKM2 expression (Wang et al., 2011, Cao et al., 2014). Furthermore, a study has shown that PKM2 controls T cell activation induced by homocysteine (Lü et al., 2018). However, the possibility of controlling T cell activation by modulating PKM2 activity and isomerization pharmacologically was never investigated thus far, particularly in the context of T cell subsets. In this study, we report that PKM2 is upregulated and accumulates in the nucleus of CD4+ T cells upon TCR engagement. We show that promotion of PKM2 tetramerization and inhibition of PKM2 nuclear translocation by a small molecule pharmacological activator termed TEPP-46 severely impacts T cell activation, constrains the development of pro-inflammatory Th17 and Th1 cells in vitro, and inhibits T cell-mediated neuroinflammation in vivo.
In the present manuscript, we report that both murine and human CD4+ T cells also upregulate the expression of the PKM1 isoform upon activation. However, T cells preferentially express PKM2 over PKM1 both in resting conditions and upon activation, in agreement with data from an early report suggesting a preferential expression of PKM2 over PKM1 in rat thymocytes (Netzker et al., 1992). Nonetheless, PKM1 upregulation upon CD3/CD28 activation is of interest. These results are somewhat surprising, as PKM1 and PKM2 expression is usually inversely correlated in immune cells. In particular, we previously reported that bone marrow-derived macrophages express PKM1 in resting conditions, while upregulating PKM2 and downregulating PKM1 upon lipopolysaccharide (LPS) activation (Palsson-McDermott et al., 2015). Of note, transformed cells preferentially express PKM2 for their anabolic metabolism, and exogenous expression of the PKM1 isoforms is normally associated with a block in tumor growth (Israelsen and Vander Heiden, 2015). For these reasons, we speculate that PKM1 is likely to play a different role than PKM2 during T cell activation. However, further studies are required to shed light on this aspect.
Dimeric PKM2 has been proposed to translocate to the nucleus of proliferating cells, exerting different functions, such as histone phosphorylation and regulation of gene transcription, including control of Myc transcription and interaction with HIF-1α to boost expression of HIF-1α-dependent genes, such as those encoding enzymes involved in glycolysis (Israelsen and Vander Heiden, 2015, Palsson-McDermott et al., 2015, Lunt et al., 2015, Prakasam et al., 2018, Yang et al., 2012b, Gao et al., 2012). Dimeric PKM2 has also been shown to modulate the activity of mTORC1 in transformed cells, via phosphorylation of the mTORC1 inhibitor proline-rich AKT1 substrate 1 (AKT1S1) (He et al., 2016) or by reducing serine synthesis, which was shown to sustain mTORC1 function in proliferating cells (Ye et al., 2012). Our data suggest that PKM2 “moonlighting” activity may control the functionality of HIF-1α, mTORC1, and Myc and the engagement of aerobic glycolysis in TCR-activated CD4+ T cells, which are crucial determinants for their activation and effector functions (Geltink et al., 2018). However, further studies are needed to evaluate if monomeric/dimeric PKM2 directly interact with HIF-1α and mTORC1 or specifically control Myc gene expression in activated T cells. Of note, the levels of PKM2 in the nucleus are low in resting T cells, and previous work indicates that HIF-1α and Myc activity may be controlled by mTORC1 itself (Csibi et al., 2014, Wei et al., 2016, Düvel et al., 2010, Shi et al., 2011). Upregulation and maintenance of high expression levels of HIF-1α and Myc upon CD3/CD28 stimulation might therefore be blocked by inhibition of both the nuclear activity of PKM2 and the inhibitory effect on mTORC1 in the cytoplasm induced by PKM2 tetramerization. These results would explain why TEPP-46 inhibits the induction of glycolysis in T cells, acting to limit expression of glycolytic enzymes and block mTORC1 activity. Interestingly, we found that TEPP-46-treated T cells did not affect OCR in activated T cells, confirming that TEPP-46 specifically impact the engagement of glycolysis in T cells. Of note, while blocking PKM2 translocation into the nucleus and induction of glycolytic gene, TEPP-46 also increases the activity of PKM2 by inducing its tetramerization (Anastasiou et al., 2012). This would likely maintain a constant rate of pyruvate flux into the TCA cycle and may be the reason why OCR is not affected by TEPP-46. Importantly, previous work in transformed cells, as well as in immune cells, suggest that, apart from glycolysis, induction of PKM2 tetramerization or knock down of the PKM2 gene may impact engagement of PPP and nucleotide synthesis as well as lipid metabolism (Palsson-McDermott et al., 2015, Lunt et al., 2015, Lü et al., 2018, Anastasiou et al., 2012). TEPP-46 may therefore have a broader effect on T cell metabolism.
Our work also suggests that while PKM2 tetramerization constrains the development of pro-inflammatory Th17 and Th1 cells, it might favor the generation of Tregs under pro-inflammatory conditions, with a consequent inhibition of autoimmunity in vivo. This is supported by the inhibitory effect we observed in EAE, a well-known Th17/Th1-dependent model of autoimmunity. However, our RNA-seq data did not show induction of a global regulatory phenotype in T cells treated with TEPP-46, suggesting that the small amount of Foxp3+CD25+ T cells induced by TEPP-46 treatment might not be relevant. We also did not observe a significant induction of Foxp3+CD25+ Tregs by TEPP-46 in EAE mice, suggesting that generation of Tregs in vivo is not the main beneficial effect of TEPP-46 on disease development. Of note, previous work showed that inhibition of mTORC1, Myc, and HIF-1α all induce the development of Foxp3+ T cells under inflammatory conditions, mainly by blocking the engagement of glycolysis (Wei et al., 2016, Shi et al., 2011, Dang et al., 2011, Feldhoff et al., 2017). However, other studies have shown that glycolysis and mTORC1/HIF-1α activity could favor the generation of Tregs, especially in vivo (Clambey et al., 2012, Zeng et al., 2013, Wu et al., 2014, Procaccini et al., 2016). Overall, the specific role of glycolysis in Tregs is indeed less clear than in conventional T cells. Considering our results showing that TEPP-46 blocks the induction of Tregs by TGF-β in vitro, further studies are needed to evaluate the importance of PKM2 in Treg generation and functionality. Interestingly, we also observed that PKM2 tetramerization specifically modulated the expression of certain Th17- and Th1-specific transcription factors (Rora, Irf4, Runx1, and Eomes), without affecting other subset signature genes, such as Rorc and Tbx21, under Th17- and Th1-polarizing conditions. HIF-1α and mTOR activity was previously shown to control T helper cell differentiation, but the specific role of such master regulators in the expression of lineage-specific transcription factors is not well understood. For example, previous work suggested that HIF-1α activity directly controls Rorc transcription in Th17 cells (Dang et al., 2011). However, Shi et al. showed that the block in Th17 development in HIF-1α knockout T cells was not caused by downregulation of Rorc expression (Shi et al., 2011). Similarly, lack of mTOR activity was reported to inhibit Th1 and Th17 cell development and induction of Tbet and Rorc under Th1- and Th17-polarizing conditions (Delgoffe et al., 2009), but Chang et al. showed that mTOR activity is essential for Th17 cell development without controlling the expression of Rorc (Chang et al., 2013). Our work suggests that PKM2 tetramerization induces a complex regulation of transcription factor expression in T helper cell subsets, but future studies are required to determine whether PKM2 directly regulates the expression of these transcription factors, or if the observed TEPP-46-mediated effects are indirect through the initial block in glycolysis and Myc/HIF-1α/mTOR signaling.
Our data indicate that PKM2 may modulate the generation of different cell subsets by affecting signal transducer and activator of transcription (STAT) proteins. STATs are essential players in the polarization of pro-inflammatory T cell subsets, with STAT3 being crucial for Th17 development, STAT1/STAT4 controlling Th1 generation and STAT5 regulating induction of Tregs by TGF-β (Seif et al., 2017). Interestingly, Lochmatter and colleagues showed that IL-23, a cytokine important for Th17 polarization, causes PKM2 nuclear translocation with associated increased STAT3 phosphorylation in T cells, although a formal demonstration of direct STAT3 phosphorylation by PKM2 was not provided (Lochmatter et al., 2016). However, dimeric PKM2 was previously reported to translocate to the nucleus of cancer cells, where it could directly phosphorylate STAT3, inducing the expression of STAT3-dependent genes (Gao et al., 2012). Moreover, a recent study linked PKM2 to STAT1 in bone marrow-derived macrophages, suggesting that PKM2 may also regulate STAT1 activity (Deng et al., 2018). Finally, nuclear PKM2 was shown to regulate STAT5 activity in cancer cells (Park et al., 2016). Of note, while PKM2 protein kinase activity was previously questioned (Hosios et al., 2015), a recent work demonstrated that PKM2 could phosphorylate protein substrates, confirming the potential of such an enzyme to regulate protein functions by post-transcriptional phosphorylation (He et al., 2016). In this paper, we demonstrate that PKM2 may control STAT5 phosphorylation induced by TFG-β and the generation of Tregs in vitro. Whether this is due to direct phosphorylation of STAT5 by monomeric/dimeric PKM2 remains to be determined. However, we did not observe any effect of TEPP-46 on the phosphorylation of STAT3 in Th17 cells or STAT1 in Th1 cells (data not shown). Interestingly, preliminary results suggest that TEPP-46 reduces STAT4 expression, and consequently the amount of phosphorylated STAT4, in Th1-polarized cells (data not shown), and we are currently investigating the basis of STAT4 regulation by PKM2 in such a T cell subset.
In conclusion, our work demonstrates that impacting the moonlighting activity of PKM2 may represent a valuable approach to limit T cell activation and pathogenicity. Inhibition of aerobic glycolysis was previously shown to limit Th17 generation and development of T cell-mediated autoimmunity in mouse models and human disease (Shi et al., 2011, Bian et al., 2009, Gerriets et al., 2015, Kornberg et al., 2018), and our paper supports the idea that modulation of T cell intracellular metabolism represents a valuable therapeutic approach in inflammation. Notably, during the revision process of the present manuscript, Kono et al. supported a role for PKM2 in the generation of Th1 and Th17 cells, with blocking or knock down of PKM2 in T cells limiting Th1/Th17 development and being beneficial in EAE (Kono et al., 2019). Given our previous report showing inhibition of inflammatory macrophage activation by TEPP-46 (Palsson-McDermott et al., 2015), we propose that induction of PKM2 tetramerization by small molecule activators may have therapeutic utility in inflammatory pathologies and autoimmune disease.
Limitations of Study
Our study suggests that PKM2 moonlighting functions control CD4+ T cell activation and development of Th17 and Th1 cells both in vitro and in vivo. Additional studies should focus on which precise functions of PKM2 are involved here, such as effects in the nucleus or protein kinase activity, and further analysis of the role played by metabolic alterations. To further confirm a role for PKM2 in T cell activation and pathogenicity, the effect of PKM2 genetic deletion on T cell functionality, which has previously been shown to inhibit IFN-γ production and Th17 development in different settings (Lü et al., 2018, Kono et al., 2019), should be analyzed in both murine and human CD4+ T cells. Such analyses will further confirm the role of PKM2 in CD4+ T cell function in health and disease.
STAR★Methods
Key Resources Table
| REAGENT or RESOURCE | SOURCE | IDENTIFIER |
|---|---|---|
| Antibodies | ||
| hamster anti-mouse CD3 (clone 145-2C11) | BD Biosciences | Cat #: 553057; RRID:AB_394590 |
| hamster anti-mouse CD28 (clone 37.51) | Tonbo Biosciences | Cat #: 70-0281; RRID:AB_2621492 |
| rat anti-mouse IL-4 (clone 11B11) | BD Biosciences | Cat #: 554432; RRID:AB_395388 |
| rat anti-mouse IFN-γ (clone XMG1.2) | BD Biosciences | Cat #: 554408; RRID:AB_395373 |
| rat anti-mouse CD62L-PE (clone MEL-14), eBioscience | Invitrogen | Cat #: 12-0621-92 |
| rat anti-mouse CD44-PE/Cy5 (clone IM7), eBioscience | Invitrogen | Cat #: 15-0441-82; RRID:AB_468749 |
| rat anti-mouse CD25-APC/Cy7 (clone PC61) | BioLegend | Cat #: 102025; RRID:AB_830744 |
| rat anti-mouse Foxp3-Alexa488 (clone R16-715) | BD Biosciences | Cat #: 563487; RRID:AB_2738236 |
| rat anti-mouse IL2-FITC (clone JES6-5H4) | BioLegend | Cat #: 503805; RRID:AB_315299 |
| rat anti-mouse IL17A-PE (clone TC11-18H10.1) | BioLegend | Cat #: 506904; RRID:AB_315464 |
| rat anti-mouse TNF-α-APC/Cy7 (clone MP6-XT22) | BioLegend | Cat #: 506344; RRID:AB_2565953 |
| rat anti-mouse IFN-γAPC (clone XMG1.2) | BioLegend | Cat #: 505810; RRID:AB_315404 |
| mouse anti-human CD3 (clone UCHT1) | BD Biosciences | Cat #: 555329; RRID:AB_395736 |
| mouse anti-human CD28 (clone CD28.2) | BD Biosciences | Cat #: 555725; RRID:AB_396068 |
| rat anti-human CD4-APC (clone A161A1) | BioLegend | Cat #: 357407; RRID:AB_2565659 |
| mouse anti-human IL2-FITC (clone MQ1-17H12) | BioLegend | Cat #: 500305; RRID:AB_315092 |
| mouse anti-human TNF-α-APC/Cy7 (clone MAb11) | BioLegend | Cat #: 502943; RRID:AB_2562869 |
| mouse anti-human CD71-PE (clone CY1G4) | BioLegend | Cat #: 334105; RRID:AB_2271603 |
| mouse anti-human CD127-APC/Cy7 (clone A019D5) | BioLegend | Cat #: 351347; RRID:AB_2629571 |
| mouse anti-human CD25-Alexa488 (clone BC96) | BioLegend | Cat #: 302615; RRID:AB_493044 |
| mouse anti-human Foxp3-BV421 (clone 206D) | BioLegend | Cat #: 320123; RRID:AB_2561338 |
| rat anti-mouse CD45-Brilliant Violet 785 (clone 30-F11) | BioLegend | Cat #: 103149; RRID:AB_2564590 |
| rat anti-mouse CD4-APC-eFluor780 (clone RM4-5), eBioscience | Invitrogen | Cat #: 47-0042; RRID:AB_1272183 |
| rat anti-CD8a-PeCy7 (clone 53-6.7), eBioscience | Invitrogen | Cat #: 25-0081; RRID:AB_469584 |
| hamster anti-mouse TCR gamma/delta PerCP-eFluor 710 (clone eBioGL3), eBioscience | Invitrogen | Cat #: 46-5711; RRID:AB_2016638 |
| rat anti-IL-17A-FITC (clone eBio17B7), eBioscience | Invitrogen | Cat #: 11-7177; RRID:AB_763581 |
| rat anti-mouse GM-CSF-PE (clone MP1-22E9), eBioscience | Invitrogen | Cat #: 12-7331; RRID:AB_466203 |
| rat anti-mouse CD25-Brilliant Violet 605 (clone PC61) | BioLegend | Cat #: 102036; RRID:AB_2563059 |
| rat anti-mouse IFN-γ- Brilliant Violet 711 (clone XMG1.2) | BioLegend | Cat #: 505835; RRID:AB_11219588 |
| rat anti-Ki67-eFluor450 (clone SolA15), eBioscience | Invitrogen | Cat #: 48-5698; RRID:AB_11149124 |
| rat anti-Foxp3-APC (clone FJK-16s), eBioscience | Invitrogen | Cat #: 17-5773; RRID:AB_469457 |
| monoclonal rabbit anti-histone 3 (clone D1H2) | Cell Signaling Technology | Cat #: 4499; RRID:AB_10544537 |
| monoclonal mouse anti-β-actin (clone AC-74) | Sigma Aldrich | Cat #: A5316; RRID:AB_476743 |
| monoclonal rabbit anti-PKM1 (clone D30G6) | Cell Signaling Technology | Cat #: 7067; RRID:AB_2715534 |
| monoclonal rabbit anti-PKM2 (clone D78A4) | Cell Signaling Technology | Cat #: 4053; RRID:AB_1904096 |
| polyclonal rabbit anti-alpha tubulin | Cell Signaling Technology | Cat #: 2144; RRID:AB_2210548 |
| polyclonal rabbit anti-c-Myc | Cell Signaling Technology | Cat #: 9402; RRID:AB_2151827 |
| polyclonal rabbit anti-phospho-p70 S6 Kinase (Thr389) | Cell Signaling Technology | Cat #: 9205; RRID:AB_330944 |
| monoclonal rabbit anti-Hif-1α (clone D2U3T) | Cell Signaling Technology | Cat #: 14179; RRID:AB_2622225 |
| polyclonal rabbit anti-phospho-PKM2 (Tyr105) | Cell Signaling Technology | Cat #: 3827; RRID:AB_1950369 |
| polyclonal rabbit anti-phospho-PKM2 (Ser37) | Biorbyt | Cat #: orb336828 |
| monoclonal rabbit anti-Stat5 (clone D206Y) | Cell Signaling Technology | Cat #: 94205; RRID:AB_2737403 |
| monoclonal rabbit anti-phospho-Stat5 (Tyr694) (clone D47E7) | Cell Signaling Technology | Cat #: 4322; RRID:AB_10544692 |
| Biological Samples | ||
| Blood samples from healthy donors | School of Biochemistry and Immunology, TCD | N/A |
| Chemicals, Peptides, and Recombinant Proteins | ||
| CD62L MicroBeads, mouse | Miltenyi Biotec | Cat #: 130-049-701 |
| Mouse IL-12 | Miltenyi Biotec | Cat #: 130-096-708 |
| Recombinant Mouse IL-23 (carrier-free) | BioLegend | Cat #: 589002; RRID:AB_10663413 |
| Recombinant Human TGF-β1 | ImmunoTools | Cat #: 1134316 |
| Recombinant Murine IL-1β | ImmunoTools | Cat #: 1234001 |
| Recombinant Murine IL-6 | ImmunoTools | Cat #: 1234006 |
| TEPP-46 | National Center for Advancing Translational Sciences (NIH; Bethesda, Maryland, USA) | CAS: 1221186-53-3 |
| DASA-58 | Cayman Chemical | Cat #: 13941; CAS: 1203494-49-8 |
| DSS | Thermo Scientific | Cat #: 21655; CAS: 68528-80-3 |
| WesternBright ECL | Advansta | Cat #: K-12049-D50 |
| Propidium Iodide | Invitrogen | Cat #: P1304MP; CAS: 25535-16-4 |
| Pacific Blue™ Annexin V | BioLegend | Cat #: 640918 |
| PMA | Sigma Aldrich | Cat #: P8139; CAS:16561-29-8 |
| Ionomycin | Sigma Aldrich | Cat #: I0634; CAS: 56092-82-1 |
| Brefeldin A | Sigma Aldrich | Cat #: B7651; CAS: 20350-15-6 |
| Fixation Buffer | BioLegend | Cat #: 420801 |
| Intracellular Staining Permeabilization Wash Buffer (10X) | BioLegend | Cat #: 421002 |
| Seahorse XF Medium | Agilent | Cat #: 103575 |
| Cell-Tak | Corning | Cat #: 354240 |
| Olgomycin | Sigma Aldrich | Cat #: 495455; CAS: 1404-19-9 |
| 2-deoxy-d-glucose | Sigma Aldrich | Cat #: D3179; CAS: 154-17-6 |
| FCCP | Sigma Aldrich | Cat #: C2759; CAS: 555-60-2 |
| Antimycin A | Sigma Aldrich | Cat #: A8674; CAS: 1397-94-0 |
| Rotenone | Sigma Aldrich | Cat #: R8875; CAS: 83-79-4 |
| MOG35-55 | GenScript | Cat #: RP10245; CAS: 163913-87-9 |
| Complete Freund Adjuvant | Chondrex | Cat #: 7001 |
| Pertussis toxin | Kaketsuken | N/A |
| (2-Hydroxypropyl)-β-cyclodextrin | Sigma Aldrich | Cat #: H107; CAS: 128446-35-5 |
| Protein Transport Inhibitor (BD GolgiStop) | BD Biosciences | Cat #: 554724 |
| Purified Rat Anti-Mouse CD16/CD32 (Mouse BD Fc Block™) | BD Biosciences | Cat #: 553141; RRID:AB_394656 |
| Critical Commercial Assays | ||
| CD4+ T Cell Isolation Kit, mouse | Miltenyi Biotec | Cat #: 130-104-454 |
| Naive CD4+ T Cell Isolation Kit, mouse | Miltenyi Biotec | Cat #: 130-104-453 |
| Naive CD4+ T Cell Isolation Kit II, human | Miltenyi Biotec | Cat #: 130-094-131 |
| Pan T Cell Isolation Kit II, mouse | Miltenyi Biotec | Cat #: 130-095-130 |
| Seahorse XFe96 FluxPak | Agilent | Cat #: 102416–100 |
| PARIS Kit | Invitrogen | Cat #: AM1921 |
| PureLink RNA Mini Kit | Invitrogen | Cat #: 12183025 |
| High-Capacity cDNA Reverse Transcription Kit | Applied Biosystems | Cat #: 4368814 |
| PowerUp SYBR Green Master Mix | Applied Biosystems | Cat #: A25743 |
| CellTrace Violet Cell Proliferation Kit | Invitrogen | Cat #: C34571 |
| eBioscience Foxp3 / Transcription Factor Staining Buffer Set | Invitrogen | Cat #: 00-5523-00 |
| LIVE/DEAD Fixable Aqua Dead Cell Stain Kit | Invitrogen | Cat #: L34965 |
| Pierce™ BCA Protein Assay Kit | Thermo Scientific | Cat #: 23227 |
| NEBNext Single Cell/Low Input RNA Library Prep Kit for Illumina | New England BioLabs | Cat #: E6420 |
| Deposited Data | ||
| RNA sequencing data | This paper | GEO: GSE139378 |
| Experimental Models: Organisms/Strains | ||
| Mouse: C57BL/6JOlaHsd | Harlan UK | N/A |
| Oligonucleotides | ||
| mouse Tbp FWD: CCGTGAATCTTGGCTGTAAAC mouse Tbp REV: TGTCCGTGGCTCTCTTATTC |
Eurofins Genomics | N/A |
| mouse Pkm1 FWD: TGTCTGGAGAAACAGCCAAG mouse Pkm1 REV: CTCGCACAAGCTCTTCAAAC |
Eurofins Genomics | N/A |
| mouse Pkm2 FWD: TGTCTGGAGAAACAGCCAAG mouse Pkm2 REV: CGAATAGCTGCAAGTGGTAGA |
Eurofins Genomics | N/A |
| mouse Il2 FWD: AGATGAACTTGGACCTCTGCG mouse Il2 REV: AAAGTCCACCACAGTTGCTG |
Eurofins Genomics | N/A |
| mouse Tnfa FWD: GCCTCTTCTCATTCCTGCTT mouse Tnfa REV: TGGGAACTTCTCATCCCTTTG |
Eurofins Genomics | N/A |
| mouse Foxp3 FWD: TTTCACCTATGCCACCCTTATC mouse Foxp3 REV: GTAGGCGAACATGCGAGTAA |
Eurofins Genomics | N/A |
| mouse Hif1a FWD: GGGTACAAGAAACCACCCAT mouse Hif1a REV: GAGGCTGTGTCGACTGAGAA |
Eurofins Genomics | N/A |
| mouse Myc FWD: TTGAAGGCTGGATTTCCTTTGGGC mouse Myc REV: TCGTCGCAGATGAAATAGGGCTGT |
Eurofins Genomics | N/A |
| mouse Slc2a1 FWD: GATCACTGCAGTTCGGCTATAA mouse Slc2a1 REV: GTAGCGGTGGTTCCATGTT |
Eurofins Genomics | N/A |
| mouse Gapdh FWD: TGGTGAAGGTCGGTGTGAAC mouse Gapdh REV: TGAATTTGCCGTGAGTGGAG |
Eurofins Genomics | N/A |
| mouse Ldha FWD: CGTCTCCCTGAAGTCTCTTAAC mouse Ldha REV: TTCAGCTTGATCACCTCGTAG |
Eurofins Genomics | N/A |
| mouse Hk FWD: TCGCCTGCTTATTCACGGAG mouse Hk REV: CCATCCGGAGTTGACCTCAC |
Eurofins Genomics | N/A |
| mouse Pfkm FWD: GTTTGGAAGCCTCTCCTCCTC mouse Pfkm FWD: AGAGGTCAACACGGCGATG |
Eurofins Genomics | N/A |
| mouse Il17a FWD: CAAACATGAGTCCAGGGAGAG mouse Il17a REV: GCTGAGCTTTGAGGGATGAT |
Eurofins Genomics | N/A |
| mouse Il17f FWD: TCCCACGTGAATTCCAGAAC mouse Il17f REV: GTTCATGGTGCTGTCTTCCT |
Eurofins Genomics | N/A |
| mouse Il21 FWD: CGCCTCCTGATTAGACTTCG mouse Il21 REV: GCCCCTTTACATCTTGTGGA |
Eurofins Genomics | N/A |
| mouse Il22 FWD: TCATCGGGGAGAAACTGTTC mouse Il22 REV: TTCCAGGGTGAAGTTGAGCA |
Eurofins Genomics | N/A |
| mouse Rora FWD: GAACACCTTGCCCAGAACAT mouse Rora REV: AGCTGCCACATCACCTCTCT |
Eurofins Genomics | N/A |
| mouse Runx1 FWD: TACCTGGGATCCATCACCTC mouse Runx1 REV: GACGGCAGAGTAGGGAACTG |
Eurofins Genomics | N/A |
| mouse Irf4 FWD: GCAGCTCACTTTGGATGACA mouse Irf4 REV: CCAAACGTCACAGGACATTG |
Eurofins Genomics | N/A |
| mouse Rorc FWD: TGCAAGACTCATCGACAAGGC mouse Rorc REV: AGCTTTTCCACATGTTGGCTG |
Eurofins Genomics | N/A |
| mouse Ahr FWD: AGGTGCCTGCTGGATAATTC mouse Ahr REV: CCGTCCTTCCCTTTCTTGTT |
Eurofins Genomics | N/A |
| mouse Nzkbiz FWD: GCAGGTAGAGCAGGAAGAAA mouse Nzkbiz REV: CCTTGGGCAACAGCAATATG |
Eurofins Genomics | N/A |
| mouse Batf FWD: CCAGAAGAGCCGACAGAGAC mouse Batf REV: GAGCTGCGTTCTGTTTCTCC |
Eurofins Genomics | N/A |
| mouse Ifng FWD: CTCTTCTTGGATATCTGGAGGAAC mouse Ifng REV: GACTTCAAAGAGTCTGAGGTAGAA |
Eurofins Genomics | N/A |
| mouse Tbx21 FWD: CAACAACCCCTTTGCCAAAG mouse Tbx21 REV: TCCCCCAAGCAGTTGACAGT |
Eurofins Genomics | N/A |
| mouse Eomes FWD: ACCAATAACAAAGGTGCAAACAAC mouse Eomes REV: TGGTATTTGTGCAGAGACTGCAA |
Eurofins Genomics | N/A |
| human RPS13 FWD: CGAAAGCATCTTGAGAGGAAC human RPS13 REV: TCGAGCCAAACGGTGAATC |
Eurofins Genomics | N/A |
| human PKM1 FWD: TCACTCCACAGACCTCATGG human PKM1 REV: GAAGATGCCACGGTACAGGT |
Eurofins Genomics | N/A |
| human PKM2 FWD: ATCGTCCTCACCAAGTCTGG human PKM2 REV: GAAGATGCCACGGTACAGGT |
Eurofins Genomics | N/A |
| human IL2 FWD: CCCAGGGACTTAATCAGCAATA human IL2 REV: TGCTGTCTCATCAGCATATTCA |
Eurofins Genomics | N/A |
| Software and Algorithms | ||
| Image Lab (Version 5.0) | Bio-Rad | https://www.bio-rad.com/en-uk/product/image-lab-software?ID=KRE6P5E8Z |
| FlowJo (version 10.5.3) | FlowJO | https://www.flowjo.com/solutions/flowjo |
| Seahorse Wave Controller Software (version 2.4.2) | Agilent | https://www.agilent.com/en/products/cell-analysis/cell-analysis-software/instrument-software/wave-controller-2-4 |
| Prism (version 8.2.0) | GraphPad | https://www.graphpad.com/scientific-software/prism/ |
| SnakePipes (version 1.2.0) | Bhardwaj et al., 2019 | N/A |
| DESeq2 R | Love et al., 2014 | N/A |
| Ingenuity Pathway Analysis | Qiagen | https://www.qiagenbioinformatics.com/products/ingenuity-pathway-analysis/ |
| Morpheus | Broad Institute, Cambridge, MA, (USA) | https://software.broadinstitute.org/morpheus/ |
Lead Contact and Materials Availability
This study did not generate new unique reagents. We are glad to share the commercially available reagents used in this study with reasonable compensation by requestor for their processing and shipping. Further information and requests for resources and reagents should be directed to and will be fulfilled by the Lead Contact, Stefano Angiari (angiaris@tcd.ie).
Experimental Model and Subject Details
Mice
6-8 weeks old C57Bl/6J female mice (Harlan UK) were used to isolate murine T cells and for EAE experiments. Mice were bred and housed in the Comparative Medicine Unit (CMU) in Trinity Biomedical Sciences Institute (TBSI) (Trinity College Dublin, TCD, Ireland), and maintained under specific pathogen free conditions according to FELASA guidelines (Mähler Convenor et al., 2014). All the procedures involving experiments on animals have been approved by the Health Products Regulatory Authority (HPRA, Ireland), and were conducted according to Directive 2010/63/EU of the European Parliament and Council on the protection of animals used for scientific purposes. Before each experiment, mice were randomly assigned to control or treatment group. No sample-size estimation was performed before experimentation.
Human Samples
Human blood samples from healthy donors were collected and processed at the School of Biochemistry and Immunology in TBSI (TCD, Ireland). Blood samples have been obtained anonymously and written informed consent for the use of blood for research purposes has been obtained from the donors. All the procedures involving experiments on human samples have been approved by the School of Biochemistry and Immunology Research Ethics Committee (TCD). Experiments were conducted according to the TCD guide on good research practice, which follows the guidelines detailed in the National Institutes of Health Belmont Report (1978) and the Helsinki Declaration (revised 2013).
Method Details
Cell Isolation and Cultures
Murine CD4+ T cells were obtained from total mouse splenocytes by magnetic cells sorting with the CD4+ T Cell Isolation Kit, followed by incubation with CD62L microbeads and isolation of CD4+CD62L+ resting T cells, following manufacturer's instructions (all reagents from Miltenyi Biotech). In some experiments, naïve CD4+ murine T cells were isolated from total splenocytes by magnetic cell sorting with the Naive CD4+ T Cell Isolation Kit (Miltenyi Biotech). For human samples, peripheral blood mononuclear cells (PBMCs) were isolated from whole blood by density centrifugation in Lymphoprep (StemCell Technologies). Naïve CD4+ T cells were then obtained from PBMCs by magnetic cell sorting with the Naïve CD4+ T Cell Isolation Kit II, according to manufacturer's instructions (Miltenyi Biotech). Cells were stimulated in vitro with plate-bound anti-CD3 and anti-CD28 antibodies (1 μg/ml and 2 μg/ml, respectively) in RPMI 1640 containing L-glutamine (Gibco), supplemented with 10% heat-inactivated fetal bovine serum (Sigma-Aldrich), 55 μm 2-mercaptoethanol (Gibco) and 100 U/ml penicillin/streptomycin (Sigma-Aldrich). To generate murine T cell subsets, cells were activated in the presence of the following cytokines and antibodies: for Th1 cells, 20 ng/ml IL-12 and 5 μg/ml anti-mouse IL-4 antibody; for Th17 cells, 0.5 ng/ml TGF-β, 50 ng/ml IL-6, 10 ng/ml IL-23, 10 ng/ml IL-1β, 5 μg/ml anti-mouse IFN-γ antibody and 5 μg/ml anti-mouse IL-4 antibody; for Tregs, 5 ng/ml TGF-β. Antibodies were purchased from BD Biosciences, while cytokines were purchased from Miltenyi Biotech, Immunotools or BioLegend. For PKM2 tetramerisation experiments, TEPP-46 and DASA-58 (Cayman Chemical) were dissolved at a concentration of 100 mM in dimethyl sulfoxide (DMSO) and stored at -20°C until use. Cells were pre-incubated at 37°C for 15 min with TEPP-46 or DASA-58 25 μm, 50 μm or 100 μm or equal amounts of DMSO (control condition) before CD3/CD28 activation.
Nuclear Extraction, PKM2 Crosslinking, and Western Blotting
For standard western blot protocols, cultured cells were collected and lysed in 5× Laemmli Sample Buffer, followed by heating at 95°C for 5 min. For nuclear extraction experiments, nuclear and cytoplasmic fractions were isolated from cultured cells by cell fractionation using the PARISTkit (Invitrogen), following manufacturer's instructions. Protein concentration was measured using the Pierce BCA protein assay (Thermo Scientific) and normalised across samples prior to loading on SDS-PAGE gels for western blotting. For PKM2 crosslinking experiments, cells were collected, washed twice with phosphate buffered saline (PBS) pH 8.0 and incubated in PBS pH 8.0 + 1 μM disuccinimidyl suberate (DSS; Thermo Scientific) for 30 min at 37°C. Cells were then washed, lysed in 5× Laemmli Sample Buffer, and boiled for 5 min at 95 °C before loading. Protein samples were resolved on SDS-PAGE gels and transferred onto a polyvinylidene difluoride (PVDF) membrane via wet transfer. Membranes were probed with primary antibodies at a 1:1000 dilution and secondary HRP-conjugated antibodies at a 1:2000 dilution. Membranes were visualised using WesternBright ECL HRP substrate (Advansta) on a GelDoc system (Bio-Rad). Images were analysed with the Image Lab software (Bio-Rad). Histone H3 or β-actin were used as reference housekeeping genes.
Quantitative Real-Time PCR (qRT-PCR)
RNA was isolated using the Purelink RNA Mini kit (Invitrogen), according to manufacturer's instructions. RNA was converted to cDNA using the High Capacity cDNA Reverse Transcription Kit (Applied Biosystems), and gene expression was determined by qRT-PCR using the PowerUp SYBR Green Master on a 7500 Fast thermocycler (Applied Biosystems). For murine cells, gene expression was normalised to the reference housekeeping gene TATA-binding protein (Tbp), while for human cells gene expression was normalised to ribosomal protein S13 (RPS13). All primers were purchased from Eurofins Genomics.
Flow Cytometry
All flow cytometry analyses were performed after 3 days (72 hours; murine cells) or 4 days (96 hours; human cells) post-activation, apart from evaluation of early IL-2 production, which was analysed at 24 hours (murine cells) and 48 hours (human cells) post-activation. All antibodies for flow cytometry staining were used at 1:200 dilution. To determine TEPP-46 toxicity, cells were stained with propidium iodide (PI; Invitrogen) and Pacific Blue-conjugated annexin V (AV; BioLegend). Cells were then gated as live (PI-AV-), apoptotic (PI-AV+) or necrotic/dead cells (PI+AV+). For analysis of cell proliferation, cells were pre-stained with fluorescent CellTrace Violet (CTV; Invitrogen) before activation, according to manufacturer's instructions. Cell proliferation was evaluated as CTV dilution as previously described (Hawkins et al., 2007). To evaluate T cell activation, cells were collected, washed and stained with anti-mouse CD62L, CD44 and CD25 antibodies (murine cells) or anti-human CD71 antibody (human cells). For intracellular cytokine staining, cells were collected, washed and re-stimulated with 50 ng/ml phorbol 12-myristate 13-acetate (PMA) + 1 μg/ml ionomycin + 10 μg/ml brefeldin A (all from Sigma Aldrich). After 4 hours, cells were washed, fixed/permeabilised with fixation and permeabilisation buffers (BioLegend) and stained with anti-mouse IL-2, IFN-γ, IL-17A and/or TNF-α (mouse cells) or anti-human TNF-α or IL-2. For Treg detection, cells were first stained with anti-mouse CD25 (mouse cells) or anti-human CD127 and CD25 antibodies (human cells). Cells were then fixed/permeabilised with Foxp3/Transcription Factor Staining Buffer Set (Invitrogen) and incubated with anti-mouse or anti-human Foxp3 antibodies. All samples were analysed on a FACS Canto II Cell analyser (BD Biosciences). Analysis of acquired data was performed with the FlowJo software (FlowJo LLC). Antibodies were purchased from BD Biosciences, Invitrogen or BioLegend.
RNA Sequencing and Transcriptomics Analysis
Total RNA was quantified using Qubit 2.0 (Thermo Fisher Scientific). Libraries were prepared using the NEBNext Single Cell/Low Input RNA Library Prep Kit for Illumina (New England BioLabs) and sequenced using the HiSeq 3000 (Illumina) by the Deep Sequencing Facility at the Max Planck Institute of Immunobiology and Epigenetics (Freiburg, Germany). The quality of raw and trimmed Fastq reads was checked using FastQC (Illumina). Trimming of raw data was performed using the Cutadapt tool. STAR aligner (Dobin et al., 2013) was used to create BAM files, followed by gene-level quantification using featureCounts (Liao et al., 2014). This contains the gene-level counts, on the filtered GTF files, which were used for differential expression analysis. Gene-level differential expression analysis was then performed in R (Lucent Technologies) using the DESeq2 R package (Love et al., 2014). Principal component analysis plots were generated using in-house Rscripts. Unbiased pathway analysis was performed using Ingenuity Pathway Analysis (Qiagen). Only genes with calculated differential expression changes of >±1-fold change in TEPP-46-treated versus Th0 control samples and adjusted p value<0.05 were considered for pathway analysis. To generate heat maps of specific gene sets, the software Morpheus was used (Broad Institute). Gene lists were obtained from the publically available Geneset Enrichment Analysis (GSEA) database (Broad Institute) and other publications listed, and fold change gene expression of these gene sets were quantified in TEPP-46-treated Th0 versus control Th0 RNAseq data. Only genes with differential expression changes of >±1-fold change in TEPP-46-treated versus control samples and adjusted p value<0.05 were included in heat maps, which display raw read count values. HIF1A gene list was obtained from GSEA set M12299 “SEMENZA_HIF1_TARGETS”. MYC gene list was obtained from GSEA set M5928 “HALLMARK_MYC_TARGETS_V2”. MTOR gene list was obtained from GSEA set “M16563 BIOCARTA_MTOR_PATHWAY”; this heat map shows all statistically significant changed genes in this set. Glycolysis gene list was obtained from GSEA set M5937 “HALLMARK_GLYCOLYSIS”. T cell activation gene list was obtained from Panther Pathways accession P00053. Treg signature gene list was obtained by a detailed analysis of multiple peer-reviewed publications and publicly available gene sets from GSEA.
Analysis of ECAR and OCR with the Seahorse XF Platform
To evaluate extracellular acidification rate (ECAR) and OCR, 150,000 cells (ECAR assay) or 200,000 cells (OCR assay) in XF medium (Agilent) were seeded in a 96-well XF Cell Culture Microplate (Agilent) pre-coated with Cell-Tak™ (Corning). Cells were left to adhere for one hours at 37°C in the absence of CO2. ECAR was then measured on a Seahorse XF Analyser (Agilent) in basal conditions and upon the sequential addition of glucose (20 mM), oligomycin (1 μM), and 2-deoxyglucose (2-DG; 50 mM) (all from Sigma Aldrich), to determine the glycolytic rate and the glycolytic capacity of tested cells. OCR was measured in basal conditions and upon the sequential addition of oligomycin (1 μM), carbonyl cyanide-4-(trifluoromethoxy)phenylhydrazone (FCCP; 1 μM), and rotenone/antimycin A (both at 0.5 μM) (all from Sigma Aldrich), to determine maximum respiration and spare respiratory capacity of tested cells.
Induction and Assessment of Active EAE
EAE was induced in 6–8 weeks old C57BL/6 female mice by subcutaneous immunization with 150 μg MOG35–55 peptide (GenScript) emulsified in complete Freund's adjuvant (CFA; Condrex) containing 4 mg/ml heat-killed Mycobacterium tuberculosis. Mice were injected intraperitoneally (i.p.) with 200 ng pertussis toxin (Kaketsuken) on day 0 and +2 post-immunisation. For TEPP-46 treatment, mice were injected i.p. every other day from day 0 to day +14 post-immunisation with 200-μl vehicle (PBS + 40% cyclodextrin; Sigma-Aldrich) or 50 mg/kg TEPP-46 dissolved in vehicle. Mice were daily weighed and disease score was daily evaluated blinded as previously described (Sutton et al., 2017). In some experiments, EAE mice were sacrificed 11 days post-immunisation and perfused with 20 ml PBS. The central nervous system (CNS; brain and spinal cord) was then removed. CNS was lysed in RPMI containing brefeldin A (5 μg/ml) using a tissue lyser (Qiagen). CNS tissue homogenates were then re-suspended in 8 ml 40% isotonic Percoll before centrifugation at 1600 rpm for 20 min. Myelin debris was carefully removed, and CNS mononuclear cells were then passed through a 70 μm filter, washed, re-suspended in RPMI and stimulated with PMA (10 ng/ml), ionomycin (1 μg/ml), monensin (BD Golgistop, 1:1000; BD Biosciences) and brefeldin A (2 μg/ml) for 2 hours at 37°C. Cells were washed and incubated with live/dead stain (LIVE/DEAD Fixable Aqua Dead Cell Stain Kit: Life Technologies) for 20 min, followed by 10-min incubation with Fcγ block (BD Biosciences). Cells were then stained for 20 min with anti-mouse CD45, CD4, CD8α, TCRδ and CD25. Cells were then washed, fixed and permeabilised with the Foxp3/Transcription Factor Staining buffer Kit, and stained with antibodies specific for IL-17A, GM-CSF, IFN-γ, Foxp3 and Ki67. Cells were finally acquired using an LSRFortessa flow cytometer (BD Biosciences). Analysis of acquired data was performed with the FlowJo software. Analysis of stained population was performed by gating on single, live, CD45+ cells. All antibodies were used at 1:200 dilution.
Induction of Transfer EAE in C57BL/6 Mice
6–8 weeks old C57BL/6 female mice were immunised as above with MOG35–55 in CFA (no pertussis toxin injections). After 7 days, lymph nodes and spleen were collected, a single cell suspension obtained, and CD3+ T cells were isolated by magnetic cell sorting using the Pan T cell Isolation Kit II (Miltenyi Biotech). CD3+ cells were incubated with DMSO (control cells) or TEPP-46 100 μM for 4 hours at 37°C, washed twice and incubated in complete fresh medium with CD3- splenocytes in the presence of MOG35–55 100 μg/ml + IL-1β 10 ng/ml and IL-23 10 ng/ml. After 3 days of restimulation, cells were collected, washed, and injected in equal numbers in recipient naïve C57BL/6 mice (15 million of total cells/mouse). EAE development was evaluated as described above.
Quantification and Statistical Analysis
Statistical analyses were performed using Prism 8 (GraphPad). Data were analysed by two-tailed Student's t-test or one-way ANOVA followed by Dunnett's post-hoc test for multiple comparisons. p values < 0.05 were considered statistically significant. The number of replicates (n), the number of independent experiments performed, and the p values for each experiment are reported in the corresponding figure legends. For both in vivo and in vitro experiments, no initial exclusion criteria were used and no animals or replicates were excluded from the study.
Data and Code Availability
The RNA sequencing data generated in this study have been deposited on the Gene Expression Omnibus (GEO) repository (accession number: GEO: GSE139378).
Acknowledgments
We thank Craig J. Thomas and Scott B. Hoyt from the Division of Preclinical Innovations at the National Center for Advancing Translational Sciences (National Institutes of Health; Bethesda, Maryland, USA) for providing TEPP-46. This work was supported by a Marie Skłodowska-Curie Individual Fellowship from the European Commission (to S.A.; grant code: 796507); by Wellcome Trust, UK (to L.A.J.O.; grant number: 205455); by Science Foundation Ireland (SFI Investigator award 16/IA/4468 to K.H.G.M.); and by the Max Planck Society (to E.L.P.).
Author Contributions
S.A. performed most of the experiments and analyzed all data. E.M.P-M., M.C.R., G.P., and H.K. assisted with in vitro experiments. S.A. and C.E.S. performed EAE experiments. B.K., M.C.R., and N.R. performed the analysis of RNA-seq data. E.L.P. and K.H.G.M. provided critical input. L.A.J.O. oversaw the project. S.A. and L.A.J.O. conceived the study and wrote the manuscript.
Declaration of Interests
L.A.J.O. is a Founder of Sitryx. E.L.P. is a Scientific Advisory Board member of ImmunoMet and a Founder of Rheos Medicines.
Published: November 21, 2019
Footnotes
Supplemental Information can be found online at https://doi.org/10.1016/j.cmet.2019.10.015.
Contributor Information
Stefano Angiari, Email: angiaris@tcd.ie.
Luke A.J. O'Neill, Email: laoneill@tcd.ie.
Supplemental Information
References
- Anastasiou D., Yu Y., Israelsen W.J., Jiang J.K., Boxer M.B., Hong B.S., Tempel W., Dimov S., Shen M., Jha A. Pyruvate kinase M2 activators promote tetramer formation and suppress tumorigenesis. Nat. Chem. Biol. 2012;8:839–847. doi: 10.1038/nchembio.1060. [DOI] [PMC free article] [PubMed] [Google Scholar]
- Bettencourt I.A., Powell J.D. Targeting metabolism as a novel therapeutic approach to autoimmunity, inflammation, and transplantation. J. Immunol. 2017;198:999–1005. doi: 10.4049/jimmunol.1601318. [DOI] [PMC free article] [PubMed] [Google Scholar]
- Bhardwaj V., Heyne S., Sikora K., Rabbani L., Rauer M., Kilpert F., Richter A.S., Ryan D., Manke T. snakePipes: facilitating flexible, scalable and integrative epigenomic analysis. Bioinformatics. 2019;35:4757–4759. doi: 10.1093/bioinformatics/btz436. [DOI] [PMC free article] [PubMed] [Google Scholar]
- Bian L., Josefsson E., Jonsson I.M., Verdrengh M., Ohlsson C., Bokarewa M., Tarkowski A., Magnusson M. Dichloroacetate alleviates development of collagen II-induced arthritis in female DBA/1 mice. Arthritis Res. Ther. 2009;11:R132. doi: 10.1186/ar2799. [DOI] [PMC free article] [PubMed] [Google Scholar]
- Cao Y., Rathmell J.C., Macintyre A.N. Metabolic reprogramming towards aerobic glycolysis correlates with greater proliferative ability and resistance to metabolic inhibition in CD8 versus CD4 T cells. PLoS One. 2014;9:e104104. doi: 10.1371/journal.pone.0104104. [DOI] [PMC free article] [PubMed] [Google Scholar]
- Chang J., Burkett P.R., Borges C.M., Kuchroo V.K., Turka L.A., Chang C.H. MyD88 is essential to sustain mTOR activation necessary to promote T helper 17 cell proliferation by linking IL-1 and IL-23 signaling. Proc. Natl. Acad. Sci. USA. 2013;110:2270–2275. doi: 10.1073/pnas.1206048110. [DOI] [PMC free article] [PubMed] [Google Scholar]
- Clambey E.T., McNamee E.N., Westrich J.A., Glover L.E., Campbell E.L., Jedlicka P., de Zoeten E.F., Cambier J.C., Stenmark K.R., Colgan S.P. Hypoxia-inducible factor-1 alpha-dependent induction of FoxP3 drives regulatory T-cell abundance and function during inflammatory hypoxia of the mucosa. Proc. Natl. Acad. Sci. USA. 2012;109:E2784–E2793. doi: 10.1073/pnas.1202366109. [DOI] [PMC free article] [PubMed] [Google Scholar]
- Csibi A., Lee G., Yoon S.O., Tong H., Ilter D., Elia I., Fendt S.M., Roberts T.M., Blenis J. The mTORC1/S6K1 pathway regulates glutamine metabolism through the eIF4B-dependent control of c-Myc translation. Curr. Biol. 2014;24:2274–2280. doi: 10.1016/j.cub.2014.08.007. [DOI] [PMC free article] [PubMed] [Google Scholar] [Retracted]
- Dang E.V., Barbi J., Yang H.Y., Jinasena D., Yu H., Zheng Y., Bordman Z., Fu J., Kim Y., Yen H.R. Control of T(H)17/T(reg) balance by hypoxia-inducible factor 1. Cell. 2011;146:772–784. doi: 10.1016/j.cell.2011.07.033. [DOI] [PMC free article] [PubMed] [Google Scholar]
- Dayton T.L., Jacks T., Vander Heiden M.G. PKM2, cancer metabolism, and the road ahead. EMBO Rep. 2016;17:1721–1730. doi: 10.15252/embr.201643300. [DOI] [PMC free article] [PubMed] [Google Scholar]
- Delgoffe G.M., Kole T.P., Zheng Y., Zarek P.E., Matthews K.L., Xiao B., Worley P.F., Kozma S.C., Powell J.D. The mTOR kinase differentially regulates effector and regulatory T cell lineage commitment. Immunity. 2009;30:832–844. doi: 10.1016/j.immuni.2009.04.014. [DOI] [PMC free article] [PubMed] [Google Scholar]
- Deng W., Zhu S., Zeng L., Liu J., Kang R., Yang M., Cao L., Wang H., Billiar T.R., Jiang J. The circadian clock controls immune checkpoint pathway in sepsis. Cell Rep. 2018;24:366–378. doi: 10.1016/j.celrep.2018.06.026. [DOI] [PMC free article] [PubMed] [Google Scholar]
- Dobin A., Davis C.A., Schlesinger F., Drenkow J., Zaleski C., Jha S., Batut P., Chaisson M., Gingeras T.R. STAR: ultrafast universal RNA-seq aligner. Bioinformatics. 2013;29:15–21. doi: 10.1093/bioinformatics/bts635. [DOI] [PMC free article] [PubMed] [Google Scholar]
- Dong G., Mao Q., Xia W., Xu Y., Wang J., Xu L., Jiang F. PKM2 and cancer: the function of PKM2 beyond glycolysis. Oncol. Lett. 2016;11:1980–1986. doi: 10.3892/ol.2016.4168. [DOI] [PMC free article] [PubMed] [Google Scholar]
- Düvel K., Yecies J.L., Menon S., Raman P., Lipovsky A.I., Souza A.L., Triantafellow E., Ma Q., Gorski R., Cleaver S. Activation of a metabolic gene regulatory network downstream of mTOR complex 1. Mol. Cell. 2010;39:171–183. doi: 10.1016/j.molcel.2010.06.022. [DOI] [PMC free article] [PubMed] [Google Scholar]
- Feldhoff L.M., Rueda C.M., Moreno-Fernandez M.E., Sauer J., Jackson C.M., Chougnet C.A., Rupp J. IL-1β induced HIF-1α inhibits the differentiation of human FOXP3+ T cells. Sci. Rep. 2017;7:465. doi: 10.1038/s41598-017-00508-x. [DOI] [PMC free article] [PubMed] [Google Scholar]
- Freitag J., Berod L., Kamradt T., Sparwasser T. Immunometabolism and autoimmunity. Immunol. Cell Biol. 2016;94:925–934. doi: 10.1038/icb.2016.77. [DOI] [PubMed] [Google Scholar]
- Gao X., Wang H., Yang J.J., Liu X., Liu Z.R. Pyruvate kinase M2 regulates gene transcription by acting as a protein kinase. Mol. Cell. 2012;45:598–609. doi: 10.1016/j.molcel.2012.01.001. [DOI] [PMC free article] [PubMed] [Google Scholar]
- Geltink R.I.K., Kyle R.L., Pearce E.L. Unraveling the complex interplay between T cell metabolism and function. Annu. Rev. Immunol. 2018;36:461–488. doi: 10.1146/annurev-immunol-042617-053019. [DOI] [PMC free article] [PubMed] [Google Scholar]
- Gerriets V.A., Kishton R.J., Nichols A.G., Macintyre A.N., Inoue M., Ilkayeva O., Winter P.S., Liu X., Priyadharshini B., Slawinska M.E. Metabolic programming and PDHK1 control CD4+ T cell subsets and inflammation. J. Clin. Invest. 2015;125:194–207. doi: 10.1172/JCI76012. [DOI] [PMC free article] [PubMed] [Google Scholar]
- Hawkins E.D., Hommel M., Turner M.L., Battye F.L., Markham J.F., Hodgkin P.D. Measuring lymphocyte proliferation, survival and differentiation using CFSE time-series data. Nat. Protoc. 2007;2:2057–2067. doi: 10.1038/nprot.2007.297. [DOI] [PubMed] [Google Scholar]
- He C.L., Bian Y.Y., Xue Y., Liu Z.X., Zhou K.Q., Yao C.F., Lin Y., Zou H.F., Luo F.X., Qu Y.Y. Pyruvate kinase M2 activates mTORC1 by phosphorylating AKT1S1. Sci. Rep. 2016;6:21524. doi: 10.1038/srep21524. [DOI] [PMC free article] [PubMed] [Google Scholar]
- Hitosugi T., Kang S., Vander Heiden M.G., Chung T.W., Elf S., Lythgoe K., Dong S., Lonial S., Wang X., Chen G.Z. Tyrosine phosphorylation inhibits PKM2 to promote the Warburg effect and tumor growth. Sci. Signal. 2009;2:ra73. doi: 10.1126/scisignal.2000431. [DOI] [PMC free article] [PubMed] [Google Scholar]
- Hosios A.M., Fiske B.P., Gui D.Y., Vander Heiden M.G. Lack of evidence for PKM2 protein kinase activity. Mol. Cell. 2015;59:850–857. doi: 10.1016/j.molcel.2015.07.013. [DOI] [PMC free article] [PubMed] [Google Scholar]
- Hume D.A., Radik J.L., Ferber E., Weidemann M.J. Aerobic glycolysis and lymphocyte transformation. Biochem. J. 1978;174:703–709. doi: 10.1042/bj1740703. [DOI] [PMC free article] [PubMed] [Google Scholar]
- Israelsen W.J., Vander Heiden M.G. Pyruvate kinase: function, regulation and role in cancer. Semin. Cell Dev. Biol. 2015;43:43–51. doi: 10.1016/j.semcdb.2015.08.004. [DOI] [PMC free article] [PubMed] [Google Scholar]
- Kipp M., Nyamoya S., Hochstrasser T., Amor S. Multiple sclerosis animal models: a clinical and histopathological perspective. Brain Pathol. 2017;27:123–137. doi: 10.1111/bpa.12454. [DOI] [PMC free article] [PubMed] [Google Scholar]
- Kono M., Maeda K., Stocton-Gavanescu I., Pan W., Umeda M., Katsuyama E., Burbano C., Orite S.Y.K., Vukelic M., Tsokos M.G. Pyruvate kinase M2 is requisite for Th1 and Th17 differentiation. JCI Insight. 2019;4:12. doi: 10.1172/jci.insight.127395. [DOI] [PMC free article] [PubMed] [Google Scholar]
- Kornberg M.D., Bhargava P., Kim P.M., Putluri V., Snowman A.M., Putluri N., Calabresi P.A., Snyder S.H. Dimethyl fumarate targets GAPDH and aerobic glycolysis to modulate immunity. Science. 2018;360:449–453. doi: 10.1126/science.aan4665. [DOI] [PMC free article] [PubMed] [Google Scholar]
- Kostic M., Zivkovic N., Cvetanovic A., Stojanovic I. Granulocyte-macrophage colony-stimulating factor as a mediator of autoimmunity in multiple sclerosis. J. Neuroimmunol. 2018;323:1–9. doi: 10.1016/j.jneuroim.2018.07.002. [DOI] [PubMed] [Google Scholar]
- Liao Y., Smyth G.K., Shi W. featureCounts: an efficient general purpose program for assigning sequence reads to genomic features. Bioinformatics. 2014;30:923–930. doi: 10.1093/bioinformatics/btt656. [DOI] [PubMed] [Google Scholar]
- Lochmatter C., Fischer R., Charles P.D., Yu Z., Powrie F., Kessler B.M. Integrative phosphoproteomics links IL-23R signaling with metabolic adaptation in lymphocytes. Sci. Rep. 2016;6:24491. doi: 10.1038/srep24491. [DOI] [PMC free article] [PubMed] [Google Scholar]
- Love M.I., Huber W., Anders S. Moderated estimation of fold change and dispersion for RNA-seq data with DESeq2. Genome Biol. 2014;15:550. doi: 10.1186/s13059-014-0550-8. [DOI] [PMC free article] [PubMed] [Google Scholar]
- Lü S., Deng J., Liu H., Liu B., Yang J., Miao Y., Li J., Wang N., Jiang C., Xu Q. PKM2-dependent metabolic reprogramming in CD4+ T cells is crucial for hyperhomocysteinemia-accelerated atherosclerosis. J. Mol. Med. (Berl.) 2018;96:585–600. doi: 10.1007/s00109-018-1645-6. [DOI] [PubMed] [Google Scholar]
- Lunt S.Y., Muralidhar V., Hosios A.M., Israelsen W.J., Gui D.Y., Newhouse L., Ogrodzinski M., Hecht V., Xu K., Acevedo P.N. Pyruvate kinase isoform expression alters nucleotide synthesis to impact cell proliferation. Mol. Cell. 2015;57:95–107. doi: 10.1016/j.molcel.2014.10.027. [DOI] [PMC free article] [PubMed] [Google Scholar]
- Luo W., Hu H., Chang R., Zhong J., Knabel M., O'Meally R., Cole R.N., Pandey A., Semenza G.L. Pyruvate kinase M2 is a PHD3-stimulated coactivator for hypoxia-inducible factor 1. Cell. 2011;145:732–744. doi: 10.1016/j.cell.2011.03.054. [DOI] [PMC free article] [PubMed] [Google Scholar]
- Macintyre A.N., Gerriets V.A., Nichols A.G., Michalek R.D., Rudolph M.C., Deoliveira D., Anderson S.M., Abel E.D., Chen B.J., Hale L.P. The glucose transporter Glut1 is selectively essential for CD4 T cell activation and effector function. Cell Metab. 2014;20:61–72. doi: 10.1016/j.cmet.2014.05.004. [DOI] [PMC free article] [PubMed] [Google Scholar]
- Mähler Convenor M., Berard M., Feinstein R., Gallagher A., Illgen-Wilcke B., Pritchett-Corning K., Raspa M. FELASA recommendations for the health monitoring of mouse, rat, hamster, guinea pig and rabbit colonies in breeding and experimental units. Lab. Anim. 2014;48:178–192. doi: 10.1177/0023677213516312. [DOI] [PubMed] [Google Scholar]
- Marjanovic S., Skog S., Heiden T., Tribukait B., Nelson B.D. Expression of glycolytic isoenzymes in activated human peripheral lymphocytes: cell cycle analysis using flow cytometry. Exp. Cell Res. 1991;193:425–431. doi: 10.1016/0014-4827(91)90116-c. [DOI] [PubMed] [Google Scholar]
- Netzker R., Greiner E., Eigenbrodt E., Noguchi T., Tanaka T., Brand K. Cell cycle-associated expression of M2-type isozyme of pyruvate kinase in proliferating rat thymocytes. J. Biol. Chem. 1992;267:6421–6424. [PubMed] [Google Scholar]
- O'Neill L.A., Kishton R.J., Rathmell J. A guide to immunometabolism for immunologists. Nat. Rev. Immunol. 2016;16:553–565. doi: 10.1038/nri.2016.70. [DOI] [PMC free article] [PubMed] [Google Scholar]
- Palsson-McDermott E.M., Curtis A.M., Goel G., Lauterbach M.R., Sheedy F.J., Gleeson L.E., van den Bosch M.M., Quinn S.R., Domingo-Fernandez R., Johnston D.W. Pyruvate kinase M2 regulates HIF-1α activity and IL-1β induction and is a critical determinant of the warburg effect in LPS-activated macrophages. Cell Metab. 2015;21:65–80. doi: 10.1016/j.cmet.2014.12.005. [DOI] [PMC free article] [PubMed] [Google Scholar]
- Park Y.S., Kim D.J., Koo H., Jang S.H., You Y.M., Cho J.H., Yang S.J., Yu E.S., Jung Y., Lee D.C. AKT-induced PKM2 phosphorylation signals for IGF-1-stimulated cancer cell growth. Oncotarget. 2016;7:48155–48167. doi: 10.18632/oncotarget.10179. [DOI] [PMC free article] [PubMed] [Google Scholar]
- Pearce E.L., Pearce E.J. Metabolic pathways in immune cell activation and quiescence. Immunity. 2013;38:633–643. doi: 10.1016/j.immuni.2013.04.005. [DOI] [PMC free article] [PubMed] [Google Scholar]
- Prakasam G., Iqbal M.A., Bamezai R.N.K., Mazurek S. Posttranslational modifications of pyruvate kinase M2: tweaks that benefit cancer. Front. Oncol. 2018;8:22. doi: 10.3389/fonc.2018.00022. [DOI] [PMC free article] [PubMed] [Google Scholar]
- Procaccini C., Carbone F., Di Silvestre D., Brambilla F., De Rosa V., Galgani M., Faicchia D., Marone G., Tramontano D., Corona M. The proteomic landscape of human ex vivo regulatory and conventional T cells reveals specific metabolic requirements. Immunity. 2016;44:406–421. doi: 10.1016/j.immuni.2016.01.028. [DOI] [PMC free article] [PubMed] [Google Scholar]
- Raverdeau M., Breen C.J., Misiak A., Mills K.H. Retinoic acid suppresses IL-17 production and pathogenic activity of γδ T cells in CNS autoimmunity. Immunol. Cell Biol. 2016;94:763–773. doi: 10.1038/icb.2016.39. [DOI] [PubMed] [Google Scholar]
- Seif F., Khoshmirsafa M., Aazami H., Mohsenzadegan M., Sedighi G., Bahar M. The role of JAK-STAT signaling pathway and its regulators in the fate of T helper cells. Cell Commun. Signal. 2017;15:23. doi: 10.1186/s12964-017-0177-y. [DOI] [PMC free article] [PubMed] [Google Scholar]
- Shi L.Z., Wang R., Huang G., Vogel P., Neale G., Green D.R., Chi H. HIF1alpha-dependent glycolytic pathway orchestrates a metabolic checkpoint for the differentiation of TH17 and Treg cells. J. Exp. Med. 2011;208:1367–1376. doi: 10.1084/jem.20110278. [DOI] [PMC free article] [PubMed] [Google Scholar]
- Sutton C.E., Finlay C.M., Raverdeau M., Early J.O., DeCourcey J., Zaslona Z., O'Neill L.A.J., Mills K.H.G., Curtis A.M. Loss of the molecular clock in myeloid cells exacerbates T cell-mediated CNS autoimmune disease. Nat. Commun. 2017;8:1923. doi: 10.1038/s41467-017-02111-0. [DOI] [PMC free article] [PubMed] [Google Scholar]
- Wang R., Dillon C.P., Shi L.Z., Milasta S., Carter R., Finkelstein D., McCormick L.L., Fitzgerald P., Chi H., Munger J. The transcription factor Myc controls metabolic reprogramming upon T lymphocyte activation. Immunity. 2011;35:871–882. doi: 10.1016/j.immuni.2011.09.021. [DOI] [PMC free article] [PubMed] [Google Scholar]
- Wang T., Marquardt C., Foker J. Aerobic glycolysis during lymphocyte proliferation. Nature. 1976;261:702–705. doi: 10.1038/261702a0. [DOI] [PubMed] [Google Scholar]
- Wei J., Long L., Yang K., Guy C., Shrestha S., Chen Z., Wu C., Vogel P., Neale G., Green D.R. Autophagy enforces functional integrity of regulatory T cells by coupling environmental cues and metabolic homeostasis. Nat. Immunol. 2016;17:277–285. doi: 10.1038/ni.3365. [DOI] [PMC free article] [PubMed] [Google Scholar]
- Wu J., Cui H., Zhu Z., Wang L., Li H., Wang D. Effect of HIF1α on Foxp3 expression in CD4+ CD25- T lymphocytes. Microbiol. Immunol. 2014;58:409–415. doi: 10.1111/1348-0421.12168. [DOI] [PubMed] [Google Scholar]
- Yang W., Xia Y., Hawke D., Li X., Liang J., Xing D., Aldape K., Hunter T., Yung W.K.A., Lu Z. PKM2 phosphorylates histone H3 and promotes gene transcription and tumorigenesis. Cell. 2012;158:685–696. doi: 10.1016/j.cell.2012.07.018. [DOI] [PMC free article] [PubMed] [Google Scholar]
- Yang W., Zheng Y., Xia Y., Ji H., Chen X., Guo F., Lyssiotis C.A., Aldape K., Cantley L.C., Lu Z. ERK1/2-dependent phosphorylation and nuclear translocation of PKM2 promotes the Warburg effect. Nat. Cell Biol. 2012;14:1295–1304. doi: 10.1038/ncb2629. [DOI] [PMC free article] [PubMed] [Google Scholar]
- Yang Y., Xu J., Niu Y., Bromberg J.S., Ding Y. T-bet and eomesodermin play critical roles in directing T cell differentiation to Th1 versus Th17. J. Immunol. 2008;181:8700–8710. doi: 10.4049/jimmunol.181.12.8700. [DOI] [PMC free article] [PubMed] [Google Scholar]
- Ye J., Mancuso A., Tong X., Ward P.S., Fan J., Rabinowitz J.D., Thompson C.B. Pyruvate kinase M2 promotes de novo serine synthesis to sustain mTORC1 activity and cell proliferation. Proc. Natl. Acad. Sci. USA. 2012;109:6904–6909. doi: 10.1073/pnas.1204176109. [DOI] [PMC free article] [PubMed] [Google Scholar]
- Zeng H., Yang K., Cloer C., Neale G., Vogel P., Chi H. mTORC1 couples immune signals and metabolic programming to establish T(reg)-cell function. Nature. 2013;499:485–490. doi: 10.1038/nature12297. [DOI] [PMC free article] [PubMed] [Google Scholar]
Associated Data
This section collects any data citations, data availability statements, or supplementary materials included in this article.
Supplementary Materials
Data Availability Statement
The RNA sequencing data generated in this study have been deposited on the Gene Expression Omnibus (GEO) repository (accession number: GEO: GSE139378).