

Abstract
Background
Clinical prediction models are widely used to guide medical advice and therapeutic interventions. Asthma is one of the most common chronic diseases globally and is characterised by acute deteriorations. These exacerbations are largely preventable, so there is interest in using clinical prediction models in this area. The objective of this review was to identify studies which have developed such models, determine whether consistent and appropriate methodology was used and whether statistically reliable prognostic models exist.
Methods
We searched online databases MEDLINE (1948 onwards), CINAHL Plus (1937 onwards), The Cochrane Library, Web of Science (1898 onwards) and ClinicalTrials.gov, using index terms relating to asthma and prognosis. Data was extracted and assessment of quality was based on GRADE and an early version of PROBAST (Prediction study Risk of Bias Assessment Tool). A meta-analysis of the discrimination and calibration measures was carried out to determine overall performance across models.
Results
Ten unique prognostic models were identified. GRADE identified moderate risk of bias in two of the studies, but more detailed quality assessment via PROBAST highlighted that most models were developed using highly selected and small datasets, incompletely recorded predictors and outcomes, and incomplete methodology. None of the identified models modelled recurrent exacerbations, instead favouring either presence/absence of an event, or time to first or specified event. Preferred methodologies were logistic regression and Cox proportional hazards regression.
The overall pooled c-statistic was 0.77 (95% confidence interval 0.73 to 0.80), though individually some models performed no better than chance. The meta-analysis had an I2 value of 99.75% indicating a high amount of heterogeneity between studies. The majority of studies were small and did not include internal or external validation, therefore the individual performance measures are likely to be optimistic.
Conclusions
Current prognostic models for asthma exacerbations are heterogeneous in methodology, but reported c-statistics suggest a clinically useful model could be created. Studies were consistent in lacking robust validation and in not modelling serial events. Further research is required with respect to incorporating recurrent events, and to externally validate tools in large representative populations to demonstrate the generalizability of published results.
Keywords: Asthma, Exacerbation, Prognostic models, Clinical prediction, Risk, Systematic review
Background
Asthma is a complex and heterogeneous syndrome that affects hundreds of millions of people worldwide and has an increasing global prevalence [1]. All individuals with asthma, regardless of age, location or asthma subtype are at risk of a deterioration in symptoms and measures of airway calibre and inflammation that require rescue therapy: an exacerbation. Asthma exacerbations are a common cause of unscheduled healthcare use [1]. In addition to the acute physical morbidity, exacerbations are associated with permanent lung damage [2–4] and have a significant psychological impact [5, 6]. In the United Kingdom, it is estimated that the health service spends £1 billion per year on asthma care with similar indirect costs, particularly from lost work days [7, 8].
Although there has been some improvement in asthma admission and age-adjusted death rates, progress has lagged behind other disease areas. This is despite most asthma exacerbations and deaths being preventable [9]. This slow progress is in part due to the heterogeneity of asthma [10], but also due to the historic focus on daily symptom management. Moving from symptom control to a risk-based strategy has underpinned progress in disease areas such as cardiovascular and diabetic medicine. A method of identifying individuals at a higher risk of asthma exacerbations therefore has appeal [11], particularly where resources are scarce. Generating a personalised risk assessment and targeted management plan in asthma has the potential to significantly improve outcomes.
A prognostic model is a statistical equation that predicts an individual’s outcome risk based on the combination of their values of multiple predictors such as age and sex [12]. Developing a prognostic model generally involves four stages. Firstly, the available data is cleaned and processed. Next the candidate predictors are identified. These are the predictors that are thought to be significant or have previously been linked to the condition of study. The model variables are then chosen from the candidate predictors using multivariable selection methods when possible. Finally, the model performance is assessed, preferably using a different dataset to demonstrate that the model can be extended to new patients [13].
Many papers have studied factors associated with asthma exacerbations. However, these studies have largely considered a narrow group of potential predictors, or have been undertaken in a highly selected population. There have also been prognostic models published that have attempted to address predicting the risk of future exacerbations. The aim of this review was to identify and summarise these prognostic models. Through the identification of existing studies, the review will help to determine whether reliable models have been derived using robust methodology, and what further research is needed within the field.
Methods
Search strategy
Five electronic databases were searched in October 2017; four of these were bibliographic and one was a clinical trials register (ClinicalTrials.gov). The bibliographic databases were Medical Literature Analysis and Retrieval System Online (MEDLINE; 1948 onwards), Cumulative Index of Nursing and Allied Health Literature Plus (CINAHL; 1937 onwards), The Cochrane Library, and Web of Science (1898 onwards). All search strategies used both indexed terms and text words to search for asthma and prognostic models [12]. The search strategy is given in Appendix 1. Reference lists of all included papers were checked for potentially contributory papers. There were no language restrictions placed upon articles.
Inclusion criteria
This review included studies of participants aged 12 years and over, who were diagnosed with asthma and were receiving treatment. The 12 years cut-off for age was chosen based on commonly used criteria in previous asthma studies [14, 15]. Studies focusing on childhood asthma were also excluded from this review. Studies solely concerned with populations with special circumstances (asthma in pregnancy or occupational/ work exacerbated asthma) were excluded, as were those focussed on the assessment of efficacy of a specific trial drug. Papers concerning Asthma-Chronic Obstructive Pulmonary Disorder (COPD) Overlap Syndrome were eligible for potential inclusion given the variation in the use of such terms. Studies that included participants within and outside the inclusion criteria were included if the data of desired participants could be extracted.
Studies deriving prognostic models using multiple factors to predict a clinical outcome of asthma were included. These could be based on randomised controlled trials or observational data. Studies of a single prognostic factor were not considered.
Study selection
Studies were selected initially from their titles and abstracts, using pre-defined inclusion criteria. A random sub-set (10%) of these studies were reviewed independently by a second reviewer. After initial screening the full texts were obtained, via inter-library and British Library requests where relevant. These full texts were screened with the same pre-determined criteria. Again, a sub-set (10%) of full texts was used in a cross-validation. No discrepancies arose between reviewers in this subset.
The reasons for exclusion were documented and summarised.
Data extraction
Relevant studies had their data extracted. The pre-piloted data extraction form included the elements pertaining to patient characteristics, statistical modelling and assessment of model performance. Full details are in Appendix 2.
Quality assessment
To assess the risk of bias (quality) of any included studies both Grading of Recommendations Assessment, Development and Evaluation (GRADE) [16] and the available version of Prediction study Risk of Bias Assessment Tool (PROBAST) were used [17]. GRADE groups studies into outcomes and uses six areas to calculate the quality of evidence. The areas of assessment are study design, risk of bias, inconsistency, indirectness, imprecision, and other considerations such as publication bias. GRADE is specifically intended to evaluate quality of evidence in systematic reviews [16].
The PROBAST tool assesses five domains of bias: participant selection, predictors, outcome, sample size and participant flow, and analysis. Each included study was assessed individually with a risk of bias score (low, high or unclear) being given in each domain. Models were classed as low, moderate or high risk of bias.
Data synthesis
Each unique model identified was summarised narratively. Information collated included model type, development method, prognostic factors, population characteristics, outcome measures, performance measures (with standard error), and validation methods (internal or external).
A random effects meta-analysis was used to synthesise calibration and discrimination statistics from multiple studies validating the same prognostic model [18]. The meta-analysis was summarised in a forest plot showing the pooled performance. A meta-regression was performed using year of publication and model type as moderators to reduce heterogeneity. Stepwise regression was used to select these moderators, with Corrected Akaike Information Criterion (AICc) used as the criterion [19]. A funnel plot was produced as a visual check for publication bias.
Results
Studies identified
The search yielded 7462 results across the five databases, 47 of which were excluded as they were duplicate studies. The remaining titles and abstracts were screened to obtain 281 results, which were deemed to be relevant according to the pre-defined criteria. All studies were published in English. Of these 281 studies, 1 had no full text available via interlibrary loan [20] but the remainder were obtained to further assess their suitability. Using pre-defined selection criteria applied to full texts, 271 studies were excluded. Reasons for exclusion included conference abstract with no related publication (n = 31), conference abstract with the full text included elsewhere in the literature search (n = 11), letters to the editor (n = 18), incorrect study population such as children, pregnant women, or patients with occupational/work exacerbated asthma (n = 34), incorrect outcome such as development of asthma, lung function decline, or readmission (n = 96), studies of a single prognostic factors (n = 11), and etiological only studies (n = 62). This left 13 studies, including 4 on-going studies without relevant publications at the time of the review. Ten studies were included in the qualitative review. One study by Frey et al. [21] proposed a method of predicting future exacerbations using a dynamic model but did not test the method on clinical data. This study was therefore excluded from the quantitative analysis leaving a total of 9 studies [22–30]. A Preferred Reporting Items for Systematic Reviews and Meta-Analyses (PRISMA) flow diagram for this is shown in Fig. 1. Each study is summarised in Table 1.
Fig. 1.

PRISMA flow diagram
Table 1.
Summary of studies included in the quantitative synthesis
| Publication | Country | Source | Age of participants | Primary outcome/Definition | Follow up duration | Sample size (Development/Validation) | Events per variable | Predictors in model |
|---|---|---|---|---|---|---|---|---|
| Bateman 2014 [22] | Multiple |
3 double blind trials Retrospective |
12–89 | Time to first exacerbation/ GINA | 6–12 months | 4962/2482 | NR/24 | Body mass index (BMI), Asthma control questionnaire 5 (ACQ-5) score, Post bronchodilator forced expiratory volume in 1 sec (FEV1), Reliever use, GINA step. |
| Blakey 2017 [23] | UK |
UK electronic medical database Retrospective |
12–80 |
≥2 exacerbations ≥4 exacerbations Asthma related admission or OCS |
2 years | 118,981 |
59,514/55 =1082.07 |
Age, Sex, BMI, Smoking status, Rhinitis, Eczema, Gastroesophageal reflux disease (GERD), Nasal polyps, Anaphylaxis, Non-steroidal anti-inflammatory drug (NSAID) use, Peak expiratory flow (PEF), Blood eosinophil, Mean short-acting beta agonist (SABA) use, Leukotriene receptor antagonist (LTRA) use, Long-acting beta agonist (LABA) use, Inhaled corticosteroid (ICS) use, Acute oral corticosteroid (OCS) use, Asthma related hospital admissions, Primary care consultations. |
| Finkelstein 2013 [24] | Multiple |
Self-reported study Retrospective |
Adult | High/low risk of exacerbation/ Patient defined | Not reported | 1862/3306 | NR/147 | Wheeze, Sputum production, Chest tightness, Shortness of breath, Limitation of physical activity, Over-all use of quick-relief inhaler, Exposure to triggers, Over-all asthma estimate, Presence of cold, Number of quick-relief puffs, number of preventative puffs, Sleep problems, Number of times awoken, Last night quick-relief use, Last 24 h prednisone use, Last 24 h nebulizer use, Last 24 h second controller use, Last use of quick-relief inhaler |
| Finkelstein 2017 [25] | Multiple |
Self-reported study Retrospective |
Adult | High/low risk of exacerbation/ Patient defined | Not reported | 1862/3306 | NR/147 | Wheeze, Sputum production, Chest tightness, Shortness of breath, Limitation of physical activity, Over-all use of quick-relief inhaler, Exposure to triggers, Over-all asthma estimate, Presence of cold, Number of quick-relief puffs, number of preventative puffs, Sleep problems, Number of times awoken, Last night quick-relief use, Last 24 h prednisone use, Last 24 h nebulizer use, Last 24 h second controller use, Last use of quick-relief inhaler |
| Honkoop 2013 [26] | New Zealand |
Two studies Retrospective |
12–75 |
Severe exacerbation/ Asthma score |
1 year | 164/94 |
88/25 =3.52 |
Asthma symptoms, PEF |
| Loymans 2016 [27] | Netherlands |
ACCURATE study group Retrospective |
17–55 |
Exacerbation ATS/ERS |
1 year | 611/504 |
80/15 =5.33 |
ACQ-5 score, Current smoking status, Chronic sinusitis, Admissions, Oral steroid use, FEV1, Fractional exhaled nitrous oxide (FeNO) |
| McCarren 1998 [28] | US |
Hospital cohort Retrospective |
18–55 |
Severe exacerbation/ Unscheduled ED visit |
6 weeks | 284 |
130/18 =7.22 |
3 or more emergency department (ED) visits in the last 6 months, Difficulty performing activities in the last 4 weeks, Left ED before 24 h without achieving 50% of predicted peak expiratory flow rate (PEFR) |
| Sato 2009 [29] | Japan |
Hospital cohort Prospective |
62.5 ± 13.5 |
Severe exacerbation/ 2 days < 70% PEF |
Until event | 78 |
16/4 =4.00 |
Asthma control test (ACT) score, FEV1, FeNO |
| Yii 2012 [30] | Singapore |
Hospital cohort Prospective |
56 ± 18 and 50 ± 19 |
Severe exacerbation ATS/ERS |
3 years | 177/84 | NR/12 | 2 or more ED or hospital visits in the past year, BMI, History of near-fatal asthma, Depression, Obstructive sleep apnoea, GERD |
NR not reported
Model development methods
There were five distinct types of model development methodology identified in the included studies: probabilistic approaches, logistic regression, survival analysis, action points, and Classification and Regression Tree Analysis (CART).
Probabilistic approaches
A probabilistic approach to model building was used in three of the studies [21, 24, 25]. Two of these studies, both by Finkelstein et al. [24, 25], used machine learning to assign a high or low risk of asthma exacerbation for each day, using inputs into a telemonitoring system as predictors. The telemonitoring system used within this study required each patient to have a laptop and connected flowmeter. Both Finkelstein studies aimed to predict an imminent asthma exacerbation, with the 2013 study [25] using a naïve Bayesian classifier and a support vector machine, and the 2017 one [24] adding an adaptive Bayesian network.
Both Finkelstein papers used the same three datasets, with around 70% of the data being used for development and 30% for validation. The accuracies, sensitivities, and specificities of the developed model in each dataset were reported, however these were not split into individual values for development and validation. These machine learning based studies found that an exacerbation could be predicted, using a support vector machine on day eight, with sensitivity 0.84 and specificity 0.80, with the naïve Bayesian classifier showing slightly poorer performance (sensitivity 0.80, specificity 0.77).
The 2017 Finkelstein study again used three datasets with sensitivity and specificity reported for each classifier and dataset, but not distinguishing between development and validation. This study found the adaptive Bayesian network classifier to have higher sensitivity and specificity, than the previous two classifiers.
Frey et al. [21] discussed the use of a complex dynamic model, from statistical physics, to develop a time series based model. This study developed methodology and discussed the theory, however no data was used to produce an actual model, hence no performance measure could be reported. Frey commented that, as well as being used to assess exacerbation risk, this method could be extended to assess exacerbation control and treatment affect.
Logistic regression
Three [23, 27, 30] of the studies developed their model using logistic regression. Blakey et al. [23] utilised United Kingdom medical records, resulting in the largest sample size of all the included studies (n = 118,981). This dataset was used for both development and internal validation.
Loymans et al. [27] also developed their prognostic model using logistic regression. They used data from the Asthma Control Cost-Utility Randomized Trial Evaluation (ACCURATE) study in model development (n = 611) and data from the Unbiased Biomarkers for the Prediction of Respiratory Disease Outcomes (U-BIOPRED) study was used for external validation (n = 504). Yii et al. [30] assessed the long-term prognosis of asthma sufferers using logistic regression. They concluded that, over 5 years there are 3 distinct trajectories that sufferers may experience. This study used 177 patients for model development and a validation cohort of 84 patients from the same clinic.
Survival analysis
There were two studies [22, 28] developing models using survival analysis. Bateman et al. [22] used three different sets of clinical trial data in an analysis that was not pre-specified. The data were pooled into one set and two-thirds of the data were used for development, whilst the remaining third was used for validation. The risk of severe exacerbation was assessed over 6 months and given values “low” or “high”. McCarren et al. [28] looked at the risk of relapse within 8 weeks of an emergency department visit. No studies considered methods for modelling recurrent events instead modelling time to a specified event.
Action points
Honkoop et al. [26] used action points in the self-management of asthma to predict exacerbations. Patients from 3 centres with uncontrolled asthma were included. The study concluded that a composite action point of symptoms and measurements provided the best method of prediction. The optimal action point was found to be an increase of greater than two standard deviations in composite symptom score and a fall in peak expiratory flow greater than 70%, within 1 week of each other.
Classification and regression tree analysis
CART analysis was used by Sato et al. [29] A retrospective cohort of 78 patients was used in the development and cross-validation of the model. The CART analysis consisted of three nodes. Similar to the action point study, this study found that a combination of Asthma Control Test and lung function measurements is better at predicting exacerbations than on their own.
Quality assessment
GRADE
The GRADE assessment shown in Table 2. One study, using a specific drug as a prognostic factor [22], was funded by a pharmaceutical company and some authors were employees of the company. This study was deemed to be of possible high risk of bias, however the results were consistent with other independent studies.
Table 2.
GRADE assessment of the included studies
| Number of studies | Certainty assessment | Certainty | Importance | |||||
|---|---|---|---|---|---|---|---|---|
| Study design | Risk of bias | Inconsistency | Indirectness | Imprecision | Other considerations | |||
| Exacerbation | ||||||||
| 5 | Observational studies | Not serious | Not serious | Not serious | Not serious | None |
HIGH |
CRITICAL |
| Risk (Categorical) | ||||||||
| 2 | Observational studies | Not serious | Not serious | Not serious | Not serious | None |
LOW |
CRITICAL |
| Time to first severe exacerbation | ||||||||
| 1 | Observational studies | Not serious | Not serious | Not serious | Not serious | Publication bias strongly suspected dose response curvea |
HIGH |
CRITICAL |
| Asthma admissions | ||||||||
| 1 | Observational studies | Not serious | Not serious | Not serious | Not serious | None |
HIGH |
IMPORTANT |
| Relapse | ||||||||
| 1 | Observational studies | Not serious | Not serious | Not serious | Not serious | None |
HIGH |
IMPORTANT |
aContributions from pharmaceutical company employees
PROBAST
Participant selection
Data from observational studies are most informative in prognostic studies, however none of the studies identified used this study design. Models were instead built using data from patients recruited for another purpose (randomised controlled trials, or convenience samples in clinic) and hence highly selected populations. Only McCarron et al. considered people who had initially come to the emergency department [28].
Additionally the studies by Finkelstein et al. used telemonitoring data which may rely on the patients’ ability to use technology. This could potentially exclude certain patients from the study. Three studies [28–30] used data from hospital cohorts which may not be representative of the wider population and may include significant bias. Therefore, overall, we deemed there to be a moderate to high risk of bias from participant selection in most studies.
Predictors
All the predictors included in the prognostic models across studies were defined in the same way for each patient within studies. There was incomplete recording of baseline factors in most studies however. One particular cause of concern was in the Finkelstein [24, 25] studies as these rely solely on telemonitoring data which can be highly variable and unreliable [31]. All other predictors were commonly used and shown in previous prognostic factor studies to have evidence of being linked to exacerbations [32]. Some factors such as the Asthma Control Questionnaire score have an inherently subjective nature and rely on the patient scoring themselves. Despite this, the Finkelstein et al. studies [24, 25] were the only trials to be suspected of high bias for predictors – others were deemed to be at a low to moderate risk of bias.
Outcome
All included studies used pre-specified outcomes although the outcome was often incompletely recorded. There was only one study, by Honkoop et al., with predictors included in the outcome [26]. This study used two definitions for exacerbations; one definition included symptoms and peak expiratory flow, and these were both also used as predictors. All other studies defined exacerbations independent of predictors.
Asthma exacerbation was defined in a variety of ways across studies with some studies opting for very loose criteria that would be categorised as a deterioration or instability (not an exacerbation). Therefore, for outcome, one study was identified as being at high risk of bias according to PROBAST [26]. The remaining studies were at low to medium risk.
Sample size and participant flow
Sample size varied from n = 78 [29] to n = 118,981 [23] and the number of events per variable (number of asthma exacerbations divided by the number of levels of all candidate predictors) varied from 3.52 to 1082.07 (see Table 1). This ratio was not estimable in four studies which did not report the event rate in the patient group used for model development.
Commonly cited evidence for a minimum number of events per variable is 10 [33]. Assuming a best case scenario (statistically speaking) whereby all patients had an exacerbation, four studies [26–29] failed to achieve the minimum requirement of 10 events per variable which would indicate that these studies were at high risk of bias. Research regarding sample size calculations for external validation studies suggests at least 100 events and 100 non-events are required to access calibration-in-the-large and calibration slope, and at least 200 events and 200 non-events to derive flexible calibration curves for logistic regression [34, 35]. Many of the included studies have not undertaken external validation and where they have the independent data may have insufficient events.
Four [22, 23, 27, 30] of the studies had participants excluded from the final analysis, with two of those not accounting of missing data [27, 30] and hence possibly introducing bias. Some studies used national databases; it is therefore possible that incomplete records were excluded in the searching stage.
Risk of bias was considered to be high in five studies [26–30], moderate in two [24, 25] and low in two [22, 23].
Analysis
Throughout the studies, all non-binary predictors and extra complexities were handled appropriately. In particular, univariate model selection was avoided and multivariable model building was undertaken using valid variable selection methods such as backwards selection [36] in all but one study [22].
One study [21] provided no performance measures for its model, while the other studies reported various different performance measures; the c-statistic was the most commonly reported performance measure. Four of the studies [22, 23, 27, 30] either recalibrated or showed evidence that no recalibration was needed through a calibration plot. Two models used bootstrapping in predictor selection [22, 27] and one of these models used bootstrapping in constructing non-symmetric c-statistic confidence intervals [22]. Bias due to the analysis was rated high in five of the studies as these studies used no calibration methods or techniques to avoid overfitting [24–26, 28, 29].
Meta-analysis
The most commonly reported performance measure was the c-statistic, also called the area under the receiver operating curve [37]. The c-statistic is a measure of discrimination – the diagnostic ability of the model. This statistic was pooled in a meta-analysis to assess the overall effectiveness of the models, with weighting according to sample size. When the model was fit without any moderators, the average overall c-statistic across all models was 0.77 (95% confidence interval 0.73 to 0.80). The pooled c-statistic is above 0.5, the value of chance. From this we can conclude that these models are somewhat effective at predicting the risk of asthma exacerbations.
The Finkelstein studies [24, 25] did not include confidence intervals or standard deviations, and thus it was not possible to construct confidence intervals for these studies. Additionally some studies are very small and thus the estimates of the c-statistic have very wide confidence intervals whilst others have very small confidence intervals suggesting methodological flaws [27, 30].
High variation was found between models, even within the same study. For example, Honkoop et al. [26] report one model using a validation set as having a c-statistic of 0.99 (0.96, 1.00) and the same model and data with a different definition for exacerbation as 0.55 (0.40, 0.70). This is the study identified at being at high risk of bias due to outcome; in definition 1 asthma was defined as an increase in symptoms and peak expiratory flow (PEF), while increase in symptoms and PEF were also the predictors of the model. This will have artificially increased the c-statistic. To test this we removed the models using this definition and refitted the random effects model.
The forest plot in Fig. 2 shows the results with suspected biased c-statistics removed, with Table 3 displaying the final average c-statistics and confidence intervals. This accounts for 55.7% of the total 99.22% heterogeneity. In Fig. 2 squares are used to depict the c-statistic with associated 95% confidence intervals illustrated by lines. The size of the square is proportional to the sample size. A funnel plot was also produced (Fig. 3), which showed a low risk of publication bias.
Fig. 2.

Forest plot of the meta-analysis
Table 3.
C-statistics with high bias models removed
| Selection method | Pooled c-statistic | 95% Confidence interval |
|---|---|---|
| Logistic regression | 0.80 | (0.73,0.86) |
| Optimal action points | 0.72 | (0.65,0.79) |
| Other methods | 0.62 | (0.56,0.67) |
Fig. 3.
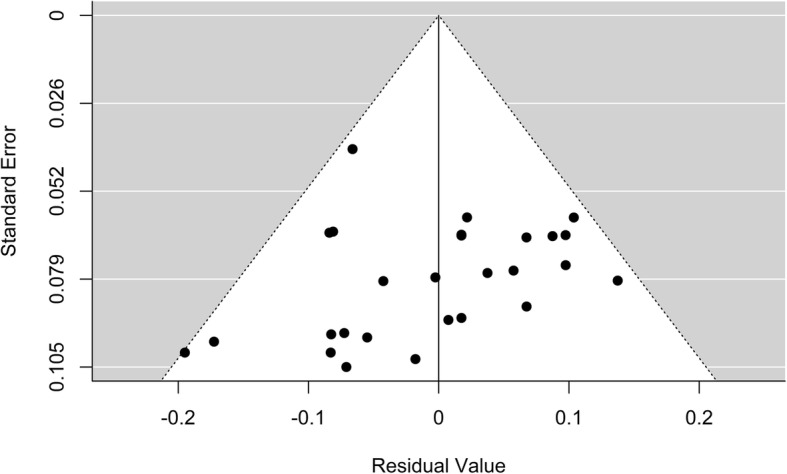
Funnel plot of all models reported in the studies
The I2 statistic was 99.75% demonstrating a large amount of heterogeneity between studies. To reduce heterogeneity, 21 characteristics of the studies, such as recruitment years and model type, were proposed as moderators. This list was derived from the data extraction sheet. The best fitting random-effects model was identified based on AICc by stepwise regression. It was found that the use of logistic regression and optimal action points in the model building were highly significant modifiers. The best random effects model, by AICc, reduced heterogeneity by 42.03%. An additional figure compares the performance of logistic regression models with other models using the development population from each study [see Additional file 1]. This illustrates that newer modelling approaches do not currently perform better than logistic regression.
Discussion
This systematic review of prognostic models for the risk of asthma exacerbations identified 10 studies developing or validating models. The studies varied in design, study population, statistical approach and definition of outcomes highlighting the need for coordinated programs of research in this area. Three consistent findings were evident from the study. First, from individual study c-statistics and our meta-analyses, it appears possible to create a statistical model for asthma exacerbations which is relatively good at making predictions. Second, study designs using logistic regression or optimal action points had greater accuracy than more complex methods such as survival analysis and CART. Third, far more work has been undertaken in developing models than attempting validation in large, representative populations. The most predictive models tended to include a mix of patient reported outcomes, clinical measurements, and parameters related to medication use.
Our study benefits from a comprehensive search strategy and thorough analysis approach, and is the first such review and meta-analysis in relation to this common and challenging clinical issue. The meta-analysis of heterogeneous studies was undertaken to investigate and demonstrate broad points and therefore the exact c-statistic estimates are not of direct clinical relevance given the degree of study heterogeneity. In particular, the summary statistic from the meta-analysis is to give an indication of the performance, rather than to be an accurate pooled estimate. An additional limitation is the potential for the reviewer bias given that only a random subset of studies were reviewed by a second author. However, no discrepancies between reviewers were identified. Additionally, full text articles were cross-validated, again without disagreements.
The findings of our study are consistent with previous general reviews of clinical prediction models in finding limitations in the design, conduct or reporting of clinical prediction rules research [38, 39]. This lack of robust research is consistent with the development of several prediction models, but none of them being used in routine clinical practice. The situation in asthma is in contrast to other conditions within respiratory medicine such as pneumonia and pulmonary embolism where validated clinical prediction models are commonly used [40]. The success of these tools suggests progress could be made with regard to asthma exacerbations if a coordinated programme of research was undertaken. Our finding that logistic regression appears to be at least as successful for clinical prediction as more complex methods is also consistent with the limited available literature [41], though it fails to account for all the information collected along a patients’ journey such as timing of exacerbations.
Asthma is a very common chronic disease, and acute exacerbations are a major global source of morbidity and both direct and indirect healthcare costs. Providing individuals with a personalised risk assessment has the potential to improve clinical outcomes for those at higher risk, and reduce medication burden for those at lower risk. This has been recognised in the latest international Global Initiative for Asthma (GINA) asthma guidelines [42]. Given the major and increasing pressure on healthcare systems [43] further development of clinical prediction models for asthma appears to be a potentially valuable investment. This may be especially true in lower income countries where asthma is an increasing burden [44] and where risk factors may differ from those identified in North America and Europe [45].
Conclusion
Our summary of the current state of clinical prediction models for asthma highlights the need for further research at each stage of the development of a tool that would be of clinical use in the future. There is a pressing need for genuinely external validation of existing models in large, well-characterised and representative populations. Consideration must also be given to the best way of addressing the key real world issue of some individuals having multiple events within a specified time frame: their characteristics may be different from individuals that have one episode. There are also many unanswered questions regarding the best way to deploy such prediction tools in clinical practice, and much work to be done in demonstrating both effectiveness and cost-effectiveness as well as optimal presentation method.
Supplementary information
Additional file 1. Forest plot showing the performance of logistic regression vs. other models using the development data from each relevant study.
Acknowledgements
Not applicable.
Abbreviations
- ACCURATE
Asthma Control Cost-Utility Randomized Trial Evaluation
- AICc
Corrected Akaike’s Information Criterion
- CART
Classification And Regression Tree analysis
- CINAHL
Cumulative Index of Nursing and Allied Health Literature
- COPD
Chronic Obstructive Pulmonary Disorder
- GINA
Global Initiative for Asthma
- GRADE
Grading of Recommendations Assessment, Development and Evaluation
- MEDLINE
Medical Literature Analysis and Retrieval System Online
- PEF
Peak Expiratory Flow
- PRISMA
Preferred Reporting Items for Systematic Reviews and Meta-Analyses
- PROBAST
Prediction Study Risk of Bias Assessment Tool
- U-BIOPRED
Unbiased Biomarkers for the Prediction of Respiratory Disease Outcomes
Appendix 1
Medline search strategy example (Adapted from Ensor et al. [17])
1. Risk Assessment/ or Models, Statistical/ or (predict* or validat* or rule* or scor*).ti,ab. or ((predict* or multicomponent or multivariable) adj3 model*).mp. or (predict* adj5 (outcome* or risk* or model*)).ti,ab. or ((history or variable* or criteria or scor* or characteristic* or finding* or factor* or value*) adj5 (predict* or model* or decision* or identif* or prognos*)).ti,ab. or (decision* adj5 (model* or clinical* or logistic model*)).ti,ab. or (prognostic adj5 (history or variable* or criteria or scor* or characteristic* or finding* or factor* or model*)).ti,ab. or (observ* adj3 (variation or model*)).ti,ab.
2. asthm*.tw. and (exacerbat* or attack*).mp.
3. 1 and 2
Appendix 2
Data extraction
The data extraction form included the following elements:
Article information (e.g. Author, Title, Year of Publication)
Study information (e.g. Country, Sample size, Recruitment dates)
Study design characteristics (e.g. design, length of follow-up)
Patient characteristics (e.g. Ages, Sexes, Asthma diagnosis)
Predictors (Candidate, Final, Continuous/Dichotomous)
Statistical methods (Predictor selection, Fitting)
Models (Development/Validation, Risk Measure)
Model performance measures (Area under the receiver operating curve)
Authors’ contributions
JDB had the idea for the article. Analyses were undertaken by JB with support from LJB. All authors drafted, revised and approved the manuscript.
Funding
LJB was funded by a Post-Doctoral Fellowship (PDF-2015-08-044) from the National Institute for Health Research. The views expressed in this publication are those of the authors and not necessarily those of the NHS, or the National Institute for Health Research. The funding body had no role in the design of the study, in collecting, analysis and interpreting the data, and in writing the manuscript.
Availability of data and materials
The datasets created during the current study are available from the corresponding author on reasonable request.
Ethics approval and consent to participate
Not applicable.
Consent for publication
Not applicable.
Competing interests
The authors declare that they have no competing interests.
Footnotes
Publisher’s Note
Springer Nature remains neutral with regard to jurisdictional claims in published maps and institutional affiliations.
Contributor Information
Joshua Bridge, Email: Joshua.Bridge@liverpool.ac.uk.
John D. Blakey, Email: John.Blakey@health.wa.gov.au
Laura J. Bonnett, Email: L.J.Bonnett@liverpool.ac.uk
Supplementary information
Supplementary information accompanies this paper at 10.1186/s12874-020-0913-7.
References
- 1.Global Asthma Network . The global asthma report 2018. 2018. [Google Scholar]
- 2.James AL, Palmer LJ, Kicic E, Maxwell PS, Lagan SE, Ryan GF, et al. Decline in lung function in the Busselton health study: the effects of asthma and cigarette smoking. Am J Respir Crit Care Med. 2005;171(2):109–114. doi: 10.1164/rccm.200402-230OC. [DOI] [PubMed] [Google Scholar]
- 3.O'Byrne PM, Pedersen S, Lamm CJ, Tan WC, Busse WW. Severe exacerbations and decline in lung function in asthma. Am J Respir Crit Care Med. 2009;179(1):19–24. doi: 10.1164/rccm.200807-1126OC. [DOI] [PubMed] [Google Scholar]
- 4.Bai T, Vonk J, Postma D, Boezen H. Severe exacerbations predict excess lung function decline in asthma. Eur Respir J. 2007;30:452–456. doi: 10.1183/09031936.00165106. [DOI] [PubMed] [Google Scholar]
- 5.Thomas M, Bruton A, Moffatt M, Cleland J. Asthma and psychological dysfunction. Prim Care Respir J. 2011;20(3):250. doi: 10.4104/pcrj.2011.00058. [DOI] [PMC free article] [PubMed] [Google Scholar]
- 6.Greaves C, Eiser C, Seamark D, Halpin D. Attack context: an important mediator of the relationship between psychological status and asthma outcomes. Thorax. 2002;57(3):217–221. doi: 10.1136/thorax.57.3.217. [DOI] [PMC free article] [PubMed] [Google Scholar]
- 7.Bahadori K, Doyle-Waters MM, Marra C, Lynd L, Alasaly K, Swiston J, et al. Economic burden of asthma: a systematic review. BMC Pulm Med. 2009;9(1):24. doi: 10.1186/1471-2466-9-24. [DOI] [PMC free article] [PubMed] [Google Scholar]
- 8.Nunes C, Pereira AM, Morais-Almeida M. Asthma costs and social impact. Asthma Res Pract. 2017;3(1):1. doi: 10.1186/s40733-016-0029-3. [DOI] [PMC free article] [PubMed] [Google Scholar]
- 9.Royal College of Physicians . National review of asthma deaths. 2014. [Google Scholar]
- 10.Thomas M. Why aren’t we doing better in asthma: time for personalised medicine? NPJ Prim Care Respir Med. 2015;25:15004. doi: 10.1038/npjpcrm.2015.4. [DOI] [PMC free article] [PubMed] [Google Scholar]
- 11.Blakey JD, Woolnough K, Fellows J, Walker S, Thomas M, Pavord ID. Assessing the risk of attack in the management of asthma: a review and proposal for revision of the current control-centred paradigm. Prim Care Respir J. 2013;22(3):344–352. doi: 10.4104/pcrj.2013.00063. [DOI] [PMC free article] [PubMed] [Google Scholar]
- 12.Royston P, Moons KG, Altman DG, Vergouwe Y. Prognosis and prognostic research: developing a prognostic model. BMJ. 2009;338:b604. doi: 10.1136/bmj.b604. [DOI] [PubMed] [Google Scholar]
- 13.Hemingway H, Croft P, Perel P, Hayden JA, Abrams K, Timmis A, et al. Prognosis research strategy (PROGRESS) 1: a framework for researching clinical outcomes. BMJ. 2013;346:e5595. doi: 10.1136/bmj.e5595. [DOI] [PMC free article] [PubMed] [Google Scholar]
- 14.National Institute for Health and Care Excellence . Asthma: diagnosis, monitoring and chronic asthma management. 2017. [PubMed] [Google Scholar]
- 15.Canadian Agency for Drugs and Technologies in Health Long-acting beta2-agonist and inhaled corticosteroid combination therapy for adult persistent asthma: systematic review of clinical outcomes and economic evaluation. CADTH Technol Overv. 2010;1(3):e0120. [PMC free article] [PubMed] [Google Scholar]
- 16.Guyatt GH, Oxman AD, Vist GE, Kunz R, Falck-Ytter Y, Alonso-Coello P, et al. GRADE: an emerging consensus on rating quality of evidence and strength of recommendations. BMJ. 2008;336(7650):924–926. doi: 10.1136/bmj.39489.470347.AD. [DOI] [PMC free article] [PubMed] [Google Scholar]
- 17.Ensor J, Riley RD, Moore D, Snell KI, Bayliss S, Fitzmaurice D. Systematic review of prognostic models for recurrent venous thromboembolism (VTE) post-treatment of first unprovoked VTE. BMJ Open. 2016;6(5):e011190. doi: 10.1136/bmjopen-2016-011190. [DOI] [PMC free article] [PubMed] [Google Scholar]
- 18.Riley RD, Higgins JP, Deeks JJ. Interpretation of random effects meta-analyses. BMJ. 2011;342:d549. doi: 10.1136/bmj.d549. [DOI] [PubMed] [Google Scholar]
- 19.Hurvich CM, Tsai C-L. Regression and time series model selection in small samples. Biometrika. 1989;76(2):297–307. doi: 10.1093/biomet/76.2.297. [DOI] [Google Scholar]
- 20.Mendoza N. Failure of peak flow meter in predicting asthma attacks in selected pediatric inner-city population. Ann Allergy. 1984;45:906-25.
- 21.Frey U. Predicting asthma control and exacerbations: chronic asthma as a complex dynamic model. Curr Opin Allergy Clin Immunol. 2007;7(3):223–230. doi: 10.1097/ACI.0b013e32810fd771. [DOI] [PubMed] [Google Scholar]
- 22.Bateman ED, Buhl R, O'byrne PM, Humbert M, Reddel HK, Sears MR, et al. Development and validation of a novel risk score for asthma exacerbations: the risk score for exacerbations. J Allergy Clin Immunol. 2015;135(6):1457–64.e4. doi: 10.1016/j.jaci.2014.08.015. [DOI] [PubMed] [Google Scholar]
- 23.Blakey JD, Price DB, Pizzichini E, Popov TA, Dimitrov BD, Postma DS, et al. Identifying risk of future asthma attacks using UK medical record data: a respiratory effectiveness group initiative. J Allergy Clin Immunol Pract. 2017;5(4):1015–24.e8. doi: 10.1016/j.jaip.2016.11.007. [DOI] [PubMed] [Google Scholar]
- 24.Finkelstein J. Machine learning approaches to personalize early prediction of asthma exacerbations. Ann N Y Acad Sci. 2017;1387(1):153–165. doi: 10.1111/nyas.13218. [DOI] [PMC free article] [PubMed] [Google Scholar]
- 25.Finkelstein J, Wood J. Predicting asthma exacerbations using artificial intelligence. ICIMTH. 2013;190:56–58. [PubMed] [Google Scholar]
- 26.Honkoop PJ, Taylor DR, Smith AD, Snoeck-Stroband JB, Sont JK. Early detection of asthma exacerbations by using action points in self-management plans. Eur Respir J. 2013;41(1):53–59. doi: 10.1183/09031936.00205911. [DOI] [PubMed] [Google Scholar]
- 27.Loymans Rik J B, Honkoop Persijn J, Termeer Evelien H, Snoeck-Stroband Jiska B, Assendelft Willem J J, Schermer Tjard R J, Chung Kian Fan, Sousa Ana R, Sterk Peter J, Reddel Helen K, Sont Jacob K, ter Riet Gerben. Identifying patients at risk for severe exacerbations of asthma: development and external validation of a multivariable prediction model. Thorax. 2016;71(9):838–846. doi: 10.1136/thoraxjnl-2015-208138. [DOI] [PubMed] [Google Scholar]
- 28.McCarren M, McDermott MF, Zalenski RJ, Jovanovic B, Marder D, Murphy DG, et al. Prediction of relapse within eight weeks after an acute asthma exacerbation in adults. J Clin Epidemiol. 1998;51(2):107–118. doi: 10.1016/S0895-4356(97)00246-1. [DOI] [PubMed] [Google Scholar]
- 29.Sato R, Tomita K, Sano H, Ichihashi H, Yamagata S, Sano A, et al. The strategy for predicting future exacerbation of asthma using a combination of the asthma control test and lung function test. J Asthma. 2009;46(7):677–682. doi: 10.1080/02770900902972160. [DOI] [PubMed] [Google Scholar]
- 30.Yii AC, Tan JH, Lapperre TS, Chan AK, Low SY, Ong TH, et al. Long-term future risk of severe exacerbations: distinct 5-year trajectories of problematic asthma. Allergy. 2017;72(9):1398–1405. doi: 10.1111/all.13159. [DOI] [PMC free article] [PubMed] [Google Scholar]
- 31.Kew KM, Cates CJ. Home telemonitoring and remote feedback between clinic visits for asthma. Cochrane Database Syst Rev The Cochrane Library. 2016. 10.1002/14651858.CD011714.pub2. [DOI] [PMC free article] [PubMed]
- 32.Subbarao P, Mandhane PJ, Sears MR. Asthma: epidemiology, etiology and risk factors. CMAJ. 2009;181(9):E181–EE90. doi: 10.1503/cmaj.080612. [DOI] [PMC free article] [PubMed] [Google Scholar]
- 33.Peduzzi P, Concato J, Kemper E, Holford TR, Feinstein AR. A simulation study of the number of events per variable in logistic regression analysis. J Clin Epidemiol. 1996;49(12):1373–1379. doi: 10.1016/S0895-4356(96)00236-3. [DOI] [PubMed] [Google Scholar]
- 34.Van Calster B, Nieboer D, Vergouwe Y, De Cock B, Pencina MJ, Steyerberg EW. A calibration hierarchy for risk models was defined: from utopia to empirical data. J Clin Epidemiol. 2016;74:167–176. doi: 10.1016/j.jclinepi.2015.12.005. [DOI] [PubMed] [Google Scholar]
- 35.Collins GS, Ogundimu EO, Altman DG. Sample size considerations for the external validation of a multivariable prognostic model: a resampling study. Stat Med. 2016;35(2):214–226. doi: 10.1002/sim.6787. [DOI] [PMC free article] [PubMed] [Google Scholar]
- 36.Harrell FE., Jr . Regression modeling strategies: with applications to linear models, logistic regression, and survival analysis. New York: Springer; 2001. [Google Scholar]
- 37.Hanley JA, Mcneil BJ. The meaning and use of the area under a receiver operating characteristic (roc) curve. Radiology. 1982;143(1):29–36. doi: 10.1148/radiology.143.1.7063747. [DOI] [PubMed] [Google Scholar]
- 38.Bouwmeester W, Zuithoff NP, Mallett S, Geerlings MI, Vergouwe Y, Steyerberg EW, et al. Reporting and methods in clinical prediction research: a systematic review. PLoS Med. 2012;9(5):e1001221. doi: 10.1371/journal.pmed.1001221. [DOI] [PMC free article] [PubMed] [Google Scholar]
- 39.Collins GS, de Groot JA, Dutton S, Omar O, Shanyinde M, Tajar A, et al. External validation of multivariable prediction models: a systematic review of methodological conduct and reporting. BMC Med Res Methodol. 2014;14:40. doi: 10.1186/1471-2288-14-40. [DOI] [PMC free article] [PubMed] [Google Scholar]
- 40.Hendriksen JM, Geersing G-J, Lucassen WA, Erkens PM, Stoffers HE, Van Weert HC, et al. Diagnostic prediction models for suspected pulmonary embolism: systematic review and independent external validation in primary care. BMJ. 2015;351:h4438. doi: 10.1136/bmj.h4438. [DOI] [PMC free article] [PubMed] [Google Scholar]
- 41.Ayer T, Chhatwal J, Alagoz O, Kahn CE, Jr, Woods RW, Burnside ES. Comparison of logistic regression and artificial neural network models in breast cancer risk estimation. Radiographics. 2010;30(1):13–22. doi: 10.1148/rg.301095057. [DOI] [PMC free article] [PubMed] [Google Scholar]
- 42.Global Innitiative for Asthma (GINA) Global burden of asthma. 2004. [Google Scholar]
- 43.Smith P, McKeon A, Blunt I, Edwards N. NHS hospitals under pressure: trends in acute activity up to 2022. 2014. [Google Scholar]
- 44.Cooper P, Rodrigues L, Cruz A, Barreto M. Asthma in Latin America: a public heath challenge and research opportunity. Allergy. 2009;64(1):5–17. doi: 10.1111/j.1398-9995.2008.01902.x. [DOI] [PubMed] [Google Scholar]
- 45.Ardura-Garcia Cristina, Arias Erick, Hurtado Paola, Bonnett Laura J., Sandoval Carlos, Maldonado Augusto, Workman Lisa J., Platts-Mills Thomas A.E., Cooper Philip J., Blakey John D. Predictors of severe asthma attack re-attendance in Ecuadorian children: a cohort study. European Respiratory Journal. 2019;54(5):1802419. doi: 10.1183/13993003.02419-2018. [DOI] [PMC free article] [PubMed] [Google Scholar]
Associated Data
This section collects any data citations, data availability statements, or supplementary materials included in this article.
Supplementary Materials
Additional file 1. Forest plot showing the performance of logistic regression vs. other models using the development data from each relevant study.
Data Availability Statement
The datasets created during the current study are available from the corresponding author on reasonable request.