Abstract
Microglia, as the resident brain immune cells, can exhibit a broad range of activation phenotypes, which have been implicated in a multitude of central nervous system disorders. Current widely studied microglial cell lines are mainly derived from neonatal rodent brain which can limit their relevance to homeostatic function and disease-related neuroimmune responses in the adult brain. Recently, an adult mouse brain-derived microglial cell line was established; however, a comprehensive proteome dataset remains lacking. We here describe an optimization method for sensitive and rapid quantitative proteomic analysis of microglia that involves suspension trapping (S-Trap) for efficient and reproducible protein extraction from a limited number of microglial cells expected from an adult mouse brain (~300K). Using a 2-hr gradient on a 75-cm UPLC column with a modified data dependent acquisition method on a hybrid quadrupole-Orbitrap mass spectrometer, 4,855 total proteins were identified where 4,698 of which were quantifiable by label-free quantitation with a median and average CV of 6.7% and 10.6%, respectively. This dataset highlights the high depth of proteome coverage and related quantitation precision of the adult-derived microglial proteome including proteins associated with several key pathways related to immune response. Data are available via ProteomeXchange with identifier PXD012006.
Keywords: Glia, Proteomics, Microglia, IMG, Neuroinflammation
Microglia play a critical role in mediating homeostatic and neuroimmune responses within the central nervous system (CNS) [1]. Given the wide spectrum of microglial activation phenotypes that can be exhibited in response to various stimuli, characterizing the molecular profile at a detailed level is of critical importance in order to understand phenotypic responses related to normal functions of microglia as well as their role in CNS diseases [2]. Several rodent microglial cell lines such as BV2 and HAPI cells have been established in order to investigate microglia function in vitro [3]; however, most of these models are neonatal-derived and may not adequately depict phenotypic responses of microglia associated with adult-onset disease pathogenesis. Recently, an adult-derived mouse immortalized microglial (IMG) cell line was established [4]. IMG cells were shown to express known microglial markers including CD11b while devoid of astrocytic and neuronal markers. Additionally, IMG cells demonstrated a robust response to pro- and anti-inflammatory stimuli and were phagocytic towards amyloid-beta oligomers. To date, however, detailed proteomic characterization of this microglial model has not been reported. We therefore sought to optimize both sample processing and data acquisition for a limited microglial cell population comparable to that expected from an adult mouse brain (~300K) in order to demonstrate the general applicability of this approach for rapid and sensitive proteomic analysis of microglia as well as to provide the first comprehensive proteome dataset of IMG microglial cells.
IMG microglial cells were maintained in Dulbecco’s Modified Eagle’s Media (DMEM) supplemented with 10% fetal bovine serum, 50 U/ml penicillin and 50 μg/ml streptomycin at 37°C and 5% CO2. Cells were grown to near confluence in 75-cm2 flasks, rinsed 3x with phosphate buffered saline, detached with 0.25% trypsin-0.1% EDTA, and counted. Aliquots of ~300K cell-containing suspensions were pelleted and flash-frozen in liquid nitrogen. Cells grown in individual culture flasks were considered biological replicates.
Cell pellets were processed using the suspension trap (S-Trap, ProtiFi) [5] micro spin column digestion protocol with minor modifications. In brief, cells were lysed in 50μL 50mM ammonium bicarbonate (ABC) buffer, pH 7.5, containing 5% sodium dodecyl sulfate (SDS). DNA was sheared thoroughly by probe sonication. The amount of protein from 300K cells was 28.76 ± 1.62 μg (n=3) as determined by the Pierce 660nm Protein Assay with ionic detergent compatibility reagent using bovine serum albumin as a standard (Thermo Fisher). Samples were then reduced and alkylated with dithiothreitol and iodoacetamide, respectively. Samples were centrifuged and transferred to a new tube followed by addition of 12% aqueous phosphoric acid to a final concentration of 1.2%. Six times the volume of S-Trap protein binding buffer was then added to the acidified protein. The sample mixture was added to the S-Trap micro column (multiple aliquots and centrifugation steps until all protein from solution was bound) and washed with 150μL S-Trap buffer; centrifugation and removal of the flow through was then repeated for a total of 4 rounds. Twenty μL of digestion buffer containing 50mM ABC with 1μg Trypsin/Lys-C protease (Promega) was added to the micro column. The S-Trap micro column was then capped to limit evaporative loss without forming an air tight seal and incubated in a heat block for 1hr at 47°C. After digestion, peptides were eluted from the micro column and collected in the same tube to prevent transfer loss. Eluted peptides were centrifuged under vacuum until dried and then resuspended in 0.1% formic acid in H2O.
Digested samples were pre-concentrated on a 2 cm × 75 μm ID PepMap C18 trap column (Thermo) and then separated on a 75 cm × 75 μm ID PepMap column (Thermo) packed with 2 μm, 100 Å C18 material at a heated column temperature of 55°C using an Ultimate 3000 UPLC system (Thermo). Peptides were separated using a 120-min gradient from 2 to 28% B (B is 0.1% formic acid in 80% acetonitrile/20% water) with inline mass spectrometric analysis performed on a hybrid quadrupole-Orbitrap instrument (Q Exactive Plus, Thermo) employing both conventional and modified (segmented) data-dependent acquisition (DDA) approaches. In the conventional mode of DDA, a top 15 method was utilized spanning the m/z range of 375–1200 where the precursor MS scan was performed at 70K resolution followed by MS/MS scans at 17.5K resolution. In the segmented approach, the scan ranges were spit into 3 ranges for DDA: m/z 375–600, m/z 600–800, and m/z 800–1200. For the first two ranges containing higher peptide densities, a top 6 DDA method was used followed by top 3 in the m/z 800–1200 range. Schematic representations of both data acquisition approaches are shown in Supplemental Figure 1. Full MS and MS/MS resolution as well as AGC and maximum IT settings (values embedded in raw files) were comparable to those used in the conventional DDA; however, the MS/MS maximum IT was increased from 50ms to 100ms in the m/z 800–1200 range. The segmented method results in a higher number of features detected and additional peptide identifications based on enhanced dynamic range, particularly in the m/z 800–1200 range (Supplementary Figure 1), but lower overall protein identifications because of the increased DDA cycle time using 3 full MS scans at 70K resolution. Based on improved feature detection, however, the inclusion of the segmented DDA analysis as a technical replicate complements the conventional Top 15 analysis and improves overall proteome coverage and reproducible low-abundant protein detection across multiple biological replicates. The mass spectrometry proteomics data have been deposited to the ProteomeXchange Consortium via the PRIDE [6] partner repository with the dataset identifier PXD012006.
Raw files were searched against the UniprotKB protein database for Mus musculus (UP000000589 with 53,096 entries) using MaxQuant (version 1.6.1.0). The conventional DDA and segmented DDA files were included as technical replicates for each biological replicate (n=3) in the MaxQuant analysis. Constant modification of cysteine by carbamidomethylation and the variable modification of N-terminal protein acetylation and methionine oxidation were employed. A second database of known contaminants provided with MaxQuant was also employed in the search. The first search tolerance was set to 20 ppm followed by a main search tolerance of 4.5 ppm. A decoy database search strategy using reversed sequences was employed to achieve protein and peptide FDR values of less than 1%. LFQ-based quantitation was enabled (minimum ratio count of 1) in addition to the “match-between-runs” feature using default settings. The ProteinGroups text file was then uploaded into Perseus (version 1.6.1.1) after removal of reverse and contaminant sequences as well as proteins only identified by modification. LFQ values were log2-transformed and proteins with missing values in more than just 1 out of the 3 replicates were removed. Missing values were then replaced using the imputation function in Perseus with width and downshift parameters set to 0.3 and 1.8, respectively. Filtered lists were uploaded to Ingenuity Pathway Analysis (IPA) in order to determine over-represented canonical pathways as well as other biological and disease functions (p<0.05, Fisher’s exact test). Pre- and post-Perseus protein lists, peptide identifications and annotated dataset files from IPA are provided as supplementary information (Supplementary Tables 1-4).
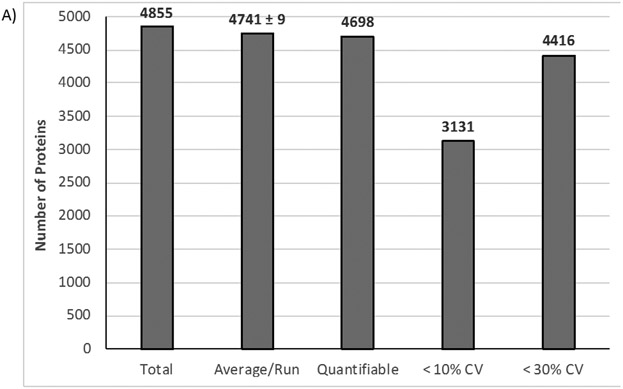
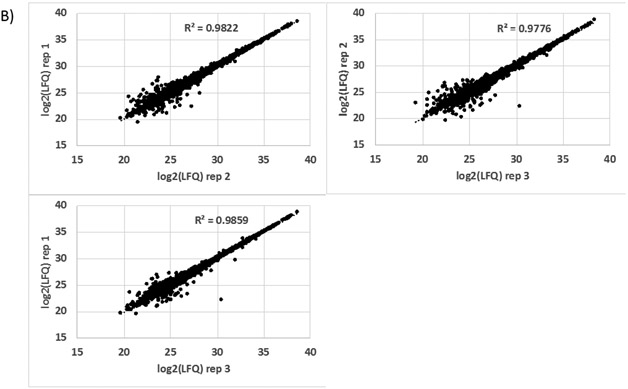
Overall, 4,855 unique proteins and 46,090 peptides were identified from three biological replicates excluding known contaminants. After Perseus filtering, 4,698 proteins were quantifiable with an average CV of 10.6% based on LFQ values. Figure 1A summarizes the protein identification results and shows an average identification rate of approximately 4,700 proteins per biological replicate with 67% and 94% of those proteins quantifiable at 10% and 30% CV or less, respectively. In terms of LFQ intensity measurement reproducibility, Figure 1B shows correlation plots of log2-transformed LFQ intensities comparing the three biological replicates. The R2 values from these plots were > 0.97, demonstrating high reproducibility of LFQ measurements across the three biological replicates utilized in this study. There are several advantages to the S-Trap approach, which was introduced for shotgun proteomics fairly recently [10, 11], that lends itself to higher sensitivity and reproducibility. First, 5% SDS is utilized for efficient protein extraction and solubilization of membrane/hydrophobic proteins. Related to this, the S-Trap processing including SDS removal is performed in the same column with no additional desalting step required and therefore minimizes sample transfer loss and related variability. Second, rapid digestion and peptide recovery is achieved for cell count numbers where low (μg) protein amounts are generated. The extracted protein amount for 300K cells such as microglia in this study (also within the range of anticipated microglial cell count from a single mouse brain) was suitable to achieve reproducible, deep proteome coverage for multiple technical replicate injections as well as additional sample that can be used for validation of targets of interest (e.g., MRM or PRM). Moreover, post-lysis sample processing including digestion and vacuum centrifugation to dry samples can potentially be performed in a few hours (depending on sample quantity). Given the enhanced sensitivity and time savings of the S-trap technique, we envision this approach can be effectively adapted for rapid, proteomics-based phenotypic screening of microglia in various applications such as drug discovery and development.
Figure 1.
A) Protein identification and precision metrics for proteomic analysis of IMG cells (n=3 biological replicates). B) Correlation plots showing protein abundance measurement (LFQ value from MaxQuant) reproducibility across multiple biological replicates.
The annotated dataset file used for IPA analysis (Supplemental Table 4) shows the cellular localization information as well as general function (if known) for all mapped proteins identified from the proteomic analysis of IMG cells. The annotation of location and function is derived from the Ingenuity Knowledge Base. It is important to note that several key microglial markers were identified including HEXB, TREM2 and ITGAM (CD11b) [7]. In addition to previous proteome datasets for rat and mouse neonatal-derived microglia [8], recent studies have investigated proteomic changes in adult-derived microglia in the context of aging, neurodegenerative disorders, and sex differences [9, 10]. IPA analysis of the latter two datasets [10] were performed in order to compare enriched canonical pathways, upstream regulators, and also bio-functions (Supplemental Table 5). Several key pathways and functions as well as upstream regulators (e.g., p53, a known regulator of microglial activation phenotype [11]) that are relevant to microglial function were identified and show comparable enrichment for a majority of these pathways.
In order to determine enriched pathways based on low-abundance proteins, we performed IPA analysis of the bottom 500 proteins from the IMG dataset in terms of LFQ intensity. Several canonical pathways were enriched including TNFR1 and TNFR2 signaling as well as the sumoylation pathway (Supplemental Table 6). TNFR2, in particular, is an important receptor that regulates the expression of anti-inflammatory and neuroprotective genes important to the microglial immune response [12]. Compared to previously reported studies, we were able to identify statistically significant enrichment of this pathway (Supplemental Figure 2). In addition to TNFR2 signaling, the sumoylation pathway was enriched (p=0.00025) from the lower abundance IMG-derived proteins. Sumoylation has been shown to play an important role in the innate immune response of myeloid cells [13]; however, literature is scarce on the role of this modification in regulating microglial activation.
The data reported here establish the first-ever proteome for the adult-derived IMG microglial cell line, demonstrating potential applicability of IMG cells as an in vitro model based on bioinformatics-based comparison with primary adult-derived microglial cells. As with any cell line model, there are anticipated differences in protein expression patterns and pathway representation when compared to its primary cell counterpart; however, we envision the reported bioinformatic comparison can allow for researchers in the field to assess relevant pathways of interest and determine the suitability of IMG as an in vitro model. Additionally, we demonstrate the utility of our sample processing and data acquisition approaches to achieve highly reproducible, quantifiable proteome coverage from the number of microglial cells typically harvested from one mouse brain (recognizing that the transformed microglia used in this study have potentially larger cell size and total protein amount), which is comparable or exceeds those reported where microglial sample pooling from multiple mouse brains and/or extensive processing/fractionation prior to mass spectrometric analysis was performed [10].
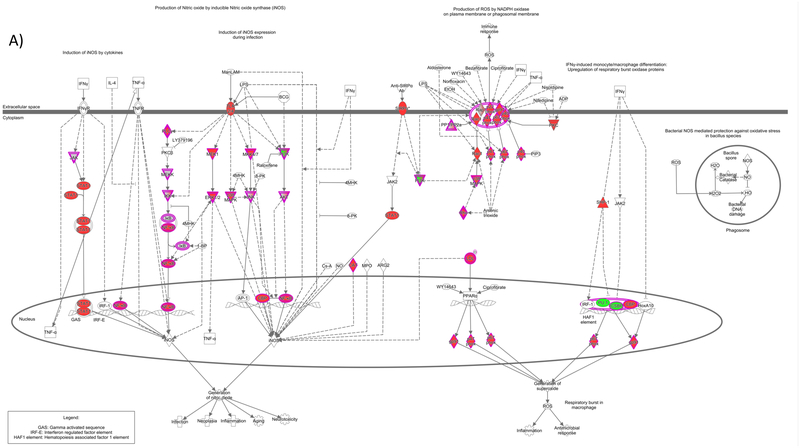
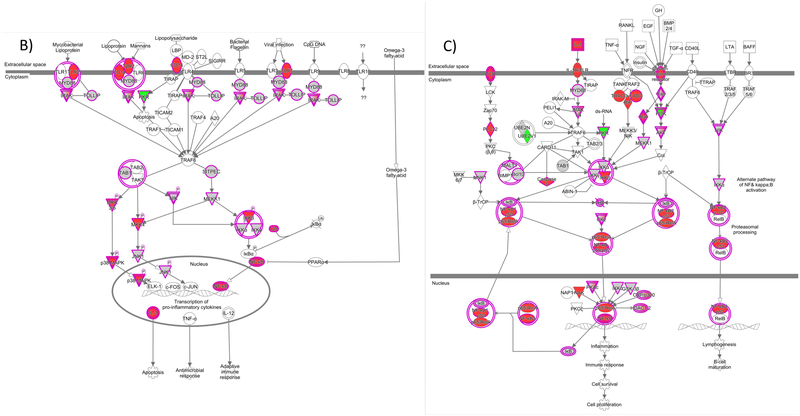
We next highlight fundamental immune response pathways in terms of coverage and quantitation precision of proteins within those pathways. Figure 2 demonstrates this information for canonical pathways associated with A) production of ROS and RNS, B) Toll-like receptor signaling, and C) NF-κB signaling. The individual protein nodes within each pathway are color-coded based on %CV value where red, grey, and green represent CV ranges of <10%, 10–30%, and >30%, respectively. For each pathway, there is high quantitation precision for a large percentage of proteins involved. For example, in Figure 2A, proteins within the NADPH oxidase complex, which is a major ROS generator in activated macrophages/microglia, are quantifiable at <10% CV. Additionally, key signaling proteins and transcriptional regulators such as MAPKs and STAT1, respectively, show high quantitation precision within the cytokine and LPS-mediated iNOS induction pathways. Further emphasis on Toll-like receptor and NF-κB signaling in Figure 2B and 2C demonstrates high quantitation precision for TLR2, TLR7, and CD14 in addition to NF-κB itself. Adequate precision was also obtained for several downstream effectors in these pathways; however, identification of certain proteins was limited given we are characterizing baseline expression in “resting” microglia and not those that are induced or significantly upregulated through inflammatory stimuli such as LPS. Nevertheless, the results presented here demonstrate the utility of our approach and relevance of the IMG cell model for microglial phenotype characterization studies where subtle changes in protein expression can potentially be detected with minimal number of replicates.
Figure 2.
Ingenuity Pathway Analysis identification of the enriched canonical pathways A) Production of ROS/RNS, B) Toll-like receptor signaling, and C) NF-κB signaling. Red, grey, and green nodes represent proteins within the pathway that were detected at <10%, 10-30%, and >30% CV, respectively.
In summary, we present an improved methodology that allows for rapid and reproducible extraction and digestion of proteins isolated from adult-derived mouse microglia. The method allows for detection of over 4,500 proteins with high quantitation precision in a ~2 hr LC gradient with no fractionation and can be adapted for future work in rapid phenotypic screening assays for investigating microglial activation phenotype in disease models as well as drug discovery efforts intended to modulate activation phenotype. We also envision this approach, given the enhanced sensitivity and reproducibility, will be potentially applicable for brain region-specific quantitative proteomic profiling of microglia from rodent animal models of disease. Moreover, the dataset reported here for the IMG cell line can be used to advance our understanding of microglial biology and potential role in CNS diseases.
Supplementary Material
Supplemental Table 1. MaxQuant Protein Groups file (unfiltered)
Supplemental Table 2. Perseus-filtered Protein Groups file
Supplemental Table 3. MaxQuant identified peptides
Supplemental Table 4. Annotated IPA list of all proteins
Supplemental Table 5. IPA comparison of IMG dataset to recent studies in primary microglia
Supplemental Table 6. IPA analysis of low abundance proteins (bottom 500 in terms of LFQ intensity) from the IMG dataset
Acknowledgments
We would like to acknowledge funding provided by NIH/NIAAA (R01AA026082 and R21AA025183).
Footnotes
The authors declare no conflict of interest
References
- [1].Wolf SA, Boddeke HW, Kettenmann H, Annu Rev Physiol 2017, 79, 619; [DOI] [PubMed] [Google Scholar]; Liu B, Hong JS, J Pharmacol Exp Ther 2003, 304, 1; [DOI] [PubMed] [Google Scholar]; Li Q, Barres BA, Nat Rev Immunol 2018, 18, 225. [DOI] [PubMed] [Google Scholar]
- [2].Salter MW, Stevens B, Nat Med 2017, 23, 1018; [DOI] [PubMed] [Google Scholar]; Hamelin L, Lagarde J, Dorothee G, Potier MC, Corlier F, Kuhnast B, Caille F, Dubois B, Fillon L, Chupin M, Bottlaender M, Sarazin M, Brain 2018, 141, 1855; [DOI] [PubMed] [Google Scholar]; Dheen ST, Kaur C, Ling EA, Curr Med Chem 2007, 14, 1189. [DOI] [PubMed] [Google Scholar]
- [3].Blasi E, Barluzzi R, Bocchini V, Mazzolla R, Bistoni F, J Neuroimmunol 1990, 27, 229; [DOI] [PubMed] [Google Scholar]; Cheepsunthorn P, Radov L, Menzies S, Reid J, Connor JR, Glia 2001, 35, 53. [DOI] [PubMed] [Google Scholar]
- [4].McCarthy RC, Lu DY, Alkhateeb A, Gardeck AM, Lee CH, Wessling-Resnick M, J Neuroinflammation 2016, 13, 21. [DOI] [PMC free article] [PubMed] [Google Scholar]
- [5].HaileMariam M, Eguez RV, Singh H, Bekele S, Ameni G, Pieper R, Yu Y, J Proteome Res 2018, 17, 2917; [DOI] [PubMed] [Google Scholar]; Zougman A, Selby PJ, Banks RE, Proteomics 2014, 14, 1006. [DOI] [PubMed] [Google Scholar]
- [6].Vizcaino JA, Csordas A, Del-Toro N, Dianes JA, Griss J, Lavidas I, Mayer G, Perez-Riverol Y, Reisinger F, Ternent T, Xu QW, Wang R, Hermjakob H, Nucleic Acids Res 2016, 44, 11033. [DOI] [PMC free article] [PubMed] [Google Scholar]
- [7].Hickman SE, Kingery ND, Ohsumi TK, Borowsky ML, Wang LC, Means TK, El Khoury J, Nat Neurosci 2013, 16, 1896. [DOI] [PMC free article] [PubMed] [Google Scholar]
- [8].Bell-Temin H, Barber DS, Zhang P, Liu B, Stevens SM Jr., Proteomics 2012, 12, 246; [DOI] [PubMed] [Google Scholar]; Bell-Temin H, Zhang P, Chaput D, King MA, You M, Liu B, Stevens SM Jr., J Proteome Res 2013, 12, 2067; [DOI] [PubMed] [Google Scholar]; Han D, Moon S, Kim Y, Kim J, Jin J, Kim Y, Proteomics 2013, 13, 2984. [DOI] [PubMed] [Google Scholar]
- [9].Flowers A, Bell-Temin H, Jalloh A, Stevens SM Jr., Bickford PC, J Neuroinflammation 2017, 14, 96. [DOI] [PMC free article] [PubMed] [Google Scholar]
- [10].Guneykaya D, Ivanov A, Hernandez DP, Haage V, Wojtas B, Meyer N, Maricos M, Jordan P, Buonfiglioli A, Gielniewski B, Ochocka N, Comert C, Friedrich C, Artiles LS, Kaminska B, Mertins P, Beule D, Kettenmann H, Wolf SA, Cell Rep 2018, 24, 2773; [DOI] [PubMed] [Google Scholar]; Rangaraju S, Dammer EB, Raza SA, Gao T, Xiao H, Betarbet R, Duong DM, Webster JA, Hales CM, Lah JJ, Levey AI, Seyfried NT, Mol Neurodegener 2018, 13, 34. [DOI] [PMC free article] [PubMed] [Google Scholar]
- [11].Jayadev S, Nesser NK, Hopkins S, Myers SJ, Case A, Lee RJ, Seaburg LA, Uo T, Murphy SP, Morrison RS, Garden GA, Glia 2011, 59, 1402. [DOI] [PMC free article] [PubMed] [Google Scholar]
- [12].Veroni C, Gabriele L, Canini I, Castiello L, Coccia E, Remoli ME, Columba-Cabezas S, Arico E, Aloisi F, Agresti C, Mol Cell Neurosci 2010, 45, 234; [DOI] [PubMed] [Google Scholar]; Gao H, Danzi MC, Choi CS, Taherian M, Dalby-Hansen C, Ellman DG, Madsen PM, Bixby JL, Lemmon VP, Lambertsen KL, Brambilla R, Cell Rep 2017, 18, 198. [DOI] [PMC free article] [PubMed] [Google Scholar]
- [13].Decque A, Joffre O, Magalhaes JG, Cossec JC, Blecher-Gonen R, Lapaquette P, Silvin A, Manel N, Joubert PE, Seeler JS, Albert ML, Amit I, Amigorena S, Dejean A, Nat Immunol 2016, 17, 140. [DOI] [PubMed] [Google Scholar]
Associated Data
This section collects any data citations, data availability statements, or supplementary materials included in this article.
Supplementary Materials
Supplemental Table 1. MaxQuant Protein Groups file (unfiltered)
Supplemental Table 2. Perseus-filtered Protein Groups file
Supplemental Table 3. MaxQuant identified peptides
Supplemental Table 4. Annotated IPA list of all proteins
Supplemental Table 5. IPA comparison of IMG dataset to recent studies in primary microglia
Supplemental Table 6. IPA analysis of low abundance proteins (bottom 500 in terms of LFQ intensity) from the IMG dataset


