Abstract
The intestinal microbiota is a complex community of bacteria, archaea, viruses, protists and fungi1,2. While the composition of bacterial constituents has been linked to immune homeostasis and to infectious susceptibility3–7, the role of non-bacterial constituents and of cross-kingdom microbial interactions in these processes is poorly understood2,8. Fungi represent a major cause of infectious morbidity and mortality in immune-compromised individuals, though the relationship of intestinal fungi (i.e., the mycobiota) with fungal bloodstream infections (BSI) remains undefined9. We integrated an optimized bioinformatics pipeline with high-resolution mycobiota sequencing and comparative genomic analyses of fecal and blood specimens from recipients of allogeneic hematopoietic cell transplant (allo-HCT). Patients with Candida BSI experienced a prior marked intestinal expansion of pathogenic Candida species; this expansion consisted of a complex dynamic between multiple species and subspecies with a stochastic translocation pattern into the bloodstream. The intestinal expansion of pathogenic Candida species was associated with a significant loss in bacterial burden and diversity, particularly in the anaerobes. Thus, simultaneous analysis of intestinal fungi and bacteria identifies dysbiosis states across kingdoms that may promote fungal translocation and facilitate invasive disease. These findings support microbiota-driven approaches to identify patients at risk for fungal BSI for pre-emptive therapeutic intervention.
Introduction:
Advances in medical technologies such as chemotherapy and organ transplantation have coincided with a substantial increase in the incidence of invasive fungal infections10,11. Candida is the 4th most common etiologic agents of all nosocomial BSIs12. The global outbreak of multidrug-resistant Candida species highlights the need for accurate methodologies to trace the sources and spread of pathogenic fungi in hospitals and long-term care facilities13. Since Candida exposure is ubiquitous, the high attributable morbidity and mortality has led to universal prophylaxis strategies in patients at high risk, e.g. allo-HCT recipients14,15. Previous studies have demonstrated that marked shifts occur in the composition, density, and diversity of the intestinal bacterial community during allo-HCT, and that expansion of bacterial pathobionts predispose to bacterial BSIs16–18. In contrast, the dynamic relationship between the human intestinal fungi and bacteria, and invasive fungal disease remains poorly defined. If the intestinal tract acted as the dominant source of BSI, a prediction of this model would be that enteric samples would contain evidence of the etiologic agent of BSI prior to vascular translocation. An alternate model with a non-enteric source of BSI would predict that the etiologic agent would be absent in enteric samples or emerge after the onset of BSI.
Results:
To examine the relationship between the intestinal mycobiota and fungal BSIs, we performed a nested case-control study, consisting of eight case patients with candidemia, and seven patients without candidemia, selected from subjects within the prospective fecal sample collection cohort (as described in previous studies18–20). Selected subjects underwent allo-HCT between January 1, 2014, and December 31, 2017 (clinical characteristics shown in Supplementary Table 1). There were no major differences in the patient characteristics in the case and control groups, with exception of gender (Supplementary Table 1). Per institutional guidelines, all patients received micafungin prophylaxis starting seven days prior to transplant. Species of the Candida parapsilosis complex (Candida parapsilosis, Candida metapsilosis, and Candida orthopsilosis) were the most commonly identified etiologic agents of fungal BSI, which is consistent with previous observations that the C. parapsilosis may be more frequent than C. albicans in at-risk populations receiving echinocandin prophylaxis21–23.
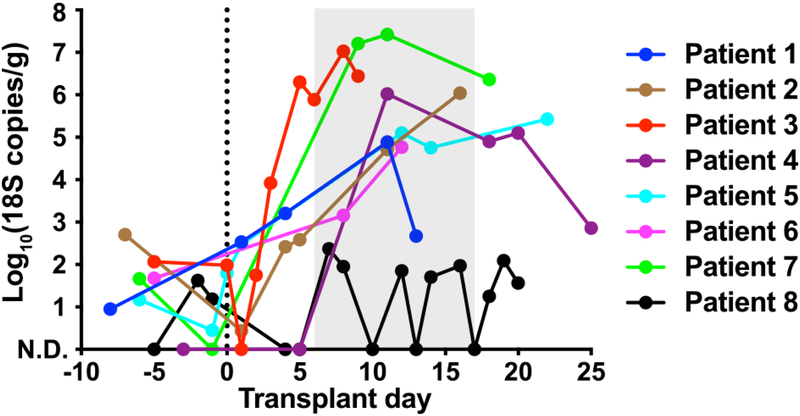
To quantify the intestinal fungal burden, we enumerated fungal colony-forming units (CFU) from the archived fecal specimens collected from day −10 to +30 relative to allo-HCT. In both groups, no fungal CFU were detected from samples collected prior to HCT. However, seven of eight patients with candidemia experienced a rapid expansion in fungal CFU, as high as 105–107 per gram feces, after receipt of allo-HCT (Fig. 1a). In contrast, viable fungal CFUs were recovered from only one of the seven case-control patients (Fig. 1b), which was identified as Saccharomyces cerevisiae, a typically non-pathogenic fungus that did not give rise to BSI in this patient. To extend these results, we quantified the total fungal 18S rDNA copies in these samples. Patients with candidemia exhibited a rapid increase in fecal 18S rDNA burden coincident with fungal CFU expansion, typically by a factor of 102 to 103 (Fig. 1c). This expansion was driven by Candida species (Extended Data Fig. 1). Meanwhile, control patients did not exhibit a relevant increase in fecal fungal 18S rDNA.
Fig. 1: Intestinal fungal burden in allo-HCT patients.
a,b, Quantitative fungal cultures of fecal samples from (a) candidemic and (b) non-candidemic patients at indicated time points during allo-HCT. c, Quantitative fungal 18S rDNA levels in candidemic (red, n = 55) and non-candidemic (green, n = 99) patient groups during allo-HCT. The solid line represents the dynamic trend using moving average filtering, with the shaded area indicating the 95% confidence intervals. Each dot represents an individual sample (a-c) and each color a unique patient (a, b). The grey shade in panels (a) and (c) indicate the time range of first positive fungal blood cultures. N.D.: not detected.
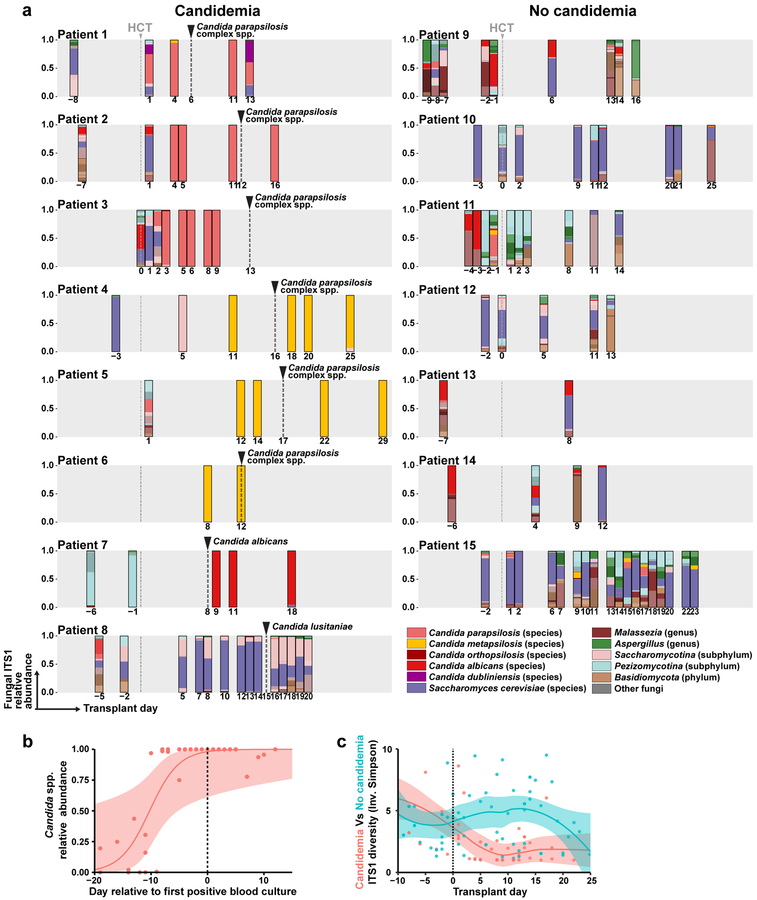
We performed ITS1 (internal transcribed spacer 1 of rDNA) sequencing of 108 fecal samples from 15 patients (median: six samples per patient) to determine the fungal composition at the species level. Strikingly, we found that in six of eight BSI patients, high relative abundance (> 50%) of a single C. parapsilosis or C. metapsilosis species temporally preceded C. parapsilosis complex BSI by two to ten days (Fig. 2a, patient 1 to 6). Patient 7 had a detectable C. albicans ITS1 signal (0.5% relative abundance) nine days prior to C. albicans BSI, which expanded to nearly 100% fecal relative abundance one day after BSI, though no intervening fecal samples were available (Fig. 2a). In these seven patients, the fecal Candida relative abundance peaked at 100%, typically prior to BSI with the same species (Fig. 2b). Notably, patient 8, who did not detect C. lusitaniae ITS1 signal in fecal samples either prior to or after the onset of BSI (Fig. 2a, Patient 8), had a central line-associated BSI with microscopic visualization of fungi in the pocket-site exudate.
Fig. 2: Mycobiota dynamics in allo-HCT patients.
a, Species-level taxonomy of fecal mycobiota (average: 7 samples per patient, range: 2 – 18) from allo-HCT patients with (left column) and without (right column) candidemia, colored according to the legend. Frequent species, e.g. Candida species and Saccharomyces cerevisiae, were individually color-coded. The grey box indicates day −10 to day +30 of transplant and the grey dashed line indicates the day of transplant. The number below each bar graph indicates the day of sampling. The black dashed line and arrow indicate the day of first fungal BSI in the candidemia group. b, Quantification of total relative abundance of pathogenic Candida species of each fecal sample (n = 37) from patients 1 to 7, a solid line represents the dynamic trend, with the shaded area indicating the 95% confidence interval. c, α-diversity of mycobiota in each sample, measured by the Inverse Simpson index. Red dots and line: candidemia group (n = 51); green dots and line: non-candidemia group (n = 57).
In control patients, the fecal mycobiota composition was similar to a prior report in a healthy adult population24. Saccharomyces cerevisiae was the most common intestinal fungal species (Fig. 2a). Malassezia species and certain filamentous fungi (e.g., Aspergillus species) were also frequently observed (Fig. 2a). In general, these patients exhibited a higher intestinal fungal diversity and a lower relative abundance of pathogenic Candida species compared to patients with candidemia (Fig. 2c and Extended Data Fig. 2).
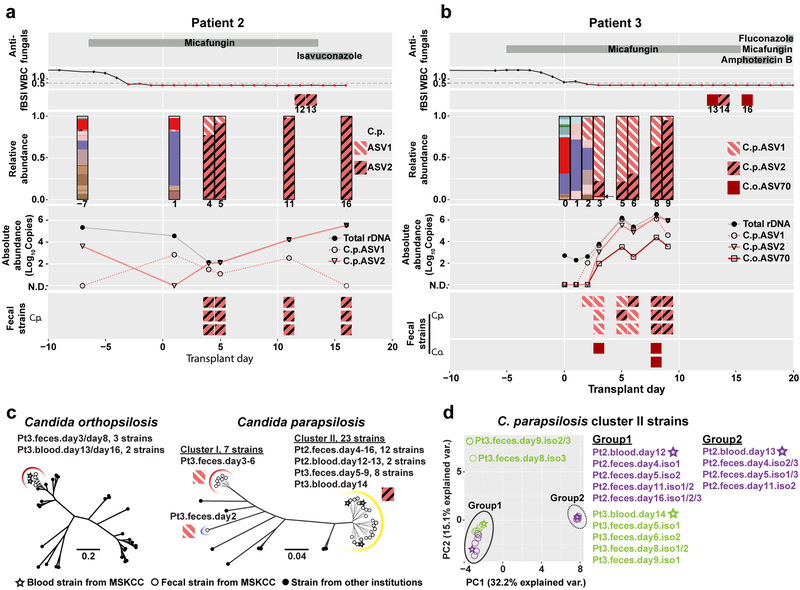
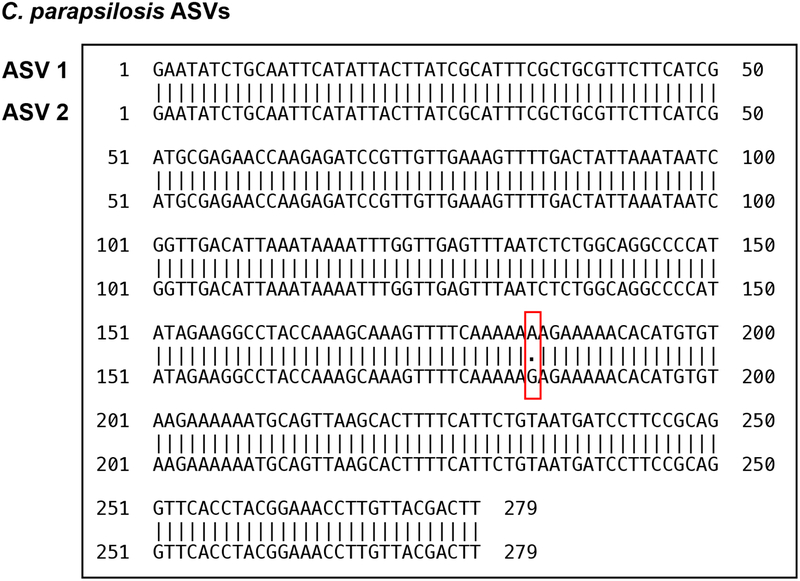
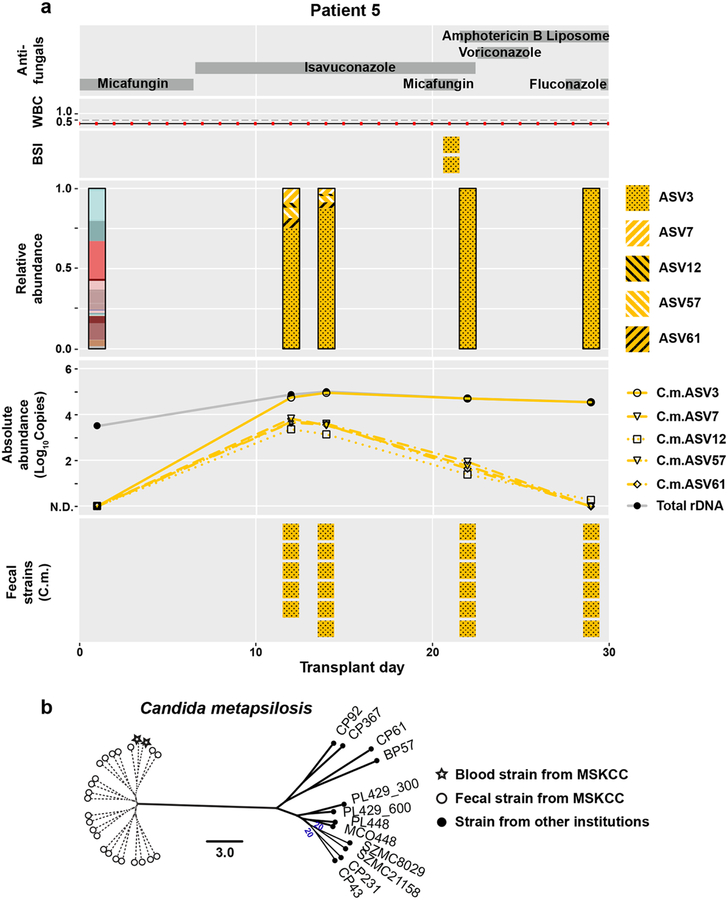
Previous analyses of fungal amplicon-based sequencing relied on the construction of operational taxonomic units (OTUs), which are clusters of similar sequences typically defined with a fixed > 3% dissimilarity threshold to approximate the differences observed among different species25–27. We sought to examine community composition at high resolution by characterizing sequences into exact amplicon sequencing variants (ASVs)28. This process has been successful in bacterial 16S rDNA analysis using the DADA2 pipeline29. We adapted the DADA2 pipeline to ITS rDNA sequencing analysis and found that amplicons previously identified as C. parapsilosis by the OTU-clustering method were composed of two major ASVs (ASV1 and ASV2) with only one nucleotide difference (Extended Data Fig. 3). Both patient 2 and 3 exhibited a contraction of ASV1 and an expansion of ASV2 in relative abundance, though the absolute abundance of both ASV1 and ASV2 increased prior to BSI (Fig. 3a,b). This shift in ASV relative abundance was confirmed by examining the ITS1 region of longitudinally isolated fecal strains. The corresponding blood C. parapsilosis strains from these two patients contained the ASV2 sequence pattern (Fig. 3a,b). We observed similar shifts in C. metapsilosis ASVs in patient 5, with ASV3 expansion in the intestine and subsequent identification in blood strains (Extended Data Fig. 4a).
Fig. 3: High-resolution mycobiota analysis in allo-HCT patients with fungal BSI.
Longitudinal clinical and mycobiota data from patient 2 (a) and patient 3 (b) include antifungal administration (1st row), white blood cell counts (WBC; 2nd row), the identity of C. parapsilosis and C. orthopsilosis ASVs amplified from blood culture isolates (fBSI; 3rd row), the fungal relative (4th row) and absolute (5th row) abundance in fecal samples, and the ASV identities of C. parapsilosis (6th row) and C. orthopsilosis (7th row in b) from fecal culture isolates. The absolute abundance was calculated by multiplying the relative abundance of indicated C. parapsilosis and C. orthopsilosis ASVs with the total fungal rDNA abundance. With exception of indicated C. parapsilosis and C. orthopsilosis ASVs, mycobiota constituents (3rd row) are colored according to the key in Fig. 2. c, Phylogenic trees of C. parapsilosis and C. orthopsilosis strains from MSKCC patients and from other institutions. Solid lines indicate the calculated distance between strains (bootstrap support of > 85%). Dashed lines in the C. orthopsilosis tree indicate a bootstrap value ≤ 65% (for complete information of the bootstrap value, see Extended Data Fig. 5). In the C. parapsilosis tree, dashed lines indicate highly similar strains that cannot be accurately resolved (bootstrap = 0%). The red arc indicates cluster I strains (only fecal strains from patient 3), the yellow arc indicates cluster II strains (fecal and blood strains from patient 2 and patient 3), and the blue arc indicates a more divergent fecal strain from patient 3. Cluster II strains carry the ASV2 pattern in their ITS1 region; other strains carry the ASV1 pattern. d, Principal Components Analysis of all 23 cluster II strains from patient 2 and patient 3. Circles: fecal strains; stars: blood strains; purple symbols: strains from patient 2; green symbols: strains from patient 3.
Two of the three blood strains from patient 3 were identified as C. orthopsilosis. A single C. orthopsilosis ASV (ASV70) was detected at 0.2 – 1.6% relative abundance (Fig. 3b, black arrow) in day +3 through day +9 fecal samples. To confirm the intestinal presence of C. orthopsilosis, we screened 512 strains isolated from two fecal samples (day +3/+8), and found seven C. orthopsilosis strains (1.4%). All fecal and blood C. orthopsilosis strains carried ASV70, indicating that the ASV70 relative abundance correlated with the frequency of viable C. orthopsilosis. Albeit low in relative abundance, the absolute copies of ASV70 increased by a factor of 103–104 (Fig. 3b), consistent with the notion that intestinal fungal expansion precedes BSI. Beyond intestinal expansion, it is possible that virulence attributes contributed to C. orthopsilosis bloodstream invasion.
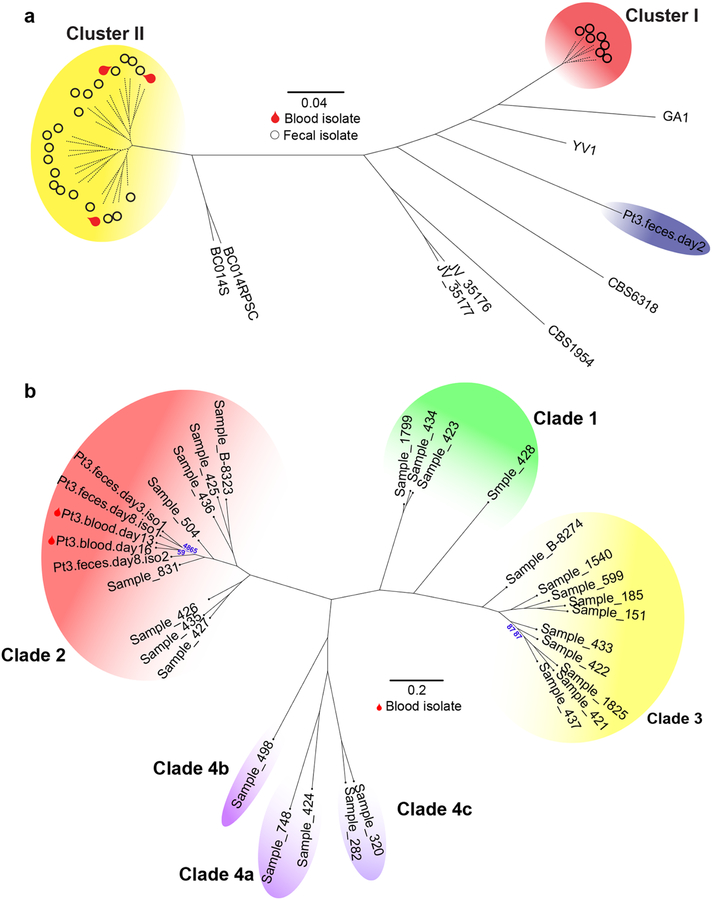
To delineate the relationship between fecal and bloodstream strains more closely, we compared 54 fecal and 7 bloodstream isolates from patients 2, 3, and 5 by whole-genome sequencing, and analyzed their genomic similarity to previously sequenced strains30–35 (Supplementary Table 2). We did not have access to bloodstream strains from other patients in the candidemia group. SNP analysis showed that the C. orthopsilosis blood strains from patient 3 (Fig. 3c and Extended Data Fig. 5) and the C. metapsilosis blood strains from patient 5 (Extended Data Fig. 4b) clustered tightly with the corresponding fecal strains but not with strains from other institutions. The blood and fecal C. parapsilosis strains from patient 2 belonged to the same cluster (cluster II, Fig. 3c). In contrast, the C. parapsilosis fecal strains from patient 3 segregated into two clusters (cluster I and II, Fig. 3c), with one divergent strain (blue arc, Fig. 3c), while the blood strain belonged to cluster II.
To gain insight into potential functional implications of these genomic differences, we searched for amplifications and deletions regions in C. parapsilosis strains with respect to the reference genome31. We found that all cluster II strains carried 24 to 33 copies of the RTA3 gene and its adjacent region (Extended Data Fig. 6). The RTA3 homolog in C. albicans encodes a putative lipid flippase and contributes to antifungal resistance and biofilm development36,37. The functional relevance of RTA3 amplification in C. parapsilosis pathogenesis will require further investigation.
There were too few SNP differences among the genomes of the total 23 C. parapsilosis cluster II strains to generate a well-resolved phylogenetic tree (Supplementary Table 3). We therefore extracted well-supported SNPs from each genome for principal components analysis (Fig. 3d). The three blood strains all closely clustered with serially isolated fecal strains from the same patient. Interestingly, the two sequential C. parapsilosis blood strains from patient 2 segregated into two groups, suggesting two individual translocation events of C. parapsilosis in this patient. These data suggest that fungal BSIs could originate from stochastic translocation from an antecedent intestinal reservoir that is established at early stages of allo-HCT.
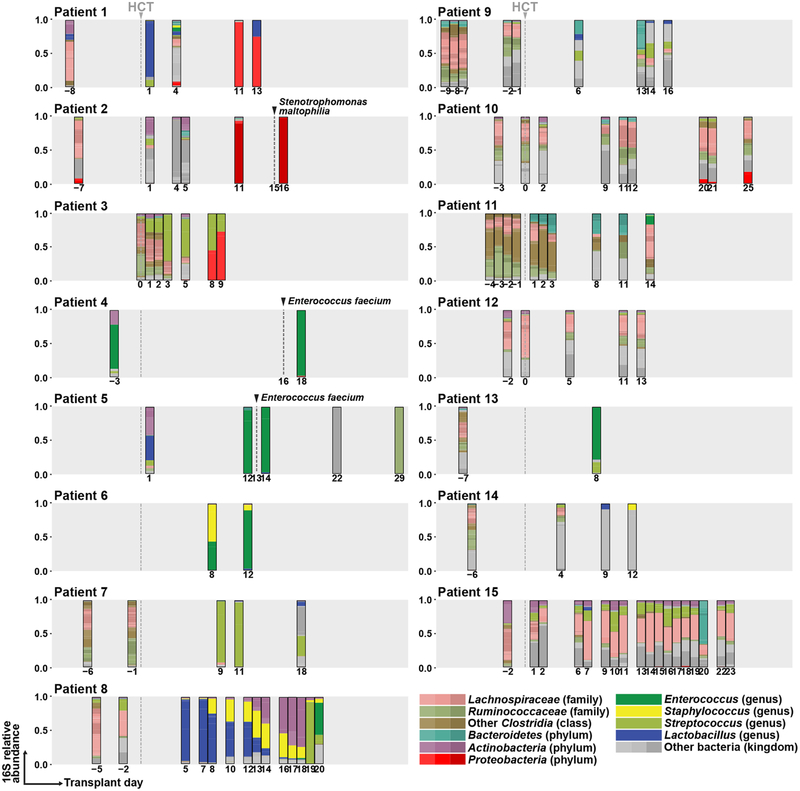
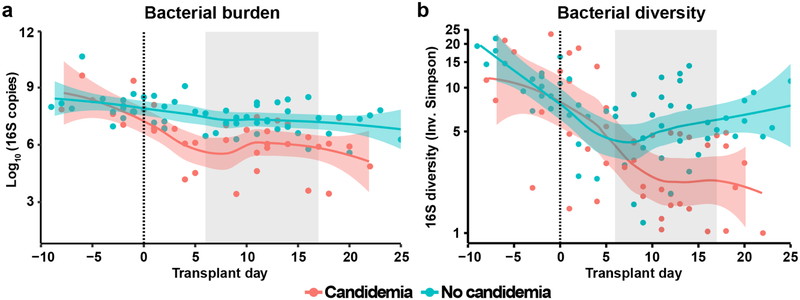
In parallel to mycobiota analysis, we performed bacterial 16S rDNA sequencing (Extended Data Fig. 7) and quantified the bacterial burden in all fecal samples (Extended Data Fig. 8). Candidemia patients had a significant loss of bacterial burden and bacterial diversity after HCT compared with control patients (Extended Data Fig. 8). Three candidemia patients developed bacterial BSIs (Enterococcus faecium in patients 4 and 5; Stenotrophomonas maltophilia in patient 2) with prior intestinal expansion by these bacterial species (Extended Data Fig. 7).
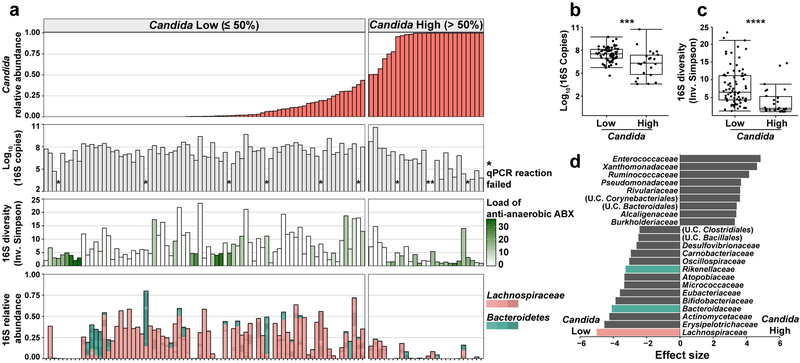
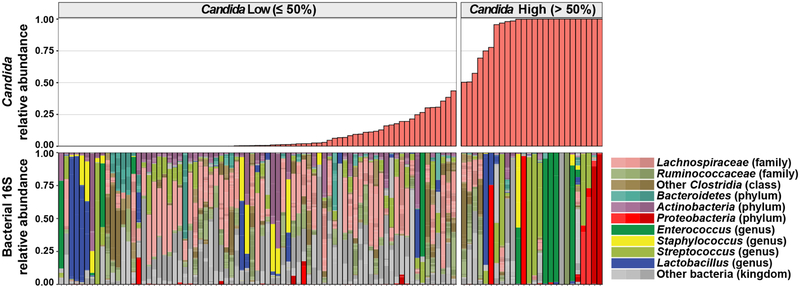
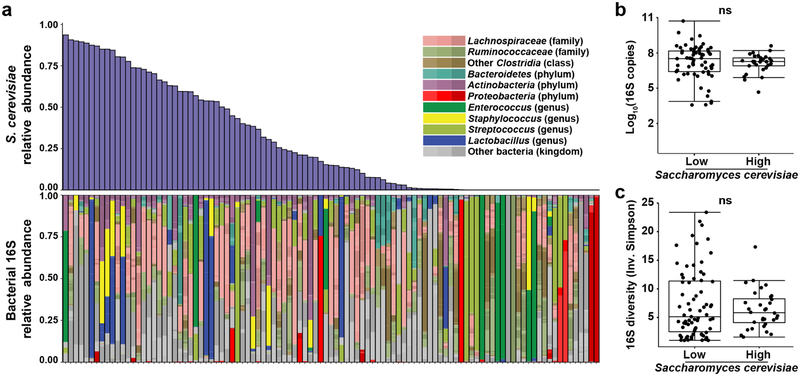
To explore a possible association between Candida expansion and bacterial microbiota, we ordered samples from all 15 patients by relative abundance of pathogenic Candida species (Fig. 4a, Extended Data Fig. 9). We found high relative abundance of Candida species in the mycobiota was associated with significantly lower levels of the total bacterial burden and 16S rDNA diversity (Fig. 4b,c). Blautia producta (family Lachnospiraceae) and Bacteroides thetaiotaomicron (phylum Bacteroidetes) have been shown to mediate intestinal C. albicans colonization resistance in mice38. In addition, Lachnospiraceae and Bacteroidetes have been identified as markers of a healthy microbiota and linked to colonization resistance against bacterial pathobionts19,39. We quantified the relative abundance of these two anaerobic bacterial taxa and observed an inverse correlation with both in samples with a high Candida relative abundance (Fig. 4d). This loss correlated with exposure to antibiotics with activity against anaerobic bacteria (Fig. 4a). Interestingly, bacterial dysbiosis was not observed in fecal samples with high S. cerevisiae relative abundance (Extended Data Fig. 10). These data suggest that Candida species expansion may occur in a different bacterial community structure than expansion of other fungi in this niche.
Fig. 4: Characterization of bacteria in fecal samples with high and low levels of pathogenic Candida species.
a, Alignment of fecal samples according to the relative abundance of pathogenic Candida species (1st row), bacterial burden (by 16S rDNA qPCR; 2nd row), bacterial diversity (by Inverse Simpson Index; 3rd row), and relative abundance of Lachnospiraceae and Bacteroidetes (4th row). * indicates failed 16S qPCR reaction. Each bar in the bacterial diversity graph (3rd row) is colored to indicate the anti-anaerobic antibiotic load index prior to sample collection; this index reflects the sum of administered anti-anaerobic antibiotics (metronidazole, clindamycin, carbapenems, piperacillin/tazobactam, and oral vancomycin) multiplied by the number of treatment days40. b, Comparison of bacterial burden in samples with high (> 50%, n = 22) or low (≤ 50%, n = 71) Candida relative abundance. ***: Two-sided Wilcoxon rank sum test p = 0.00073. c, Comparison of bacterial diversity in samples with high (> 50%, n = 26) or low (≤ 50%, n = 77) Candida relative abundance. ****: Two-sided Wilcoxon rank sum test p = 1.9 × 10⁻⁵. The box plots in b and c represent the median, interquartile range (IQR) and range. d, LEfSe analysis of bacteria taxa (at family level) present in samples with high (> 50%, n = 26) or low (≤ 50%, n = 77) relative Candida abundance. The effect size corresponds to the linear discriminant analysis (LDA) score. U.C.: unclassified. A subset of the 16S rDNA sequencing data has been previously reported7,20.
Discussion:
In summary, this study demonstrates the value of high-resolution sequencing to trace the origin of invasive fungal infections. Our data indicate that specific pathogenic Candida species (C. parapsilosis complex and C. albicans) expand in the gastrointestinal tract and translocate into the bloodstream. Additional studies are required to extrapolate our findings to Candida species not observed in our patient cohort. Fungal dysbiosis is tightly associated with bacterial dysbiosis, particularly the loss of anaerobic bacteria. Monitoring fungal and bacterial community structure may permit identification of microbiota markers that precede bloodstream invasion and enable targeted intervention.
Methods:
Study Design and Patient Population
Biospecimens for this study were drawn from a prospective fecal collection biobank, which has been described previously18,20, in which consenting patients undergo repeated longitudinal fecal sample collection over the course of allo-HCT. In this study population, intestinal mucosal sampling is contraindicated, precluding routine collection of this sample type.
In this study, we performed a nested case-control study of adult (>18 years) allo-HCT patients at Memorial Sloan Kettering Cancer Center (MSKCC) between January 1, 2014 and December 31, 2017. Cases were defined as patients who developed culture-proven candidemia during the early transplant period (within 30 days post-HCT), with at least one banked fecal specimen collected within 10 days preceding BSI. Control patients consisted of randomly selected subjects without candidemia during this time interval. Patients in this study have been reported previously with a subset of their intestinal bacterial 16S rDNA sequencing data7,20.
Per institutional guidelines, allo-HCT patients received micafungin (100 mg IV every 24 hrs) and levofloxacin (500 mg po every 24 hrs), starting at the beginning of pre-transplant conditioning chemotherapy. For allo-HCT patients that received total body irradiation as part of the conditioning regimen, vancomycin (1 gm IV every 12 hrs) was administered from day −2 to day + 7. Micafungin was switched to a mold-active azole drug (i.e, voriconazole or posaconazole) on day +7 for unmodified myeloablative, cord blood, haploidentical, and T cell-depleted allo-HCT. Unmodified non-myeloablative or reduced-intensity allo-HCT recipients advanced to fluconazole prophylaxis.
All patients provided written consent and this study was approved by the MSKCC institutional review board. We collected clinical covariables pertaining to patient and transplant characteristics, including age, sex, race, underlying disease, conditioning regimen and intensity, donor source, HLA matching, and whether HCT graft was ex-vivo T-cell depleted. We also monitored WBC counts, duration of neutropenia, receipt of antimicrobial agents. Engraftment was defined as absolute neutrophil count ≥ 0.5 × 10³ per microliter of blood for three consecutive days.
Analysis of Fecal Samples
To determine fungal CFUs, 50 μl liquid stool or 50 mg formed stool were homogenized in 150 μl of sterile PBS and serially diluted on Sabouraud dextrose (SAB) agar with 0.01 mg/ml vancomycin and 0.1 mg/ml gentamicin38. The samples were cultured at 37°C for 48 – 72 hrs under aerobic conditions. We did not observe mold colonies in any cultures of fecal samples. Single yeast colonies were picked and maintained in glycerol stocks at −80°C. For patient 3, 512 fungal colonies (256 each from day +3 and day +8 fecal samples) were genotyped by PCR using species-specific primers for C. parapsilosis and C. orthopsilosis41.
To process fecal samples for qPCR and sequencing analyses, 100–150 mg formed stool or 200 μl liquid stool was mixed with 0.2 ml of 0.1 mm diameter silicone beads, 0.3 ml of 0.5 mm diameter silicone beads, 500 μl lyticase buffer (50 mM pH 7.6 Tris, 10 mM EDTA, 28 mM β-mercaptoethanol), and 100 U lyticase (Sigma L2524). The samples were vortexed, incubated in at 32°C for 30 min., supplemented with 30 μl 4M NaCl, 47 μl 2M Tris-HCl, pH 8.0, 13 μl 0.5 M EDTA, 200 μl 20% SDS, and 500 μl phenol chloroform, agitated in a bead beater for 2 min, and spun at 13,300 RPM at 4°C for 5 min. Two additional rounds of phenol chloroform extraction were performed, and 200 μl of the aqueous phase was mixed with 200 μl buffer AL (QIAamp DNA Mini Kit; Qiagen Cat No. 51306) and 200 μl 100% ethanol. The samples were processed according to the manufacturer’s instruction and eluted with 80 μl ultrapure water (Invitrogen Cat No. 10977).
1 μl of extracted total fecal DNA was used as template for quantitative PCR analysis using the FungiQuant probe and primers42 for fungal burden, the Candida specific probe and primers for Candida burden43, and SYBR-green method with forward (AYTGGGYDTAAAGNG) and reverse (CCGTCAATTYHTTTRAGT) primer set for bacterial burden. The data were normalized by the initial wet weight of the fecal samples.
Amplicon-based Sequencing and Data Processing
The 16S rDNA sequencing was performed as described previously19,44. The ITS1 rDNA sequencing strategy was adapted from 16S rDNA sequencing: forward (CTTGGTCATTTAGAGGAAGTAA) and reverse (GTTCAAAGAYTCGATGATTCAC) primers were modified with additional barcode nucleotides for fungal ITS1 region amplification. 1 μl of purified template DNA was amplified with Phusion enzyme (ThermoFisher F-530) for 35 cycles (98°C 30s, 53°C 30s, 72°C 30s). PCR amplicons were purified with column (Qiagen28106), quantified by the Qubit dsDNA BR Assay Kit, and run on the Illumina Miseq platform with PE300 setting. The resulting raw sequencing reads were processed and separated into distinct samples, and barcode and primer sequences were removed. DADA2 was used to perform quality filtering on the resulting amplicons, and infer exact amplicon sequencing variants (ASVs), and to filter and remove chimeras. Taxonomic assignment to species level was performed using an algorithm incorporating nucleotide BLAST45, with NCBI RefSeq46 as reference training set. The ASV tables, taxonomic assignment, and sample metadata were assembled using the phyloseq package construct47.
Candida relative abundance calculation
In this study we referred to Candida relative abundance as the proportion of ITS sequences that represent pathogenic Candida species48 in each fecal sample. Pathogenic Candida species were defined as: Candida albicans, Candida dubliniensis, Candida tropicalis, Candida parapsilosis, Candida orthopsilosis, Candida metapsilosis, Candida famata (Debaryomyces hansenii), Candida lusitaniae (Clavispora lusitaniae), Candida guilliermondii (Meyerozyma guilliermondii), Candida krusei (Pichia kudriavzevii), Candida glabrata, Candida kefyr (Kluyveromyces marxianus), Candida norvegensis (Pichia norvegensis), Candida inconspicua (Pichia cactophila), Candida lipolytica (Pichia lipolytica), Candida fabianii (Cyberlindnera fabianii), and Candida auris.
Whole-genome sequencing of fecal and blood fungal strains
We retrieved blood strains from patient 2, 3, and 5 from the clinical microbiology lab of the hospital. 61 fungal strains (54 fecal and 7 bloodstream strains) from these three patients were processed for genomic DNA extraction. The blood fungal strains from other patients were not available. Fungal cells were harvested and lysed for genomic DNA extraction with QIAamp kit (Cat#51306). Purified genomic DNA samples were prepared for sequencing libraries prep and run on the Illumina Hiseq 4000 platform, with over 20 million reads for each sample to ensure >70x genomic coverage. Supplementary Table 2 showed the summary of each annotated genome in this study. Reads from C. parapsilosis, C. orthopsilosis, C. metapsilosis strains were mapped against C. parapsilosis CDC31730, C. orthopsilosis 90–12549, C. metapsilosis32 reference genomes, respectively, using BWA-mem version 0.7.12. with parameters -M -R “RG”, where “RG” represents read group information generated for each strain for compatibility with further downstream analysis. Duplicated reads were marked using the GATK MarkDuplicates tool as per GATK best practices.
SNP analyses and phylogeny tree construction
Single Nucleotide Polymorphisms (SNPs) were identified for each sample using the HaplotypeCaller tool from GATK (version 4.0.4.0)50 with --genotyping-mode DISCOVERY parameter. The results were combined using the CombineGVCFs and GenotypeGVCFs tools from the same package. The combined VCF file was input into RRHS tool51 to generate equal length haploid FASTA sequences for each isolate (parameter -n 1 generates one sequence per individual). SNP trees were constructed from these sequences using RAxML (raxmlHPC-PTHREADS) version 8.2.1152 with parameters -T 20 (number of threads) -f a (rapid bootstrap analysis algorithm) -m GTRGAMMA (model of nucleotide substitution) -p 12345 -x 12345 -# 1000. 27 isolates from Schroder et al.33 were included in the C. orthopsilosis tree and 11 isolates (including one isolate, PL429, sequenced twice using different methods) from Pryszcz et al.32 were included in the C. metapsilosis tree.
Gene-level copy number variations (CNVs) identification
Read density at each annotated open reading frame was calculated using BEDTools coverage tool version 2.27.153 and compared to average read density across the genomes. Gene-level copy number was normalized by multiplying the computed coverage variation with the expected ploidy (diploid). Amplified genes were defined as those with values greater than or equal to 2.5, while gene-level deletions were defined as values less than or equal to 1.5. ORFs with potential copy number variation were defined as those for which the copy number varied at least two-fold among strains. ORFs where only the reference strain differed in copy number from all other strains were assumed to be errors in the reference genome and were not analyzed further.
Principal Component Analysis
We used only strongly supported SNPs in C. parapsilosis (Supplementary Table 3) for principal component analysis (PCA). Very low coverage areas with a read depth (DP) lower than 10% of expected coverage and a genotype quality (GQ) less than 20 were removed. Variants in repetitive regions (identified with RepeatMasker 4.054, TandemRepeatFinder55 and Blast45 were also removed. Clusters of 3 or more SNPs called in a 10 bp window were removed. Filter settings in GATK included mapping quality (< 40), quality by depth (< 10), Strand Odds Ratio (> 3.0), Fisher Strand Bias (> 60), Mapping Quality Rank Sum Test (< −12.5) and Read Position Rank Sum Test (< −8). SNPs were exported in table format using GATK VariantsToTable tool. For PCA, a numerical matrix was constructed from the high confidence variant data, by marking the presence of a variant in a strain with 1 for heterozygous variants, and 2 for homozygous calls. The absence of a variant call in a sample at a given site was marked with 0. Principal Components were computed in R 3.5.3 using the prcomp function, and the results were plotted using the ggbiplot package.
LEfSe analysis
To identify microbiota features that were associated with low and high Candida relative abundance, we employed linear discriminant analysis effect size (LefSe) analyses. Analyses were performed on the Huttenhower lab Galaxy server (http://huttenhower.sph.harvard.edu/galaxy). A subject identifier was specified in order to account for the repeated measures sample collection design. The bacterial relative abundance values at family level and the Candida relative abundance value of each sample (high vs. low) were imported to the server, using the FDR-adjusted q cutoff of 0.05 and the effective size cutoff of 2.0.
Data plotting
We used Prism 7 for plotting fungal CFU, and R (version 3.5.3, R Development Core Team) for all qPCR and sequencing data analyses and plotting.
Statistics
Statistical analyses were performed using R (v.3.5.3) software packages. Two-sided Wilcoxon rank-sum test was used for comparisons of continuous non-normally distributed variables between two groups. These results were visualized using box plots with the central line representing the median, box limits representing the first and third quartiles and whiskers extending to the smallest and largest values or at most to 1.5× the interquartile range, whichever is smaller.
Reporting summary
Further information of on research design is available in the Life Sciences Reporting Summary linked to this article.
Data Availability Statement
The data that support the findings of this study are available from the corresponding author upon request. All sequencing data generated in this study have been deposited in the Sequence Read Archive under BioProject PRJNA579121. Accession numbers of entries under this BioProject and previously submitted bacterial 16S rDNA sequencing data7,20 are listed in Supplementary Table 4.
Extended Data
Extended Data Fig. 1. Quantitative Candida genus-specific18S rDNA levels in fecal samples of candidemic patients.
The grey shade indicates the time range of first positive fungal blood cultures. N.D.: not detected.
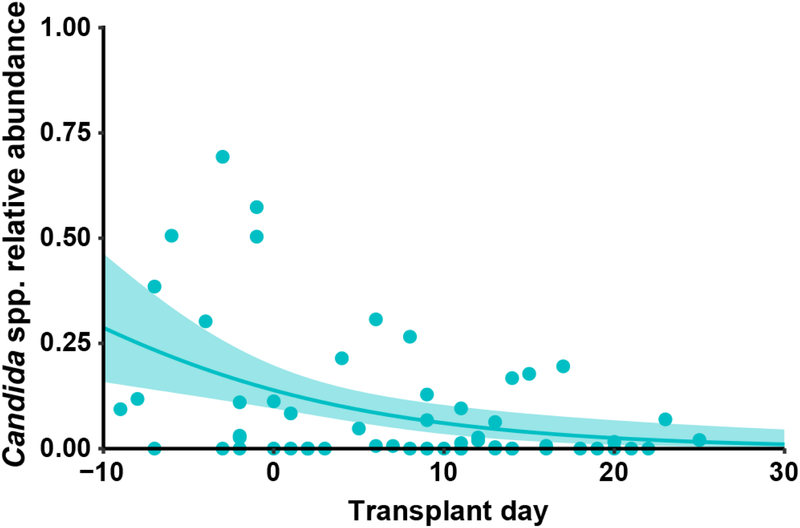
Extended Data Fig. 2. Quantitation of relative abundance of pathogenic Candida species in patients without candidemia.
The solid line represents the dynamic trend, with the shaded area indicating the 95% confidence intervals, n = 57.
Extended Data Fig. 3. C. parapsilosis ASV1 and ASV2 sequence alignment.
The box indicates the single nucleotide difference between ASV1 and ASV2. This level of variation (1/279) cannot be differentiated with methods based on OTU clustering.
Extended Data Fig. 4. Patient example with C. metapsilosis BSI.
a, The panel shows clinical data, ITS rDNA sequencing results, quantification of amplicons of 5 different ASVs, and genotyping results of fecal and blood strains from patient 5. b, Phylogenic trees of C. metapsilosis strains from patient 5 and from other institutions. Solid lines indicate the calculated distance between strains (bootstrap support of 100%, or otherwise labeled). Dashed lines indicate the bootstrap value of 0, suggesting that the fecal and blood strains are highly similar.
Extended Data Fig. 5. SNP trees of C. parapsilosis and C. orthopsilosis strains with complete information on previously sequenced strains.
The bootstrap values are 100% for all the solid lines and 0% for all the dashed lines in the C. parapsilosis tree. For the C. orthopsilosis tree, the bootstrap values are 100% for the lines except those with specific bootstrap value labeled.
Extended Data Fig. 6. The amplification of RTA3 and the adjacent region on the genomics sequences of C. parapsilosis cluster II strains.
a, The graph shows the enrichment of reads aligned with RTA3 and the adjacent region of chromosome 1 in the genome of cluster II strains, compared to cluster I strains and strain Pt3.fecal.day2. b, Quantitation of RTA3 copy number of all sequenced C. parapsilosis strains from this study (cluster I strains and the strain from patient 2: n = 8; cluster II strains: n = 23).
Extended Data Fig. 7. Bacterial 16S rDNA sequencing data of candidemic and non-candidemic patients.
The grey dashed line and arrow indicate the day of transplant. The grey box indicates day −10 to day +30 of transplant. The black dashed line and arrow indicate the day of the first positive bacterial blood culture. Five samples (one from patient 3, four from patient 5) failed 16S rDNA sequencing and were excluded from the bacterial diversity or LEfSe analysis. A subset of the 16S rDNA sequencing data has been previously reported7,20.
Extended Data Fig. 8. Bacterial 16S rDNA burden and α-diversity in patient fecal samples.
a, Quantitative bacterial 16S rDNA levels in candidemic (red, n = 38) and non-candidemic (green, n = 54) patient groups at indicated time points during allo-HCT. Ten samples were further excluded from Fig. 7 since they failed the 16S rDNA qPCR reaction. b, α-diversity of bacterial 16S rDNA in candidemic (red, n = 45) and non-candidemic (green, n = 57) patient groups, measured by Inverse Simpson index. The solid line represents the dynamic trend, with the shaded area indicating the 95% confidence intervals. The grey shaded area indicates the day of first positive fungal blood culture. The yaxis in panel (b) is rescaled with Logε. A subset of the 16S rDNA sequencing data has been previously reported7,20.
Extended Data Fig. 9. Full bacterial sequencing data aligned according to Candida relative abundance.
Alignment of bacterial (16S) rDNA sequencing data from all 15 study patients, according to the relative abundance of pathogenic Candida species. The bacterial 16S rDNA sequencing data of each sample are presented in the bottom row. A subset of the 16S rDNA sequencing data has been previously reported7,20.
Extended Data Fig. 10. Characterization of intestinal bacterial microbiota with high Saccharomyces cerevisiae relative abundance.
a, 16S rDNA Alignment of bacterial (16S) rDNA sequencing data from all 15 study patients, according to the relative abundance of S. cerevisiae. b, quantification of bacterial burden (two-sided Wilcoxon rank sum p = 0.36) in samples with high (n = 29) and low (n = 64) S. cerevisiae relative abundance. Box plots represent median, IQR and range. c, quantification of bacterial diversity (two-sided Wilcoxon rank sum p = 0.87) in samples with high (n = 32) and low (n = 71) S. cerevisiae relative abundance. Box plots represent median, IQR and range. A subset of the 16S rDNA sequencing data has been previously reported7,20.
Supplementary Material
Acknowledgments:
We thank E. Pamer, I. Iliev, J. Xavier, J. Heitman and R. Rao for discussions, I. Leiner, M. Gjonbalaj, R. Seok and Memorial Sloan Kettering Cancer Center Integrated Genomics Operation Facility for technical assistance. The studies were supported by a Geoffrey Beene Foundation Award (T.M.H.), a Burroughs Wellcome Fund Investigator in the Pathogenesis of Infectious Diseases Award (T.M.H.) and by NIH grants P30 CA008748 (to MSKCC), R01 AI093808 (T.M.H.), R01 AI 139632 (T.M.H.), R01 AI137269 (Y.T.), K08HL143189 (J.U.P.) and Deutsche Forschungsgemeinschaft (German Research Foundation) fellowship grant RO5328/2-1 (T.R.) and Science Foundation Ireland 12/IA/1343 (G.B.).
Footnotes
Competing Interests Statement: T.M.H. has participated in scientific advisory boards for Merck & Co, Inc. and Partner Therapeutics. J.U.P. reports research funding, intellectual property fees, and travel reimbursement from Seres Therapeutics. M.R.M.v.d.B. has received research support from Seres Therapeutics; has consulted, received honorarium from or participated in advisory boards for Seres Therapeutics, Flagship Ventures, Novartis, Evelo, Jazz Pharmaceuticals, Therakos, Amgen, Magenta Therapeutics, Merck & Co, Inc., Acute Leukemia Forum (ALF) and DKMS Medical Council (Board); has IP Licensing with Seres Therapeutics and Juno Therapeutics. All other authors have no competing interests.
References:
- 1.Paterson MJ, Oh S & Underhill DM Host-microbe interactions: commensal fungi in the gut. Curr Opin Microbiol 40, 131–137 (2017). [DOI] [PMC free article] [PubMed] [Google Scholar]
- 2.Richard ML & Sokol H The gut mycobiota: insights into analysis, environmental interactions and role in gastrointestinal diseases. Nat Rev Gastroenterol Hepatol 16, 331–345 (2019). [DOI] [PubMed] [Google Scholar]
- 3.Blander JM, Longman RS, Iliev ID, Sonnenberg GF & Artis D Regulation of inflammation by microbiota interactions with the host. Nat Immunol 18, 851–860 (2017). [DOI] [PMC free article] [PubMed] [Google Scholar]
- 4.Koh AY The microbiome in hematopoietic stem cell transplant recipients and cancer patients: Opportunities for clinical advances that reduce infection. PLoS Pathog 13, e1006342 (2017). [DOI] [PMC free article] [PubMed] [Google Scholar]
- 5.Lewis BB & Pamer EG Microbiota-Based Therapies for Clostridium difficile and Antibiotic-Resistant Enteric Infections. Annu Rev Microbiol 71, 157–178 (2017). [DOI] [PubMed] [Google Scholar]
- 6.Keith JW & Pamer EG Enlisting commensal microbes to resist antibiotic resistant pathogens. J Exp Med 216, 10–19 (2019). [DOI] [PMC free article] [PubMed] [Google Scholar]
- 7.Kim SG, et al. Microbiota-derived lantibiotic restores resistance against vancomycin-resistant Enterococcus. Nature 572, 665–669 (2019). [DOI] [PMC free article] [PubMed] [Google Scholar]
- 8.Underhill DM & Iliev ID The mycobiota: interactions between commensal fungi and the host immune system. Nat Rev Immunol 14, 405–416 (2014). [DOI] [PMC free article] [PubMed] [Google Scholar]
- 9.Nucci M & Anaissie E Revisiting the source of candidemia: skin or gut? Clin Infect Dis 33, 1959–1967 (2001). [DOI] [PubMed] [Google Scholar]
- 10.Cesaro S, et al. Incidence, Risk Factors, and Long-term Outcome of Acute Leukemia Patients With Early Candidemia After Allogeneic Stem Cell Transplantation: A Study by the Acute Leukemia and Infectious Diseases Working Parties of European Society for Blood and Marrow Transplantation. Clin Infect Dis 67, 564–572 (2018). [DOI] [PubMed] [Google Scholar]
- 11.Kohler JR, Casadevall A & Perfect J The spectrum of fungi that infects humans. Cold Spring Harb Perspect Med 5, a019273 (2014). [DOI] [PMC free article] [PubMed] [Google Scholar]
- 12.Weiner LM, et al. Antimicrobial-Resistant Pathogens Associated With Healthcare-Associated Infections: Summary of Data Reported to the National Healthcare Safety Network at the Centers for Disease Control and Prevention, 2011–2014. Infect Control Hosp Epidemiol 37, 1288–1301 (2016). [DOI] [PMC free article] [PubMed] [Google Scholar]
- 13.Snyder GM & Wright SB The Epidemiology and Prevention of Candida auris. Curr Infect Dis Rep 21, 19 (2019). [DOI] [PubMed] [Google Scholar]
- 14.Slavin MA, et al. Efficacy and safety of fluconazole prophylaxis for fungal infections after marrow transplantation--a prospective, randomized, double-blind study. J Infect Dis 171, 1545–1552 (1995). [DOI] [PubMed] [Google Scholar]
- 15.Goodman JL, et al. A controlled trial of fluconazole to prevent fungal infections in patients undergoing bone marrow transplantation. N Engl J Med 326, 845–851 (1992). [DOI] [PubMed] [Google Scholar]
- 16.Ubeda C, et al. Vancomycin-resistant Enterococcus domination of intestinal microbiota is enabled by antibiotic treatment in mice and precedes bloodstream invasion in humans. J Clin Invest 120, 4332–4341 (2010). [DOI] [PMC free article] [PubMed] [Google Scholar]
- 17.Tamburini FB, et al. Precision identification of diverse bloodstream pathogens in the gut microbiome. Nat Med 24, 1809–1814 (2018). [DOI] [PMC free article] [PubMed] [Google Scholar]
- 18.Taur Y, et al. Intestinal domination and the risk of bacteremia in patients undergoing allogeneic hematopoietic stem cell transplantation. Clin Infect Dis 55, 905–914 (2012). [DOI] [PMC free article] [PubMed] [Google Scholar]
- 19.Lee YJ, et al. Protective Factors in the Intestinal Microbiome Against Clostridium difficile Infection in Recipients of Allogeneic Hematopoietic Stem Cell Transplantation. J Infect Dis 215, 1117–1123 (2017). [DOI] [PMC free article] [PubMed] [Google Scholar]
- 20.Taur Y, et al. Reconstitution of the gut microbiota of antibiotic-treated patients by autologous fecal microbiota transplant. Sci Transl Med 10(2018). [DOI] [PMC free article] [PubMed] [Google Scholar]
- 21.Sipsas NV, et al. Candidemia in patients with hematologic malignancies in the era of new antifungal agents (2001–2007): stable incidence but changing epidemiology of a still frequently lethal infection. Cancer 115, 4745–4752 (2009). [DOI] [PubMed] [Google Scholar]
- 22.Wang E, et al. The ever-evolving landscape of candidaemia in patients with acute leukaemia: non-susceptibility to caspofungin and multidrug resistance are associated with increased mortality. J Antimicrob Chemother 70, 2362–2368 (2015). [DOI] [PMC free article] [PubMed] [Google Scholar]
- 23.Forrest GN, Weekes E & Johnson JK Increasing incidence of Candida parapsilosis candidemia with caspofungin usage. J Infect 56, 126–129 (2008). [DOI] [PubMed] [Google Scholar]
- 24.Nash AK, et al. The gut mycobiome of the Human Microbiome Project healthy cohort. Microbiome 5, 153 (2017). [DOI] [PMC free article] [PubMed] [Google Scholar]
- 25.Schloss PD, et al. Introducing mothur: open-source, platform-independent, community-supported software for describing and comparing microbial communities. Appl Environ Microbiol 75, 7537–7541 (2009). [DOI] [PMC free article] [PubMed] [Google Scholar]
- 26.Caporaso JG, et al. QIIME allows analysis of high-throughput community sequencing data. Nat Methods 7, 335–336 (2010). [DOI] [PMC free article] [PubMed] [Google Scholar]
- 27.Edgar RC UPARSE: highly accurate OTU sequences from microbial amplicon reads. Nat Methods 10, 996–998 (2013). [DOI] [PubMed] [Google Scholar]
- 28.Callahan BJ, et al. DADA2: High-resolution sample inference from Illumina amplicon data. Nat Methods 13, 581–583 (2016). [DOI] [PMC free article] [PubMed] [Google Scholar]
- 29.Dubin KA, et al. Diversification and Evolution of Vancomycin-Resistant Enterococcus faecium during Intestinal Domination. Infect Immun 87(2019). [DOI] [PMC free article] [PubMed] [Google Scholar]
- 30.Butler G, et al. Evolution of pathogenicity and sexual reproduction in eight Candida genomes. Nature 459, 657–662 (2009). [DOI] [PMC free article] [PubMed] [Google Scholar]
- 31.Pryszcz LP, Nemeth T, Gacser A & Gabaldon T Unexpected genomic variability in clinical and environmental strains of the pathogenic yeast Candida parapsilosis. Genome Biol Evol 5, 2382–2392 (2013). [DOI] [PMC free article] [PubMed] [Google Scholar]
- 32.Pryszcz LP, et al. The Genomic Aftermath of Hybridization in the Opportunistic Pathogen Candida metapsilosis. PLoS Genet 11, e1005626 (2015). [DOI] [PMC free article] [PubMed] [Google Scholar]
- 33.Schroder MS, et al. Multiple Origins of the Pathogenic Yeast Candida orthopsilosis by Separate Hybridizations between Two Parental Species. PLoS Genet 12, e1006404 (2016). [DOI] [PMC free article] [PubMed] [Google Scholar]
- 34.Branco J, et al. Impact of ERG3 mutations and expression of ergosterol genes controlled by UPC2 and NDT80 in Candida parapsilosis azole resistance. Clin Microbiol Infect 23, 575 e571–575 e578 (2017). [DOI] [PubMed] [Google Scholar]
- 35.Rybak JM, et al. Loss of C-5 Sterol Desaturase Activity Results in Increased Resistance to Azole and Echinocandin Antifungals in a Clinical Isolate of Candida parapsilosis. Antimicrob Agents Chemother 61(2017). [DOI] [PMC free article] [PubMed] [Google Scholar]
- 36.Whaley SG, et al. The RTA3 Gene, Encoding a Putative Lipid Translocase, Influences the Susceptibility of Candida albicans to Fluconazole. Antimicrob Agents Chemother 60, 6060–6066 (2016). [DOI] [PMC free article] [PubMed] [Google Scholar]
- 37.Srivastava A, et al. Distinct roles of the 7-transmembrane receptor protein Rta3 in regulating the asymmetric distribution of phosphatidylcholine across the plasma membrane and biofilm formation in Candida albicans. Cell Microbiol 19(2017). [DOI] [PMC free article] [PubMed] [Google Scholar]
- 38.Fan D, et al. Activation of HIF-1alpha and LL-37 by commensal bacteria inhibits Candida albicans colonization. Nat Med 21, 808–814 (2015). [DOI] [PMC free article] [PubMed] [Google Scholar]
- 39.Taur Y Intestinal microbiome changes and stem cell transplantation: Lessons learned. Virulence 7, 930–938 (2016). [DOI] [PMC free article] [PubMed] [Google Scholar]
- 40.Zhao J, Murray S & Lipuma JJ Modeling the impact of antibiotic exposure on human microbiota. Sci Rep 4, 4345 (2014). [DOI] [PMC free article] [PubMed] [Google Scholar]
- 41.del Pilar Vercher M, et al. Differentiation of Candida parapsilosis, C. orthopsilosis, and C. metapsilosis by specific PCR amplification of the RPS0 intron. Int J Med Microbiol 301, 531–535 (2011). [DOI] [PubMed] [Google Scholar]
- 42.Liu CM, et al. FungiQuant: a broad-coverage fungal quantitative real-time PCR assay. BMC Microbiol 12, 255 (2012). [DOI] [PMC free article] [PubMed] [Google Scholar]
- 43.White PL, Shetty A & Barnes RA Detection of seven Candida species using the Light-Cycler system. J Med Microbiol 52, 229–238 (2003). [DOI] [PubMed] [Google Scholar]
- 44.Haak BW, et al. Impact of gut colonization with butyrate-producing microbiota on respiratory viral infection following allo-HCT. Blood 131, 2978–2986 (2018). [DOI] [PMC free article] [PubMed] [Google Scholar]
- 45.Altschul SF, Gish W, Miller W, Myers EW & Lipman DJ Basic local alignment search tool. J Mol Biol 215, 403–410 (1990). [DOI] [PubMed] [Google Scholar]
- 46.Tatusova T, et al. Update on RefSeq microbial genomes resources. Nucleic Acids Res 43, D599–605 (2015). [DOI] [PMC free article] [PubMed] [Google Scholar]
- 47.McMurdie PJ & Holmes S Phyloseq: a bioconductor package for handling and analysis of high-throughput phylogenetic sequence data. Pac Symp Biocomput, 235–246 (2012). [PMC free article] [PubMed] [Google Scholar]
- 48.Turner SA & Butler G The Candida pathogenic species complex. Cold Spring Harb Perspect Med 4, a019778 (2014). [DOI] [PMC free article] [PubMed] [Google Scholar]
- 49.Riccombeni A, Vidanes G, Proux-Wera E, Wolfe KH & Butler G Sequence and analysis of the genome of the pathogenic yeast Candida orthopsilosis. PLoS One 7, e35750 (2012). [DOI] [PMC free article] [PubMed] [Google Scholar]
- 50.McKenna A, et al. The Genome Analysis Toolkit: a MapReduce framework for analyzing next-generation DNA sequencing data. Genome Res 20, 1297–1303 (2010). [DOI] [PMC free article] [PubMed] [Google Scholar]
- 51.Lischer HE, Excoffier L & Heckel G Ignoring heterozygous sites biases phylogenomic estimates of divergence times: implications for the evolutionary history of microtus voles. Mol Biol Evol 31, 817–831 (2014). [DOI] [PubMed] [Google Scholar]
- 52.Stamatakis A RAxML version 8: a tool for phylogenetic analysis and post analysis of large phylogenies. Bioinformatics 30, 1312–1313 (2014). [DOI] [PMC free article] [PubMed] [Google Scholar]
- 53.Quinlan AR & Hall IM BEDTools: a flexible suite of utilities for comparing genomic features. Bioinformatics 26, 841–842 (2010). [DOI] [PMC free article] [PubMed] [Google Scholar]
- 54.Smit A, Hubley R & Green P RepeatMasker Open-4.0. 2013–2015. (2015). [Google Scholar]
- 55.Benson G Tandem repeats finder: a program to analyze DNA sequences. Nucleic Acids Res 27, 573–580 (1999). [DOI] [PMC free article] [PubMed] [Google Scholar]
Associated Data
This section collects any data citations, data availability statements, or supplementary materials included in this article.
Supplementary Materials
Data Availability Statement
The data that support the findings of this study are available from the corresponding author upon request. All sequencing data generated in this study have been deposited in the Sequence Read Archive under BioProject PRJNA579121. Accession numbers of entries under this BioProject and previously submitted bacterial 16S rDNA sequencing data7,20 are listed in Supplementary Table 4.


