Abstract
Synthetic cannabinoid receptor agonists (SCRAs), termed “Spice” or “K2”, are molecules that emulate the effects of the active ingredient of marijuana, and they have gained enormous popularity over the past decade. SCRAs are Schedule 1 drugs that are highly prevalent in the U.K. prison system and among homeless populations. SCRAs are highly potent and addictive. With no way to determine the dose/amount at the point-of care, they pose severe health risks to users, including psychosis, stroke, epileptic seizures, and they can kill. SCRAs are chemically diverse, with over a hundred compounds used as recreational drugs. The chemical diversity of SCRA structures presents a challenge in developing detection modalities. Typically, GC-MS is used for chemical identification; however, this cannot be in place in most settings where detection is critical, e.g., in hospital Emergency Departments, in custody suites/prisons, or among homeless communities. Ideally, real time, point-of-care identification of SCRAs is desirable to direct the care pathway of overdoses and provide information for informed consent. Herein, we show that fluorescence spectral fingerprinting can be used to identify the likely presence of SCRAs, as well as provide more specific information on structural class and concentration (∼1 μg mL–1). We demonstrate that that fluorescence spectral fingerprints, combined with numerical modeling, can detect both parent and combusted material, and such fingerprinting is also practical for detecting them in oral fluids. Our proof-of-concept study suggests that, with development, the approach could be useful in a range of capacities, notably in harm reduction for users of Spice/K2.
New psychoactive substances (NPSs), formerly known as “legal highs”, are compounds (not necessarily new, but now growing at ∼100 per annum) that are abused—they require new analytical methods, especially for point-of-care/in-the-field detection.1 Up-to-date testing of such illicit drugs in oral fluid is a major goal as it lacks an accurate method with suitable sensitivity that avoids false-positive and -negative responses.2 There is a clear need for accurate field testing of illicit drugs enabling immediate action to be taken at the scene.3 For health-care applications, ideally detection at the point-of-care is desirable, from both raw street-material and from a user sample, e.g., oral fluid, blood, or urine. Here we demonstrate that the combined excitation/emission spectrum is a sensitive spectral fingerprint of different synthetic cannabinoid receptor agonists (SCRAs) known as “Spice” or “K2”. Moreover, we demonstrate that this approach can detect low concentrations of SCRAs from street material, can detect the presence of combusted SCRAs, and is practical in their analysis even in oral fluids. We therefore propose a use for this approach in patient triage to manage overdoses and with application in harm reduction strategies.
SCRAs are a family of compounds designed to mimic the effects of tetrahydrocannabinol (THC) and cannabidiol (CBD), the psychoactive molecules in cannabis, by binding to CB1 and CB2 cannabinoid receptors and acting as agonists for receptor function. CB1 receptors are most commonly found in the peripheral and central nervous system, while the structurally smaller CB2 receptors are mostly expressed within the immune system. Under normal endogenous conditions, these cannabinoid receptors have been found to modulate a variety of physiological and cognitive processes including fertility, pregnancy, pre- and postnatal development, appetite, pain sensation, inflammation, mood, and memory,4−6 causing a number of major side effects, both psychological and physiological. These include, but are not limited to, acute kidney injury, vomiting, cardiovascular complications,7,8 agitation, irritability, confusion, hallucinations, delusions, psychosis, and even death.9 The severity of these side effects are thought to be due to SCRAs having unusually high binding affinities at CB receptors, coupled with acting as full agonists of CB receptors. Conversely, CBD and THC are only partial agonists of these receptors.10
At present a number of the most common SCRAs are Schedule 1 in the U.S. and Class B drugs in the U.K. and thus have criminal charges associated with their production, distribution, and possession. However, novel compounds are readily synthesized which circumvent some legal restrictions.11,12
Structurally, SCRAs share a common overall chemical architecture comprising a “tail”, “core”, “linker”, and “ring” position as shown in Figure 1. Novel SCRAs can be developed simply by substituting one or more of these structural motifs, producing novel compounds by different combinations of moieties. The range of substituents is given in Supporting Information Table S1 as reported by the European Monitoring Centre for Drugs and Drug Addiction (EMCDDA). However, this list rapidly changes. The ease with which new SCRAs are developed12 has led to the existence of a large number of known SCRAs, as recorded by the EMCDDA.13,14
Figure 1.
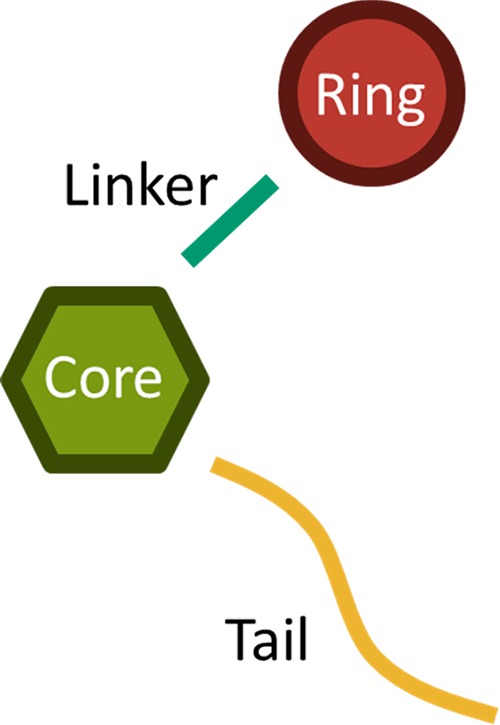
Structural overview of SCRAs. A range of specific substituents are given in Table S1.
SCRAs cannot be detected or identified using the standard urine-based enzyme-multiplied immune test for cannabis usage.12 Immunoassays that can test for specific SCRAs have been developed.15 However, this class of drug is so numerous (Figure 1 and Table S1) and novel compounds are synthesized so readily12,16 that such assays quickly become obsolete due to their specificity. Detection of SCRAs can be achieved using spectrometric and spectroscopic approaches including LC-QTOF-MS,16 LC-MS-MS,17 GC-MS,12,18,19 NMR,12,18,19 ATR-IR,20 and IMS.21,22
Despite the side effects, the potency and low cost of SCRAs have meant that they are widely abused across the world.23 Typically, users will not know which SCRA they have purchased and the amount of SCRA varies hugely from ∼5 to 100 mg.11 It is therefore common for users to overdose. At present, there is no immediate point-of-care test that can inform the care pathway for users who have overdosed on SCRAs. There is therefore value in identifying SCRAs as a general group, detecting individual SCRAs or SCRA mixtures. The vast majority of SCRAs have an indole or indazole group at the core position (Figure 1). Indeed, the recent rise of indole-based SCRAs is thought to be a continued effort to circumvent the Markush structure-based legal restrictions on previous generations of SCRAs, in which molecules with an indole core were uncommon. The fluorescent behavior of indole- and indazole-based molecules is heavily influenced by both the chemical substituents bound to the ring systems and the compound’s immediate solvent environment.24−31 For example, Carić et al. demonstrated that a range of substituted indole-3 acetic acids show significant variation in absorption and fluorescence spectra.27 Given the potential sensitivity of fluorescence to both the immediate solvent environment and chemical substituents, we reasoned that structurally distinct SCRAs would produce unique fluorescence spectral fingerprints, related to the specific chemical composition at each of the positions as shown in Figure 1 as well as the analyte solvent.
Materials and Methods
Collection of Fluorescence Spectral Fingerprints
All fluorescence measurements were taken using a PerkinElmer LS50B luminescence spectrometer (PerkinElmer, Waltham, MA, USA) attached to a water bath to allow for temperature regulation. Sample scans and background measurements were taken at 20 °C. The excitation and emission slit widths were set to be equal during each scan. The width of these slits was varied between 2.5 and 12 nm depending on the signal. In each case, the corresponding background measurement was directly subtracted, particularly to remove contributions from Raman scattering. The data shown have had the contributions from excitation light and second order scattering removed.
Sample Preparation
Some samples were extracted from (Police seized) street material prepared as we have recently described.18,19 Some SCRAs were purchased from Cayman Chemical Co. (Ann Arbor, MI, USA). Samples were dissolved in either deionized water, purified using an Elix essential water purification system (Merck Millipore, Burlington, MA, USA), or HPLC methanol >99.9% purity (Sigma-Aldrich, St Louis, MO, USA). Oral fluid samples were collected from volunteers who confirmed no legal or illegal drug use in the preceding month. The oral fluid samples were passed through a 0.44 μm syringe-driven filter.
Results and Discussion
Unique FSFs from Different SCRAs
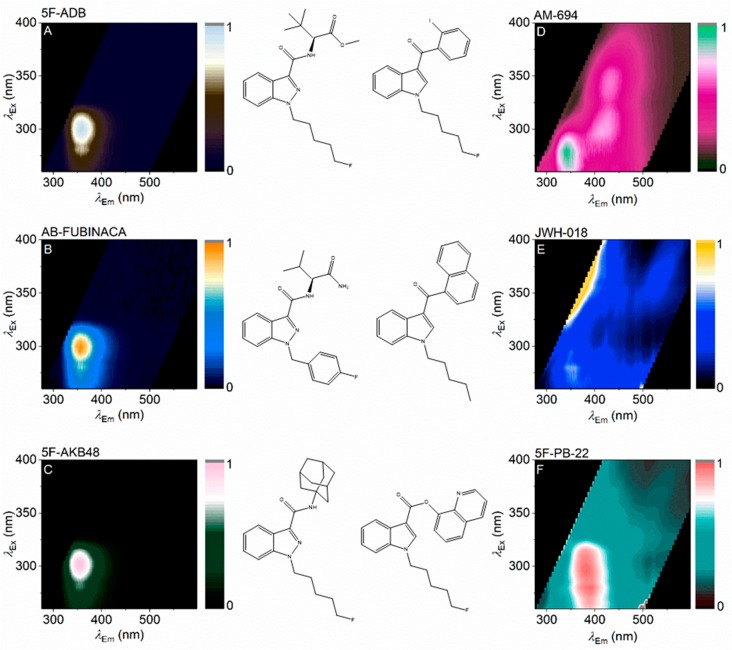
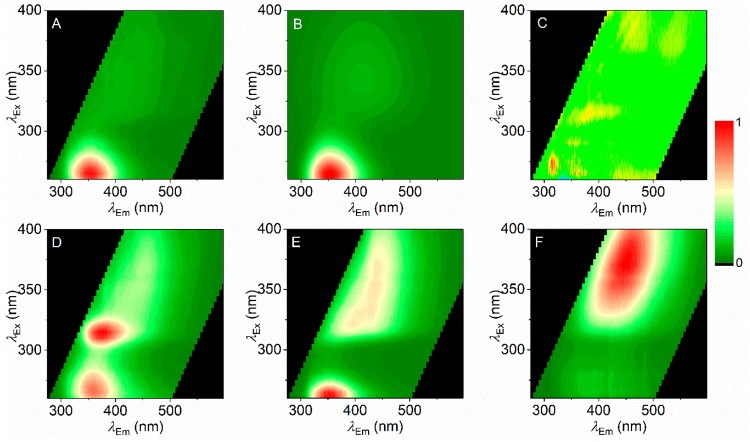
Figure 2 shows the combined excitation/emission matrix for different SCRAs, including three where the core group is an indazole (Figure 2A–-C) and three where the core group is an indole (Figure 2D–F). These excitation/emission matrices represent a fluorescence spectral fingerprint (FSF) of the individual SCRAs. That the structure of the FSF for each SCRA is consistent across a range of concentrations is discussed below.
Figure 2.
FSFs for a range of SCRAs. FSFs are shown next to the associated SCRA structure with either an indazole (A–C) or indole (E, F) at the core position (Figure 1). Coloration represents relative emission with the maximum at 1.
The indoles each have a highly conjugated ring system at the “ring” position: iodophenyl (Figure 2D), naphthyl (Figure 2E), and quinolinyl (Figure 2F) groups. The resulting FSF is complex in each case. AM-694 shows a feature attributable to the indole group (λex ∼275 nm; λem ∼350 nm,). A similar feature is also apparent with JWH-018. The observed FSF will also be affected by the presence of a cross-conjugated system spanning the ring systems, particularly where the linker group is a simple ketone (methanone) (Figure 2D,E). Indeed, with a carboxylate linker (Figure 2F), the FSF has a unique structure not obviously attributable to an indole or quinoline. For the indoles studied, it appears the FSF is particularly sensitive to the nature of the ring group and variance in this position gives a unique FSF that is readily identifiable. We note that much of the FSF for the SCRAs with multiple chromophores appears to be diffuse and broad. However, the FSFs are consistent as shown below.
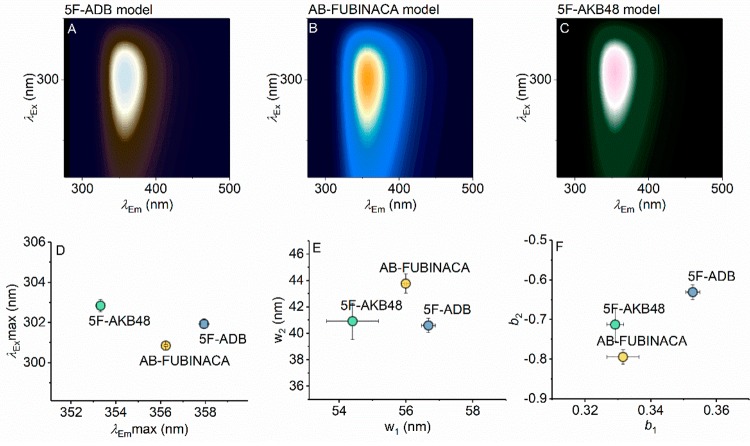
In contrast to the indoles studied, the indazoles (Figure 2A–C) lack a conjugated ring system at the ring position so the observed FSF is essentially entirely dominated by the indazole moiety fluorophore (Figure 2A–C; λex ∼300 nm; λem ∼355 nm). To the eye, the indazole FSFs appear essentially identical. However, the fingerprints are quantifiably unique, showing characteristic differences in both the excitation and emission axes. Where these differences are not obvious to the eye, the FSFs can be fit with a function that accurately models the spectral data,
| 1 |
eq 1 is a modified Fraser–Suzuki function that models a sum of two-dimensionally skewed Gaussian functions, where A is the amplitude, w the full width at half-maximum (fwhm), and b a skewness parameter. The number of skewed Gaussians used to accurately model a given FSF is determined by increasing the number of skewed Gaussians until the residual of the fit and fitting statistics (R2) stop changing meaningfully. Similar functions are typically used to model excitation/emission spectra individually, and the quality of the fit to the individual FSFs is excellent. Panels A–C of Figure 3 show the results of fitting eq 1 to each of the indazole SCRAs across a range of different concentrations, and panels D–F of Figure 3 show the resulting fit parameters, demonstrating that each of the indazole fingerprints are quantifiably unique. That is, each of the parameters extracted from eq 1 are different for each of the indazole SCRAs. Moreover, panels D and E of Figure 3 show that the differences in the FSFs for the indazole SCRAs are highly reproducible across a range of different concentrations (∼1–5 μg mL–1). As we discuss below, this is similar to detection levels of THC in saliva and so is a physiologically relevant range of detection.
Figure 3.
Surface fits of eq 1 to the data shown in Figure 2A–C (panel A, 5F-ADB; panel B, AB-FUBINACA; panel C, 5F-AKB48). The resulting parameters from fitting to eq 1 are shown in panels D–F, for maxima of excitation/emission, spectral width, and skewness, respectively. Error bars are the standard deviation from fitting three to five different concentrations of each SCRA (∼1–5 μg mL–1). Color levels as in Figure 2 (relative emission).
5F-ADB and 5F-AKB-48 provide an excellent point of comparison since the only difference between these SCRAs is at the ring position, with a tert-leucinate and adamantyl group, respectively. Despite these groups not being fluorescent or absorptive in the wavelength range studied, they are apparently sufficient to affect the FSF appreciably (Figure 3D–F). These data therefore suggest the highly sensitive nature of the indole/indazole groups to a range of physical properties that affect the fluorescence characteristics, allowing specific discrimination using quantified FSFs. Moreover, the data point to the future potential of using the FSFs to assign specific chemical features. We see particular potential in identifying cross-conjugation at the linker position given the sensitivity shown for the indoles above.
Concentration and Solvent Dependence on SCRA FSFs
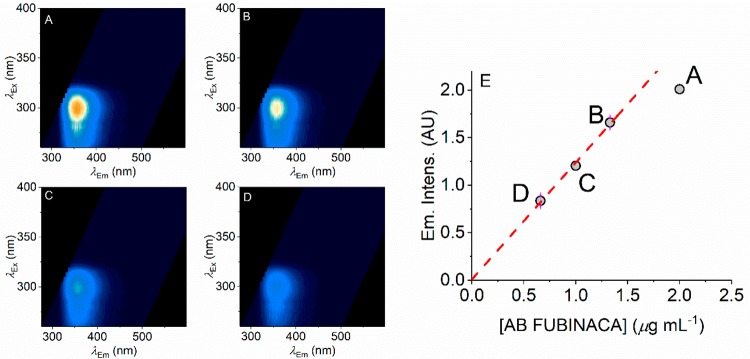
Potentially the concentration of a SCRA could be inferred from the intensity of the emission at a specific wavelength, on the basis of a known calibration curve. That is, fluorophore concentration should have a linear dependence with respect to emission intensity. Using fluorescence intensity readings in this way is restricted to relatively low concentrations because at elevated concentrations the observed intensity becomes significantly affected by the inner filter effect.32,33 That is, the fluorescence intensity stops having a linear dependence with concentration and ultimately decreases with increasing concentration. Figure 4 shows AB FUBINACA FSFs across a range of concentrations (Figure 4A–D), and the quality of the FSF remains excellent even at low concentrations (<1 μg mL–1). Clearly, even lower concentrations could easily be detected by using a more intense light source (excitation power in the present case is ∼0.1 μW) or through longer acquisition times. For example, UV LEDs have become increasingly powerful (mW range) and with relatively tight spectral bandwidths (∼10 nm) and these very much lend themselves to portable applications.
Figure 4.
Concentration dependence of AB FUBINACA FSFs. (A–D) FSFs for different concentrations of AB FUBINACA with decreasing concentration shown in panels A → D. (E) Plot of concentration versus peak emission intensity. The red dashed line shows the linear dependence of the lower (first three) concentrations with the higher concentration deviating from linearity as discussed in the main text. Color levels as in Figure 2B (relative emission).
Figure 4E shows the plot of AB FUBINACA concentration versus peak emission intensity. As expected, these data show an essentially linear relationship at low concentrations (∼1 μg mL–1). At elevated concentrations the linear relationship begins to break down as the inner filter effect becomes apparent.32,33 Other SCRAs show a similar relationship and a linear range as shown for AM-694 in Figure S1. Therefore, these data suggest that the concentration of SCRAs could potentially be inferred from the absolute magnitude of the intensity reading, as long as it is within the linear range of detection (i.e., concentrations below where the inner filter effect becomes significant). Clearly there is also the potential to dilute samples.
Solvent specific effects on the FSFs are important since detecting FSFs in complex biological material (e.g., oral fluid as below) is our goal. We observe changes in emission intensity depending on solvent but in an SCRA dependent manner. For example, AB FUBINACA shows essentially similar intensities in either water or methanol, whereas AM-694 is significantly more emissive in methanol than water.
These differences in intensity might have a component of solubility. For example, AKB-48 is essentially completely insoluble in H2O owing to the extreme hydrophobicity of the adamantyl group (Figure 2) at the ring position (Figure 1). Beyond an absolute change in emission intensity at the same concentration, the structure of the FSF shows additional changes with respect to both excitation and emission wavelengths. AB FUBINACA in H2O shows significant shifts compared to when dissolved in MeOH (Figure S2), in terms of both the absolute peak position but also spectral width and skewness as assessed from fitting to eq 1 (Figure S2A; red cross corresponding to MeOH data as Figure 3D). The effect is primarily on the emission spectrum, with a red shift in the maximum emission intensity (+∼15 nm). We observe an essentially identical red shift in H2O for 5F-ADB (Figure S3). The differential effect of the solvent is more noticeable still with AM-694 with a global change in the FSF, though retaining a largely diffuse FSF (Figure S4).
We note that the relationship between concentration and peak intensity is essentially the same in either MeOH or H2O (Figures 4 and S1–S4). Our data therefore are consistent with the conclusion that the SCRA FSFs are not just extremely sensitive to chemical diversity but also to the solvent used. That is, the FSF will need to be specific to the milieu in which the SCRA is present. These data therefore point to the potential of differential solvent measurements to enhance the discriminatory ability of the FSFs.
Unique FSFs from a Smoking Model and in Oral Fluid
The FSFs shown in Figure 2 are either extracted and purified from street material (5F-ADB, AM-694, 5F-PB-22) or purchased pure from a supplier (AB-FUBINACA, JWH-018, and 5F-AKB-48). However, SCRAs are most commonly smoked, meaning the SCRA itself will be combusted in the presence of the (typically) plant material upon which the SCRA is delivered.
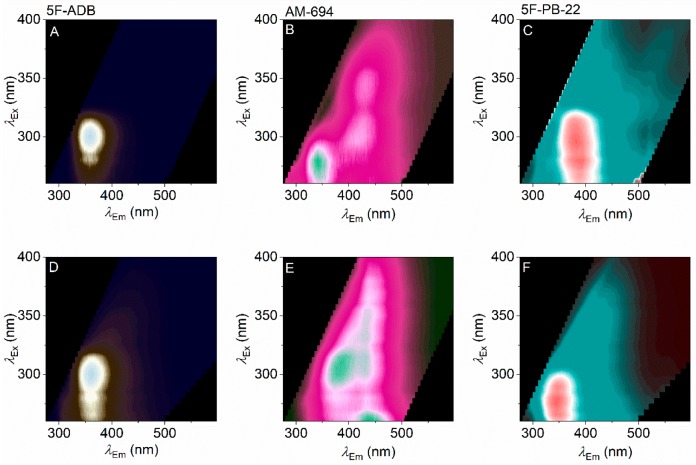
Recently, we have developed and applied a realistic smoking model to show the breakdown products for a range of SCRAs (including 5F-ADB, AM-694, and 5F-PB-22), assessed by UHPLC-TOF-ESI-MS and GC-MS.19 In that study, we found essentially no contribution from the plant matter nor any tobacco present in the smoking model. Instead, the smoking model shows the presence of the parent compound in each case and some combustion products. These combustion products include 1-(5-fluoropentyl)-indole and 1-pentyl-indole (from 5F-PB-22). Panels A–C of Figure 5 show the FSFs for 5F-ADB, AM-694, and 5F-PB-22, respectively, and the corresponding FSFs from the smoking model are shown in Figure 5D–F.
Figure 5.
Effect of pyrolysis on SCRA FSFs. (A–C) FSFs for parent compounds as in Figure 2 (panel A, 5F-ADB; panel B, AM-694; panel C, 5F-PB-22). (D–F) Corresponding FSFs of combusted material via our smoking model. Color levels as in Figure 2 (relative emission).
From Figure 5A–F, the most noticeable changes are with 5F-PB-22, where the notional quinoline emission becomes less obvious and is replaced by an FSF that is more reminiscent of an indole. This correlates well with the findings from the smoking model analysis (above), where 5F-PB-22 shows the most significant combustion products of the three SCRAs, a substituted indole. The FSFs therefore mirror the analysis from UHPLC-TOF-ESI-MS and GC-MS,19 albeit providing a more qualitative description. Observing this correlation is therefore further evidence for the sensitivity of the FSFs for each SCRA and suggests the FSFs could potentially be used where there is a heterogeneous mixture of SCRAs/combustion products.
Ultimately, we aim to detect the presence of (combusted) SCRAs in oral fluid, as this would provide a means to triage noncommunicative or comatose patients in hospital Emergency Departments. Oral fluid will however have its own unique FSF that will be convolved with the SCRA FSF. Figure 6A shows an example FSF of human oral fluid combined from six different samples (Figure S5). The oral fluid FSF (Figure 6A) can be accurately modeled using eq 1 with two species (Figure 6B), with the resulting residuals plotted in Figure 6C. The resulting parameters of the fits are given in Table S2. The residuals analysis shows nonlocalization and small variance, suggesting that fitting the oral fluid FSF with a two species model is sufficient to accurately model the data. We note that these two spectral features are present in all of the volunteer samples collected, so this two species model can perhaps be generalized.
Figure 6.
Detecting combusted SCRAs in oral fluid. (A) FSF of a combined oral fluid sample from a number of volunteers (individual FSFs shown in Figure S5). (B) Model of the oral fluid sample from fitting eq 1 to panel A. (C) Residuals arising from the fit of eq 1 (panel B) to the oral fluid FSF (panel A). (D–F) FSFs for combusted SCRAs in the presence of oral fluid (panel D, 5F-ADB; panel E, AM-694; panel F, 5F-PB-22).
Oral fluid is composed of a large number of enzymes and proteins and at a relatively high concentration in addition to glycosaminoglycans, a range of electrolytes, thiocyanate, hydrogen peroxide, and opiorphin. Moreover, the enzymes/proteins present contain a range of cofactors including cobalamin, heme, and nicotinamide adenine dinucleotide (phosphate) hydride (NAD(P)H). We anticipate that the fluorescence signal will be dominated by the aromatic amino acids present in the high concentration of protein (oral fluid enzymes) present. Indeed, for a range of different participants’ samples, a similar feature is observed (Figure S5), approximately as one would expect given the known excitation/emission maxima of tyrosine, phenylalanine, and tryptophan (λex ∼264 nm; λem ∼352 nm). A second feature is also apparent in the oral fluid samples (Figure S5 and Figure 6A); λex ∼343 nm, and λem ∼ 413 nm. It is tempting to speculate that this signal is attributable to (NAD(P)H), which has an absorption maximum at λmax = ∼340 nm, but clearly this signal will also be convolved of other cofactors. We note that the second spectral feature is present at ∼11 ± 5% of the putative protein signal as assessed from fitting eq 1 to each of the individual oral fluid samples (Table S1).
To assess if SCRAs can be detected via their FSF in oral fluid, we mixed combusted SCRAs (Figure 5D–-F; 5F-ADB, AM-694, and 5F-PB-22) in the presence of the combined oral fluid sample (Figure 6A) and recorded the resultant FSFs (Figure 6D–F). THC is found at ∼1 μg mL–1 immediately after smoking, so the concentration range we used for the SCRAs is realistic in context.34,35 We note that the oral fluid samples used were not diluted appreciably on addition of the SCRA; the only preparation was filtering.
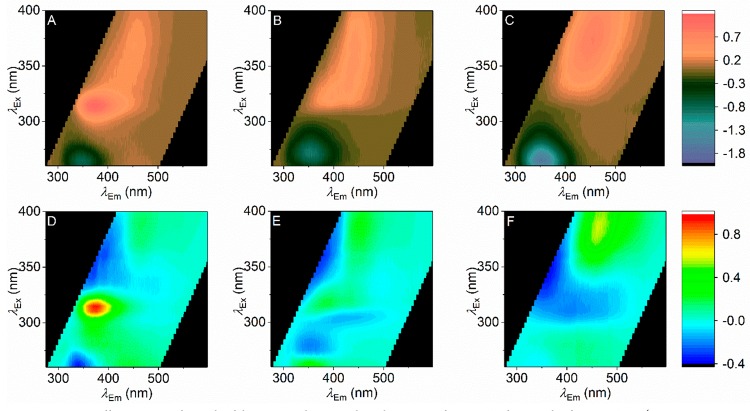
Figure 7 shows the quantification of the difference between the combusted SCRAs in the presence and absence of oral fluid. Panels A–C of Figure 7 show a simple subtraction of the oral fluid FSF (Figure 6A) for each of the combusted SCRAs. From Figure 7A–C we find that the presence of the SCRA caused the emission attributable to oral fluid proteins to be heavily quenched (negative purple peak). It seems likely given the extremely high concentration of protein in human oral fluid that one could expect significant resonance energy transfer (RET) to the SCRAs, and this would seem a likely cause of the smaller magnitude emission arising from the protein signal. Moreover, from Figure 7A–C, the new emission signals (coral) are SCRA specific. That is, even at the most simple level of analysis, the different combusted SCRAs show unique FSFs even in the presence of oral fluid. Panels D and E of Figure 7 show an alternative analysis where the numerical model of the oral fluid FSF (Figure 6B) is fitted to the oral fluid SCRA FSF (Figure 6D–F), allowing only the amplitude of each of the two species in Figure 6B to vary. Panels D and E of Figure 7 are then the plot of the resulting residuals, i.e., the features of the FSF that are not captured by the model of oral fluid alone. This analysis has the advantage that any changes in the emission intensity of each of the spectral features attributable to oral fluid are accounted for. Comparing the residuals for each SCRA (Figure 7D,E) to the residuals for oral fluid alone (Figure 6C), it is clear that the oral fluid model alone cannot account for a large proportion of the residuals. Similar to the difference FSFs shown in Figure 7A–C, these data suggest that the presence of the individual SCRAs can be disambiguated from oral fluid alone using model fitting.
Figure 7.
(A-C) Difference FSFs for each of the SCRAs shown as the subtraction of Figure 6A from each of Figure 6D–F (panel A, 5F-ADB; panel B, AM-694; panel C, 5F-PB-22). (D–F) Residuals arising from the fit of the model shown in Figure 6B to each of the SCRA + oral fluid FSFs shown in Figure 6D–F (panel D, 5F-ADB; panel E, AM-694; panel F, 5F-PB-22).
Comparing the combusted FSFs (Figure 5D–F) to those in the presence of oral fluid (Figure 7), some aspects of the FSF are retained in the presence of oral fluid. However, the oral fluid + SCRA FSFs do not appear to be a simple superposition of the combusted SCRAs and oral fluid alone. From Figure 7, 5F-ADB + oral fluid, the signal attributable to the indazole group is readily apparent and shifted somewhat compared to the combusted material in solvent (Figure 5D); λex ∼ 314 nm; λem ∼ 376 nm. AM-694 + oral fluid retains a broad spectral feature at λem ∼ 440 nm and a more defined spectral feature at λem ∼ 385 nm, similar to combusted AM-694 alone (Figure 5E). Finally, 5F-PB-22 shows little to no contribution from the same species present in oral fluid (Figure 5F); instead there is a single feature readily apparent at λex ∼ 370 nm and λem ∼450 nm, potentially reflecting the quinoline of 5F-PB-22. Thus, the indole emission of the core position is almost entirely quenched, but potentially the emission of the quinoline in 5F-PB-22 (Figure 2F) is sensitized in oral fluid.
At a simple level, oral fluid presents a milieu that one would reasonably expect to affect fluorophore emission through direct collisional effects, (F)RET between different chromophores, differences in solvent dielectric, quenching by metal, and pH variation. Therefore, it is perhaps unsurprising that the SCRA FSFs in oral fluid show a significant amount of variance from those measured in H2O/MeOH. However, these data illustrate that each of the combusted SCRAs can be separately detected in oral fluid and that each of the SCRAs retain a unique, identifiable FSF. We note that we have attempted detection of SCRAs in urine; however, we find that the emission attributable to the SCRAs is entirely quenched, presumably via (F)RET to the extremely high concentrations of creatinine/uric acid. We would point to the relative simplicity of the saliva samples we have used to demonstrate SCRA detection and clearly a major challenge moving forward will be the addition of other molecules that may give a signal, in terms of both false -positives and -negatives.
Conclusions
SCRAs are a heterogeneous group of compounds that show significant chemical diversity. Our data show that FSFs of these compounds are unique, owing to a complex interplay between a number of factors including (i) solvent effects, (ii) substituent effects, (iii) conjugation between chromophores, and (iv) (F)RET between chromophores. These factors combine to give rise to the uniqueness of the FSFs. Our data suggest that the FSF might be able to disambiguate even the factors above and this would provide an enhanced utility of the FSFs in terms of structural discrimination. However, we would stress that the FSFs will be challenging to calculate a priori so the power of the approach will develop as FSFs for a greater variety of structural classes and variants are gathered.
SCRA use is almost entirely localized to prisons and homeless groups.36 SCRAs can be packaged as essentially pure compounds or as mixtures of SCRAs, and on a range of matrices. Combined, these factors make detection and sensing of SCRAs challenging, and there is a need for new tools to suit specific detection niches. Our work provides evidence that combined excitation/emission matrices (FSFs) can discern SCRAs to a high degree of accuracy and against complex biological backgrounds (oral fluid). These data therefore represent a clear proof-of-principle that FSFs have potential as an analytical tool in the detection of SCRAs. The collection of FSFs is simple and can be easily achieved using a relatively small portable instrument.
The challenges for developing the approach are discrimination of mixtures that are superimposed on a potentially complex background, e.g., oral fluid containing other drugs, prescription medication, and metabolites. We have shown that numerical modeling of FSFs, e.g., using eq 1, has the potential to discriminate individual SCRAs and that also in the presence of a complex milieu (oral fluid). This suggests that more advanced analyses such as machine learning could be fruitfully applied to discriminate the presence of SCRAs. We note that this approach relies on libraries of data. We stress that our data illustrate the need to build these libraries for specific detection scenarios, discerning SCRA presence, e.g., from street material, versus from smoked material in oral fluid.
Given the apparent detection sensitivity of FSFs, we propose that as we develop this approach, it will find utility in reducing the number of admissions to hospital for SCRA overdose if used as part of a community harm reduction strategy. Combined with detection capability at the point-of-care in hospitals allowing enhanced clinical decision making, the approach could significantly reduce the costs of SCRA abuse to health services.
Acknowledgments
C.R.P. acknowledges funding from the EPSRC; B.M. has a Ph.D. studentship funded by the BBSRC; H.A.N. has a Ph.D. studentship funded by the Kuwaiti Government. We acknowledge the Drug Enforcement Action Team (DEAT), Avon, and Somerset Constabulary for the provision of SCRA samples and for their interest in our work.
Supporting Information Available
The Supporting Information is available free of charge on the ACS Publications website at DOI: 10.1021/acs.analchem.9b03037.
Known species, which compose SCRAs; results of model fitting; concentration and solvent dependencies of FSFs (PDF)
Author Contributions
B.M., C.R.P., and S.M.H. designed the experiments. B.M. and H.A.N. performed the experiments. All of the authors analyzed the data and wrote and edited the manuscript in close collaboration.
The authors declare no competing financial interest.
Supplementary Material
References
- Smith J. P.; Sutcliffe O. B.; Banks C. E. Analyst 2015, 140, 4932–4948. 10.1039/C5AN00797F. [DOI] [PubMed] [Google Scholar]
- Risoluti R.; Gullifa G.; Battistini A.; Materazzi S. Anal. Chem. 2019, 91, 6435–6439. 10.1021/acs.analchem.9b00197. [DOI] [PubMed] [Google Scholar]
- Krauss S. T.; Remcho T. P.; Lipes S. M.; Aranda R.; Maynard H. P.; Shukla N.; Li J.; Tontarski R. E.; Landers J. P. Anal. Chem. 2016, 88, 8689–8697. 10.1021/acs.analchem.6b01982. [DOI] [PubMed] [Google Scholar]
- Fride E. Eur. J. Pharmacol. 2004, 500, 289–297. 10.1016/j.ejphar.2004.07.033. [DOI] [PubMed] [Google Scholar]
- Pertwee R. G. Int. J. Obes. 2006, 30, S13–S18. 10.1038/sj.ijo.0803272. [DOI] [PubMed] [Google Scholar]
- Pawson A. J.; Sharman J. L.; Benson H. E.; Faccenda E.; Alexander S. P. H.; Buneman O. P.; Davenport A. P.; McGrath J. C.; Peters J. A.; Southan C.. Guide to Pharmacology, Version 2019.3; International Union of Basic and Clinical Pharmacology (IUPHAR)/British Pharmacological Society (BPS), Jun. 13, 2019; accessed Jul. 2, 19.
- Acute Kidney Injury Associated with Synthetic Cannabinoid Use-Multiple States, 2012. Morb. Mortal. Wkly. Rep. 2013, 62, 93–98. https://www.cdc.gov/mmwr/preview/mmwrhtml/mm6206a1.htm. [PMC free article] [PubMed] [Google Scholar]
- Pacher P.; Steffens S.; Haskó G.; Schindler T. H.; Kunos G. Nat. Rev. Cardiol. 2018, 15, 151–166. 10.1038/nrcardio.2017.130. [DOI] [PubMed] [Google Scholar]
- Cohen K.; Weinstein A. M. Front. Public Health 2018, 6, 162. 10.3389/fpubh.2018.00162. [DOI] [PMC free article] [PubMed] [Google Scholar]
- Hermanns-Clausen M.; Kneisel S.; Szabo B.; Auwärter V. Addiction 2013, 108, 534–544. 10.1111/j.1360-0443.2012.04078.x. [DOI] [PubMed] [Google Scholar]
- Psychoactive Substance Act 2016. 2016, available at: http://www.legislation.gov.uk/ukpga/2016/2/contents/enacted/data.htm, accessed Jul. 2, 2019.
- Lindigkeit R.; Boehme A.; Eiserloh I.; Luebbecke M.; Wiggermann M.; Ernst L.; Beuerle T. Forensic Sci. Int. 2009, 191, 58–63. 10.1016/j.forsciint.2009.06.008. [DOI] [PubMed] [Google Scholar]
- Synthetic cannabinoids in Europe; European Monitoring Centre for Drugs and Drug Addiction; (www.emcdda.europa.eu): Lisbon, Portugal, Jun. 6, 2017; http://www.emcdda.europa.eu/topics/pods/synthetic-cannabinoids_en, accessed Jul. 2, 2019.
- Fattore L.; Fratta W. Front. Behav. Neurosci. 2011, 5, 60. 10.3389/fnbeh.2011.00060. [DOI] [PMC free article] [PubMed] [Google Scholar]
- Kronstrand R.; Brinkhagen L.; Birath-Karlsson C.; Roman M.; Josefsson M. LC-QTOF-MS as a Superior Strategy to Immunoassay for the Comprehensive Analysis of Synthetic Cannabinoids in Urine. Anal. Bioanal. Chem. 2014, 406 (15), 3599–3609. 10.1007/s00216-013-7574-x. [DOI] [PubMed] [Google Scholar]
- Auwärter V.; Dresen S.; Weinmann W.; Müller M.; Pütz M.; Ferreirós N. ‘Spice’ and Other Herbal Blends: Harmless Incense or Cannabinoid Designer Drugs?. J. Mass Spectrom. 2009, 44 (5), 832–837. 10.1002/jms.1558. [DOI] [PubMed] [Google Scholar]
- Moran C.; Le V.; Chimalakonda K.; Smedley A.; Lackey F.; Owen S.; Kennedy P.; Endres G.; Ciske F.; Kramer J.; Kornilov A.; Bratton L.; Dobrowolski P.; Wessinger W.; Fantegrossi W.; Prather P.; James L.; Radominska-Pandya A.; Moran J. Quantitative Measurement of JWH-018 and JWH-073 Metabolites Excreted in Human Urine. Anal. Chem. 2011, 83, 4228–4236. 10.1021/ac2005636. [DOI] [PMC free article] [PubMed] [Google Scholar]
- Naqi H. A.; Pudney C. R.; Husbands S. M.; Blagbrough I. S. Analysis of Synthetic Cannabinoid Agonists and Their Degradation Products after Combustion in a Smoking Simulator. Anal. Methods 2019, 11, 3101–3107. 10.1039/C9AY00722A. [DOI] [Google Scholar]
- Naqi H. A.; Woodman T. J.; Husbands S. M.; Blagbrough I. S. 19F and 1H Quantitative-NMR Spectroscopic Analysis of Fluorinated Third-Generation Synthetic Cannabinoids. Anal. Methods 2019, 11, 3090–3100. 10.1039/C9AY00814D. [DOI] [Google Scholar]
- de la Asunción-Nadal V.; Armenta S.; Garrigues S.; de la Guardia M. Identification and Determination of Synthetic Cannabinoids in Herbal Products by Dry Film Attenuated Total Reflectance-Infrared Spectroscopy. Talanta 2017, 167, 344–351. 10.1016/j.talanta.2017.02.026. [DOI] [PubMed] [Google Scholar]
- Cumeras R.; Figueras E.; Davis C. E.; Baumbach J. I.; Gràcia I. Review on Ion Mobility Spectrometry. Part 1: Current Instrumentation. Analyst 2015, 140, 1376–1390. 10.1039/C4AN01100G. [DOI] [PMC free article] [PubMed] [Google Scholar]
- Kanu A. B.; Dwivedi P.; Tam M.; Matz L.; Hill H. H. Ion Mobility-Mass Spectrometry. J. Mass Spectrom. 2008, 43, 1–22. 10.1002/jms.1383. [DOI] [PubMed] [Google Scholar]
- Brents L. K.; Prather P. L. The K2/Spice Phenomenon: Emergence, Identification, Legislation and Metabolic Characterization of Synthetic Cannabinoids in Herbal Incense Products. Drug Metab. Rev. 2014, 46 (1), 72–85. 10.3109/03602532.2013.839700. [DOI] [PMC free article] [PubMed] [Google Scholar]
- Adlam G.; Blagbrough I. S.; Taylor S.; Latham H. C.; Haworth I. S.; Rodger A. Multiple Binding Modes with DNA of Anthracene-9-Carbonyl-N1-Spermine Probed by LD, CD, Normal Absorption, and Molecular Modelling Compared with Those of Spermidine and Spermine. Bioorg. Med. Chem. Lett. 1994, 4, 2435–2440. 10.1016/S0960-894X(01)80405-4. [DOI] [Google Scholar]
- Rodger A.; Blagbrough I. S.; Adlam G.; Carpenter M. L. DNA Binding of a Spermine Derivative: Spectroscopic Study of Anthracene-9-carbonyl-n1-spermine with Poly[d(G-C)·(d(G-C))] and Poly[d(A-T)·d(A-T)]. Biopolymers 1994, 34, 1583–1593. 10.1002/bip.360341203. [DOI] [PubMed] [Google Scholar]
- Rodger A.; Taylor S.; Adlam G.; Blagbrough I. S.; Haworth I. S. Multiple DNA Binding Modes of Anthracene-9-Carbonyl-N1-Spermine. Bioorg. Med. Chem. 1995, 3, 861–872. 10.1016/0968-0896(95)00086-V. [DOI] [PubMed] [Google Scholar]
- Carić D.; Tomišić V.; Kveder M.; Galić N.; Pifat G.; Magnus V.; Šoškić M. Absorption and Fluorescence Spectra of Ring-Substituted Indole-3-Acetic Acids. Biophys. Chem. 2004, 111, 247–257. 10.1016/j.bpc.2004.06.006. [DOI] [PubMed] [Google Scholar]
- Adjimatera N.; Neal A. P.; Blagbrough I. S.. Fluorescence techniques in non-viral gene therapy. In Fluorescence Spectroscopy in Biology Advanced Methods and their Applications to Membranes, Proteins, DNA, and Cells; Hof M., Hutterer R., Fidler V., Eds.; Fluorescence: Methods and Applications, Wolfbeis O. S., Series Ed.; Springer-Verlag: Berlin, 2005; Vol. 3, pp 201–228. [Google Scholar]
- Principles of Fluorescence Spectroscopy, 3rd ed.; Lakowicz J. R., Ed.; Springer: New York, NY, USA, 2006, 10.1007/978-0-387-46312-4. [DOI] [Google Scholar]
- Díaz M. S.; Freile M. L.; Gutierrez M. I. Photochem. Photobiol. Sci. 2009, 8, 970–974. 10.1039/b822363g. [DOI] [PubMed] [Google Scholar]
- Abou-Hatab S.; Spata V. A.; Matsika S. J. Phys. Chem. A 2017, 121, 1213–1222. 10.1021/acs.jpca.6b12031. [DOI] [PubMed] [Google Scholar]
- Chen S.; Yu Y. L.; Wang J. H. Inner Filter Effect-Based Fluorescent Sensing Systems: A Review. Anal. Chim. Acta 2018, 999, 13–26. 10.1016/j.aca.2017.10.026. [DOI] [PubMed] [Google Scholar]
- Tian D.; Wu S.; Zhang H.; Jiang L.; Huo F. Application of Inner Filter Effect Technology in Biological Detection and Disease Markers. Prog. Chem. 2019, 31, 413–421. [Google Scholar]
- Lee D.; Huestis M. A. Drug Test. Anal. 2014, 6, 88–111. 10.1002/dta.1514. [DOI] [PMC free article] [PubMed] [Google Scholar]
- Milman G.; Schwope D. M.; Gorelick D. A.; Huestis M. A. Cannabinoids and Metabolites in Expectorated Oral Fluid Following Controlled Smoked Cannabis. Clin. Chim. Acta 2012, 413, 765–770. 10.1016/j.cca.2012.01.011. [DOI] [PMC free article] [PubMed] [Google Scholar]
- Joseph A. M.; Manseau M. W.; Lalane M.; Rajparia A.; Lewis C. F. Characteristics Associated with Synthetic Cannabinoid Use among Patients Treated in a Public Psychiatric Emergency Setting. Am. J. Drug Alcohol Abuse 2017, 43, 117–122. 10.1080/00952990.2016.1240799. [DOI] [PubMed] [Google Scholar]
Associated Data
This section collects any data citations, data availability statements, or supplementary materials included in this article.
Data Citations
- Pawson A. J.; Sharman J. L.; Benson H. E.; Faccenda E.; Alexander S. P. H.; Buneman O. P.; Davenport A. P.; McGrath J. C.; Peters J. A.; Southan C.. Guide to Pharmacology, Version 2019.3; International Union of Basic and Clinical Pharmacology (IUPHAR)/British Pharmacological Society (BPS), Jun. 13, 2019; accessed Jul. 2, 19.


