Abstract
Water lilies belong to the angiosperm order Nymphaeales. Amborellales, Nymphaeales and Austrobaileyales together form the so-called ANA-grade of angiosperms, which are extant representatives of lineages that diverged the earliest from the lineage leading to the extant mesangiosperms1–3. Here we report the 409-megabase genome sequence of the blue-petal water lily (Nymphaea colorata). Our phylogenomic analyses support Amborellales and Nymphaeales as successive sister lineages to all other extant angiosperms. The N. colorata genome and 19 other water lily transcriptomes reveal a Nymphaealean whole-genome duplication event, which is shared by Nymphaeaceae and possibly Cabombaceae. Among the genes retained from this whole-genome duplication are homologues of genes that regulate flowering transition and flower development. The broad expression of homologues of floral ABCE genes in N. colorata might support a similarly broadly active ancestral ABCE model of floral organ determination in early angiosperms. Water lilies have evolved attractive floral scents and colours, which are features shared with mesangiosperms, and we identified their putative biosynthetic genes in N. colorata. The chemical compounds and biosynthetic genes behind floral scents suggest that they have evolved in parallel to those in mesangiosperms. Because of its unique phylogenetic position, the N. colorata genome sheds light on the early evolution of angiosperms.
Subject terms: Molecular evolution, Genome evolution, Plant evolution
The genome of the tropical blue-petal water lily Nymphaea colorata and the transcriptomes from 19 other Nymphaeales species provide insights into the early evolution of angiosperms.
Main
Many water lily species, particularly from Nymphaea (Nymphaeaceae), have large and showy flowers and belong to the angiosperms (also called flowering plants). Their aesthetic beauty has captivated notable artists such as the French impressionist Claude Monet. Water lily flowers have limited differentiation in perianths (outer floral organs), but they possess both male and female organs and have diverse scents and colours, similar to many mesangiosperms (core angiosperms, including eudicots, monocots, and magnoliids) (Supplementary Note 1). In addition, some water lilies have short life cycles and enormous numbers of seeds4, which increase their potential as a model plant to represent the ANA-grade of angiosperms and to study early evolutionary events within the angiosperms. In particular, N. colorata Peter has a relatively small genome size (2n = 28 and approximately 400 Mb) and blue petals that make it popular in breeding programs (Supplementary Note 1).
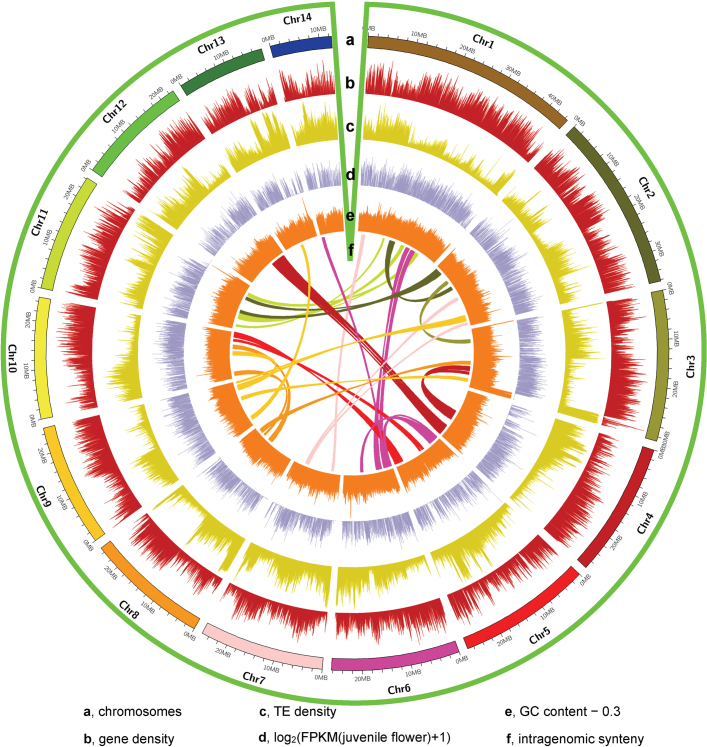
We report here the genome sequence of N. colorata, obtained using PacBio RSII single-molecule real-time (SMRT) sequencing technology. The genome was assembled into 1,429 contigs (with a contig N50 of 2.1 Mb) and total length of 409 Mb with 804 scaffolds, 770 of which were anchored onto 14 pseudo-chromosomes (Extended Data Fig. 1 and Extended Data Table 1). Genome completeness was estimated to be 94.4% (Supplementary Note 2). We annotated 31,580 protein-coding genes and predicted repetitive elements with a collective length of 160.4 Mb, accounting for 39.2% of the genome (Supplementary Note 3).
Extended Data Fig. 1. High-quality genome of N. colorata allows integration of genetic and expression data.
a, The assembled 14 chromosomes. b, Gene density plotted in a 100-kb sliding window. c, Transposable element (TE) density plotted in a 100-kb sliding window. d, Gene expression atlas of the juvenile flower, expression values were transformed with log2(FPKM + 1). e, GC content plotted in a 100-kb sliding window. f, Intragenomic syntenic regions denoted by a single line represent a genomic syntenic region covering at least 20 paralogues.
Extended Data Table 1.
Statistics of the sequenced and assembled genome of N. colorata
*The reads only include sequencing by PacBio RS II SMRT sequencing technology.
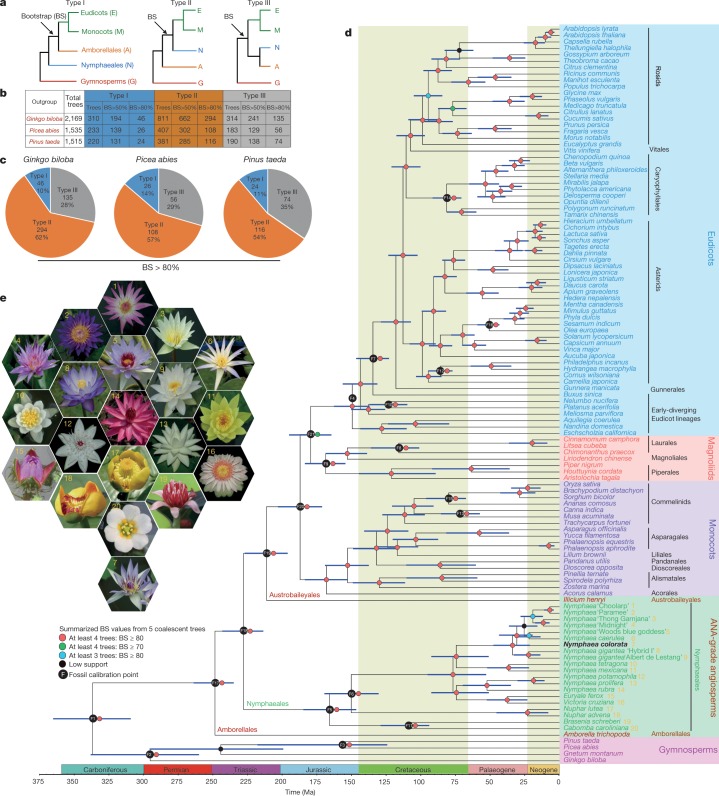
The N. colorata genome provides an opportunity to resolve the relationships between Amborellales, Nymphaeales and all other extant angiosperms (Fig. 1a). Using six eudicots, six monocots, N. colorata and Amborella5, and each of three gymnosperm species (Ginkgo biloba, Picea abies and Pinus taeda) as an outgroup in turn, we identified 2,169, 1,535 and 1,515 orthologous low-copy nuclear (LCN) genes, respectively (Fig. 1b). Among the LCN gene trees inferred from nucleotide sequences using G. biloba as an outgroup, 62% (294 out of 475 trees) place Amborella as the sister lineage to all other extant angiosperms with bootstrap support greater than 80% (type II, Fig. 1c). Using P. abies or P. taeda as the outgroup, Amborella is placed as the sister lineage to the remaining angiosperms in 57% and 54% of the LCN gene trees, respectively. LCN gene trees inferred using amino acid sequences show similar phylogenetic patterns (Supplementary Note 4.1).
Fig. 1. Phylogenomic relationships of angiosperms.
a, Three different evolutionary relationships among major clades of angiosperms. b, Number of LCN gene trees with different bootstrap support (BS) values based on nucleotide sequences from six eudicots, six monocots, N. colorata, Amborella and three different gymnosperms. c, Comparison of gene trees supporting the three evolutionary relationships using each gymnosperm in turn as the outgroup. The percentage was calculated by dividing the number of type I, II or III trees (BS > 80%) by the total number of trees. d, Summary phylogeny and timescale of 115 plant species. Blue bars at nodes represent 95% credibility intervals of the estimated dates. e, The flowers of the 20 sampled water lilies in Nymphaeales used in d.
To minimize the potential shortcomings of sparse taxon sampling6, we also inferred an angiosperm species tree using sequences from 44 genomes and 71 transcriptomes, including representatives of the ANA-grade, eudicots, magnoliids, monocots and a gymnosperm outgroup (Gnetum montanum, G. biloba, P. abies and P. taeda) (Methods). For further phylogenetic inference of these 115 species, we selected, based on various criteria, five different LCN gene sets including 1,167, 834, 683, 602 and 445 genes. Analyses of these five datasets all yielded similar tree topologies with Amborella and Nymphaeales as successive sister lineages to all other extant angiosperms (Fig. 1d, e, Supplementary Note 4.2).
Molecular dating of angiosperm lineages, using a stringent set of 101 LCN genes and with age calibrations based on 21 fossils7, inferred the crown age of angiosperms at 234–263 million years ago (Ma) (Fig. 1d). The split between monocots and eudicots was estimated at 171–203 Ma and that between Nymphaeaceae and Cabombaceae at 147–185 Ma.
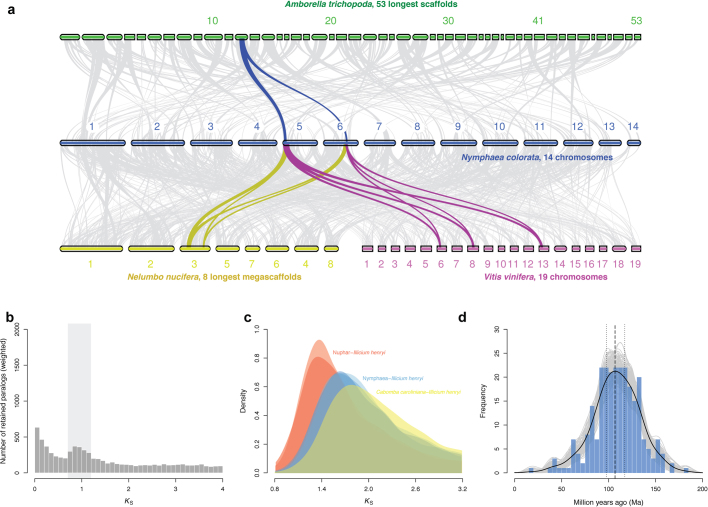
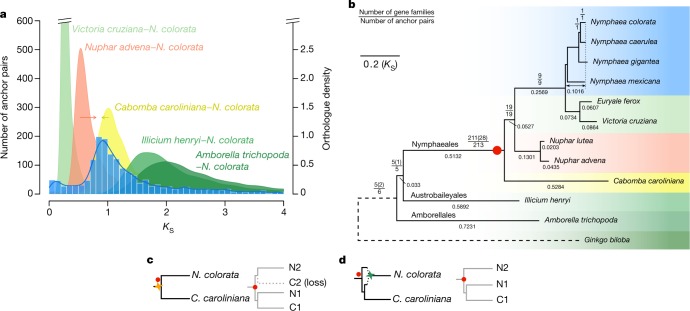
Genomic collinearity unveiled evidence of a whole-genome duplication (WGD) event in N. colorata (Extended Data Figs. 1f, 2a and Supplementary Note 5.1). The number of synonymous substitutions per synonymous site (KS) distributions for N. colorata paralogues further showed a signature peak at KS of approximately 0.9 (Fig. 2a) and peaks at similar KS values were identified in other Nymphaeaceae species (Supplementary Note 5.2), which suggests an ancient single WGD event that is probably shared among Nymphaeaceae members. Comparison of the N. colorata paralogue KS distribution with KS distributions of orthologues (representing speciation events) between N. colorata and other Nymphaeales lineages, Illicium henryi, and Amborella suggests that the WGD occurred just after the divergence between Nymphaeaceae and Cabombaceae (Fig. 2a). By contrast, phylogenomic analyses of gene families that contained at least one paralogue pair from collinear regions of N. colorata suggest that the WGD is shared between Nymphaeaceae and Cabombaceae (Fig. 2b, Supplementary Note 5.4). If true, Cabomba caroliniana seems to have retained few duplicates (Fig. 2b, c), which would explain the absence of a clear peak in the C. caroliniana paralogue KS distribution (Supplementary Note 5.2). Absolute dating of the paralogues of N. colorata does suggest that the WGD could have occurred before or close to the divergence between Nymphaeaceae and Cabombaceae (Extended Data Fig. 2d, Supplementary Note 5.3), considering the variable substitution rates among Nymphaealean lineages (Fig. 2a, b, Extended Data Fig. 2c). An alternative interpretation of the above results could be that the WGD signatures were from an allopolyploidy event that occurred between ancestral Nymphaeaceae and Cabombaceae lineages shortly after their divergence and that gave rise to the Nymphaeaceae (but not Cabombaceae) stem lineage (Fig. 2d, Supplementary Note 5.4).
Extended Data Fig. 2. WGD in Nymphaeales.
a, Intergenomic synteny between N. colorata (14 chromosomes), Amborella (53 longest scaffolds), and the eudicots N. nucifera (8 longest megascaffolds) and V. vinifera (19 chromosomes). Five adjacent anchor pairs were plotted as one syntenic line. Coloured lines represent one example of syntenic genes found in other species that correspond to one copy in Amborella, two in N. colorata, two in N. nucifera, and three in V. vinifera. b, KS distribution for the whole paranome of N. colorata. The light grey rectangle in the background indicates the KS boundaries used to extract duplicate pairs for absolute phylogenomic dating of the WGD event, and also highlights the range in which WGD peaks can be identified in other species of Nymphaeaceae (Supplementary Note 5.2). c, Kernel-density estimates of KS distributions for one-to-one orthologues between the outgroup species I. henryi and each of N. lutea and N. advena (red), N. colorata, N. mexicana and Nymphaea ‘Woods blue goddess’ (blue) and C. caroliniana (yellow). As each peak represents the same divergence event in the angiosperm phylogeny, the differences observed among the KS values of the peaks indicate substantial substitution rate variation among these Nymphaealean lineages (see also Fig. 2b). d, Absolute age distribution obtained from phylogenomic dating of N. colorata WGD paralogues based on orthogroups with orthologues from Amborella and G. biloba. The solid black line represents the kernel density estimate of paralogue date estimates, and the vertical dashed black line represents its peak at 107 Ma. The grey lines represent density estimates from 2,500 bootstrap replicates and the vertical black dotted lines represent the corresponding 90% confidence interval for the WGD age estimate, 117–98 Ma (see Methods). The blue histogram shows the raw distribution of divergence date estimates for paralogues.
Fig. 2. A Nymphaealean WGD shared by Nymphaeaceae and possibly Cabombaceae.
a, KS age distributions for paralogues found in collinear regions (anchor pairs) of N. colorata and for orthologues between N. colorata and selected Nymphaealean and angiosperm species. Red and yellow arrows indicate under- and overestimations of the N. colorata–Nuphar advena and N. colorata–C. caroliniana divergence, respectively. b, WGD phylogenomic analysis. Numbers in parentheses are the number of gene families with retained C. caroliniana duplicates supporting the duplication events. Numbers below branches show branch lengths in KS units. The double-arrowed line denotes total KS from the pointed node to N. colorata. We used G. biloba (dashed branch) as an outgroup. The red dot denotes the branch on which most of the anchor pairs in N. colorata coalesced. All mapped duplication events have BS ≥ 80% in the gene trees. c, Left, the scenario of a WGD (yellow four-pointed star) before the divergence between Nymphaeaceae and Cabombaceae. Right, a possible gene tree under this scenario, with loss of one duplicate in C. caroliniana. Two red dots show where the anchor pair of N. colorata would coalesce. d, Left, scenario of a WGD in the stem lineage of Nymphaeaceae involving an allotetraploid (green four-pointed star) that formed between two ancestral parents after the divergence of the lineages leading to N. colorata and C. caroliniana, with one of the parents being more closely related to C. caroliniana. Right, a gene tree under such a scenario. Red dots are as in c.
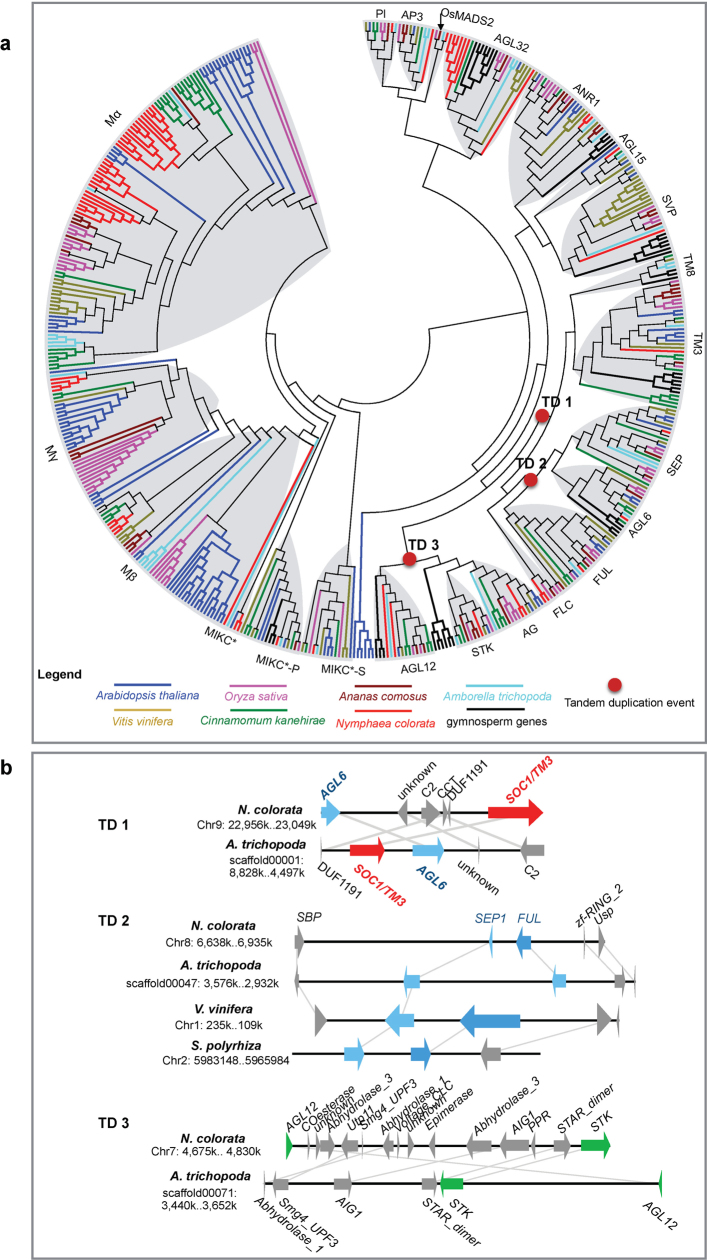
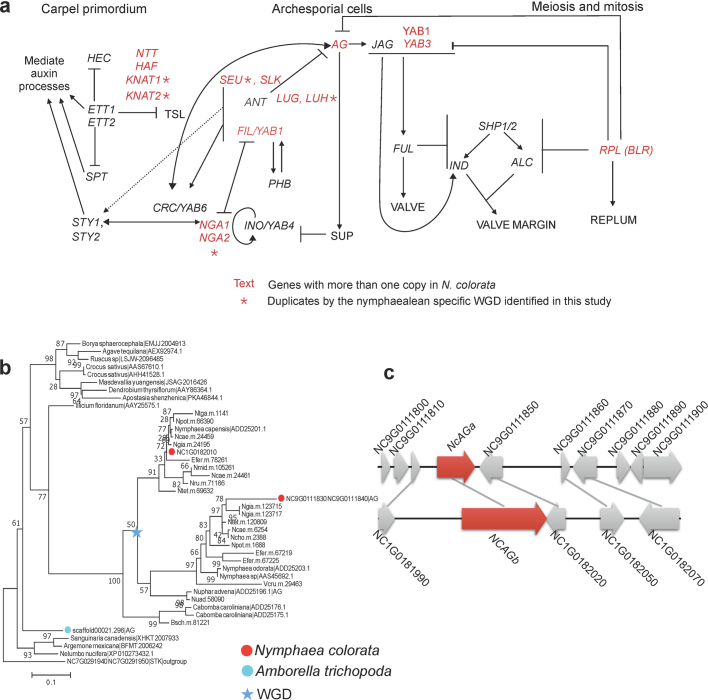
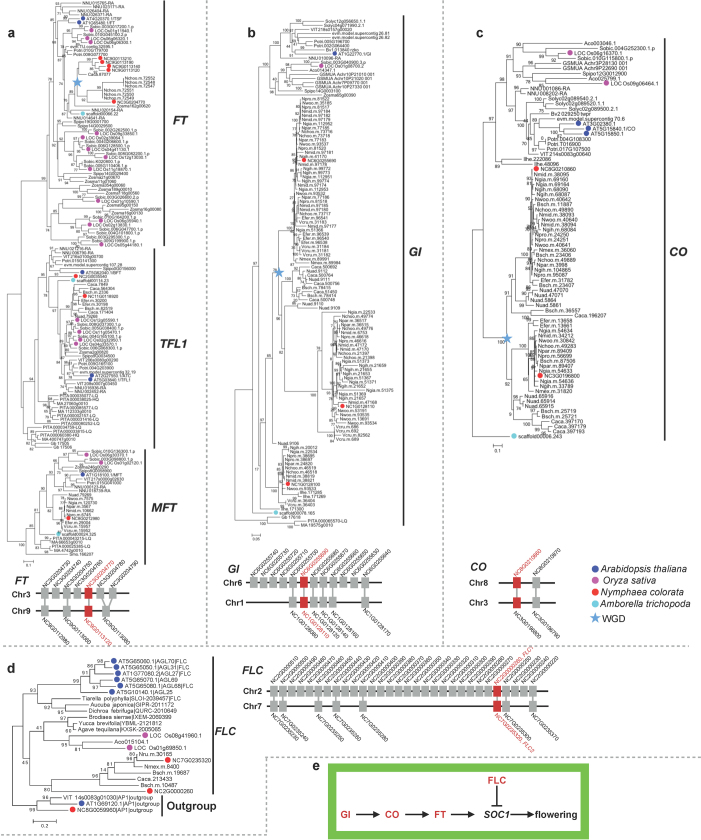
The water lily lineage descended from one of the early divergences among angiosperms, before the radiation of mesangiosperms. Thus, this group offers a unique window into the early evolution of angiosperms, particularly that of the flower. We identified 70 MADS-box genes, including homologues of the genes for the ABCE model of floral organ identities: AP1 (and also FUL) and AGL6 (A function for sepals and petals), AP3 and PI (B function for petals and stamen), AG (C function for stamen and carpel), and SEP1 (E function for interacting with ABC function proteins). Phylogenetic and collinearity analyses of the MADS-box genes and their genomic neighbourhood indicate that an ancient tandem duplication before the divergence of seed plants gave birth to the ancestors of A function (FUL) and E function genes (SEP) (Extended Data Fig. 3, Supplementary Note 6.1). Also, owing to the Nymphaealean WGD, N. colorata has two paralogues, AGa and AGb of the C-function gene AG (Extended Data Fig. 4). Similarly, the Nymphaealean WGD-derived duplicates are homologous to other genes associated with development of carpel and stamen8, and to genes that regulate flowering time9 and auxin-controlled circadian opening and closure of the flower10 (Extended Data Figs. 4–6, Supplementary Note 6.2–6.4).
Extended Data Fig. 3. The phylogenetic tree of MADS-box genes of N. colorata.
a, The MADS-box genes are divided into type I and type II, and the latter was subdivided into MIKCc and MIKC*. Branches of various species are shown in different colours, with the colour code below the tree. The nodes representing three tandem duplication events (TD1, TD2, and TD3 in b) are marked with red circles. b, Genomic regions with the duplicated genes derived from the three tandem duplication events (TD1, TD2 and TD3).
Extended Data Fig. 4. Expansion of key genes regulating the carpel development by the Nymphaealean WGD.
a, The reported pathway and genes that regulate carpel development. The red-labelled gene has two copies in N. colorata. The asterisk indicates that there is collinear support and is retained by the nymphaealean-specific WGD. b, Phylogenetic tree of AG genes, which specify floral meristem to determine the carpel and stamen identity. The star indicates the WGD specific to the water lily, as detected in this study. The duplicated AG genes in N. colorata are highlighted in red. c, NcAG gene duplicates, NcAGa and NcAGb, are the result of the nymphaealean-specific WGD.
Extended Data Fig. 6. Nymphaealean-specific duplication of the genes that control the initiation of flowering.
a, Phylogenetic tree of the PEBP-domain containing gene family, including FT, TFL1 and MFT subfamilies across various water lily species and other representative seed plants. b–d, Phylogenetic tree of the GI (b), CO (c) and FLC (d) gene family across various water lily species and other representative seed plants. e, The regulatory pathway for the flowering time control. The red-labelled gene has two copies in N. colorata and is retained by nymphaealean-specific WGD.
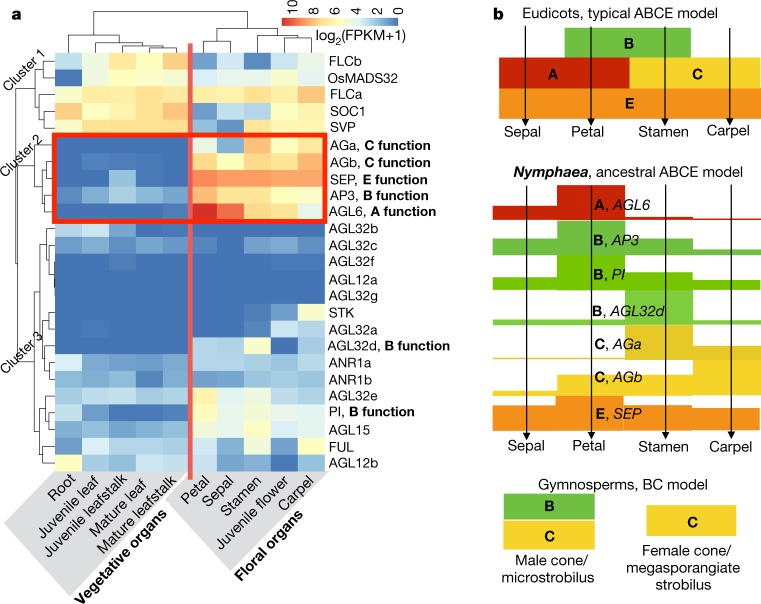
The expression profiles of N. colorata ABCE homologues largely agree with their putative ascribed roles in floral organ patterning (Fig. 3a). Notably, the N. colorata AGL6 homologue is mainly expressed in sepals and petals, whereas the FUL homologue is mainly expressed in carpels, suggesting that AGL6 acts as an A-function gene in N. colorata. The two C-function homologues AGa and AGb are highly expressed in stamens and carpels, respectively, whereas AGb is also expressed in sepals and petals, suggesting that they might have undergone subfunctionalization and possibly neofunctionalization for flower development after the Nymphaealean WGD. Furthermore, the ABCE homologues in N. colorata generally exhibit wider ranges of expression in floral organs than their counterparts in eudicot model systems (Fig. 3b). This wider expression pattern, in combination with broader expression of at least some ABCE genes in some eudicots representing an early-diverging lineage11, some monocots12 and magnoliids13, suggest an ancient ABCE model for flower development, with subsequent canalization of gene expression and function regulated by the more specialized ABCE genes during the evolution of mesangiosperms, especially core eudicots8. This could also account for the limited differentiation between sepals and petals in Nymphaeales species, and is consistent with a single type of perianth organ proposed in an ancestral angiosperm flower14.
Fig. 3. MADS-box genes in N. colorata and proposed floral ABCE model in early angiosperms.
a, Gene expression patterns of MIKCc from various organs of N. colorata. Three clusters of genes were classified according to the expression of type II MADS-box genes. The organ types (vegetative organs and floral organs) were matched to the expression patterns of type II MADS-box genes. Expression values were scaled by log2(FPKM + 1), in which FPKM is fragments per kilobase of exon per million mapped reads. b, The flowering ABCE model in N. colorata that specifies floral organs is proposed based on the gene expression values (bar heights) from a.
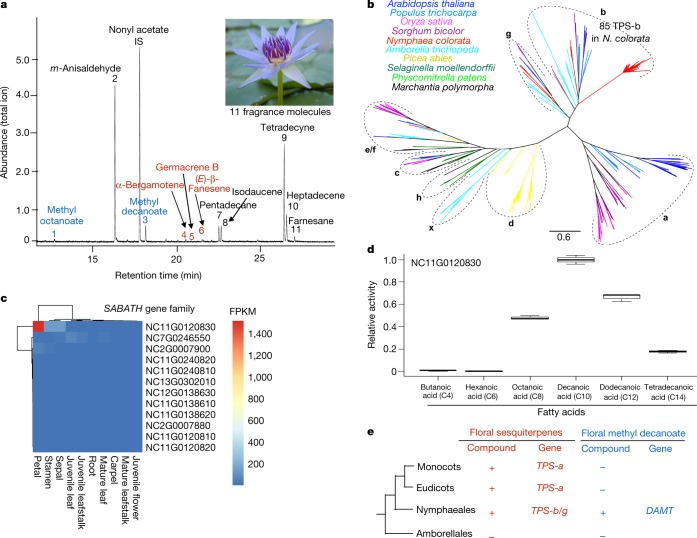
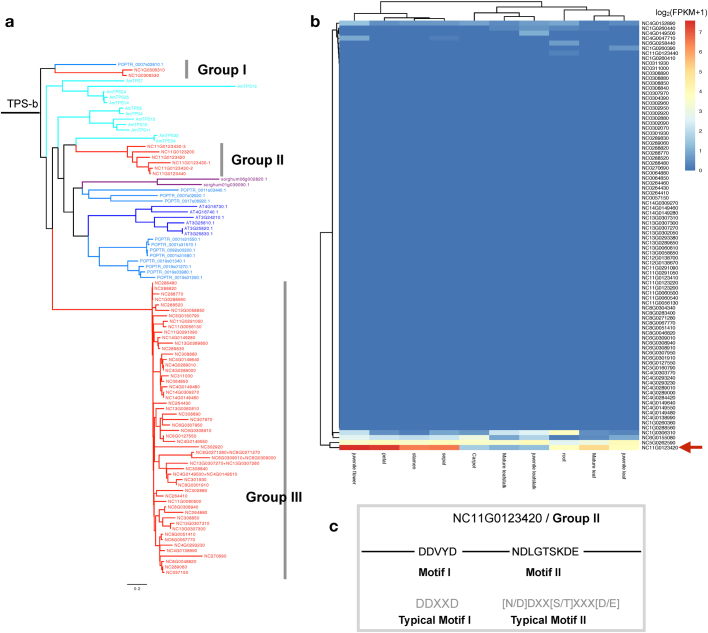
Floral scent serves as olfactory cues for insect pollinators15. Whereas Amborella flowers are scentless16, N. colorata flowers release 11 different volatile compounds, including terpenoids (sesquiterpenes), fatty-acid derivatives (methyl decanoate) and benzenoids (Fig. 4a). The N. colorata genome contains 92 putative terpene synthase (TPS) genes, which are ascribed to four previously recognized TPS subfamilies in angiosperms: TPS-b, TPS-c, TPS-e/f and TPS-g (Fig. 4b), but none was found for TPS-a, which is responsible for sesquiterpene biosynthesis in mesangiosperms17. Notably, TPS-b contains more than 80 genes in N. colorata; NC11G0123420 is highly expressed in flowers (Extended Data Fig. 7); this result suggests that it may be a candidate gene for sesquiterpene biosynthase in N. colorata. Also, methyl decanoate has not been detected as a volatile compound in monocots and eudicots18 and is thought to be synthesized in N. colorata by the SABATH family of methyltransferases19. The N. colorata genome contains 13 SABATH homologues and 12 of them form a Nymphaeales-specific group (Supplementary Fig. 41). Among these 12 members, NC11G0120830 showed the highest expression in petals (Fig. 4c) and its corresponding recombinant protein was demonstrated to be a fatty acid methyltransferase that had the highest activity with decanoic acid as the substrate (Fig. 4d, Supplementary Note 7.1). These results suggest that the floral scent biosynthesis in N. colorata has been accomplished through enzymatic functions that have evolved independently from those in mesangiosperms (Fig. 4e).
Fig. 4. Floral scent and biosynthesis in N. colorata.
a, Gas chromatogram of floral volatiles from the flower of N. colorata. The internal standard (IS) is nonyl acetate. Methyl esters are in blue; terpenes are in red. Floral scent was measured three times independently with similar results. b, Phylogenetic tree of terpene synthases from N. colorata and representative plants showing the subfamilies from a–h and x. c, Expression analysis of SABATH genes of N. colorata showed that NC11G0120830 had the highest expression level in petal.d, Relative activity of Escherichia coli-expressed NC11G0120830 with six fatty acids as substrates, with the activity on decanoic acid set at 1.0. Data are mean ± s.d. of three independent measurements. e, The presence (+) and absence (−) of sesquiterpenes and methyl decanoate as floral scent compounds and their respective biosynthetic genes in four major lineages of angiosperms when known. DAMT, decanoic acid methyltranferase.
Extended Data Fig. 7. Explosive expansion of the TPS-b subfamily and its implications.
a, The phylogenetic classification of TPS-b subfamily into three groups. b, The group II member NC11G0123420 is the sole gene with high expression in the petal. c, Whereas most TPS-b members lack the two typical catalytic motifs, the NC11G0123420 retained both motifs, suggesting its potential role in producing sesquiterpene in N. colorata.
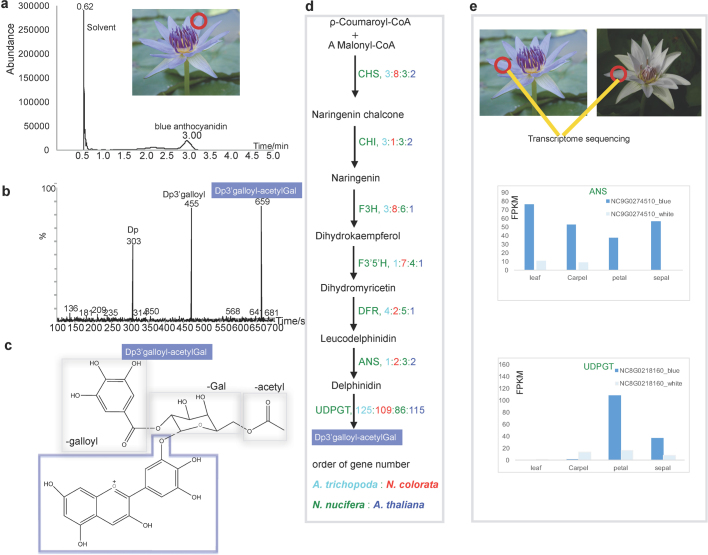
Nymphaea colorata is valued for the aesthetically attractive blue colour of petals, which is a rare trait in ornamentals. To understand the molecular basis of the blue colour, we identified delphinidin 3′-O-(2″-O-galloyl-6″-O-acetyl-β-galactopyranoside) as the main blue anthocyanidin pigment (Extended Data Fig. 8a–c). By comparing the expression profiles between two N. colorata cultivars with white and blue petals for genes in a reconstructed anthocyanidin biosynthesis pathway, we found genes for an anthocyanidin synthase and a delphinidin-modification enzyme, the expression of which was significantly higher in blue petals than in white petals (Extended Data Fig. 8d, e). These two enzymes catalyse the last two steps of anthocyanidin biosynthesis and are therefore key enzymes specialized in blue pigment biosynthesis20,21 (Supplementary Note 7.2).
Extended Data Fig. 8. The blue anthocyanidin and its potential biosynthesis pathway in N. colorata.
a, The peak of the blue anthocyanidin appears at 3 min of the high-performance liquid chromatography (HPLC) detection. b, The three fragments of the blue anthocyanidin and their molecule mass. c, The molecule of the anthocyanidin was identified as delphinidin 3′-O-(2″-O-galloyl-6″-O-acetyl-β-galactopyranoside), abbreviated as Dp3′galloyl-acetylGal. d, The postulated pathway for the biosynthesis of Dp3′galloyl-acetylGal. Gene copy numbers are listed next to the enzymes. 3GGT, anthocyanidin 3-O-glucoside-2″-O-glucosyltransferase; 3′GT, 3′-O-beta-glucosyltranferase; 5AT, anthocyanin-5-aromatic acyltransferase; ANS, anthocyanidin synthase; CHI, chalcone isomerase; CHS, chalcone synthase; DFR, dihydroflavonol-4-reductase; F3H, flavanone-3-hydroxylase; F3′5′H, flavonoid-3′,5′-hydroxylase. e, Comparative transcriptomic analyses between the blue- and white-petal cultivars of N. colorata identified two genes, ANS and UDPGT, that are highly differentially expressed and might be potential regulators for blue coloration of the petals.
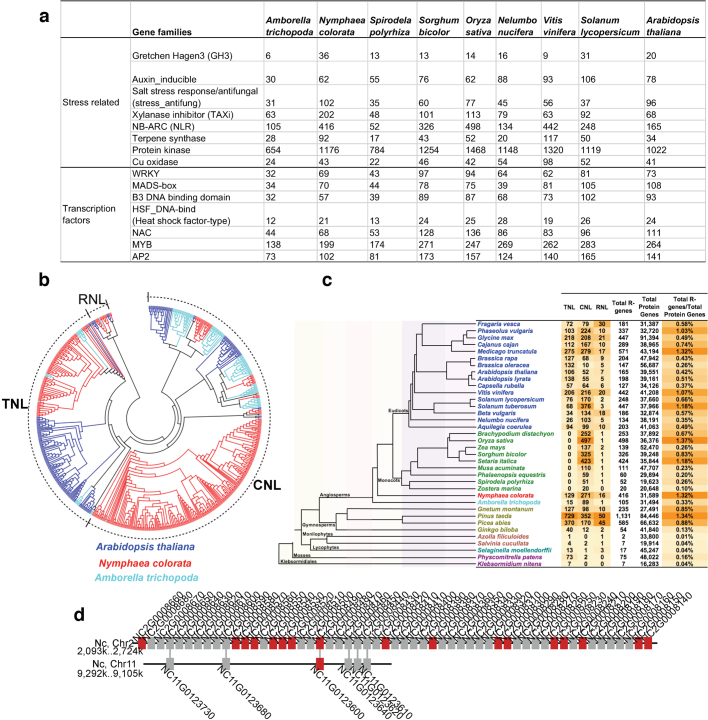
Water lilies have a global distribution that includes cold regions (northern China and northern Canada), unlike the other ANA-grade angiosperms Amborella (Pacific Islands) and Austrobaileyales (temperate and tropical regions). We detected marked expansions of genes related to immunity and stress responses in N. colorata, including genes encoding nucleotide-binding leucine-rich repeat (NLR) proteins, protein kinases and WRKY transcription factors, compared with those in Amborella and some mesangiosperms (Extended Data Fig. 9, Supplementary Note 8). It is possible that increased numbers of these genes enabled water lilies to adapt to various ecological habitats globally.
Extended Data Fig. 9. Expanded stress-related and transcription factor gene families in the genome of N. colorata.
a, Markedly expanded gene families for stress response and transcriptional regulation. NLR genes contain NB-ARC domains. Notably, N. colorata encodes the highest proportion of kinase genes compared with gymnosperms or other land plants. b, NLR genes expanded in all of its three subfamilies (RNL, TNL and CNL). c, Distribution of NLR genes across the representative algae and land plants. The background colours indicate the number variation in each species. d, An example showing how tandem duplication and WGD contributed to the expansion of R genes in N. colorata.
In conclusion, the N. colorata genome offers a reference for comparative genomics and for resolving the deep phylogenetic relationships among the ANA-grade and mesangiosperms. It has also revealed a WGD specific to Nymphaeales, and provides insights into the early evolution of angiosperms on key innovations such as flower development and floral scent and colour.
Methods
Genome and transcriptome sequencing
Total DNA for genome sequencing was extracted from young leaves. Leaf RNA was extracted from 18 water lily species: N. colorata, Euryale ferox, Brasenia schreberi, Victoria cruziana, Nymphaea mexicana, Nymphaea prolifera, Nymphaea tetragona, Nymphaea potamophila, Nymphaea caerulea, Nymphaea rubra, Nymphaea ‘midnight’, Nymphaea ‘Choolarp’, Nymphaea ‘Paramee’, Nymphaea ‘Woods blue goddess’, Nymphaea gigantea ‘Albert de Lestang’, N. gigantea ‘Hybrid I’, Nymphaea ‘Thong Garnjana’ and Nuphar lutea. In addition, for transcriptome sequencing we sampled several organs and tissues from N. colorata including mature leaf, mature leafstalk, juvenile flower, juvenile leaf, juvenile leafstalk, carpel, stamen, sepal, petal and root.
For PacBio sequencing, we prepared approximately 20-kb SMRTbell libraries. A total of 34 SMRT cells and 49.8 Gb data composed of 5.5 million reads were sequenced on PacBio RSII system with P6-C4 chemistry. All transcriptome libraries were sequenced using the Illumina platform, generating paired-end reads. For the Hi-C sequencing and scaffolding, a Hi-C library was created from tender leaves of N. colorata. In brief, the leaves were fixed with formaldehyde and lysed, and the cross-linked DNA was then digested with MboI overnight. Sticky ends were biotinylated and proximity-ligated to form chimeric junctions, which were physically sheared to and enriched for sizes of 500–700 bp. Chimeric fragments representing the original cross-linked long-distance physical interactions were then processed into paired-end sequencing libraries and 346 million 150-bp paired-end reads, which were sequenced on the Illumina platform.
Sequence assembly and gene annotation
To assemble the 49.8 Gb data composed of 5.5 million reads, we filtered the reads to remove organellar DNA, reads of poor quality or short length, and chimaeras. The contig-level assembly was performed on full PacBio long reads using the Canu package22. Canu v.1.3 was used for self-correction and assembly. We then polished the draft assembly using Arrow (https://github.com/PacificBiosciences/GenomicConsensus). To increase the accuracy of the assembly, Illumina short reads were recruited for further polishing with the Pilon program (https://github.com/broadinstitute/pilon). The genome assembly quality was measured using BUSCO (Benchmarking Universal Single-Copy Orthologues)23 v.3.0. The paired-end reads from Hi-C were uniquely mapped onto the draft assembly contigs, which were grouped into chromosomes and scaffolded using the software Lachesis (https://github.com/shendurelab/LACHESIS).
Genscan (http://genes.mit.edu/GENSCAN.html) and Augustus24 were used to carry out de novo predictions with gene model parameters trained from Arabidopsis thaliana. Furthermore, gene models were de novo predicted using MAKER25. We then evaluated the genes by comparing MAKER results with the corresponding transcript evidence to select gene models that were the most consistent on the basis of an AED metric.
The evolutionary position of water lily and divergence-time estimation
LCN genes were identified based on OrthoFinder26 results. The orthologues were obtained from six monocots (Spirodela polyrhiza, Zostera marina, Musa acuminata, Ananas comosus, Sorghum bicolor and Oryza sativa) and six eudicots (Nelumbo nucifera, Vitis vinifera, Populus trichocarpa, A. thaliana, Solanum lycopersicum and Beta vulgaris), N. colorata, Amborella, and the gymnosperms G. biloba, P. abies and P. taeda. LCN genes needed to meet the following requirements: strictly single-copy in N. colorata, Amborella, G. biloba, P. abies or P. taeda, and single-copy in at least five of the 12 eudicots or monocots. With G. biloba, P. abies or P. taeda as the outgroup, we identified 2,169, 1,535 and 1,515 orthologous LCN genes, respectively. Furthermore, we trimmed the sites with less than 90% coverage. LCN gene trees were estimated from the remaining sites using RAxML v.7.7.8 using the GTR+G+I model for nucleotide sequences (Fig. 1c) and the JTT+G+I model for amino acid sequences (Supplementary Note 4.1). To account for incomplete lineage sorting and different substitution rates, we applied the multispecies coalescent model and a supermatrix method, respectively, to the LCN genes and found further support for the sister relationship between Amborella and all other extant flowering plants (Supplementary Note 4.2).
We further carefully selected five LCN gene sets (1,167, 834, 683, 602 and 445) from 115 species and applied both a supermatrix method27–29 and the multi-species coalescent model to infer the phylogeny of angiosperms (Supplementary Note 4.2). The phylogeny inferred from 1,167 LCN genes is shown in Fig. 1d, with different support values from the multi-species coalescent analyses of the other four LCN gene sets.
To estimate the evolutionary timescale of angiosperms, we calibrated a relaxed molecular clock using 21 fossil-based age constraints7 throughout the tree, including the earliest fossil tricoplate pollen (approximately 125 Ma) associated with eudicots30. We concatenated 101 selected genes (205,185 sites) and fixed the tree topology to that inferred from our coalescent-based analysis of 1,167 genes from 115 taxa. We performed a Bayesian phylogenomic dating analysis of the 101 selected genes in MCMCtree, part of the PAML package31,32, and used approximate likelihood calculation for the branch lengths33. Molecular dating was performed using an auto-correlated model of among-lineage rate variation, the GTR substitution model, and a uniform prior on the relative node times. Posterior distributions of node ages were estimated using Markov chain Monte Carlo sampling, with samples drawn every 250 steps over 10 million steps following a burn-in of 500,000 steps. We checked for convergence by running the analysis in duplicate and checked for sufficient sampling.
We also implemented the penalized likelihood method under a variable substitution rate using TreePL34 and r8s35, as a constant substitution rate across the phylogenetic tree was rejected (P < 0.01) for all cases by likelihood-ratio tests in PAUP36. Three fossil calibrations, corresponding to the crown groups of Lamiales, Cornales and Laurales, were implemented as minimum age constraints in our penalized likelihood dating analysis, except that the earliest appearance of tricolpate pollen grains (about 125 Ma)30 was used to fix the age of crown eudicots. We determined the best smoothing parameter value of the concatenated 101 LCN genes as 0.32 by performing cross-validations of a range of smooth parameters from 0.01 to 10,000 (algorithm = TN; crossv = yes; cvstart = −2; cvinc = 0.5; cvnum = 15). We used 100 bootstrap trees with branch lengths generated by RAxML37 to infer the 95% confidence intervals of age estimates (Supplementary Note 4.2).
Identification of WGD
The N. colorata genome was compared with each of the other genomes by pairwise alignment using Large-Scale Genome Alignment Tool (LAST; http://last.cbrc.jp/). We defined syntenic blocks using LAST hits with a distance cut-off of 20 genes apart from the two retained homologous pairs, in which at least four consecutive retained homologous pairs were required. We then obtained the one-to-one blocks to exclude ancient duplication blocks with QUOTA-ALIGN38.
KS-based paralogue age distributions were constructed as previously described39. In brief, the paranome was constructed by performing an all-against-all protein sequence similarity search using BLASTP with an E-value cut-off of 10−10, after which gene families were built with the mclblastline pipeline (v.10-201) (micans.org/mcl). Each gene family was aligned using MUSCLE (v.3.8.31)40, and KS estimates for all pairwise comparisons within a gene family were obtained using maximum likelihood in the CODEML program41 of the PAML package (v.4.4c)31. We then subdivided gene families into subfamilies for which KS estimates between members did not exceed a value of 5.
To correct for the redundancy of KS values (a gene family of n members produces n(n − 1)/2 pairwise KS estimates for n − 1 retained duplication events), we inferred a phylogenetic tree for each subfamily using PhyML42 with the default settings. For each duplication node in the resulting phylogenetic tree, all m KS estimates between the two child clades were added to the KS distribution with a weight of 1/m (in which m is the number of KS estimates for a duplication event), so that the weights of all KS estimates for a single duplication event summed to one. Paralogous gene pairs found in duplicated collinear segments (anchor pairs) from N. colorata were detected using i-ADHoRe (v.3.0) with ‘level_2_only = TRUE’43,44. The identified anchor pairs are assumed to correspond to the most recent WGD event.
The KS-based orthologue age distributions were constructed by identifying one-to-one orthologues between species using InParanoid45 with default settings, followed by KS estimation using the CODEML program as above. KS distributions for one-to-one orthologues between N. colorata and each of V. cruziana, N. advena, C. caroliniana, I. henryi and Amborella were used to compare the relative timing of the WGD in N. colorata with speciation events within Nymphaeales. KS distributions for one-to-one orthologues between the outgroup species I. henryi and each of N. lutea, N. advena, N. mexicana, Nymphaea ‘Woods blue goddess’, N. colorata, and C. caroliniana were used to estimate and compare relative substitution rates among these Nymphaealean species. Additional comparisons using V. vinifera and Amborella as outgroup species instead of I. henryi gave similar results (data not shown).
Absolute dating of the identified WGD event in N. colorata was performed as previously described46. Briefly, paralogous gene pairs located in duplicated segments (anchor pairs) and duplicated pairs lying under the WGD peak (peak-based duplicates) were collected for phylogenetic dating. We selected anchor pairs and peak-based duplicates present under the N. colorata WGD peak and with KS values between 0.7 and 1.2 (grey-shaded area in Extended Data Fig. 2b) for absolute dating. For each WGD paralogous pair, an orthogroup was created that included the two paralogues plus several orthologues from other plant species as identified by InParanoid45 using a broad taxonomic sampling: one representative orthologue from the order Cucurbitales, two from Rosales, two from Fabales, two from Malpighiales, two from Brassicales, one from Malvales, one from Solanales, two from Poaceae (Poales), one from A. comosus47 (Bromeliaceae, Poales), one from either M. acuminata48 (Zingiberales) or Phoenix dactylifera49 (Arecales), one from the Asparagales (from Asparagus officinalis50, Apostasia shenzhenica46, or Phalaenopsis equestris51), one from the Alismatales (either from S. polyrhiza52 or Z. marina53), one from Amborella, and one from G. biloba54. In total, 217 orthogroups based on anchor pairs and 142 orthogroups based on peak-based duplicates were collected.
The node joining the two WGD paralogues of N. colorata was then dated using the BEAST v1.7 package55 under an uncorrelated relaxed-clock model and an LG+G model with four site-rate categories. A starting tree with branch lengths satisfying all fossil prior constraints was created according to the consensus APG IV phylogeny1. Fossil calibrations were implemented using log-normal calibration priors on the following nodes: the node uniting the Malvidae based on the fossil Dressiantha bicarpellata56 with prior offset = 82.8, mean = 3.8528, and s.d. = 0.557; the node uniting the Fabidae based on the fossil Paleoclusia chevalieri58 with prior offset = 82.8, mean = 3.9314, and s.d. = 0.559; the node uniting the non-Alismatalean monocots based on fossil Liliacidites60 with prior offset = 93.0, mean = 3.5458, and s.d. = 0.561; the node uniting the N. colorata WGD paralogues with the eudicots and monocots based on the sudden abundant appearance of eudicot tricolpate pollen in the fossil record with prior offset = 124, mean = 4.8143 and s.d. = 0.562; and the root uniting the above clades with Amborella and then G. biloba with prior offset = 307, mean = 3.8876, and s.d. = 0.563. The offsets of these calibrations represent hard minimum boundaries, and their means represent locations for their respective peak mass probabilities in accordance with previous dating studies of these specific clades63 (see Supplementary Note 5.3 for an alternative setting of orthogroups).
A run without data was performed to ensure proper placements of the marginal calibration priors, which do not necessarily correspond to the calibration priors specified above, because they interact with each other and the tree prior64. Indeed, a run without data indicated that the distribution of the marginal calibration prior for the root did not correspond to the specified calibration density, so we reduced the mean in the calibration prior of the node combining the N. colorata WGD paralogues with the eudicots and monocots with offset = 124, mean = 4.4397, s.d. = 0.5 to locate the marginal calibration prior at 220 Ma62.
Markov chain Monte Carlo sampling for each orthogroup was run for 10 million steps, with sampling every 1,000 steps to produce a sample size of 10,000. The resulting trace files were inspected using Tracer v.1.555, with a burn-in of 1,000 samples, to check for convergence and sufficient sampling (minimum effective sample size of 200 for all parameters). In total, 263 orthogroups were accepted, and absolute age estimates of the node uniting the WGD paralogous pairs based on both anchor pairs and peak-based duplicates were grouped into one absolute age distribution, for which kernel density estimation and a bootstrapping procedure were used to find the peak consensus WGD age estimate and its 90% confidence interval boundaries, respectively. More detailed methods have been previously described39.
To identify the duplication events that resulted in the 2,648 anchor pairs detected in the genome of N. colorata, we performed phylogenomic analyses to determine the timing of the duplication events relative to the lineage divergences in Nymphaeales as described previously46. Protein-coding genes from 12 species were used, including eight species from Nymphaeaceae and one species from Cabombaceae in Nymphaeales, one species (I. henryi) from Austrobaileyales, plus Amborella and G. biloba. The phylogeny of the 12 species was obtained from Fig. 1d, and the branch lengths in KS units were estimated from 23 LCN genes (selected from the 101 LCN genes used in Fig. 1d, because only 23 are shared across all of the species studied) using PAML31 under the free-ratio model. OrthoMCL (v.2.0.9)65 was used with default parameters to identify gene families. Then, we removed 907 of the 2,648 anchor pairs with KS values greater than five. If the remaining anchor pairs fell into different gene families, thus indicating incorrect assignment of gene families by OrthoMCL, we merged the corresponding gene families and finally obtained 53,243 multi-gene gene families. Next, phylogenetic trees were constructed for a subset of 881 gene families with no more than 200 genes that had at least one pair of anchors and one gene from G. biloba. Multiple sequence alignments were produced by MUSCLE (v3.8.31)40 and were trimmed by trimAl (v.1.4)66 to remove low-quality regions based on a heuristic approach (-automated1).
We then used RAxML (v.8.2.0)67 with the GTR+G model to estimate a maximum-likelihood tree, starting with 200 rapid bootstraps followed by maximum-likelihood optimizations on every fifth bootstrap tree. Gene trees were rooted based on genes from G. biloba if these formed a monophyletic group in the tree; otherwise, mid-point rooting was applied. The timing of the duplication event for each anchor pair relative to the lineage divergence events was then inferred. In brief, internodes from a gene tree were first mapped to the species phylogeny according to the common ancestor of the genes in the gene tree. Each internode was then classified as a duplication node, a speciation node, or a node that has no paralogues and is inconsistent with divergence in the species phylogeny. The parental node(s) of a duplication node supported by an anchor pair were traced towards the root until reaching a speciation node in the gene tree. The duplication event that resulted in the anchor pair was hence circumscribed between the duplication node as the lower bound and the speciation node as the upper bound on the species tree. If the two nodes were directly connected by a single branch on the species tree, the duplication was thus considered to have occurred on the branch. To reduce biased estimations, we used the bootstrap value on the branch leading to a duplication node as support for a duplication event. In total, 497 anchor pairs in 473 gene families coalesced as duplication events on the species phylogeny, and duplication events from 254 anchor pairs in 246 gene families (or from 380 anchor pairs in 364 gene families) had bootstrap values greater than or equal to 80% (or 50%).
Floral scent measurement, gene identification, and functional characterization
We collected floral volatiles of N. colorata using a dynamic headspace sampling system and analysed them using gas chromatography–mass spectrometry (GC–MS) as previously described68. After 2 h of collection from the headspace of detached open flowers of N. colorata in a glass chamber (10 cm diameter, 30 cm height), volatiles were eluted from the SuperQ volatile collection trap using 100 µl of methylene chloride containing nonyl acetate as an internal standard. We then analysed samples using an Agilent Intuvo 9000 GC system coupled with an Agilent 7000D Triple Quadrupole mass detector. Separation was performed on an Agilent HP 5 MS capillary column (30 m × 0.25 mm) with helium as carrier gas (flow rate of 1 ml min−1). We applied splitless injections of 1 µl samples, injection temperature of 250 °C, an initial oven temperature of 40 °C (3-min hold) and a temperature gradient of 5 °C per min increase from 40 °C to 250 °C. Products were identified using the National Institute of Standards and Technology mass spectral database (https://chemdata.nist.gov).
A full-length cDNA of NC11G0120830 was amplified from the open flowers of N. colorata using reverse transcription PCR (RT–PCR), and cloned into pET-32a (MilliporeSigma). After confirmation by sequencing, NC11G0120830 was expressed in E. coli strain BL21 (DE3) (Stratagene) and the recombinant protein produced was purified using a modified nickel-nitrilotriacetic acid agarose (Invitrogen) protocol as previously reported69. For methyltransferase enzyme assays, we used both radiochemical and non-radiochemical reaction systems. The radiochemical reaction system (50 µl) was composed of 50 mM Tris-HCl, pH 7.8, 1 mM substrate, 1 µl 14C-S-adenosyl-l-methionine, and 1 µl of purified NC11G0120830. After 30 min of incubation at room temperature, 150 µl of ethyl acetate was added to extract the 14C-labelled reaction products. The extracts were counted using a scintillation counter (Beckman Coulter) to measure the activity of NC11G0120830. To determine the chemical identity of the reaction product, we performed non-radiochemical assays in which nonradioactive S-adenosyl-l-methionine was used as the methyl donor. The reaction product was collected by headspace solid-phase microextraction and analysed by GC–MS as previously described70.
Reporting summary
Further information on research design is available in the Nature Research Reporting Summary linked to this paper.
Online content
Any methods, additional references, Nature Research reporting summaries, source data, extended data, supplementary information, acknowledgements, peer review information; details of author contributions and competing interests; and statements of data and code availability are available at 10.1038/s41586-019-1852-5.
Supplementary information
Supplementary Notes including Supplementary Materials, Methods and Supplementary Figures 1-48, as well as a series of findings in addition to those shown in the main manuscript.
This file contains Supplementary Tables 1-21.
Acknowledgements
Fei Chen acknowledges funding from National Natural Science Foundation of China (31801898). L.Z. is partly supported by the open funds of the State Key Laboratory of Crop Genetics and Germplasm Enhancement (ZW201909) and State Key Laboratory of Tree Genetics and Breeding (TGB2018004). H.T. thanks the Fujian provincial government in China for a Fujian “100 Talent Plan”. Y.V.d.P. acknowledges funding from the European Union Seventh Framework Programme (FP7/2007-2013) under European Research Council Advanced Grant Agreement 322739 – DOUBLEUP. Z.L. is funded by a postdoctoral fellowship from the Special Research Fund of Ghent University (BOFPDO2018001701).
Extended data figures and tables
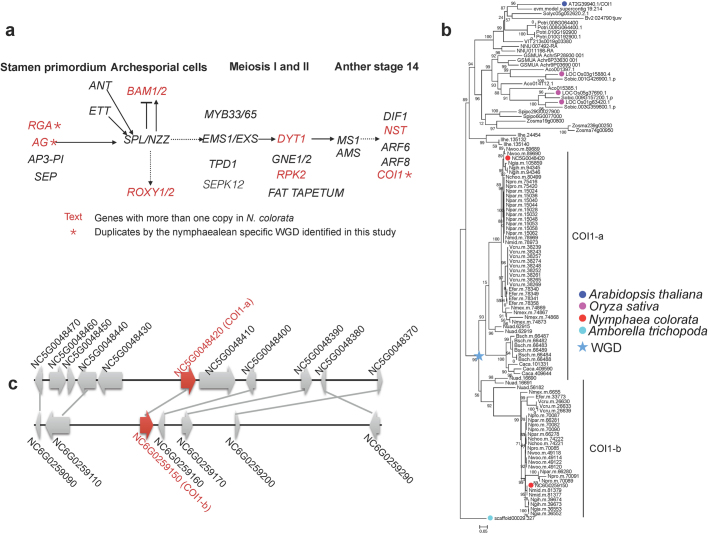
Extended Data Fig. 5. Expansion of key genes regulating the development of the stamen by Nymphaealean WGD.
a, The reported pathway and genes that regulate the stamen development. The red-labelled gene has two copies in N. colorata. The asterisk indicates that there is collinear support and is retained by the nymphaealean-specific WGD. b, Phylogenetic tree of CORONATINE INSENSITIVE 1 (COI1), which recruits regulators of pollen development for modification by ubiquitination, needed in the JA response and regulating pollen fertility. c, NcCOI1 gene duplicates have evolved through the WGD in Nymphaeales. The star indicates the nymphaealean-specific WGD.
Author contributions
L.Z. led and managed the project. L.Z., Fei Chen and H.M. conceived the study. Fei Chen, L.Z., H.M., Feng Chen, Z.L., R.L. and Y.V.d.P. wrote the manuscript; L.Z., Fei Chen, X. Yu, X. Chang, C.Y., Y.C., Q.W., L.W. and H.K. collected and sequenced the plant material; L.Z., Y. Zhao, Fei Chen, S.Y.W.H., J.C., H.W., Xuequn Chen, J.H., A.S., X. Chang, W.D., X.L., Y. Zhuang, Y. Jiao, W.C., X. Yan, Y.Q., K.W. and H.M. performed gene family clustering and comparative phylogenomics. X. Zhang, L.Z., X. Zhou and Fei Chen assembled and annotated the genome. S.D., S.Z. and Yang Liu annotated the mitochondrial and chloroplast genomes. Yanhui Liu, L.Z. and Fei Chen conducted transcriptome sequencing and analysis. Z.L., R.L., Y.V.d.P., W.G., Fei Chen, H.T. and L.Z. conducted WGD analysis. Feng Chen, Q.J., Xinlu Chen, C.Z., Y. Jiang, W.Z., G.L., J.F. and Fei Chen conducted floral scent analysis. L.Z., Fei Chen, Q.W., L.W., Z.W., F.L. and J.W. conducted floral colour analysis. All authors read and approved the manuscript.
Data availability
PacBio whole-genome sequencing data, Illumina data and genome assembly sequences have been deposited to the NCBI Sequence Read Archive (SRA) as Bioproject PRJNA565347, and were also deposited in the BIG Data Center (http://bigd.big.ac.cn) under project number PRJCA001283. The genome assembly sequences and gene annotations have been deposited in the Genome Warehouse in BIG Data Center under accession number GWHAAYW00000000. The genome assembly sequences, gene annotations, and the LCN genes used in this study, have been also deposited in the Waterlily Pond (http://waterlily.eplant.org). All other data are available from the corresponding author upon reasonable request.
Competing interests
The authors declare no competing interests.
Footnotes
Peer review information Nature thanks Patrick Wincker and the other, anonymous, reviewer(s) for their contribution to the peer review of this work.
Publisher’s note Springer Nature remains neutral with regard to jurisdictional claims in published maps and institutional affiliations.
These authors contributed equally: Liangsheng Zhang, Fei Chen, Xingtan Zhang, Zhen Li, Yiyong Zhao, Rolf Lohaus, Xiaojun Chang
These authors jointly supervised this work: Liangsheng Zhang, Fei Chen, Feng Chen, Hong Ma, Yves Van de Peer, Haibao Tang
Extended data
is available for this paper at 10.1038/s41586-019-1852-5.
Supplementary information
is available for this paper at 10.1038/s41586-019-1852-5.
References
- 1.Byng JW, et al. An update of the Angiosperm Phylogeny Group classification for the orders and families of flowering plants: APG IV. Bot. J. Linn. Soc. 2016;181:1–20. [Google Scholar]
- 2.Zeng L, et al. Resolution of deep angiosperm phylogeny using conserved nuclear genes and estimates of early divergence times. Nat. Commun. 2014;5:4956. doi: 10.1038/ncomms5956. [DOI] [PMC free article] [PubMed] [Google Scholar]
- 3.Qiu YL, et al. The earliest angiosperms: evidence from mitochondrial, plastid and nuclear genomes. Nature. 1999;402:404–407. doi: 10.1038/46536. [DOI] [PubMed] [Google Scholar]
- 4.Chen F, et al. Water lilies as emerging models for Darwin’s abominable mystery. Hortic. Res. 2017;4:17051. doi: 10.1038/hortres.2017.51. [DOI] [PMC free article] [PubMed] [Google Scholar]
- 5.Amborella Genome Project The Amborella genome and the evolution of flowering plants. Science. 2013;342:1241089. doi: 10.1126/science.1241089. [DOI] [PubMed] [Google Scholar]
- 6.Wiens JJ. Missing data, incomplete taxa, and phylogenetic accuracy. Syst. Biol. 2003;52:528–538. doi: 10.1080/10635150390218330. [DOI] [PubMed] [Google Scholar]
- 7.Coiro M, Doyle JA, Hilton J. How deep is the conflict between molecular and fossil evidence on the age of angiosperms? New Phytol. 2019;223:83–99. doi: 10.1111/nph.15708. [DOI] [PubMed] [Google Scholar]
- 8.Alvarez-Buylla ER, et al. Arabidopsis Book. 2010. Flower development; p. e0127. [DOI] [PMC free article] [PubMed] [Google Scholar]
- 9.Zhao N, et al. Identification of Flowering regulatory genes in allopolyploid Brassica juncea. Hortic. Plant J. 2019;5:109–119. [Google Scholar]
- 10.Ke M, et al. Auxin controls circadian flower opening and closure in the waterlily. BMC Plant Biol. 2018;18:143. doi: 10.1186/s12870-018-1357-7. [DOI] [PMC free article] [PubMed] [Google Scholar]
- 11.Sharma B, Kramer EM. Aquilegia B gene homologs promote petaloidy of the sepals and maintenance of the C domain boundary. Evodevo. 2017;8:22. doi: 10.1186/s13227-017-0085-7. [DOI] [PMC free article] [PubMed] [Google Scholar]
- 12.Dodsworth S. Petal, sepal, or tepal? B-genes and monocot flowers. Trends Plant Sci. 2017;22:8–10. doi: 10.1016/j.tplants.2016.11.006. [DOI] [PubMed] [Google Scholar]
- 13.Chanderbali AS, et al. Conservation and canalization of gene expression during angiosperm diversification accompany the origin and evolution of the flower. Proc. Natl Acad. Sci. USA. 2010;107:22570–22575. doi: 10.1073/pnas.1013395108. [DOI] [PMC free article] [PubMed] [Google Scholar]
- 14.Sauquet H, et al. The ancestral flower of angiosperms and its early diversification. Nat. Commun. 2017;8:16047. doi: 10.1038/ncomms16047. [DOI] [PMC free article] [PubMed] [Google Scholar]
- 15.Kessler D, et al. How scent and nectar influence floral antagonists and mutualists. eLife. 2015;4:e07641. doi: 10.7554/eLife.07641. [DOI] [PMC free article] [PubMed] [Google Scholar]
- 16.Thien LB, et al. The population structure and floral biology of Amborella trichopoda (Amborellaceae) Ann. Mo. Bot. Gard. 2003;90:466–490. [Google Scholar]
- 17.Chen F, Tholl D, Bohlmann J, Pichersky E. The family of terpene synthases in plants: a mid-size family of genes for specialized metabolism that is highly diversified throughout the kingdom. Plant J. 2011;66:212–229. doi: 10.1111/j.1365-313X.2011.04520.x. [DOI] [PubMed] [Google Scholar]
- 18.Knudsen JT, Tollsten L, Bergstrom LG. Floral scents-a checklist of volatile compounds isolated by head-space techniques. Phytochemistry. 1993;33:253–280. [Google Scholar]
- 19.Zhao N, et al. Structural, biochemical, and phylogenetic analyses suggest that indole-3-acetic acid methyltransferase is an evolutionarily ancient member of the SABATH family. Plant Physiol. 2008;146:455–467. doi: 10.1104/pp.107.110049. [DOI] [PMC free article] [PubMed] [Google Scholar]
- 20.Chen WH, et al. Downregulation of putative UDP-glucose: flavonoid 3-O-glucosyltransferase gene alters flower coloring in Phalaenopsis. Plant Cell Rep. 2011;30:1007–1017. doi: 10.1007/s00299-011-1006-1. [DOI] [PubMed] [Google Scholar]
- 21.Wu Q, et al. Transcriptome sequencing and metabolite analysis for revealing the blue flower formation in waterlily. BMC Genomics. 2016;17:897. doi: 10.1186/s12864-016-3226-9. [DOI] [PMC free article] [PubMed] [Google Scholar]
- 22.Koren S, et al. Canu: scalable and accurate long-read assembly via adaptive k-mer weighting and repeat separation. Genome Res. 2017;27:722–736. doi: 10.1101/gr.215087.116. [DOI] [PMC free article] [PubMed] [Google Scholar]
- 23.Simão FA, Waterhouse RM, Ioannidis P, Kriventseva EV, Zdobnov EM. BUSCO: assessing genome assembly and annotation completeness with single-copy orthologs. Bioinformatics. 2015;31:3210–3212. doi: 10.1093/bioinformatics/btv351. [DOI] [PubMed] [Google Scholar]
- 24.Stanke M, Morgenstern B. AUGUSTUS: a web server for gene prediction in eukaryotes that allows user-defined constraints. Nucleic Acids Res. 2005;33:W465–W467. doi: 10.1093/nar/gki458. [DOI] [PMC free article] [PubMed] [Google Scholar]
- 25.Cantarel BL, et al. MAKER: an easy-to-use annotation pipeline designed for emerging model organism genomes. Genome Res. 2008;18:188–196. doi: 10.1101/gr.6743907. [DOI] [PMC free article] [PubMed] [Google Scholar]
- 26.Emms DM, Kelly S. OrthoFinder: solving fundamental biases in whole genome comparisons dramatically improves orthogroup inference accuracy. Genome Biol. 2015;16:157. doi: 10.1186/s13059-015-0721-2. [DOI] [PMC free article] [PubMed] [Google Scholar]
- 27.Zeng L, et al. Resolution of deep eudicot phylogeny and their temporal diversification using nuclear genes from transcriptomic and genomic datasets. New Phytol. 2017;214:1338–1354. doi: 10.1111/nph.14503. [DOI] [PubMed] [Google Scholar]
- 28.Xiang Y, et al. Evolution of rosaceae fruit types based on nuclear phylogeny in the context of geological times and genome duplication. Mol. Biol. Evol. 2017;34:262–281. doi: 10.1093/molbev/msw242. [DOI] [PMC free article] [PubMed] [Google Scholar]
- 29.Huang CH, et al. Resolution of Brassicaceae phylogeny using nuclear genes uncovers nested radiations and supports convergent morphological evolution. Mol. Biol. Evol. 2016;33:394–412. doi: 10.1093/molbev/msv226. [DOI] [PMC free article] [PubMed] [Google Scholar]
- 30.Hickey LJ, Doyle JA. Early cretaceous fossil evidence for angisperm evolution. Bot. Rev. 1977;43:3–104. [Google Scholar]
- 31.Yang Z. PAML 4: phylogenetic analysis by maximum likelihood. Mol. Biol. Evol. 2007;24:1586–1591. doi: 10.1093/molbev/msm088. [DOI] [PubMed] [Google Scholar]
- 32.Morris JL, et al. The timescale of early land plant evolution. Proc. Natl Acad. Sci. USA. 2018;115:E2274–E2283. doi: 10.1073/pnas.1719588115. [DOI] [PMC free article] [PubMed] [Google Scholar]
- 33.dos Reis M, Yang Z. Approximate likelihood calculation on a phylogeny for Bayesian estimation of divergence times. Mol. Biol. Evol. 2011;28:2161–2172. doi: 10.1093/molbev/msr045. [DOI] [PubMed] [Google Scholar]
- 34.Smith SA, O’Meara BC. treePL: divergence time estimation using penalized likelihood for large phylogenies. Bioinformatics. 2012;28:2689–2690. doi: 10.1093/bioinformatics/bts492. [DOI] [PubMed] [Google Scholar]
- 35.Sanderson MJ. r8s: inferring absolute rates of molecular evolution and divergence times in the absence of a molecular clock. Bioinformatics. 2003;19:301–302. doi: 10.1093/bioinformatics/19.2.301. [DOI] [PubMed] [Google Scholar]
- 36.Wilgenbusch JC, Swofford D. Inferring evolutionary trees with PAUP*. Curr. Prot. Bioinfor. 2003;6:6.4.1–6.4.28. doi: 10.1002/0471250953.bi0604s00. [DOI] [PubMed] [Google Scholar]
- 37.Stamatakis A. RAxML-VI-HPC: maximum likelihood-based phylogenetic analyses with thousands of taxa and mixed models. Bioinformatics. 2006;22:2688–2690. doi: 10.1093/bioinformatics/btl446. [DOI] [PubMed] [Google Scholar]
- 38.Tang H, et al. Screening synteny blocks in pairwise genome comparisons through integer programming. BMC Bioinformatics. 2011;12:102. doi: 10.1186/1471-2105-12-102. [DOI] [PMC free article] [PubMed] [Google Scholar]
- 39.Vanneste K, Van de Peer Y, Maere S. Inference of genome duplications from age distributions revisited. Mol. Biol. Evol. 2013;30:177–190. doi: 10.1093/molbev/mss214. [DOI] [PubMed] [Google Scholar]
- 40.Edgar RC. MUSCLE: multiple sequence alignment with high accuracy and high throughput. Nucleic Acids Res. 2004;32:1792–1797. doi: 10.1093/nar/gkh340. [DOI] [PMC free article] [PubMed] [Google Scholar]
- 41.Goldman N, Yang Z. A codon-based model of nucleotide substitution for protein-coding DNA sequences. Mol. Biol. Evol. 1994;11:725–736. doi: 10.1093/oxfordjournals.molbev.a040153. [DOI] [PubMed] [Google Scholar]
- 42.Guindon S, et al. New algorithms and methods to estimate maximum-likelihood phylogenies: assessing the performance of PhyML 3.0. Syst. Biol. 2010;59:307–321. doi: 10.1093/sysbio/syq010. [DOI] [PubMed] [Google Scholar]
- 43.Proost S, et al. i-ADHoRe 3.0—fast and sensitive detection of genomic homology in extremely large data sets. Nucleic Acids Res. 2012;40:e11. doi: 10.1093/nar/gkr955. [DOI] [PMC free article] [PubMed] [Google Scholar]
- 44.Fostier J, et al. A greedy, graph-based algorithm for the alignment of multiple homologous gene lists. Bioinformatics. 2011;27:749–756. doi: 10.1093/bioinformatics/btr008. [DOI] [PubMed] [Google Scholar]
- 45.Ostlund G, et al. InParanoid 7: new algorithms and tools for eukaryotic orthology analysis. Nucleic Acids Res. 2010;38:D196–D203. doi: 10.1093/nar/gkp931. [DOI] [PMC free article] [PubMed] [Google Scholar]
- 46.Zhang GQ, et al. The Apostasia genome and the evolution of orchids. Nature. 2017;549:379–383. doi: 10.1038/nature23897. [DOI] [PMC free article] [PubMed] [Google Scholar]
- 47.Ming R, et al. The pineapple genome and the evolution of CAM photosynthesis. Nat. Genet. 2015;47:1435–1442. doi: 10.1038/ng.3435. [DOI] [PMC free article] [PubMed] [Google Scholar]
- 48.D’Hont A, et al. The banana (Musa acuminata) genome and the evolution of monocotyledonous plants. Nature. 2012;488:213–217. doi: 10.1038/nature11241. [DOI] [PubMed] [Google Scholar]
- 49.Al-Dous EK, et al. De novo genome sequencing and comparative genomics of date palm (Phoenix dactylifera) Nat. Biotechnol. 2011;29:521–527. doi: 10.1038/nbt.1860. [DOI] [PubMed] [Google Scholar]
- 50.Harkess A, et al. The asparagus genome sheds light on the origin and evolution of a young Y chromosome. Nat. Commun. 2017;8:1279. doi: 10.1038/s41467-017-01064-8. [DOI] [PMC free article] [PubMed] [Google Scholar]
- 51.Cai J, et al. The genome sequence of the orchid Phalaenopsis equestris. Nat. Genet. 2015;47:65–72. doi: 10.1038/ng.3149. [DOI] [PubMed] [Google Scholar]
- 52.Wang W, et al. The Spirodela polyrhiza genome reveals insights into its neotenous reduction fast growth and aquatic lifestyle. Nat. Commun. 2014;5:3311. doi: 10.1038/ncomms4311. [DOI] [PMC free article] [PubMed] [Google Scholar]
- 53.Olsen JL, et al. The genome of the seagrass Zostera marina reveals angiosperm adaptation to the sea. Nature. 2016;530:331–335. doi: 10.1038/nature16548. [DOI] [PubMed] [Google Scholar]
- 54.Guan R, et al. Draft genome of the living fossil Ginkgo biloba. Gigascience. 2016;5:49. doi: 10.1186/s13742-016-0154-1. [DOI] [PMC free article] [PubMed] [Google Scholar]
- 55.Drummond AJ, Suchard MA, Xie D, Rambaut A. Bayesian phylogenetics with BEAUti and the BEAST 1.7. Mol. Biol. Evol. 2012;29:1969–1973. doi: 10.1093/molbev/mss075. [DOI] [PMC free article] [PubMed] [Google Scholar]
- 56.Gandolfo M, Nixon K, Crepet W. A new fossil flower from the Turonian of New Jersey: Dressiantha bicarpellata gen. et sp. nov. (Capparales) Am. J. Bot. 1998;85:964. [PubMed] [Google Scholar]
- 57.Beilstein MA, Nagalingum NS, Clements MD, Manchester SR, Mathews S. Dated molecular phylogenies indicate a Miocene origin for Arabidopsis thaliana. Proc. Natl Acad. Sci. USA. 2010;107:18724–18728. doi: 10.1073/pnas.0909766107. [DOI] [PMC free article] [PubMed] [Google Scholar]
- 58.Crepet W, Nixon K. Fossil Clusiaceae from the late Cretaceous (Turonian) of New Jersey and implications regarding the history of bee pollination. Am. J. Bot. 1998;85:1122–1133. [PubMed] [Google Scholar]
- 59.Xi Z, et al. Phylogenomics and a posteriori data partitioning resolve the Cretaceous angiosperm radiation Malpighiales. Proc. Natl Acad. Sci. USA. 2012;109:17519–17524. doi: 10.1073/pnas.1205818109. [DOI] [PMC free article] [PubMed] [Google Scholar]
- 60.Ramírez SR, Gravendeel B, Singer RB, Marshall CR, Pierce NE. Dating the origin of the Orchidaceae from a fossil orchid with its pollinator. Nature. 2007;448:1042–1045. doi: 10.1038/nature06039. [DOI] [PubMed] [Google Scholar]
- 61.Janssen T, Bremer K. The age of major monocot groups inferred from 800+rbcL sequences. Bot. J. Linn. Soc. 2004;146:385–398. [Google Scholar]
- 62.Smith SA, Beaulieu JM, Donoghue MJ. An uncorrelated relaxed-clock analysis suggests an earlier origin for flowering plants. Proc. Natl Acad. Sci. USA. 2010;107:5897–5902. doi: 10.1073/pnas.1001225107. [DOI] [PMC free article] [PubMed] [Google Scholar]
- 63.Clarke JT, Warnock RCM, Donoghue PCJ. Establishing a time-scale for plant evolution. New Phytol. 2011;192:266–301. doi: 10.1111/j.1469-8137.2011.03794.x. [DOI] [PubMed] [Google Scholar]
- 64.Heled J, Drummond AJ. Calibrated tree priors for relaxed phylogenetics and divergence time estimation. Syst. Biol. 2012;61:138–149. doi: 10.1093/sysbio/syr087. [DOI] [PMC free article] [PubMed] [Google Scholar]
- 65.Li L, Stoeckert CJ, Jr, Roos DS. OrthoMCL: identification of ortholog groups for eukaryotic genomes. Genome Res. 2003;13:2178–2189. doi: 10.1101/gr.1224503. [DOI] [PMC free article] [PubMed] [Google Scholar]
- 66.Capella-Gutiérrez S, Silla-Martínez JM, Gabaldón T. trimAl: a tool for automated alignment trimming in large-scale phylogenetic analyses. Bioinformatics. 2009;25:1972–1973. doi: 10.1093/bioinformatics/btp348. [DOI] [PMC free article] [PubMed] [Google Scholar]
- 67.Stamatakis A. RAxML version 8: a tool for phylogenetic analysis and post-analysis of large phylogenies. Bioinformatics. 2014;30:1312–1313. doi: 10.1093/bioinformatics/btu033. [DOI] [PMC free article] [PubMed] [Google Scholar]
- 68.Li G, et al. Nonseed plant Selaginella moellendorffi has both seed plant and microbial types of terpene synthases. Proc. Natl Acad. Sci. USA. 2012;109:14711–14715. doi: 10.1073/pnas.1204300109. [DOI] [PMC free article] [PubMed] [Google Scholar]
- 69.Zhao N, Guan J, Lin H, Chen F. Molecular cloning and biochemical characterization of indole-3-acetic acid methyltransferase from poplar. Phytochemistry. 2007;68:1537–1544. doi: 10.1016/j.phytochem.2007.03.041. [DOI] [PubMed] [Google Scholar]
- 70.Zhao N, et al. Molecular and biochemical characterization of the jasmonic acid methyltransferase gene from black cottonwood (Populus trichocarpa) Phytochemistry. 2013;94:74–81. doi: 10.1016/j.phytochem.2013.06.014. [DOI] [PubMed] [Google Scholar]
Associated Data
This section collects any data citations, data availability statements, or supplementary materials included in this article.
Supplementary Materials
Supplementary Notes including Supplementary Materials, Methods and Supplementary Figures 1-48, as well as a series of findings in addition to those shown in the main manuscript.
This file contains Supplementary Tables 1-21.
Data Availability Statement
PacBio whole-genome sequencing data, Illumina data and genome assembly sequences have been deposited to the NCBI Sequence Read Archive (SRA) as Bioproject PRJNA565347, and were also deposited in the BIG Data Center (http://bigd.big.ac.cn) under project number PRJCA001283. The genome assembly sequences and gene annotations have been deposited in the Genome Warehouse in BIG Data Center under accession number GWHAAYW00000000. The genome assembly sequences, gene annotations, and the LCN genes used in this study, have been also deposited in the Waterlily Pond (http://waterlily.eplant.org). All other data are available from the corresponding author upon reasonable request.


