Abstract
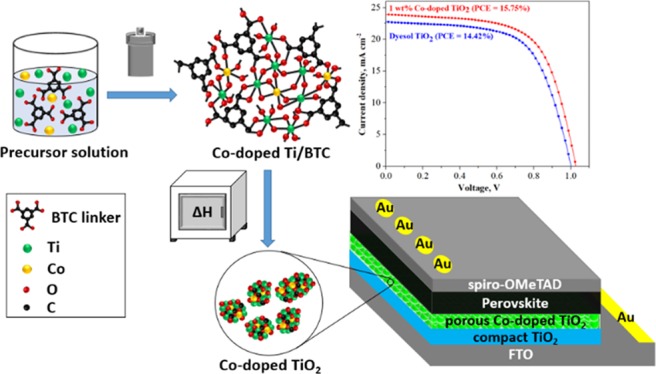
In this study, Co-doped TiO2 was prepared successfully using a solvothermal method with trimesic acid (H3BTC) as an organic framework to form the Co-doped Ti metal–organic framework (Co-doped Ti-MOF). By thermally decomposing the Co-doped Ti-MOF in air, the framework template was removed, and porous Co-doped TiO2 was obtained. The crystal structure of the material was analyzed using X-ray diffraction. The morphology was examined using scanning electron microscopy (SEM) and focused ion beam SEM. The large specific surface area was determined to be 135.95 m2 g–1 using Brunauer–Emmett–Teller theory. Fourier transform infrared spectroscopy verified the presence of Ti–O–Ti and Co–O vibrations in the as-prepared sample. Furthermore, the results of UV–vis spectroscopy showed that doping with Co remarkably improved the absorption ability of Ti-MOF toward the visible-light region with a band gap energy of 2.38 eV (λ = 502 nm). Steady-state photoluminescence and electrochemical impedance spectroscopy were conducted to illustrate the improvement of electron transfer in the doped material further. The optimum power conversion efficiency of solar cells using 1 wt % Co-doped TiO2 as an electron transport layer was found to be 15.75%, while that of solar cells using commercial dyesol TiO2 is only 14.42%.
1. Introduction
In the past few years, the development of renewable and clean energy resources, such as wind power, biomass power, hydropower, and solar energy, has been considered as a viable solution to satisfy ever-increasing energy demands. Among such energy sources, solar energy, which is the most abundant and benign resource, can be utilized for generating electricity without producing greenhouse gases, harmful byproducts, and noise pollution.1,2 Depending on the photosensitive material layer used, there are three major types of solar cells. Crystalline silicon cells form the first generation of solar cells, which have high power conversion efficiency (PCE) and stability but are expensive to manufacture. The second generation includes thin-film solar cells, which are more cost-effective but also less efficient than the first-generation cells. The third-generation solar cells include organic thin-film/polymer solar cells, dye-sensitized/perovskite solar cells (PSCs), and quantum dot solar cells.3−5 Notably, PSCs have received considerable attention owing to their high PCE; abundant elemental constituents; and low-cost, low-temperature, and scalable fabricating process.6−11
Typically, a single PSC has a fluorine-doped tin oxide (FTO) substrate/hole block layer/electron transport layer (ETL)/perovskite layer/hole transport layer (HTL)/metal electrode structure. ETLs can be fabricated from different materials, such as TiO2, SnO2, Al2O3, ZnO, or ZrO2. Among these photocatalysts, TiO2 is one of the best semiconductors for use as an electron transport material (ETM) in PSCs, owing to its superior structural stability, safety, and low cost.12−14 However, the band gap energy of commercial TiO2 is approximately 3.3 eV (λ = 380 nm), which lies in the range of ultraviolet radiation. This relatively large band gap causes difficulty in exciting and injecting the electrons, which leads to inefficient electron transportation and consequently poor electrical conductivity.
One way to address this issue is to dope the semiconductor with metals to reduce the band gap; this enhances sunlight absorbance as well as the transportation of electrons in TiO2 from the perovskite layer. Moreover, metal-doped TiO2 slows down the recombination of photogenerated electron–hole pairs owing to the influence of the trap states and the electronic structure of TiO2. Among the various metallic dopants (e.g., Ni, Mg, Co, Fe, Ca, and Zn), Co has been considered as a suitable candidate for incorporation in TiO2 structures as it considerably reduces the band gap energy of TiO2, leading to increased light absorption. More importantly, doping with Co facilitates the generation of massive distortions and the accompanying defects resulting from the presence of Co atoms in TiO2 lattices.15−18 Recently, metal–organic frameworks (MOFs), which are constructed using various metal ions and organic linkers, have been utilized in various fields including catalysts, supercapacitors, purification, sensors, and gas storage19−23 owing to their unique properties, such as a well-ordered porous structure, high thermal stability, ultralow density, and large internal surface area.24−27 As a consequence, MOFs and MOF-derived materials have been widely employed as a new strategy for the future design of enhanced PSCs. For instance, ZIF-8 materials have been used as an interlayer between the TiO2 and perovskite layer in order to increase the grain size and smooth morphology of the perovskite.25 Meanwhile, some innovative materials such as Zr-MOF, In-MOF, and POM@Cu-BTC were used as an HTL modifier to enhance efficiency and stability for PSCs.28−30 For ETL fabrication, nTi-MOF was incorporated with [6,6]-phenyl-C61-butyric acid methyl ester (PCBM) to achieve outstanding performance and excellent durability.27
Hence, in this study, Co-doped TiO2 with MOFs as a template for the optimized contents was prepared using the solvothermal method. Co-doped Ti-MOFs were constructed in such a way that Ti, Co clusters, and organic linkers would be stitched together. Subsequently, the frameworks were removed by calcination in air to convert Ti to TiO2. The obtained material had a porous structure, both internally and on the surface, and was applied to PSCs as a porous ETL that is compared with commercial dyesol TiO2.
2. Results and Discussion
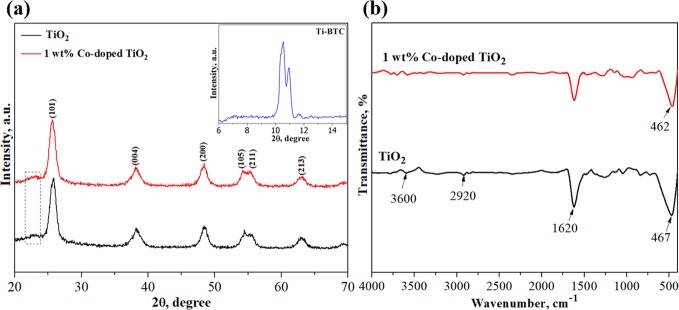
Figure 1a presents the XRD patterns of TiO2 and Co-doped TiO2 powder recorded from 20 to 70°. The XRD peaks at 25.847, 38.298, 48.402, 54.451, 55.645, and 63.095° were assigned to the characteristic peaks of TiO2 anatase (ICSD, no. 75-1537). A graphitic carbon reflection at a 2θ of 23° was observed in the samples after annealing, which was presumably derived from the calcination of the organic linker at 400 °C.31,32 There were no impurity peaks in the patterns of Co-doped TiO2 when compared with those of pure TiO2, implying that the doping with Co2+ ions did not change the original TiO2 structure. However, the peak positions shifted slightly to the left owing to the presence of the dopant, indicating the substitution of Co2+ ions in the TiO2 lattice.33,34 Moreover, the increase in peak sharpness and intensity that was observed in the pattern of the Co-doped TiO2 implies an enhancement of crystal growth. The crystalline sizes of the TiO2 and Co-doped TiO2 particles were estimated to be 9 and 10 nm, respectively, by using the Debye–Scherrer equation with the width of the (101) planes. Besides, the peaks in the range of 10–12° (the inset in Figure 1a) were supposed to be the formation of crystalline Ti-BTC as mentioned in previous research studies.27,35
Figure 1.
(a) XRD patterns and (b) FTIR spectra of TiO2 and 1 wt % Co-doped TiO2. Inset shows XRD of Ti-BTC.
The FTIR spectra of TiO2 and Co-doped TiO2 were analyzed and are shown in Figure 1b. The peaks at 3600 and 1620 cm–1 were attributed to the O–H stretching and H–O–H bending vibrations of the adsorbed water molecules, respectively. The weak peak that appeared at 2920 cm–1 was assigned to the C–H stretching vibration of the residual organic groups. The strong absorption indicated by the prominent peaks between 450 and 500 cm–1 characterized the vibrations of Ti–O–Ti bonding. The slight shift in this peak to the right in the Co-doped TiO2 sample indicated the presence of Co–O bonds due to the replacement of Co2+ at the Ti4+ sites in the TiO2 lattice. This may cause charge neutrality oxygen vacancies, leading to lattice defects.36
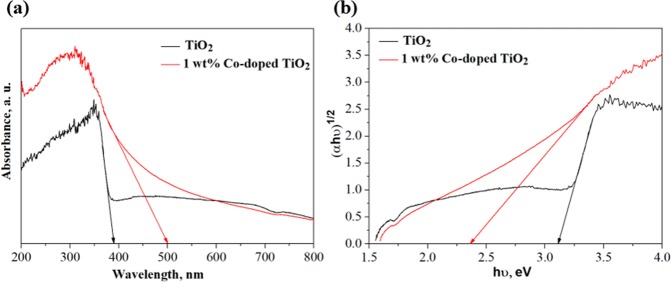
Figure 2a illustrates the optical absorption spectra of undoped and 1 wt % Co-doped TiO2 particles in the range of 200–800 nm obtained by UV–vis measurement. It can be observed that the onset of the absorption spectra of TiO2 and 1 wt % Co-doped TiO2 appeared around 385 and 502 nm, respectively, implying a redshift when using the Co dopant. According to the equation Eg = 1240/λonset, the band gap energies of TiO2 and 1 wt % Co-doped TiO2 were 3.22 and 2.38 eV, respectively. These values were fitted with the absorption spectra, as shown in Figure 2b. The decrease in the band gap energy of the doped sample could be assigned to the defect structure (oxygen ion vacancies) due to the substitution of Co2+ at Ti4+ sites in the original TiO2 lattice, which introduced additional energy states near the valence band.36,37 As a result, the enhanced electron charge transfer between the conduction and valence bands of 1 wt % Co-doped TiO2 was expected to achieve a more effective injection from the perovskite layer to the ETM.
Figure 2.
(a) UV–vis absorbance spectra. (b) Band gap energy of TiO2 and 1 wt % Co-doped TiO2.
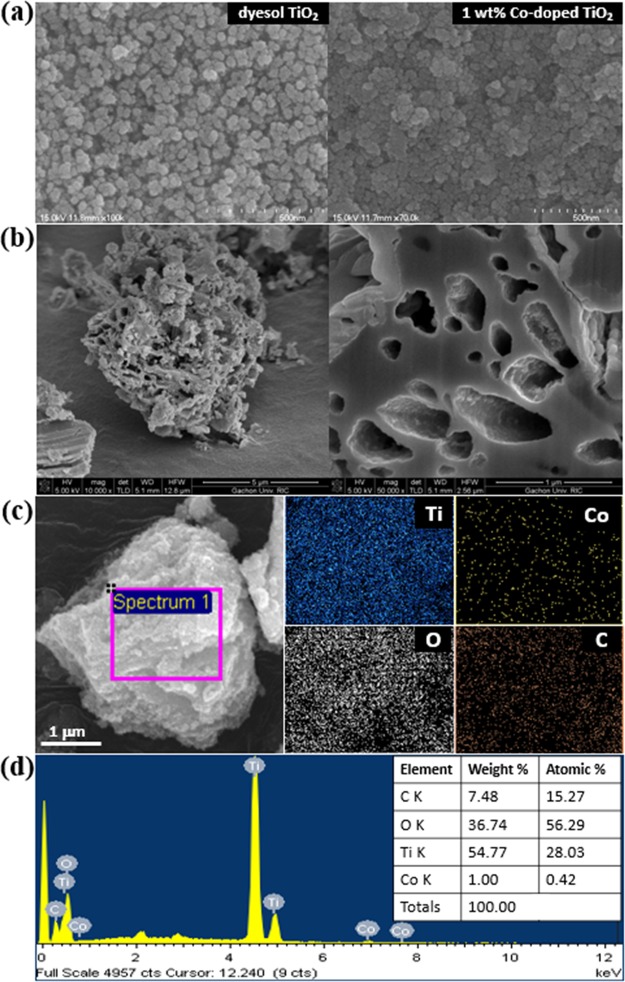
Figure 3a illustrates that a smooth ETL could be derived by spin coating as-prepared 1 wt % Co-doped TiO2 paste, which was comparable with commercial dyesol TiO2. Figure 3b shows the surface morphology and pore structure of 1 wt % Co-doped TiO2. The results show that the Co-doped TiO2 particles prepared based on the MOF structure using the BTC template had a highly porous structure both inside and on the surface owing to the removal of the template. The elemental maps of C, O, Ti, and Co shown in Figure 3c confirm that Ti and Co were uniformly distributed in the material. Moreover, the EDX elemental spectrum in Figure 3d shows that the cobalt content of the selected area matched well with its theoretical loadings (i.e., 1 wt %). The small amount of carbon present in the sample is in line with the XRD result.
Figure 3.
(a) SEM images of dyesol TiO2 and 1 wt % Co-doped TiO2 paste on FTO-coated glass. (b) SEM and FIB-SEM images of 1 wt % Co-doped TiO2 powder. (c) Elemental mapping and (d) EDX spectrum of 1 wt % Co-doped TiO2 powder.
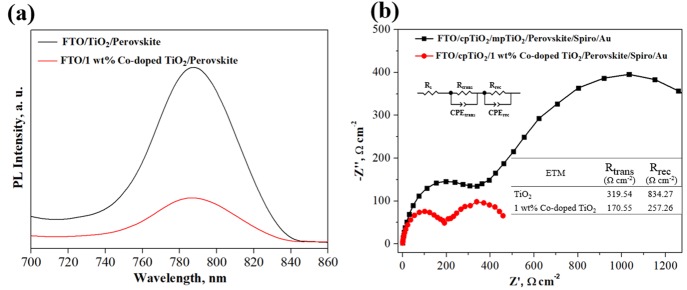
Figure 4a shows the PL spectra of the perovskite films using TiO2 and Co-doped TiO2 as the ETM at the wavelengths ranging from 700 to 860 nm with light excitation at 540 nm. The intensity of the photoluminescence peak at 760 nm decreased substantially in Co-doped TiO2 compared to the TiO2 sample, suggesting that cobalt doping can reduce the recombination of electron–hole pairs on the surface of TiO2.16 The EIS curves are performed to further probe the improvement in charge transport and charge recombination behavior due to doping cobalt as shown in Figure 4b. The charge transport resistance (Rtrans) and charge recombination resistance (Rrec) of devices using undoped and 1 wt % Co-doped TiO2 were determined from the diameter of the semicircle of the associated Nyquist plot. The significant decrease in Rtrans and Rrec confirmed the advantages of the dopant in boosting electron transport and alleviating electron–hole recombination, in agreement with UV and PL measurements.
Figure 4.
(a) Photoluminescence (PL) spectra. (b) Nyquist plot characteristic curves of films based on TiO2 and 1 wt % Co-doped TiO2.
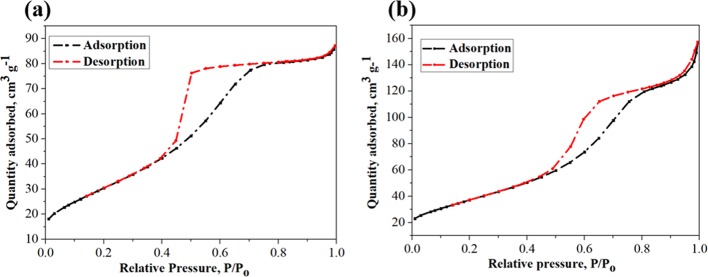
The N2 adsorption–desorption isotherms of TiO2 and Co-doped TiO2 at 77.418 K (in Figure 5) exhibit a capillary condensation phenomenon in the pores at a relative pressure above 0.45, indicating the presence of a porous interior structure. Using the same synthesis method, Co-doped TiO2 was found to have a larger specific surface area than TiO2 (BET values of 135.95 and 111.94 m2 g–1). The Barrett–Joyner–Halenda (BJH) distribution curves (in Figure S2) show that the average pore diameters of the Co-doped TiO2 and TiO2 particles were 6.79 and 4.74 nm, respectively, while the pore volumes of Co-doped TiO2 and TiO2 were 0.25 and 0.14 cm3 g–1, respectively.
Figure 5.
N2 adsorption–desorption isotherms of (a) TiO2 and (b) 1 wt % Co-doped TiO2.
Table 1 summarizes the photovoltaic parameters of the devices that use dyesol TiO2, the prepared TiO2, and Co-doped TiO2 samples as different ETLs by reverse scan. Compared with the PSCs using dyesol and the prepared TiO2, the cells using 1 wt % Co-doped TiO2 not only achieved the highest performance (average PCE of 15.34% and maximum PCE of 15.75% accompanied with Jsc of 24.078 mA cm–2 and FF of 64.949%) but also showed excellent reproducibility, which was comparable with dyesol (in Figure S3). The remarkably enhanced performance of 1 wt % Co-doped TiO2 was ascribed to two factors: (i) its interior and surficial morphologies obtained from thermal decomposition of the MOF template and (ii) improvement in electron transfer by doping with Co, as mentioned earlier. However, a further increase in the Co concentration over 1 wt % resulted in deterioration of the performance of the PSCs, as shown in Figure 6, probably owing to the formation of secondary impurity phases (or incorporation of Co ions at the interstitial sites) as explained in previous research.37
Table 1. Photovoltaic Parameters of the Best PCE.
| ETL | Voc (V) | Jsc (mA/cm2) | FF (%) | PCE (%) | |
|---|---|---|---|---|---|
| TiO2 | max | 1.019 | 21.674 | 61.396 | 12.32 |
| average | 0.970 | 20.591 | 57.632 | 11.50 | |
| 1 wt % Co-doped TiO2 | max | 1.027 | 24.078 | 64.949 | 15.75 |
| average | 1.02 | 23.666 | 63.554 | 15.34 | |
| 2 wt % Co-doped TiO2 | max | 1.048 | 23.739 | 61.786 | 15.12 |
| average | 1.040 | 23.295 | 59.384 | 14.41 | |
| 3 wt % Co-doped TiO2 | max | 1.051 | 23.37 | 62.514 | 14.92 |
| average | 1.039 | 22.383 | 58.33 | 13.58 | |
| dyesol TiO2 | max | 1.019 | 23.002 | 63.17 | 14.42 |
| average | 1.001 | 22.611 | 61.737 | 13.98 |
Figure 6.
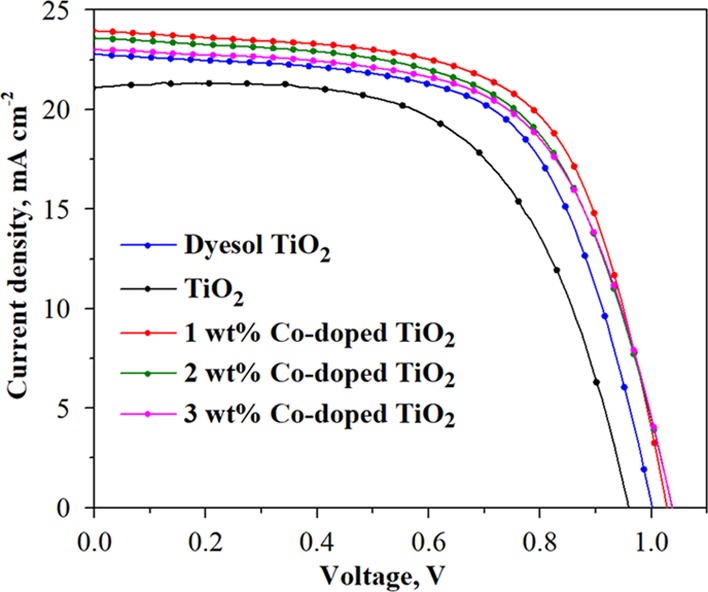
J–V curves of the PSCs with the best performance using dyesol TiO2, undoped TiO2, and Co-doped TiO2 (1, 2, and 3 wt %) by reverse scan.
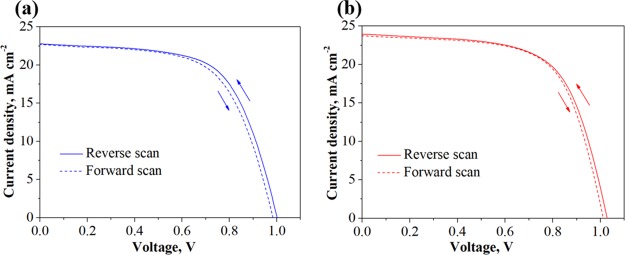
The hysteresis of PSCs is demonstrated through the difference of J–V curves between reverse and forward scanning directions (in Figure 7), and the key photovoltaic parameters are listed in Table 2. It can be seen that the PCEs of dyesol TiO2 and 1 wt % Co-doped TiO2 devices in reverse–forward sweeps were found to be 15.75–15.60% and 14.42–14.02%, respectively. This presents the negligible hysteresis behavior, implying the efficient electron transfer from perovskite.27
Figure 7.
J–V curves of the PSCs using (a) dyesol TiO2 and (b) 1 wt % Co-doped TiO2 measured with reverse and forward scans.
Table 2. Photovoltaic Parameters of the PSCs with Dyesol TiO2 and 1 wt % Co-Doped TiO2.
| ETL | scan direction | Voc (V) | Jsc (mA/cm2) | FF (%) | PCE (%) |
|---|---|---|---|---|---|
| dyesol TiO2 | reverse scan | 1.019 | 23.002 | 63.17 | 14.42 |
| forward scan | 0.992 | 22.714 | 62.19 | 14.02 | |
| 1 wt % Co-doped TiO2 | reverse scan | 1.027 | 24.078 | 64.95 | 15.75 |
| forward scan | 1.012 | 23.751 | 64.94 | 15.60 |
3. Conclusions
By using the solvothermal method, Co-doped TiO2 samples were synthesized successfully. PSCs were also fabricated using the Co-doped TiO2 samples as efficient ETLs. Compared with commercial dyesol TiO2, the solar cells based on the prepared materials exhibited enhanced performance. An excellent PCE of up to 15.75% was obtained with an open-circuit voltage of 1.027 V, a current density of 24.078 mA/cm2, and a fill factor of 64.95%.
4. Experimental Section
4.1. Materials
The following materials were purchased from Sigma-Aldrich: titanium(IV) isopropoxide (≥97%), cobalt(II) chloride hexahydrate (98%), trimesic acid (95%), methyl alcohol (99.8%), ethyl alcohol (99.9%), 2-methoxyethanol (99.8%), α-terpineol, ethyl cellulose, lead(II) iodide (99.999%), N,N-dimethylformamide (DMF; anhydrous, 99.8%), dimethyl sulfoxide (DMSO; anhydrous, ≥99.9%), titanium diisopropoxide bis(acetylacetone) (75% in 1-butanol), 4-tert-butylpyridine (96%), bis(trifluoromethane)sulfonamide lithium salt (LI-TSFI; 99.95%), 2-propanol (99.5%), chlorobenzene (99.8%), acetonitrile (99.93%), and 2,2′,7,7′-tetrakis[N,N-di(4-methoxyphenyl)amino]-9,9′-spirobifluorene (99%) (spiro-OMeTAD). Formamidinium iodide (FAI), methylammonium bromide (MABr), methylammonium hydrochloride (MAHCl), and titanium nanoparticle paste (18NR-T) were procured from Great Cell Solar Co.
4.2. Preparation of Co-Doped TiO2 Powder
Co-doped TiO2 particles were synthesized using a solvothermal method, as illustrated in Figure S1. Trimesic acid (H3BTC) was dissolved in methanol by stirring to obtain a transparent and homogeneous mixture. Then, titanium(IV) isopropoxide was added in drops to the mixture for 20 min. The determined amounts of CoCl2·6H2O in methanolic solution were slowly added to the mixture and stirred for 30 min. Afterward, the obtained blend was transferred to an autoclave and treated at 150 °C for 24 h. Subsequently, the solid Co-doped Ti-BTC was washed with the cosolvent (deionized water/ethanol) several times and collected through centrifugation. Finally, the Co-doped TiO2 powder was obtained after drying at 60 °C and calcination at 400 °C for 5 h in air to remove the organic residues.
4.3. Preparation of Co-Doped TiO2 Paste
Co-doped TiO2 paste was prepared by mixing the as-prepared particles with ethanol, water, and acetic acid using ball milling for 24 h. Subsequently, α-terpineol and ethyl cellulose were added to the mixture and ultrasonicated for 1 h. The paste was obtained after evaporating the solvent while stirring at 80 °C.
4.4. Solar Cell Fabrication
To fabricate the solar cell, the FTO substrates were thoroughly cleaned using an ultrasonic bath for 20 min with acetone, isopropanol, deionized water, and ethanol. A TiO2 blocking layer with titanium diisopropoxide bis(acetylacetone) in ethanol (1:10 v/v ratio) was applied on the washed FTO, using a spin-coater at 2000 rpm for 40 s. After spinning, the substrates were placed on a hot plate at 120 °C for 10 min and then annealed at 450 °C for 30 min. After cooling to room temperature, the porous layer with Co-doped TiO2 paste in the solvent mixture (3.5:1 wt/wt of α-terpineol/2-methoxy ethanol) (1 wt % paste:5 wt % solvent mixture) was deposited on the FTO/block-TiO2 film by spin-coating at 4000 rpm for 20 s. Subsequently, the film was annealed at 500 °C for 1 h. The perovskite layer was deposited by performing a two-step spin-coating procedure inside a glovebox under a N2 atmosphere. In the first step, a 1.3 M PbI2 solution (600 mg of PbI2 dissolved in 950 μL of DMF and 50 μL of DMSO) was spin-coated at 2000 rpm for 30 s. In the second step, a 1 mL solution of FAI (60 mg), MABr (6 mg), and MAHCl (6 mg) in isopropanol was coated onto the PbI2 layer at 4000 rpm for 20 s (loading time, 20 s). Then, the film was placed on a hot plate at 150 °C for 15 min. A spiro-OMeTAD solution (84 mg of spiro-OMeTAD dissolved in 1 mL of chlorobenzene, 28.8 μL of 4-tert-butylpyridine, and 17.5 μL of LI-TSFI (520 mg of LI-TSFI in 1 mL of acetonitrile)) was applied onto the perovskite layer at 4000 rpm for 20 s. Finally, 100 nm of Au metal as a cation electrode was deposited on top of the film by thermal evaporation.
4.5. Measurements and Characterization
The crystal structures of the materials were analyzed using X-ray diffraction (XRD; Rigaku DMAX 2200, Japan) using Cu Kα radiation (λ = 0.15406 nm) at scan rates of 0.2° min–1 (in 5–15° range) and 5° min–1 (in 20–70° range). Ultraviolet–visible (UV–vis; Agilent 8453, USA) light absorption was used to assess the absorption properties of the prepared materials. The Fourier transform infrared (FTIR; Vertex 70, Bruker, Germany) spectra of the material were recorded to verify the doping-induced presence of the functional groups. The morphology and structure of the particles were determined using scanning electron microscopy (SEM; Hitachi S-4700, Japan) with energy-dispersive X-ray (EDX) and focused ion beam SEM (FIB-SEM; Hitachi, Japan). The steady-state photoluminescence (PL; QuantaMaster TM 50 PTI, USA) spectra were determined to reveal the enhancement by cobalt doping. Also, electrochemical impedance spectroscopy (EIS; Bio-Logic Science Instruments, France) was carried out in dark conditions with frequencies from 20 mHz to 200 kHz, a bias of 0 V, and an amplitude of 20 mV. The specific surface area of the materials was confirmed by nitrogen adsorption–desorption measurements based on Brunauer–Emmett–Teller (BET) theory, performed using Micromeritics ASAP 2020 apparatus. A sun simulator (Polaromix K201, Solar simulator LAB 50, McScience K3000) with an irradiance of 100 mW cm–2 was used to provide simulated solar irradiation.
Acknowledgments
This research was supported by the Korea Electric Power Corporation (grant no. R17XA05-10) and the Creative Materials Discovery Program through the National Research Foundation of Korea (NRF) funded by the Ministry of Science and ICT (2017M3D1A1040828) and the Korea Basic Science Institute grant funded by the Ministry of Education (2019R1A6C1010016). We thank the Smart Materials Research Center for IoT supported by NFEC at Gachon University for its instrumental support (XRD and SEM).
Supporting Information Available
The Supporting Information is available free of charge at https://pubs.acs.org/doi/10.1021/acsomega.9b03507.
Schematic diagram of Co-doped TiO2 particles preparation, Barrett–Joyner–Halenda (BJH) pore size distribution curve, and statistical distribution of the parameters obtained from 20 pieces of PSCs (PDF)
The authors declare no competing financial interest.
Supplementary Material
References
- Brown A., Müller S., Dobrotkova Z.. Renewable energy: Markets and prospects by technology ;IEA; information paper, 2011.
- Hsu A., Rosengarten C., Weinfurter A., Xie Y.. Renewable Energy and Energy Efficiency in Developing Countries: Contributions to Reducing Global Emissions; United Nations Environment Programme, 2017.
- Kibria M. T., Ahammed A., Sony S. M., Hossain F., Islam S. U.. A Review: Comparative studies on different generation solar cells technology. In Proceedings of 5th International Conference on Environmental Aspects of Bangladesh; 2014.
- Luceño-Sánchez J.; Díez-Pascual A.; Capilla R. P. Materials for photovoltaics: state of art and recent developments. Int. J. Mol. Sci. 2019, 20, 976. 10.3390/ijms20040976. [DOI] [PMC free article] [PubMed] [Google Scholar]
- Kazim S.; Nazeeruddin M. K.; Grätzel M.; Ahmad S. Perovskite as light harvester: a game changer in photovoltaics. Angew. Chem., Int. Ed. 2014, 53, 2812–2824. 10.1002/anie.201308719. [DOI] [PubMed] [Google Scholar]
- Song T.-B.; Chen Q.; Zhou H.; Jiang C.; Wang H.-H.; Yang Y.; Liu Y.; You J.; Yang Y. Perovskite solar cells: film formation and properties. J. Mater. Chem. A 2015, 3, 9032–9050. 10.1039/c4ta05246c. [DOI] [Google Scholar]
- Park N.-G. Organometal perovskite light absorbers toward a 20% efficiency low-cost solid-state mesoscopic solar cell. J. Phys. Chem. Lett. 2013, 4, 2423–2429. 10.1021/jz400892a. [DOI] [Google Scholar]
- Zhang Y.; Zhang H.; Zhang X.; Wei L.; Zhang B.; Sun Y.; Hai G.; Li Y. Major impediment to highly efficient, stable and low-cost perovskite solar cells. Metals 2018, 8, 964. 10.3390/met8110964. [DOI] [Google Scholar]
- Wu J.; Xu X.; Zhao Y.; Shi J.; Xu Y.; Luo Y.; Li D.; Wu H.; Meng Q. DMF as an additive in a two-step spin-coating method for 20% conversion efficiency in perovskite solar cells. ACS Appl. Mater. Interfaces 2017, 9, 26937–26947. 10.1021/acsami.7b08504. [DOI] [PubMed] [Google Scholar]
- Chen L.; Cao H.; Wang S.; Luo Y.; Tao T.; Sun J.; Zhang M. Efficient air-stable perovskite solar cells with a (FAI)0.46(MAI)0.40(MABr)0.14(PbI2)0.86(PbBr2)0.14 active layer fabricated via a vacuum flash-assisted method under RH > 50%. RSC Adv 2019, 9, 10148–10154. 10.1039/c9ra01625b. [DOI] [PMC free article] [PubMed] [Google Scholar]
- Wang Y.; Yue Y.; Yang X.; Han L. Toward long-term stable and highly efficient perovskite solar cells via effective charge transporting materials. Adv. Energy Mater. 2018, 8, 1800249. 10.1002/aenm.201800249. [DOI] [Google Scholar]
- Chen X.; Mao S. S. Titanium dioxide nanomaterials: synthesis, properties, modifications, and applications. Chem. Rev. 2007, 107, 2891–2959. 10.1021/cr0500535. [DOI] [PubMed] [Google Scholar]
- Bai Y.; Mora-Seró I.; de Angelis F.; Bisquert J.; Wang P. Titanium dioxide nanomaterials for photovoltaic applications. Chem. Rev 2014, 10095–10130. 10.1021/cr400606n. [DOI] [PubMed] [Google Scholar]
- Wei D.; Ji J.; Song D.; Li M.; Cui P.; Li Y.; Mbengue J. M.; Zhou W.; Ning Z.; Park N.-G. A TiO2 embedded structure for perovskite solar cells with anomalous grain growth and effective electron extraction. J. Mater. Chem. A 2017, 5, 1406–1414. 10.1039/c6ta10418e. [DOI] [Google Scholar]
- Roose B.; Pathak S.; Steiner U. Doping of TiO2 for sensitized solar cells. Chem. Soc. Rev. 2015, 44, 8326–8349. 10.1039/c5cs00352k. [DOI] [PubMed] [Google Scholar]
- Wu M.-C.; Lin T.-H.; Chan S.-H.; Liao Y.-H.; Chang Y.-H. Enhanced photovoltaic performance of perovskite solar cells by tuning alkaline earth metal-doped perovskite-structured absorber and metal-doped TiO2hole blocking layer. ACS Appl. Energy Mater. 2018, 4849–4859. 10.1021/acsaem.8b00915. [DOI] [Google Scholar]
- Sadanandam G.; Lalitha K.; Kumari V. D.; Shankar M. V.; Subrahmanyam M. Cobalt doped TiO2: A stable and efficient photocatalyst for continuous hydrogen production from glycerol: water mixtures under solar light irradiation. Int. J. Hydrogen Energy 2013, 38, 9655–9664. 10.1016/j.ijhydene.2013.05.116. [DOI] [Google Scholar]
- Kim J. K.; Chai S. U.; Ji Y.; Levy-Wendt B.; Kim S. H.; Yi Y.; Heinz T. F.; Nørskov J. K.; Park J. H.; Zheng X. Resolving hysteresis in perovskite solar cells with rapid flame-processed cobalt-doped TiO2. Adv. Energy Mater. 2018, 8, 1801717. 10.1002/aenm.201801717. [DOI] [Google Scholar]
- Chueh C.-C.; Chen C.-I.; Su Y.-A.; Konnerth H.; Gu Y.-J.; Kung C.-W.; Wu K. C.-W. Harnessing MOF materials in photovoltaic devices: recent advances, challenges, and perspectives. J. Mater. Chem. A 2019, 7, 17079. 10.1039/c9ta03595h. [DOI] [Google Scholar]
- Kaneti Y. V.; Dutta S.; Hossain M. S.; Shiddiky M. J.; Tung K.-L.; Shieh F.-K.; Tsung C.-K.; Wu K. C.-W.; Yamauchi Y. Strategies for improving the functionality of zeolitic imidazolate frameworks: tailoring nanoarchitectures for functional applications. Adv.Mater. 2017, 29, 1700213. 10.1002/adma.201700213. [DOI] [PubMed] [Google Scholar]
- Liao Y.-T.; Matsagar B. M.; Wu K. C.-W. Metal–organic framework (MOF)-derived effective solid catalysts for valorization of lignocellulosic biomass. ACS Sustainable Chem. Eng. 2018, 6, 13628–13643. 10.1021/acssuschemeng.8b03683. [DOI] [Google Scholar]
- Shieh F.-K.; Wang S.-C.; Yen C.-I.; Wu C.-C.; Dutta S.; Chou L.-Y.; Morabito J. V.; Hu P.; Hsu M.-H.; Wu K. C. -W.; Tsung C.-K. Imparting functionality to biocatalysts via embedding enzymes into nanoporous materials by a de novo approach: size-selective sheltering of catalase in metal-organic framework microcrystals. J. Am. Chem. Soc. 2015, 137, 4276–4279. 10.1021/ja513058h. [DOI] [PubMed] [Google Scholar]
- Sue Y.-C.; Wu J.-W.; Chung S.-E.; Kang C.-H.; Tung K.-L.; Wu K. C.-W.; Shieh F.-K. Synthesis of hierarchical micro/mesoporous structures via solid–aqueous interface growth: zeolitic imidazolate framework-8 on siliceous mesocellular foams for enhanced pervaporation of water/ethanol mixtures. ACS Appl. Mater. Interfaces 2014, 6, 5192–5198. 10.1021/am5004188. [DOI] [PubMed] [Google Scholar]
- Gangu K. K.; Maddila S.; Mukkamala S. B.; Jonnalagadda S. B. A review on contemporary metal-organic framework materials. Inorg. Chim. Acta 2016, 446, 61–74. 10.1016/j.ica.2016.02.062. [DOI] [Google Scholar]
- Vinogradov A. V.; Zaake-Hertling H.; Hey-Hawkins E.; Agafonov A. V.; Seisenbaeva G. A.; Kessler V. G.; Vinogradov V. V. The first depleted heterojunction TiO2–MOF-based solar cell. Chem. Commun. 2014, 50, 10210–10213. 10.1039/c4cc01978d. [DOI] [PubMed] [Google Scholar]
- Shen D.; Pang A.; Li Y.; Dou J.; Wei M. Metal–organic frameworks at interfaces of hybrid perovskite solar cells for enhanced photovoltaic properties. Chem. Commun 2018, 54, 1253–1256. 10.1039/c7cc09452c. [DOI] [PubMed] [Google Scholar]
- Ryu U.; Jee S.; Park J.-S.; Han I. K.; Lee J. H.; Park M.; Choi K. M. Nanocrystalline titanium metal–organic frameworks for highly efficient and flexible perovskite solar cells. ACS Nano 2018, 12, 4968–4975. 10.1021/acsnano.8b02079. [DOI] [PubMed] [Google Scholar]
- Lee C.-C.; Chen C.-I.; Liao Y.-T.; Wu K. C.-W.; Chueh C.-C. Enhancing efficiency and stability of photovoltaic cells by using perovskite/Zr-MOF heterojunction including bilayer and hybrid structures. Adv. Sci. 2019, 6, 1801715. 10.1002/advs.201801715. [DOI] [PMC free article] [PubMed] [Google Scholar]
- Li M.; Xia D.; Yang Y.; Du X.; Dong G.; Jiang A.; Fan R. Doping of [In2(phen)3Cl6]·CH3CN·2H2O indium-based metal–organic framework into hole transport layer for enhancing perovskite solar cell efficiencies. Adv. Energy Mater. 2018, 8, 1702052. 10.1002/aenm.201702052. [DOI] [Google Scholar]
- Dong Y.; Zhang J.; Yang Y.; Qui L.; Xia D.; Lin K.; Wang J.; Fan X.; Fan R. Self-assembly of hybrid oxidant POM@Cu-BTC for enhanced efficiency and long-term stability of perovskite solar cells. Angew. Chem. Int. Ed 2019, 58, 17610–17615. 10.1002/anie.201909291. [DOI] [PubMed] [Google Scholar]
- Wang Y.; Wu X.; Zhang L. Three-dimensional hollow porous raspberry-like hierarchical Co/Ni@carbon microspheres for magnetic solid-phase extraction of pyrethroids. Microchim. Acta 2018, 185, 437. 10.1007/s00604-018-2973-5. [DOI] [PubMed] [Google Scholar]
- Du Q.-S.; Tang P.-D.; Huang H.-L.; Du F.-L.; Huang K.; Xie N.-Z.; Long S.-Y.; Li Y.-M.; Qiu J.-S.; Huang R.-B. A new type of two-dimensional carbon crystal prepared from 1,3,5-trihydroxybenzene. Sci. Rep. 2017, 7, 40796. 10.1038/srep40796. [DOI] [PMC free article] [PubMed] [Google Scholar]
- Mangrola M. H.; Joshi V. G. Structural, optical and dielectric properties of cobalt doped TiO2. VNSGU Journal of Science and Technology 2015, 4, 237–242. [Google Scholar]
- Mangrola M. H.; Joshi V. G. Structural characterization of cobalt doped TiO2 prepared by solid state reaction method. Multi Disciplinary Edu Global Quest (Quarterly) 2013, 2, 93.2250-3048. [Google Scholar]
- Castells-Gil J.; Padial N. M.; Almora-Barrios N.; Da Silva I.; Mateo D.; Albero J.; García H.; Martí-Gastaldo C. De novo synthesis of mesoporous photoactive titanium(IV)-organic frameworks with MIL-100 topology. Chem. Sci 2019, 10, 4313–4321. 10.1039/c8sc05218b. [DOI] [PMC free article] [PubMed] [Google Scholar]
- Choudhury B.; Choudhury A. Luminescence characteristics of cobalt doped TiO2 nanoparticles. J. Lumin. 2012, 132, 178–184. 10.1016/j.jlumin.2011.08.020. [DOI] [Google Scholar]
- Khurana C.; Pandey O. P.; Chudasama B. Synthesis of visible light-responsive cobalt-doped TiO2 nanoparticles with tunable optical band gap. J. Sol-Gel Sci. Technol. 2015, 75, 424–435. 10.1007/s10971-015-3715-3. [DOI] [Google Scholar]
Associated Data
This section collects any data citations, data availability statements, or supplementary materials included in this article.


