Abstract
A naked-eye colorimetric chemosensor DK based on benzothiazole could recognize CN– effectively. When DK interacted with CN– in the aqueous solution, the obvious color change of the solution was directly observed by the naked eye. Other anions did not cause any interference. It is interesting that DK could also discriminate Ni2+ from other cations, and the possible interaction mode between them was verified based on the Job’s plot, 1H nuclear magnetic resonance titration, infrared , electrospray ionization mass spectrometry, scanning electron microscopy analysis, and density functional theory calculation methods. As a result, it is clear that the mode of action between DK and CN– was different from that between DK and Ni2+. Meanwhile, the limit of detection of DK toward CN– and Ni2+ was calculated to be 1.7 × 10⁻⁸ or 7.4 × 10⁻⁹ M, respectively. In addition, CN– was recognized qualitatively by a test paper and silica gel plates made from DK. DK was able to detect CN– in tap water quantitatively, rapidly, and on-site by the use of a smartphone APP. All results implied that DK has certain prospects for practical application to identify CN– in water.
Introduction
It is universally known that cyanide anion (CN–) is one of the most toxic anions1,2 because it can cause many of the body’s physiological functions to be disordered including hypoxia, respiratory failure, endocrine disorders, nervous system lesion, vascular necrosis, and even death.3−7 Despite its daunting toxicity, CN– plays an important role in industry and life.8−10 Because of its widespread industrial applications and serious dangers to the environment and humans, it is highly desirable to develop some convenient, reliable, inexpensive, highly sensitive, good selective, rapid, and effective methods to detect CN– in water.11−13
As everyone knows, nickel ion (Ni2+) participates in some vital life processes such as biosynthesis, biological respiration, and metabolism.14,15 However, the excessive accumulation of Ni2+ in body can also cause adverse effects on the respiratory system, blood, kidneys, and other body organs, which might lead to certain diseases including allergies, asthma, pneumonia, cancer, and nervous system diseases.14−18 Besides, Ni2+ is applied widely in the industry.16−19 Hence, there is much attention to seek better test methods for Ni2+.14−19
Compared to other methods, chemosensors have gained more and more attention because of their excellent superiorities.20−23It is found that chemosensors toward Ni2+ have been seldom reported, which may be related to the interference caused by some basic metal ions.24−26 In addition, there are a few chemosensors which can recognize both anions and cations independently.27−29 Although some chemosensors can recognize certain cations and anions, they cannot independently interact with cations or anions. They interact with cations or anions through the “sequential detection” mechanism.27−29 At present, it is rare to find some colorimetric chemosensor that can discriminate CN– or Ni2+ from other ions independently.
Herein, it is reported that the chemosensor DK which was synthesized and separated easily could recognize CN– effectively (Scheme 1). Once DK interacted with CN–, the distinct color changes of the solution were perceived by the naked eye. Interestingly, DK could also detect Ni2+ with good selectivity and high sensitivity even in the presence of other cations. The action mode between DK and CN– (or Ni2+) was confirmed based on the Job’s plot, 1H nuclear magnetic resonance (NMR) titration, infrared (IR), electrospray ionization mass spectrometry (ESI-MS), scanning electron microscopy (SEM) analysis, and density functional theory (DFT) calculation methods. From the data, it is obvious that DK could interact with CN– or Ni2+ through two different kinds of mechanisms. Besides, the limit of detection (LOD) of DK toward CN– or Ni2+ was calculated to be 1.7 × 10⁻⁸ and 7.4 × 10⁻⁹ M, which was much lower than the standards in the World Health Organization (WHO) guidelines and in some chemosensors previously reported.7,30 Furthermore, the test paper and silica gel plates made from DK could achieve the purpose of qualitative detection of CN– in the tap water. DK could implement the quantitative detection of CN– rapidly and on-site by the use of a smartphone APP. All results implied that DK has certain prospects for practical application to identify CN– in water.
Scheme 1. Synthetic Route of DK.
Results and Discussion
Colorimetric Analysis of DK with CN–
When various anions F–, Cl–, Br–, I–, SO42–, SO32–, S2–, NO3–, NO2–, PO43–, CO32–, HCO3–, AcO–, EDTA2–, H2PO4–, and CN– were added into the DK solution, only CN– caused the absorption spectra change, and a new absorption peak appeared at 408 nm. The solution color changed from colorless to yellow immediately, which was observed directly by the naked eye (Figures 1 and 3a). It is interesting that no other cation except Ni2+ could cause a red shift in the absorption spectra when different metal ions (K+, Na+, Ag+, Cu2+, Co2+, Ca2+, Cd2+, Mg2+, Ba2+, Pb2+, Sr2+, Fe2+, Ni2+, Zn2+, Mn2+, Hg2+, Al3+, Y3+, Ce3+, and Fe3+) were added to the DK solution. It is clear that the absorption peak at 335 nm decreased in the absorption spectra, and a new absorption peak rose at 399 nm simultaneously (Figure 2). The color change of the solution was examined forthright by the naked eye from colorless to pale yellow after Ni2+ was added (Figure 3b).
Figure 1.
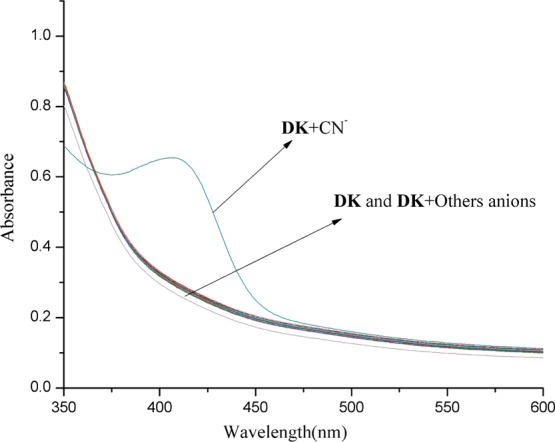
Absorption variations of DK (1 × 10⁻⁵ M) with various anions (3 equiv) in HEPES buffer/CH3CN (0.01 M, pH = 7.3, v/v = 1:9) solution.
Figure 3.
Color changes photos of DK (1 × 10⁻⁵ M) with (a) diverse anions (3 equiv) and (b) cations (3 equiv).
Figure 2.
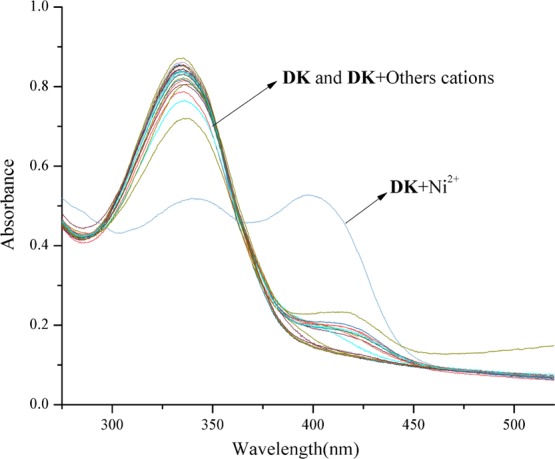
Absorption variations of DK (1 × 10⁻⁵ M) with various cations (3 equiv) in HEPES buffer/CH3CN (0.01 M, pH = 7.3, v/v = 1:9) solution.
In order to study the detection of DK toward CN– and Ni2+ in the presence of other ions, an interference experiment was carried out. The results showed that other ions had no effect on the detection of DK toward CN– and Ni2+ (Figures S4 and S5, Supporting Information). It implied that DK could recognize CN– and Ni2+ independently, selectively, and sensitively and hence might be considered as the colorimetric chemosensor toward CN– and Ni2+.
Interaction Mode
To find out the interaction mode between CN– or Ni2+ and DK, the Job’s plot, 1H NMR titration, IR, ESI-MS, and SEM were employed. Through the continuous variation method, the stoichiometric ratio between CN– or Ni2+ and DK was established. From the Job’s plot, it is evident that the ratio between CN– and DK was 1:1, whereas the ratio between Ni2+ and DK was 1:2 (Figures S6 and S7, Supporting Information). The consequences were consistent with the molar ratio method (Figures S8 and S9, Supporting Information). It is important that the stoichiometric ratio between them was also supported by ESI-MS. In ESI-MS, a new peak emerged at m/z 269.0493 after CN– was added into the DK solution, which was assigned to [DK–CN– + H+] (calculated for C13H9N4OS, 269.0492, Figure S10, Supporting Information). When Ni2+ was added into the solution of DK, a new peak also emerged at m/z 699.0129 attributed to [DK + 2Ni2+ + 2NO3– + H+]+ (calculated for C24H19N8NiO8S2, 699.0115, Figure S11, Supporting Information). The above data approved of the stoichiometric ratio between them.
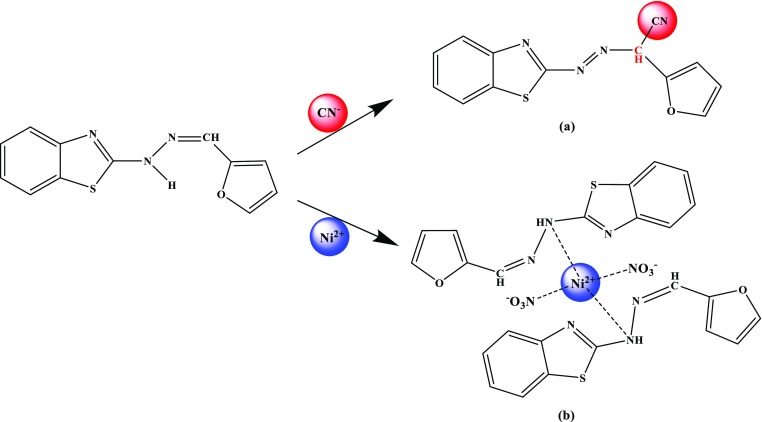
To understand the binding sites between them further, 1H NMR titrations were performed in dimethyl sulfoxide (DMSO)-d6 (Figure S12, Supporting Information). It is apparent from the 1H NMR spectrum that the −NH– signal (Ha) at 12.20 ppm completely disappeared. At the same time, the −N=CH– signal (Hb) at 8.02 ppm reduced slowly and moved to the upfield by degrees. Because the addition reaction happened between DK and CN–, a new signal (Hc) appeared at 5.58 ppm, which was assigned to–CH–CN (Scheme 2).30−32 According to Figure S12b (Supporting Information), it is found that the signal assigned to–NH– (Ha′) at 12.20 ppm decreased, which indicated that DK was involved in binding with Ni2+ by the hydrogen atom in–NH– (Scheme 2). It is interesting that the binding sites based on 1H NMR titrations were also backed up by IR.
Scheme 2. Proposed Sensing Mechanism: (a) DK for CN–; (b) DK for Ni2+.
From the IR spectra, it is distinct that the stretching vibration band of −NH (3414.77 cm–1) disappeared with the addition of CN– (Figure S13, Supporting Information), where two new stretching vibration peaks appearing at 2962.04 and 2865.89 cm–1 correspond to the saturated hydrocarbon.32 At the same time, a new stretching vibration peak at 2144.39 cm–1appears, which was assigned to the −CN group.33 Once Ni2+ was added (Figure S14, Supporting Information), the stretching vibration band of −NH shifted from 3414.77 to 3404.17 cm–1, and a new stretching vibration absorption peak appeared at 1382 cm–1, which was assigned to NO3–. Hence, it is concluded that the addition reaction of DK with CN– happened in the ratio of 1:1 (Scheme 2), and DK could complex with Ni2+ through the hydrogen atom in–NH– in the ratio of 2:1 (Scheme 2).
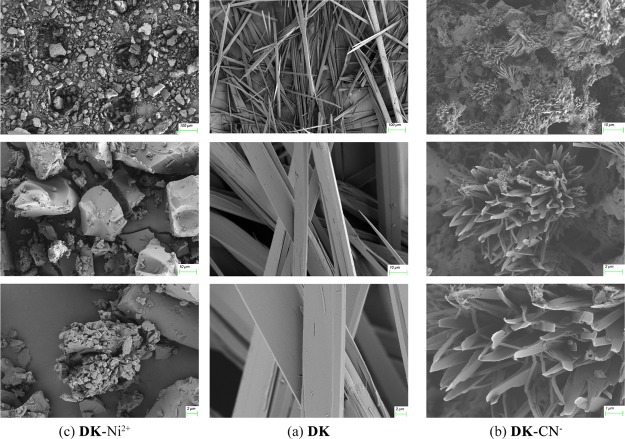
In addition, the aggregation state of DK was researched by the use of SEM. After CN– was added, the DK aggregation changed evidently from “branch shape” aggregation to “coral” structure (Figure 4a,b), and the DK aggregate changed to “block stone” when Ni2+ was added (Figure 4c).
Figure 4.
SEM image of (a) DK; (b) DK–CN–; (c) DK–Ni2+.
Besides, the LODs of DK toward CN– and Ni2+ were calculated to be 1.7 × 10⁻⁸ and 7.4 × 10⁻⁹ M on the basis of 3σ/s, respectively (Figures S15 and S16, Supporting Information), which were both much lower than the standards in the WHO guidelines and in some chemosensors reported previously (Table S1, Supporting Information).7,34
Theory Computations
To compare the change of the energy gap before or after DK interacted with CN– or Ni2+, DFT calculations were performed. According to Figure 5, it is definite that the electron density was spread on the whole skeleton of DK and DK–CN– in the highest occupied molecular orbital (HOMO), and the electron density in the lowest unoccupied molecular orbital (LUMO) was located within the −N=N– and −CN moiety after the addition reaction between DK and CN–. It exhibited that the energy gap (ΔE) between the HOMO and LUMO changed from 4.0307 eV for DK to 3.6787 eV for DK–CN.33 Besides, it was distinct that the electron density in the LUMO was mainly distributed between DK and Ni2+, where ΔE was reduced to 3.0460 eV. The results also maintained the interaction mode between DK and CN– or Ni2+ (Scheme 2).
Figure 5.
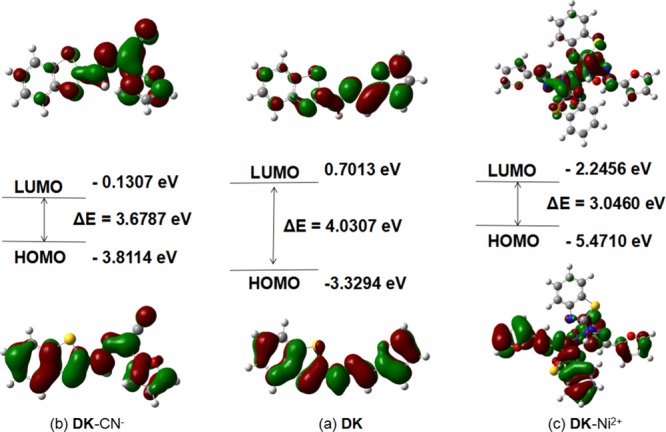
DFT calculations: (a) DK; (b) DK–CN–; (c) DK–Ni2+.
Practical Application
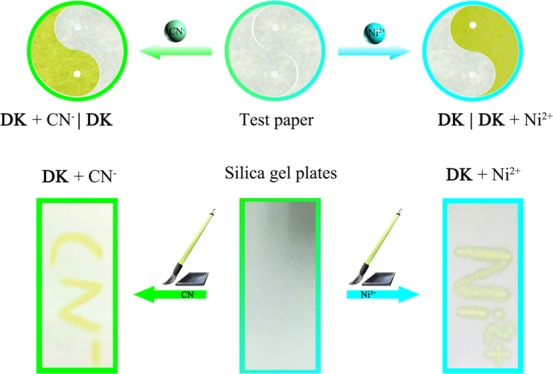
In order to investigate the practical application, test paper and silica gel plates were made from chemosensor DK. The test paper was spliced into the “Taiji diagram,” where the two halves of the “Yin” and “Yang” changed from colorless to yellow when the test paper was dipped in the solution of CN– or Ni2+ separately. Additionally, silica gel plates where DK was loaded displayed the image of “CN–” or “Ni2+” when “CN–” or “Ni2+” was written on a silica gel plate (Figure 6). It hinted that the chemosensor DK showed certain application prospects in identifying CN– and Ni2+ qualitatively based on the test paper and silica gel plates.
Figure 6.
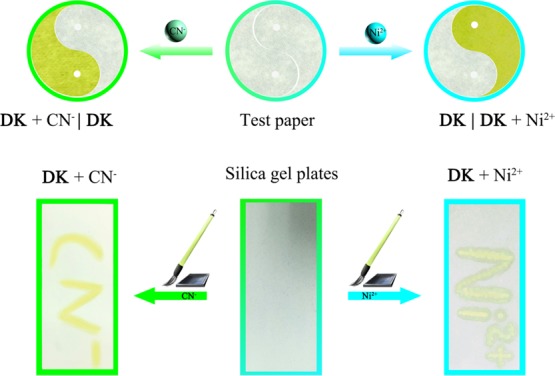
Color changes of DK–based test paper after addition of CN– and Ni2+ solutions. Photos of the silica gel plates loaded with DK were utilized to sense CN– and Ni2+ in aqueous solutions.
Because of its high toxicity, the manufacturing process of the test paper was changed a little to check CN– in tap water. The test paper was dried in air at room temperature after they were obtained by dipping a filter paper in 1.0 × 10⁻³ M solution of DK in N-(2-hydroxyethyl)piperazine-N′-ethanesulfonic acid (HEPES) buffer/CH3CN (0.01 M, pH = 7.3, v/v = 1:9) solution for 24 h. Then, the dried test paper was immersed in 50 mL of distilled water, the solutions of CN– (1 × 10⁻³ M) in tap water, and tap water for 5 s separately. When they were took out, it was found that only CN– induced the color change of the test paper, which was immediately observed by the naked eye (Figure S17, Supporting Information). The other test papers did not show significant color change (Figure S17, Supporting Information).
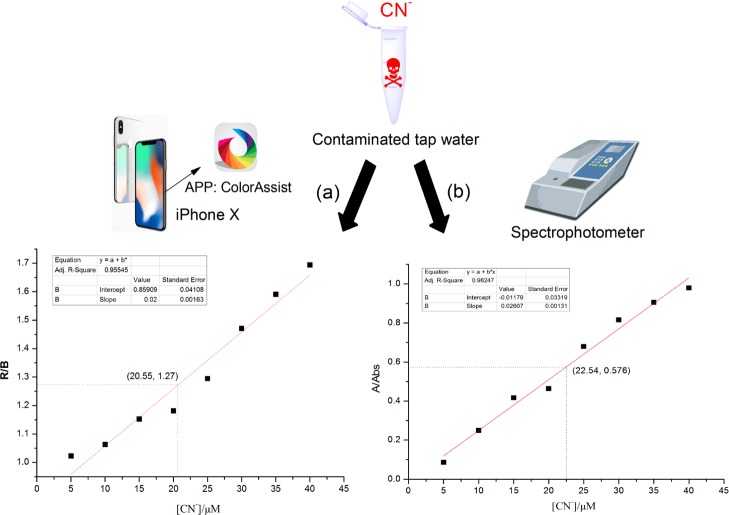
In order to realize the quantitative detection of CN– in water rapidly and on-site, the widespread use of smartphones has caught our attention.35,36 Based on the good naked-eye recognition properties of DK toward CN–, color assist (a mobile APP) has been used to determine the color changes in the RGB (red, green, blue) values of DK solutions. As displayed in Figure 7a, the R/B (red/blue) ratios for DK were plotted against the different concentrations of CN–, and the curve revealed good linearity ranges (R2 = 0.95545). To verify the accuracy of the method, the tap water contaminated with CN– was tested quantitatively by a smartphone and an ultraviolet–visible (UV–vis) spectrophotometer separately. As a result, the R/B value of the contaminated tap water obtained by the smartphone was 1.27, and the concentration of CN– was 20.55 μM according to the corresponding curve (Figure 7a). The concentration of CN– obtained by the spectroscopic instrument was 22.54 μM (Figure 7b). To our surprise, the concentration error between the two methods was only 8.83%. It implied that DK could detect CN– in water quantitatively, rapidly, and on-site. All data indicated that DK could provide low-cost, convenient, and on-the-spot approaches for qualitative and quantitative detection of CN– in water using a test paper and a smartphone APP.
Figure 7.
(a) Smartphone-assisted RGB responses for the determination of CN–. (b) Spectrophotometer for the determination of CN–.
Conclusions
It is clear that DK could detect CN– effectively. No other anions have any effect on the detection of DK toward CN–. When DK identified CN– from other anions, the color changes of the solution were detected directly by the naked eye immediately. It is interesting that DK could also discriminate Ni2+ from other cations. The LOD of DK toward CN– and Ni2+ was calculated to be 1.7 × 10⁻⁸ or 7.4×10⁻⁹ M, respectively. The mode of action between DK and CN– was different from that between DK and Ni2+, which was confirmed by the Job’s plot, 1H NMR titration, IR, ESI-MS, SEM analysis, and DFT calculation methods. Moreover, the goal of qualitative and quantitative detection of CN– in tap water was achieved by a test paper and a smartphone APP. All results implied that DK might have certain prospects for practical application to identify CN– in water.
Experimental Section
Materials and Instrumentation
UV–vis spectra was obtained on a Shimadzu UV-1601 spectrophotometer. NMR spectra were recorded on a Bruker-AV-500 NMR, spectrometer, and the chemical shifts are expressed in δ ppm. Mass spectra were measured by an Agilent 6210 ESI/TOF MS instrument. SEM measurements were obtained on a Carl Zeiss Sigma 500 microscope. IR spectroscopy was performed on a Digilab FTS-3000 Fourier transform infrared (FTIR) spectrophotometer. All spectroscopy were carried out in HEPES buffer/CH3CN (0.01 M, pH = 7.3, v/v = 1:9) solution, with different equivalent anions (F–, Cl–, Br–, I–, SO42–, SO32–, S2–, NO3–, NO2–, PO43–, CO32–, HCO3–, AcO–, EDTA, H2PO4–, and CN–) or metal ions (K+, Na+, Ag+, Cu2+, Co2+, Ca2+, Cd2+, Mg2+, Ba2+, Pb2+, Sr2+, Fe2+, Ni2+, Zn2+, Mn2+, Hg2+, Al3+, Y3+, Ce3+, and Fe3+) added into DK while keeping the chemosensor DK concentration constant (1.0 × 10⁻⁵ M) in all experiments. Tetrabutyl ammonium salt was used for CN–. The solutions of other anions were prepared from their sodium or potassium salts. Solutions of metal ions were prepared from their nitrates. The detection limits for ions were determined by titrations, and it was calculated on the basis of 3σ/s method. All chemicals used for the synthesis were procured from commercial suppliers, and all solvents were used without further purification. Analysis of the orbital distributions of the LUMO and HOMO energies were calculated by DFT/B3LYP.
NMR Titration Procedure
DK (15 mg) was dissolved in DMSO-d6 (0.5 mL), and then a series of different equivalents of CN– (0, 0.3, 0.5, 1.0, and 1.5 equiv.) and Ni2+ (0, 0.15, 0.25, 0.5, and 0.75 equiv) were added into the solution of DK, and their 1H NMR spectra were recorded on a Bruker-AV-400 NMR spectrometer.
Study of FTIR Spectroscopy
The solid powders of DK, DK–CN–, and DK–Ni2+ were prepared. All samples were mixed well evenly with KBr to create a compact pellet for the FTIR detection.
SEM Images
Samples of DK, DK–CN–, and DK–Ni2+ were dissolved in CH3CN. They were left to evaporate and dry at room temperature. A SEM sample was fabricated by spreading the solid powder on a conductive plastic. Then, gold powder was sprayed on the sample after the detection system was vacuumized. Then, the surface was imaged using the SEM technique.
Test Paper and Silica Gel Plate Preparation
The test paper and silica gel plate were immersed into the solution of DK (1 × 10⁻⁴ M), and then it was dried at room temperature. The solution of CN– and Ni2+ was added on the test paper. The words were written on the silica gel plates using a brush dipped in a solution of CN– and Ni2+ separately.
Synthesis of DK
2-Hydrazineylbenzo[d]thiazole (165.21 mg, 1.0 mmol) and furan-2-carbaldehyde (96.09 mg, 1.0 mmol) were dissolved in 25 mL of ethanol (Scheme 1). The solution was refluxed for 12 h with stirring. When the mixture was cooled to room temperature, the precipitate was formed. The precipitate was recrystallized in alcohol and washed by alcohol and water. The product DK was collected and dried under vacuum. Yield 78%, 1H NMR (500 MHz, DMSO-d6): δ 12.19 (s, 1H), 8.03 (s, 1H), 7.84 (s, 1H), 7.75 (d, J = 7.3 Hz, 1H), 7.41 (s, 1H), 7.30 (t, J = 7.4 Hz, 1H), 7.11 (t, J = 7.4 Hz, 1H), 6.86 (d, J = 2.6 Hz, 1H), 6.63 (s, 1H) (Figure S1, Supporting Information). 13C NMR (100 MHz, DMSO-d6): δ 166.74, 149.38, 144.73, 125.94, 121.53, 112.69, 112.08 (Figure S2, Supporting Information). HRMS (ESI) m/z: [M + Na+]+ calcd for C12H9N3NaOS+, 266.0359; found, 266.0359 (Figure S3, Supporting Information).
Acknowledgments
This work was supported by the National Natural Science Foundation of China (21302019), the Youth Project of the Provincial Natural Science Foundation of Anhui (1908085QB78), the Key Projects of Natural Science Research of Anhui Province Colleges and Universities (KJ2019ZD38), the Key Projects of Support Program for Outstanding Young Talents in Anhui Province Colleges and Universities (gxyqZD2016068), the Key Program for Young Talents of Fuyang Normal University (rcxm201902), the Key Natural Science Research Projects of Fuyang Normal University (2018FSKJ09ZD), the National Undergraduate Training Programs for Innovation and Entrepreneurship (no. 201910371007), and the Horizontal Cooperation Project of Fuyang Municipal Government and Fuyang Normal University (XDHX201730 and XDHX201731).
Supporting Information Available
The Supporting Information is available free of charge at https://pubs.acs.org/doi/10.1021/acsomega.0c00021.
Characterization of chemosensor DK, ESI-MS spectrum, interference experiment, absorption, fluorescence spectra, and Job’s plot, 1H NMR titration spectra, FTIR spectra, comparison of the reported chemosensors with DK, detection limits, and testing tap water with a test paper (PDF)
The authors declare no competing financial interest.
Supplementary Material
References
- Koenig R. ENVIRONMENTAL DISASTERS: Wildlife Deaths Are a Grim Wake-Up Call in Eastern Europe. Science 2000, 287, 1737–1738. 10.1126/science.287.5459.1737. [DOI] [PubMed] [Google Scholar]
- Xu Z.; Chen X.; Kim H. N.; Yoon J. Sensors for the optical detection of cyanide ion. Chem. Soc. Rev. 2010, 39, 127–137. 10.1039/b907368j. [DOI] [PubMed] [Google Scholar]
- Dvivedi A.; Kumar S.; Ravikanth M. Nucleophilic addition of CN– ion to CN bond of aza-BODIPY leading to turn-on fluorescence sensor. Sens. Actuators, B 2016, 224, 364–371. 10.1016/j.snb.2015.10.045. [DOI] [Google Scholar]
- Wang S.-T.; Sie Y.-W.; Wan C.-F.; Wu A.-T. A reaction-based fluorescent sensor for detection of cyanide in aqueous media. J. Lumin. 2016, 173, 25–29. 10.1016/j.jlumin.2015.12.041. [DOI] [Google Scholar]
- Wang F.; Wang L.; Chen X.; Yoon J. Recent progress in the development of fluorometric and colorimetric chemosensors for detection of cyanide ions. Chem. Soc. Rev. 2014, 43, 4312–4324. 10.1039/c4cs00008k. [DOI] [PubMed] [Google Scholar]
- Huang X.; Gu X.; Zhang G.; Zhang D. A highly selective fluorescence turn-on detection of cyanide based on the aggregation of tetraphenylethylene molecules induced by chemical reaction. Chem. Commun. 2012, 48, 12195–12197. 10.1039/c2cc37094h. [DOI] [PubMed] [Google Scholar]
- Amhed F.; Chorus I.; Cotruvo J.; Cunliffe D.; Endo T.; Fawell J. K.; Howard G.; Jackson P.; Kumar S.; Kunikane S.; Magara Y.; Ohanian E.; Ong C. N.; Schmoll O.. Guidelines for Drinking-Water Quality, 3rd ed.; World Health Organization: Geneva, Switzerland, 2004. [Google Scholar]
- Wang S.; Ma L.; Liu G.; Pu S. Diarylethene-based fluorescent and colorimetric chemosensor for the selective detection of Al3+ and CN–. Dyes Pigm. 2019, 164, 257–266. 10.1016/j.dyepig.2019.01.029. [DOI] [Google Scholar]
- Padhan S. K.; Podh M. B.; Sahu P. K.; Sahu S. N. Optical discrimination of fluoride and cyanide ions by coumarin-salicylidene based chromofluorescent probes in organic and aqueous medium. Sens. Actuators, B 2018, 255, 1376–1390. 10.1016/j.snb.2017.08.133. [DOI] [Google Scholar]
- Salomón-Flores M. K.; Bazany-Rodríguez I. J.; Martínez-Otero D.; García-Eleno M. A.; Guerra-García J. J.; Morales-Morales D.; Dorazco-González A. Bifunctional colorimetric chemosensing of fluoride and cyanide ions by nickel-POCOP pincer receptors. Dalton Trans. 2017, 46, 4950–4959. 10.1039/c6dt04897h. [DOI] [PubMed] [Google Scholar]
- Lohar S.; Dhara K.; Roy P.; Sinha Babu S. P.; Chattopadhyay P. Highly Sensitive Ratiometric Chemosensor and Biomarker for Cyanide Ions in the Aqueous Medium. ACS Omega 2018, 3, 10145–10153. 10.1021/acsomega.8b01035. [DOI] [PMC free article] [PubMed] [Google Scholar]
- Wu C.; Wang J.; Shen J.; Zhang C.; Wu Z.; Zhou H. A colorimetric quinoline-based chemosensor for sequential detection of copper ion and cyanide anions. Tetrahedron 2017, 73, 5715–5719. 10.1016/j.tet.2017.08.010. [DOI] [Google Scholar]
- Li J.; Wei W.; Qi X.; Zuo G.; Fang J.; Dong W. Highly selective colorimetric/fluorometric dual-channel sensor for cyanide based on ICT off in aqueous solution. Sens. Actuators, B 2016, 228, 330–334. 10.1016/j.snb.2016.01.055. [DOI] [Google Scholar]
- Gupta N.; Singhal D.; Singh A. K. Highly selective colorimetric and reversible fluorometric turn-off sensors based on the pyrimidine derivative: mimicking logic gate operation and potential applications. New J. Chem. 2016, 40, 641–650. 10.1039/c5nj02118a. [DOI] [Google Scholar]
- Li H.; Zhang S.-J.; Gong C.-L.; Li Y.-F.; Liang Y.; Qi Z.-G.; Chen S. Highly sensitive and selective fluorescent chemosensor for Ni2+ based on a new poly(arylene ether);with terpyridine substiuent groups. Analyst 2013, 138, 7090–7093. 10.1039/c3an01162c. [DOI] [PubMed] [Google Scholar]
- Wang L.; Yu M.; Liu Z.; Zhao W.; Li Z.; Ni Z.; Li C.; Wei L. A visible light excitable “on-off” and “green-red” fluorescent chemodosimeter for Ni2+/Pb2+. New J. Chem. 2012, 36, 2176–2179. 10.1039/c2nj40597k. [DOI] [Google Scholar]
- Annaraj B.; Mitu L.; Neelakantan M. A. Synthesis and crystal structure of imidazole containing amide as a turn on fluorescent probe for nickel ion in aqueous media, An experimental and theoretical investigation. J. Mol. Struct. 2016, 1104, 1–6. 10.1016/j.molstruc.2015.10.002. [DOI] [Google Scholar]
- Zhao B.; Xu Y.; Deng Q.; Kan W.; Fang Y.; Wang L.; Gao Y. Modified 1H-phenanthro [9 10-d] imidazole derivative with the double acetohydrazide as fluorescent probe for sequential detection of Ni2+ and Al3+ with ‘on-off-on’response. Tetrahedron Lett. 2016, 57, 953–958. 10.1016/j.tetlet.2016.01.065. [DOI] [Google Scholar]
- Ganjali M. R.; Hosseini M.; Motalebi M.; Sedaghat M.; Mizani F.; Faridbod F.; Norouzi P. Selective recognition of Ni2+ ion based on fluorescence enhancement chemosensor. Spectrochim. Acta, Part A 2015, 140, 283–287. 10.1016/j.saa.2014.12.042. [DOI] [PubMed] [Google Scholar]
- Lin Q.; Lu T.-T.; Zhu X.; Wei T.-B.; Li H.; Zhang Y.-M. Rationally introduce multi-competitive binding interactions in supramolecular gels: a simple and efficient approach to develop multi-analyte sensor array. Chem. Sci. 2016, 7, 5341–5346. 10.1039/c6sc00955g. [DOI] [PMC free article] [PubMed] [Google Scholar]
- Liu J.; Fan Y. Q.; Song S. S.; Gong G. F.; Wang J.; Guan X. W.; Yao H.; Zhang Y. M.; Wei T. B.; Lin Q. Aggregation-Induced Emission Supramolecular Organic Framework (AIE SOF) Gels Constructed from Supramolecular Polymer Networks Based on Tripodal Pillar [5] arene for Fluorescence Detection and Efficient Removal of Various Analytes. ACS Sustainable Chem. Eng. 2019, 7, 11999–12007. 10.1021/acssuschemeng.9b00452. [DOI] [Google Scholar]
- Liu J.; Fan Y.-Q.; Zhang Q.-P.; Yao H.; Zhang Y.-M.; Wei T.-B.; Lin Q. Super metal hydrogels constructed from a simple tripodal gelator and rare earth metal ions and its application in highly selective and ultrasensitive detection of histidine. Soft Matter 2019, 15, 999–1004. 10.1039/c8sm02319k. [DOI] [PubMed] [Google Scholar]
- Bai C.-B.; Xu P.; Zhang J.; Qiao R.; Chen M.-Y.; Mei M.-Y.; Wei B.; Wang C.; Zhang L.; Chen S.-S. Long-wavelength fluorescent chemosensors for Hg2+ based on pyrene. ACS Omega 2019, 4, 14621–14625. 10.1021/acsomega.9b02078. [DOI] [PMC free article] [PubMed] [Google Scholar]
- Manna A. K.; Mondal J.; Rout K.; Patra G. K. A benzohydrazide based two-in-one Ni2+/Cu2+ fluorescent colorimetric chemosensor and its applications in real sample analysis and molecular logic gate. Sens. Actuators, B 2018, 275, 350–358. 10.1016/j.snb.2018.08.060. [DOI] [Google Scholar]
- Dhaka G.; Kaur N.; Singh J. Spectral studies on benzimidazole-based “bare-eye” probe for the detection of Ni2+: Application as a solid state sensor. Inorg. Chim. Acta 2017, 464, 18–22. 10.1016/j.ica.2017.04.042. [DOI] [Google Scholar]
- Gupta V. K.; Singh A. K.; Kumawat L. K.; Mergu N. An easily accessible switch-on optical chemosensor for the detection of noxious metal ions Ni:II) Zn:II) Fe:III;and UO2:II). Sens. Actuators, B 2016, 222, 468–482. 10.1016/j.snb.2015.08.063. [DOI] [Google Scholar]
- Chandra R.; Ghorai A.; Patra G. K. A simple benzildihydrazone derived colorimetric and fluorescent ‘on-off-on’ sensor for sequential detection of copper(II;and cyanide ions in aqueous solution. Sens. Actuators, B 2018, 255, 701–711. 10.1016/j.snb.2017.08.067. [DOI] [Google Scholar]
- Shahid M.; Chawla H. M.; Bhatia P. A calix[4]arene based turn off/turn on molecular receptor for Cu2+ and CN- ions in aqueous medium. Sens. Actuators, B 2016, 237, 470–478. 10.1016/j.snb.2016.06.102. [DOI] [Google Scholar]
- Hu Z.-Q.; Du M.; Zhang L.-F.; Guo F.-Y.; Liu M.-D.; Li M. A novel colorimetric and fluorescent chemosensor for cyanide ion in aqueous media based on a rhodamine derivative in the presence of Fe3+ ion. Sens. Actuators, B 2014, 192, 439–443. 10.1016/j.snb.2013.10.138. [DOI] [Google Scholar]
- Deng K.; Wang L.; Xia Q.; Liu R.; Qu J. A turn-on fluorescent chemosensor based on aggregation-induced emission for cyanide detection and its bioimaging applications. Sens. Actuators, B 2019, 296, 126645–126652. 10.1016/j.snb.2019.126645. [DOI] [Google Scholar]
- Suganya S.; Ravindran E.; Mahato M. K.; Prasad E. Orange emitting fluorescence probe for the selective detection of cyanide ion in solution and solid states. Sens. Actuators, B 2019, 291, 426–432. 10.1016/j.snb.2019.04.066. [DOI] [Google Scholar]
- Niu Q.; Lan L.; Li T.; Guo Z.; Jiang T.; Zhao Z.; Feng Z.; Xi J. A highly selective turn-on fluorescent and naked-eye colorimetric sensor for cyanide detection in food samples and its application in imaging of living cells. Sens. Actuators, B 2018, 276, 13–22. 10.1016/j.snb.2018.08.066. [DOI] [Google Scholar]
- Yang H.-L.; Dang Z.-J.; Zhang Y.-M.; Wei T.-B.; Yao H.; Zhu W.; Fan Y.-Q.; Jiang X.-M.; Lin Q. Novel cyanide supramolecular fluorescent chemosensor constructed from a quinoline hydrazone functionalized-pillar [5] arene. Spectrochim. Acta, Part A 2019, 220, 117136–117142. 10.1016/j.saa.2019.117136. [DOI] [PubMed] [Google Scholar]
- Zhu Y.; Wang Z.; Yang J.; Xu X.; Wang S.; Cai Z.; Xu H. N,N-Bis:2-pyridylmethyl; amine-based truxene derivative as a highly sensitive fluorescence sensor for Cu2+ and Ni2+ ion. Chin. J. Org. Chem. 2019, 39, 427–433. 10.6023/cjoc201807042. [DOI] [Google Scholar]
- Erdemir S.; Malkondu S. On-site and low-cost detection of cyanide by simple colorimetric and fluorogenic sensors: Smartphone and test strip applications. Talanta 2020, 207, 120278–120286. 10.1016/j.talanta.2019.120278. [DOI] [PubMed] [Google Scholar]
- Upadhyay Y.; Bothra S.; Kumar R.; Sahoo S. K. Smartphone-assisted colorimetric detection of Cr3+ using vitamin B-6 cofactor functionalized gold nanoparticles and its applications in real sample analyses. ChemistrySelect 2018, 3, 6892–6896. 10.1002/slct.201801289. [DOI] [Google Scholar]
Associated Data
This section collects any data citations, data availability statements, or supplementary materials included in this article.


