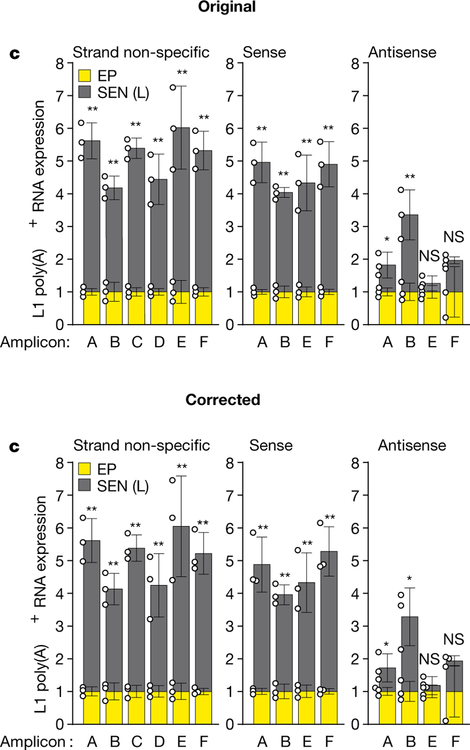
In this Article, owing to a conceptual error, some of the data points shown in the graphs corresponded to the means ±1 standard deviation, rather than the actual data points. The figure panels affected are: Fig. 1c, d; Fig. 2a–g; Fig. 3b–f; Extended Data Fig. 1b–e, i–k; Extended Data Fig. 4a–c, e–i; Extended Data Fig. 5a–g, i–l; Extended Data Fig. 6a, b, e–h; and Extended Data Fig. 7a–g. To correct this we have extracted the original data from the original experiments from our notebooks. We generated new graphs from the data, which now include all the original data points. Standard deviations in these panels were previously calculated using the ‘n’ method (‘STDEV.P’ in Microsoft Excel) but we believe the ‘n − 1’ method is more appropriate (‘STDEV.S’ in Microsoft Excel) and the standard deviations were recalculated accordingly. All affected figures have been corrected online and the corresponding Source Data files have been updated. In addition, in the Source Data for Fig. 2h, owing to a software error, some of the data in columns ‘CTRL A’, CTRL B’ and ‘CTRL C’ were duplicated and this error has also been corrected online. Figure 1 of this Amendment shows the original and corrected Fig. 1c, as an example of the systematic error. The Supplementary Information of this Amendment shows all of the affected figure panels, as originally published and as corrected. We sincerely regret these errors. These corrections do not affect any of the experimental results, their interpretation or the conclusions of the paper.
Fig. 1 |.
This is the corrected Fig. 1c and the incorrect published Fig. 1c of the original Article, as an example of the systematic error that occurs in several of the other figures (see the Supplementary Information of this Amendment).
Supplementary Material
Footnotes
Supplementary Information is available in the online version of the Author Correction.
Associated Data
This section collects any data citations, data availability statements, or supplementary materials included in this article.


