Abstract
Salt stress is an important adverse condition encountered during plant and microbe growth in terrestrial soil ecosystems. Currently, how ice plant (Mesembryanthemum crystallinum) growth-promoting endophytic bacteria (EB) cope with salt stress and regulate growth and the genes responsible for salt tolerance remain unknown. We applied RNA-Seq technology to determine the growth mechanism of the EB Halomonas sp. MC1 strain and the genes involved in salt tolerance. A total of 893 genes were significantly regulated after salt treatment. These genes included 401 upregulated and 492 downregulated genes. Gene Ontology enrichment and Kyoto Encyclopedia of Genes and Genomes analysis revealed that the most enriched genes included those related to the outer membrane-bounded periplasmic space, ATPase activity, catabolic process, and proton transmembrane transport. The quantitative real-time polymerase chain reaction data were similar to those obtained from RNA-Seq. The MC1 strain maintained survival under salt stress by regulating cellular and metabolic processes and pyruvate metabolism pathways such as organic and carboxylic acid catabolic pathways. We highlighted the response mechanism of Halomonas sp. MC1 to fully understand the dynamics of complex salt–microbe interactions.
Keywords: bacterial growth, endophytes, Halomonas sp., salt stress, transcriptome analysis
1. Introduction
Abiotic environmental factors considerably affect microbial growth and play a vital role in plant growth and productivity [1]. The salinity of arable lands under field and greenhouse conditions has become a major problem in agricultural production [2]. Salinity has become a major environmental stress factor because it not only limits plant growth, but also microbial survival [3]. Various strategies have been developed to decrease the toxic effects of salt on plant or bacteria growth. At present, plant growth-promoting bacterial endophytes colonize host plant tissues without causing disease symptoms by interacting with host plants, enhancing salt stress tolerance [4]. Plants form a symbiotic relationship with endophytic bacteria (EB) throughout their growth and development. This relationship benefits plants in terms of salt stress damage or pathogen invasion as well as sustained plant growth in harsh environments [5]. For instance, inoculating crop seeds and seedlings with EB is an unconventional approach to alleviate salt stress, and thus supports plant growth [6,7,8]. Although the beneficial effects of EB on salinized plants have been well studied, most of the underlying physiological and molecular mechanisms and gene expression levels need to be identified to optimize the applications of EB in agricultural production.
Beneficial EB colonize the rhizosphere/endorhizosphere of plants and promote growth; they have been discovered in many plant species and can be isolated from sorghum, soybean, and native perennial plants [9], suggesting that EB can be a promising alternative to alleviate the toxic effects of salinity. However, entry for endophytes may occur in various plant regions, especially the root zone [10,11,12,13]. Thus, beneficial EB are potential resources for reducing the negative effects of salinization. Many studies have focused on the species of EB including Bacillus, Enterobacter, Klebsiella, Pseudomonas, and Xanthomonas [9]. The recent availability of the genome sequences of important EB has provided new insights into the molecular pathways involved in plant–endophyte symbiosis [14] and led to a new understanding of the adaptation of EB to salt stress [15,16,17]. The analysis of novel gene responses of EB may provide a potential method to cope with salinity. EB can enhance Arabidopsis thaliana growth under salt stress and can tolerate high salt concentrations and show a potential competitive advantage of surviving in saline soils [18,19]. The complete genome sequence of the endophyte Bacillus flexus helps in revealing the plant growth-promoting mechanism of EB [20]. However, limited studies have focused on the EB genes involved in salt stress response. A mechanistic understanding of how EB improves plant growth at morphological, growth, and molecular levels is vital for EB application [21,22,23] and could help in identifying useful EB that can protect plants against salt stress.
Ice plants (Mesembryanthemum crystallinum) display remarkable tolerance to diverse abiotic stresses, especially salt stress, and they are consumed as vegetables [24,25]. Various EB were obtained from this plant in our previous work. In this study, we selected MC1, a Halomonas sp. strain that has been identified as an endophytic nitrogen-fixing bacterium. This strain exhibits NaCl tolerance and plant growth-promoting traits [26]. However, the molecular mechanism of MC1’s response to salt stress at the genetic level remains unclear. Therefore, the current study investigated the transcriptomes of Halomonas sp. MC1 under salt stress through high-throughput sequencing to elucidate the genes involved in salt tolerance. Notably, we expanded the current knowledge by providing new information on the bacteria involved in salt resistance.
2. Materials and Methods
2.1. Strain and Culture Condition
Halomonas sp. strain MC1 (GenBank accession number: MF431770; Transcriptome number: SRP235179) was isolated from the interior stem of ice plants and verified as a bacterial endophyte. The strain shows plant growth-promoting effects and improved growth of cabbage seedlings under salt stress [26]. MC1 was cultivated on nutrient solid agar plates (5.0 g/L yeast extract, 10.0 g/L peptone, and 15.0 g agar at pH 6.9–7.1) containing 1.71 M NaCl at 25 °C ± 2 °C for five days. Fresh cells were stored with 40% glycerol at −80°C until further analysis.
2.2. Induction of Salt Tolerance and Bacterial Collection
The salt-resistance activity of MC1 was determined in an activated bacterial culture grown in solid medium with (1.71 M NaCl) or without (CK, 0 M NaCl) salt. The concentration of NaCl was determined based on the optimal growth condition of strain MC1 [26]. Bacterial concentration was adjusted to 108 CFU/mL. The bacteria were grown in two kinds of cultures for three days at 25 °C, and the bacterial growth cultures were collected. The cultured bacteria were transferred to test tubes, frozen with liquid nitrogen, and stored at −80 °C until further analyses. All treatments were performed in triplicate.
2.3. RNA Extraction, Library Construction, and Sequencing
Total RNA was extracted from the bacterial cultures by using TRIzol® Reagent (Invitrogen) in accordance with the manufacturer’s instructions. Genomic DNA was removed using DNase I (TaKara, Dalian, China). Then, RNA quality was determined with a NanoDrop 2000 spectrophotometer (Thermo Fisher Scientific, Waltham, MA, USA). A high-quality RNA sample (8 µg, optical density (OD)260/280 = 1.8–2.2; OD260/230 ≥ 2.0) was used to construct the sequencing library. All experimental and control treatments were performed with three biological replicates per group. The RNA was fragmented into small pieces and used as a template for cDNA synthesis according to the TruSeq RNA preparation kit from Illumina (San Diego, CA, USA). Apolymerase chain reaction (PCR) solution containing a mixture of dATP, dGTP, dCTP, and dUTP was used, and the reaction condition was set at 16 °C for 1 h. In brief, libraries were size-selected for cDNA target fragments of 200–300 bp on 2% low-range ultra-agarose, followed by PCR amplification using Phusion DNA polymerase (NEB). After quantification with TBS380, the paired-end libraries were sequenced by Shanghai Biozeron Biothchology Co. Ltd. (Shanghai, China) with an Illumina HiSeq PE 2 × 151 bp read length.
2.4. Quality Control and Mapping of Reads
The raw paired-end reads were subjected to quality control by using Trimmomatic with default parameters (Available online: http://www.usadellab.org/cms/uploads/supplementary/Trimmomatic). Then, the clean reads were separately aligned to the reference genome in orientation mode using Rockhopper (Available online: http://cs.wellesley.edu/~btjaden/Rockhopper/) software. We used the Rockhopper system for the computational analysis of bacterial RNA-Seq data due to its comprehensive and user-friendly properties [27]. Rockhopper uses RNA sequencing reads generated by high-throughput sequencing technology as the input. This software was used to calculate the gene expression levels under the default parameters. Raw reads such as those containing adapters, more than 10% unknown nucleotide content, and more than 50% low-quality base content were removed to obtain high-quality clean reads.
2.5. Transcriptome De Novo Assembly and Annotation
The clean reads were obtained and selected from the raw data by filtering out adaptors and low-quality (Q ≤ 20) reads by following criteria: shorter than 75 bp, N-base ratio over 10%, or mismatch/adapter sequences. De novo assembly was performed to generate transcriptsby using the trinity method [28]. The resulting unigenes were used for BLAST searches in databases such as the National Center for Biotechnology Information (NCBI) (Available online: http://www.ncbi.nlm.nih.gov/), Swissprot (Available online: http://www.expasy.ch/sprot/), and Kyoto Encyclopedia of Genes and Genomes (KEGG) (Available online: http://www.genome.jp/kegg/). Gene Ontology (GO) annotation was conducted with the Blast GO program to classify the unigenes [29]. All the unigenes were uploaded to the KEGG metabolic pathway database for pathway assignment [30,31].
2.6. Differential Expression Analysis and Functional Enrichment
The gene expression level was calculated using the fragments per kilobase of read per million mapped reads method to identify the differentially expressed genes (DEGs) between samples under two treatments. EdgeR (Available online: https://bioconductor.org/packages/release/bioc/html/edgeR.html) was used for differential expression analysis. The following criteria were selected to identify DEGs: (i) a logarithmic of fold change greater than 2 and (ii) a false discovery rate of less than 0.05. GO functional enrichment and KEGG pathway analyses were performed with Goatools (Available online: https://github.com/tanghaibao/Goatools) and KOBAS (Available online: http://kobas.cbi.pku.edu.cn/home.do), respectively, to understand the functions of the DEGs. The DEGs were considered significantly enriched in GO terms and metabolic pathways in accordance with the reported method under multiple test corrections [32] when their corrected p-value was less than 0.05 using Fisher’s test. In order to improve statistical significance, the q-value was used to estimate the false discovery rate (FDR). The MC1 nucleotide sequences of the 16S rDNA were subjected to BLAST analysis with the NCBI database (Available online: http://blast.ncbi.nlm.nih.gov/Blast.cgi), and sequences with high similarity scores were selected and downloaded. A phylogenetic tree of the MC1 strain was constructed using MEGA 6.0 by using neighbor-joining analysis. The gene circle of MC1 was mapped with Circos v0.64 (Available online: http://circos.ca/).
2.7. Quantitative Real-Time Polymerase Chain Reaction (qRT-PCR) Validation
Given the large number of DEGs in this work, six DEGs were selected for qRT-PCR analyses to determine whether the gene expressions were consistent with the RNA-Seq results. The primers used were designed with Primer 5.0 (Table S1). Total RNA was isolated using the Tiangen (Biotech Co. Ltd., Beijing, China) reagent in accordance with the manufacturer’s protocol, and RNA was utilized for cDNA synthesis using reverse transcriptase. Three technical replicates for each sample were conducted in qPCR runs. The 16S rRNA gene of Halomonas sp. was used as the control gene. The Fast Real-time PCR System (Applied Biosystems, Foster, CA, USA) was used to perform qRT-PCR.
2.8. Statistical Analysis
The data were collected, and mean analysis was conducted using EXCEL. The data were also analyzed via one-way analysis of variance (Fisher’s least significant difference (LSD) test), and the means were separated through Fisher’s protected LSD test using the SPSS package (version 19.0). Differences obtained at the p ≤ 0.05 level were considered significant.
3. Results
3.1. Data Processing and Analysis
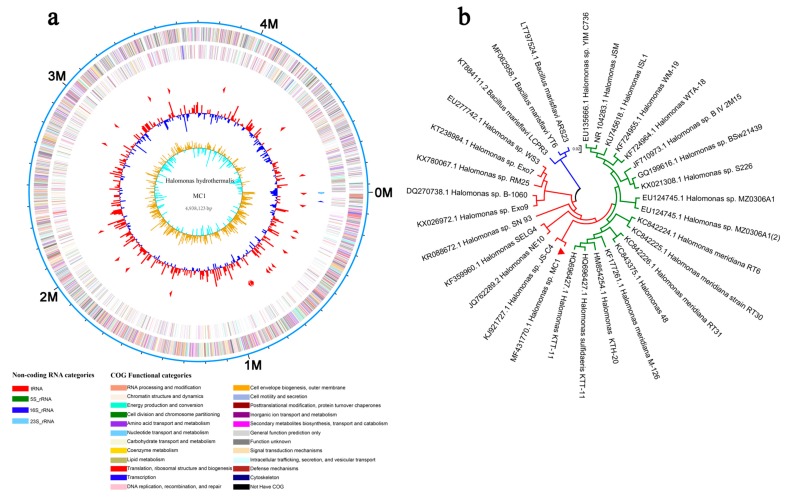
The number of raw reads obtained in this experiment ranged from 13,471,728 to 16,857,140. The Q30 (percentage of reads with lengths exceeding 30 bp in the total bases) of MC1 exceeded 90%. The clean reads and bases ranged from 11,691,054 to 14,554,380 bp and from 1,726,157,998 to 2,094,489,027 bp, respectively. The mapped rate reached the maximum of 93.13% after filtering out the contaminated and low-quality sequences (Table 1). The Q30 of clean reads exceeded 93.00%. The error was less than 0.02%. The sequences were subsequently visualized using a genome browser (Figure 1a). The nucleotide sequences of the MC1 16S rDNA were subjected to BLAST analysis, and a phylogenetic tree of MC1 was constructed on the basis of the 16S rDNA sequences using neighbor-joining analysis (Figure 1b). This strain is determined as closely related to the genus Halomonas sp.
Table 1.
Summary of the transcriptome assembly of strain MC1. Control (CK 0M) and salt-treated (1.7 M) raw read filters.
| Sample | Raw Reads | Raw Bases | %≥Q30 | Clean Reads | Clean Bases | Mapped-Reads | Mapped Rate (%) | GC(%) | %≥Q30 | Error(%) |
|---|---|---|---|---|---|---|---|---|---|---|
| MC1-CK-1 | 13,471,728 | 2,020,759,200 | 91.21 | 11,691,054 | 1,726,157,998 | 10,887,922 | 93.13 | 56.93 | 93.90 | 0.0137 |
| MC1-CK-2 | 15,215,384 | 2,282,307,600 | 91.1 | 12,979,384 | 1,912,783,427 | 11,812,868 | 91.01 | 56.67 | 93.81 | 0.0138 |
| MC1-CK-3 | 16,388,692 | 2,458,303,800 | 91.5 | 14,177,492 | 2,094,489,027 | 13,124,998 | 92.58 | 56.44 | 94.01 | 0.0136 |
| MC1-1 | 13,820,672 | 2,073,100,800 | 94.9 | 12,093,922 | 1,783,589,346 | 10,993,370 | 90.90 | 55.94 | 96.86 | 0.0109 |
| MC1-2 | 16,604,690 | 2,490,703,500 | 93.72 | 14,554,380 | 2,145,906,752 | 12,859,768 | 88.36 | 56.12 | 96.07 | 0.0115 |
| MC1-3 | 16,857,140 | 2,528,571,000 | 93.64 | 14,246,340 | 2,090,108,492 | 12,558,154 | 88.15 | 55.82 | 96.07 | 0.0115 |
Figure 1.
Genome-wide assessment. (a) Circular plot of reads mapped to the Halomonas sp. MC1 genome. (b) Phylogenetic tree constructed on the basis of 16S rDNA sequences of neighboring species using the neighbor-joining method. The bars represent 0.02 substitutions per nucleotide position.
3.2. Number of DEGs
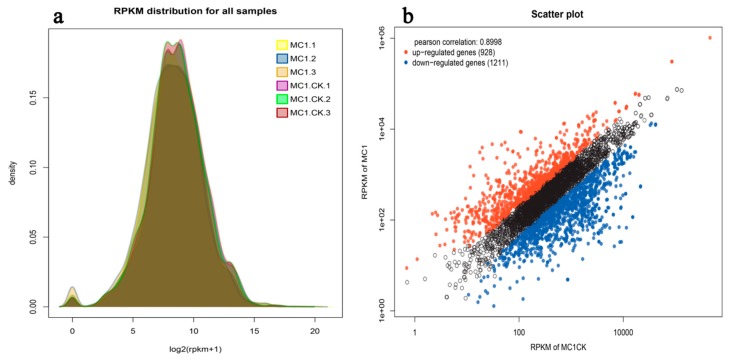
As shown in Figure 2a, based on the values of the reads per kilobase of transcript per million reads mapped (RPKM), the measured peaks of gene expression in six biological samples were similar. However, the gene expressions of three salt-treated (1.71 M NaCl) samples (MC1.1, MC1.2, and MC1.3) were lower than those of CK (MC1.CK.1, MC1.CK.2, and MC1.CK.3, 0 M NaCl). The gene expression of CK was about 2.32% higher than that of MC1. As shown in Figure 2b, 928 genes were upregulated, and 1211 genes were downregulated. The Pearson correlation index was 0.8998, as inferred from the scatter plot. Salt stress treatment resulted in differences in expression between the two group samples.
Figure 2.
Expression level (reads per kilobase of transcript per million reads mappedscores) distribution map (a) and visualized scatter plot of differentially expressed genes (b). Black scatters represent undifferentially expressed genes.
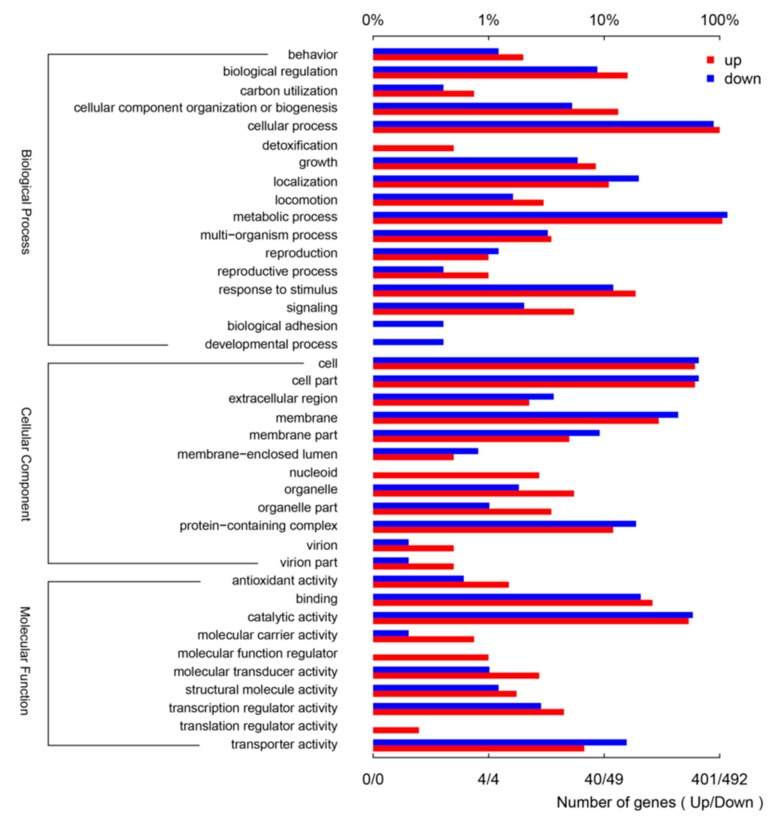
Significant changes were observed in 893 genes including 401 upregulated and 492 downregulated ones after salt treatment (Figure 3). A total of 27 (1.26%) genes in the biological process component were annotated to the outer membrane-bounded periplasmic space and accounted for 0.87% of the total genes. In terms of molecular function, 110 genes were involved in ATPase activity coupled with the transmembrane movement of substances and accounted for 5.14% of the total genes. For biological process, 254 genes were annotated to the catabolic process and accounted for 11.87% of the total genes. The number of genes in ion transmembrane transport reached 64 and accounted for 2.99% of the total genes (Table 2).
Figure 3.
Chart summarizing the results of Gene Ontology enrichment analysis under salt treatment. Three categories, namely, biological processes, cellular components, and molecular functions, are shown. Up and down classification of differentially expressed genes are also marked.
Table 2.
Control (MC1-CK) vs. salt-treated (MC1) GO enrichment.
| Categories | Description | Ratio in Study * | Ratio in Total Genes | p-Value | GO ID |
|---|---|---|---|---|---|
| Cellular Component | outer membrane-bounded periplasmic space | 27 (1.26%) | 47 (0.87%) | 0.0156 | GO:0030288 |
| plasma membrane proton-transporting ATP synthase complex | 10 (0.47%) | 15 (0.28%) | 0.0363 | GO:0045260 | |
| proton-transporting ATP synthase complex | 10 (0.47%) | 15 (0.28%) | 0.0363 | GO:0045259 | |
| proton-transporting two-sector ATPase complex | 10 (0.47%) | 15 (0.28%) | 0.0363 | GO:0016469 | |
| cytochrome o ubiquinol oxidase complex | 8 (0.37%) | 8 (0.15%) | 0.0006 | GO:0009319 | |
| proton-transporting ATP synthase complex, catalytic core F(1) | 8 (0.37%) | 11 (0.20%) | 0.0307 | GO:0045261 | |
| plasma membrane proton-transporting ATP synthase complex, catalytic core F(1) | 8 (0.37%) | 11 (0.20%) | 0.0307 | GO:0045262 | |
| proton-transporting two-sector ATPase complex, catalytic domain | 8 (0.37%) | 11 (0.20%) | 0.0307 | GO:0033178 | |
| cytochrome complex | 8 (0.37%) | 10 (0.18%) | 0.0177 | GO:0070069 | |
| Molecular Function | ATPase activity, coupled to transmembrane movement of substances | 110 (5.14%) | 236 (4.36%) | 0.0245 | GO:0042626 |
| active transmembrane transporter activity | 73 (3.41%) | 154 (2.84%) | 0.0447 | GO:0022804 | |
| primary active transmembrane transporter activity | 65 (3.04%) | 132 (2.44%) | 0.0239 | GO:0015399 | |
| ion transmembrane transporter activity | 62 (2.90%) | 129 (2.38%) | 0.0452 | GO:0015075 | |
| ATPase coupled ion transmembrane transporter activity | 26 (1.22%) | 40 (0.74%) | 0.0017 | GO:0042625 | |
| active ion transmembrane transporter activity | 26 (1.22%) | 40 (0.74%) | 0.0016 | GO:0022853 | |
| proton transmembrane transporter activity | 25 (1.17%) | 45 (0.83%) | 0.0316 | GO:0015078 | |
| inorganic anion transmembrane transporter activity | 15 (0.70%) | 23 (0.42%) | 0.0169 | GO:0015103 | |
| ATPase-coupled anion transmembrane transporter activity | 15 (0.70%) | 20 (0.37%) | 0.0019 | GO:0043225 | |
| proton-transporting ATP synthase activity, rotational mechanism | 10 (0.47%) | 15 (0.28%) | 0.0363 | GO:0046933 | |
| Biological Process | catabolic process | 254 (11.87%) | 584 (10.78%) | 0.0392 | GO:0009056 |
| proton transmembrane transport | 66 (3.09%) | 111 (2.05%) | 0.0000 | GO:1902600 | |
| ion transmembrane transport | 64 (2.99%) | 134 (2.47%) | 0.0492 | GO:0034220 | |
| carboxylic acid catabolic process | 56 (2.62%) | 99 (1.83%) | 0.0005 | GO:0046395 | |
| organic acid catabolic process | 56 (2.62%) | 99 (1.83%) | 0.0005 | GO:0016054 | |
| sulfur compound metabolic process | 51 (2.38%) | 901.66%) | 0.0010 | GO:0006790 | |
| anion transport | 44 (2.06%) | 88 (1.62%) | 0.0475 | GO:0006820 | |
| cellular amino acid catabolic process | 27 (1.26%) | 50 (0.92%) | 0.0414 | GO:0009063 | |
| cellular response to chemical stimulus | 19 (0.89%) | 33 (0.61%) | 0.0476 | GO:0070887 | |
| response to oxygen-containing compound | 18 (0.84%) | 28 (0.52%) | 0.0105 | GO:1901700 |
* Ratio in study: Number of differentially expressed genes/total differentially expressed genes; Ratio in Total genes: Number of differential expressed genes/total genes.
3.3. GO Analysis of DEGs
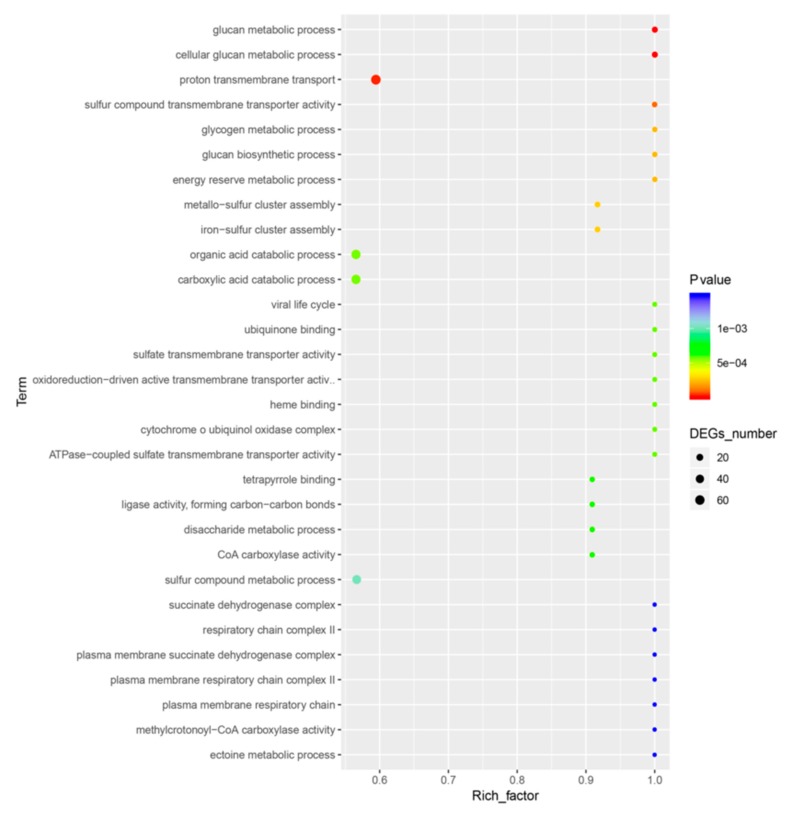
The differentially expressed unigenes of Halomonas sp. MC1 were subjected to functional analysis. Three domains (biological process, cellular components, and molecular functions) were used in the GO functional classification of genes. In this study, all the DEGs were annotated to the terms in the GO database. Our data showed that the majority of genes were annotated to cellular components, molecular functions, and biological processes. GO analysis revealed that 1.26%, 0.47%, and 0.46% of the identified genes were involved in the outer membrane-bounded periplasmic space (GO:0030288), plasma membrane proton-transporting ATP synthase complex (GO:0045260), andproton-transporting ATP synthase complex (GO:0045259), respectively. Of the 17 molecular functions identified, ATPase activity coupled with the transmembrane movement of substances (GO:0042626), active transmembrane transporter activity (GO:0022804), and primary active transmembrane transporter activity (GO:0015399) were significantly enriched with total gene proportions of 5.14%, 3.41%, and 3.03%, respectively. Of the 1000 biological processes identified, catabolic process (GO:0009056), proton transmembrane transport (GO:1902600), and ion transmembrane transport (GO:0034220) were significantly regulated and enriched with total gene proportions of 11.87%, 3.09%, and 2.99%, respectively (Figure 4, Table 2).
Figure 4.
Top Gene Ontology enriched pathways. A large rich factor indicates a high degree of enrichment.
3.4. KEGG Analysis of DEGs
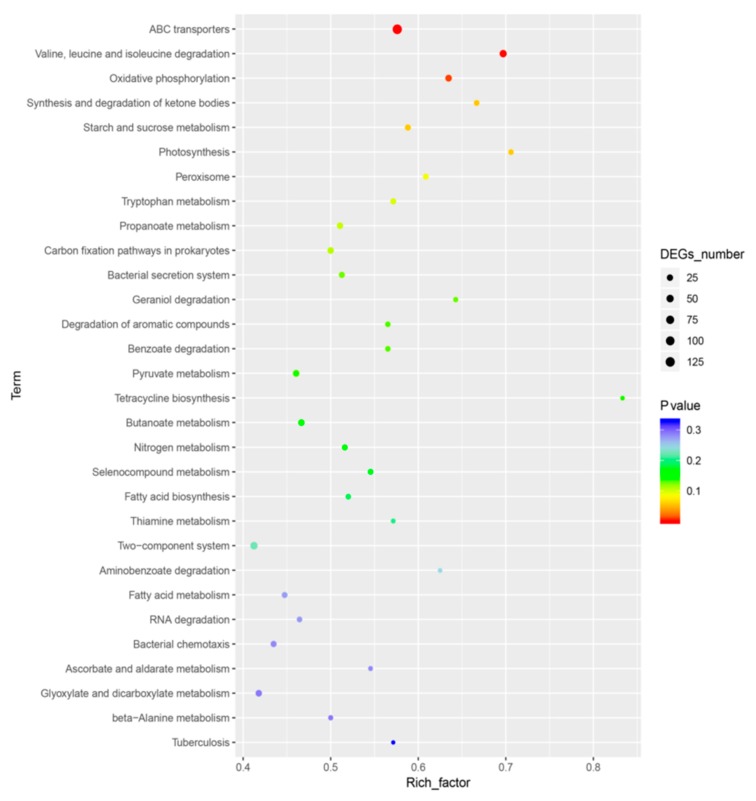
The DEGs in the MC1 strain were matched to 104 different KEGG pathways.ABC transporters were the most common pathway. A total of 224 genes including 129 DEGs were designated as ABC transporters. A total of 66 genes including 46 DEGs participate in the valine, leucine, and isoleucine degradation pathway (Figure 5, Table 3).
Figure 5.
Top pathways enriched in the Kyoto Encyclopedia of Genes and Genomes analysis. A large rich factor indicates a high degree of enrichment.
Table 3.
Control (MC1-CK) vs. salt-treated (MC1) pathway enrichment.
| Pathway | Varied Number * | Marked Number ** | p-Value | Pathway ID |
|---|---|---|---|---|
| ABC transporters | 129 | 224 | 0.00001 | ko02010 |
| Valine, leucine and isoleucine degradation | 46 | 66 | 0.00050 | ko00280 |
| Oxidative phosphorylation | 33 | 52 | 0.00832 | ko00190 |
| Synthesis and degradation of ketone bodies | 14 | 21 | 0.05648 | ko00072 |
| Starch and sucrose metabolism | 20 | 34 | 0.05746 | ko00500 |
| Photosynthesis | 12 | 17 | 0.05826 | ko00195 |
* Different genes. ** Total number of marked genes. The table below shows the results of the enrichment analysis of the KEGG pathway function.
3.5. Clustering Analysis of DEGs
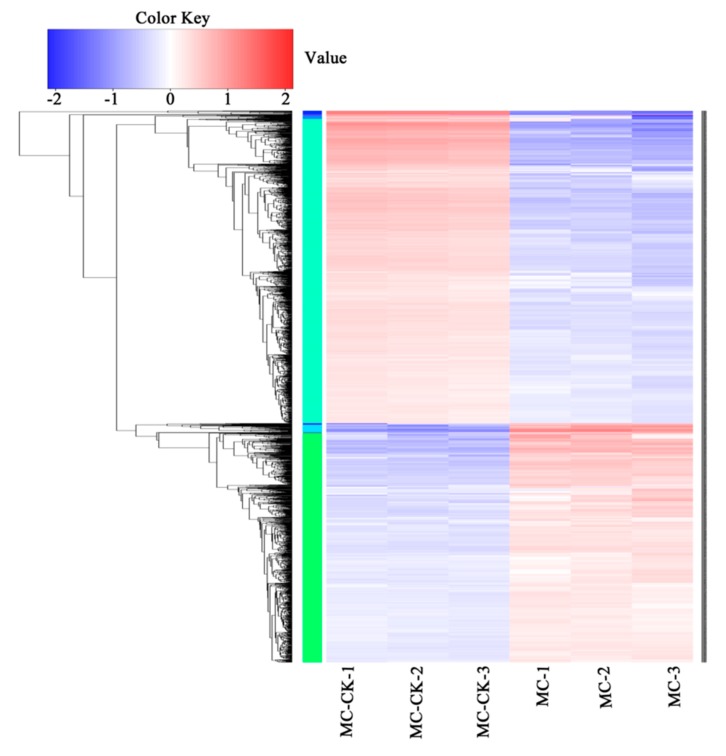
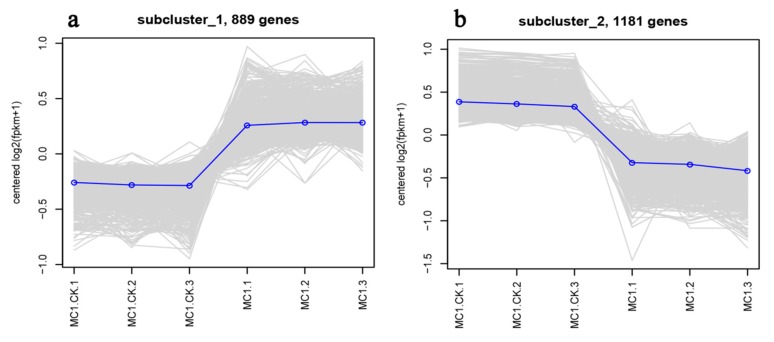
Figure 6 shows the results of the DEG clustering analysis. The number of upregulated genes under salt-treated MC1 was lower than that of downregulated genes. Cluster analysis showed that the six samples were divided into two different sections (Figure 6). The genes with the most pronounced upregulation were related to cellular regulation of biological process such as MC1004145, MC1000224, and MC1000519, and those with the most pronounced downregulation comprised MC1005273, MC1004502, and MC1000699. Those selected genes were related to cell part process, which might be involved in signals interaction or cell formation under salt stress. In order to figure out the trend of each branch, a total of 889 and 1181 genes were analyzed by Branch 1 (Figure 7a) and Branch 2 (Figure 7b), respectively. The number of downregulated genes was larger than that of the upregulated genes under high-salinity treatment.
Figure 6.
Clustering heatmap of differentially expressed genes.
Figure 7.
MC1 vs. MC1.CK differentially expressed genes sub-cluster trend lines. A total of 889 genes were analyzed by Branch 1 (a), and 1181 genes were analyzed by Branch 2 (b). The number of downregulated genes was higher than that of upregulated genes under high salinity.
3.6. qRT-PCR Validation
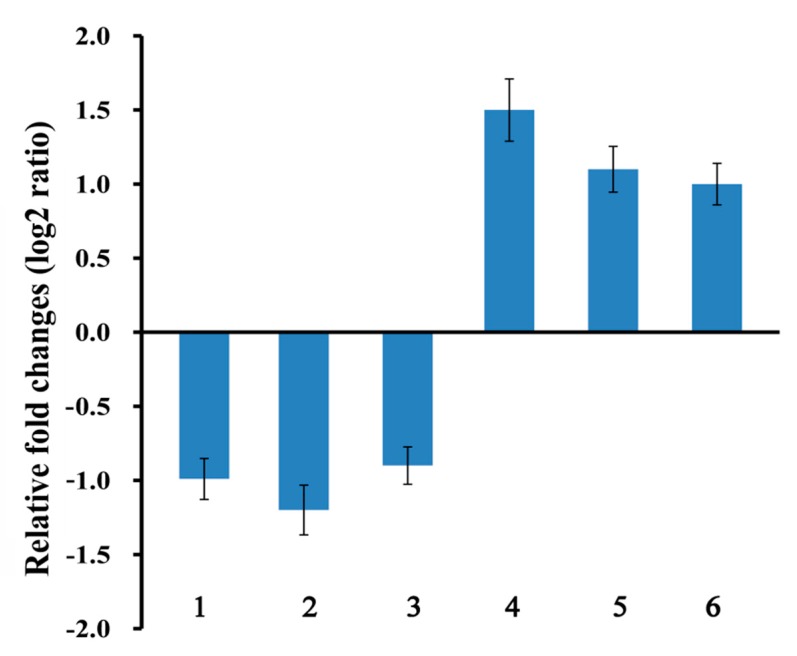
qRT-PCR analysis was performed to validate the data. Six genes (three upregulated genes including molecular function MC1004145, MC1000224, and MC1000519, and three downregulated genes including cell part (GO:0044464) MC1005273, MC1004502, and MC1000699). All the test genes were involved in the cellular regulation of biological process. In this study, given the variation in the particular values of relative fold change, the data obtained from qRT-PCR were consistent with those obtained from RNA-Seq (Figure 8).
Figure 8.
Comparison of the relative fold changes of six genes subjected to quantitative real-time polymerase chain reaction. Numbers 1, 2, 3, 4, 5, and 6 represent MC1005273, MC1004502, MC1000699, MC1004145, MC1000224, and MC1000519, respectively.
4. Discussion
Salt-tolerant bacteria use many strategies to improve host plant adaptation to saline conditions. Although these mechanisms have been comprehensively investigated for decades, only a few studies have illustrated the changes in gene levels during bacterial growth. In this work, we analyzed the entire transcriptome and differential gene expression of Halomonas sp. MC1 after exposure to NaCl stress under normal culture conditions (Figure 1a). We observed significant changes in the expression levels of 893 genes after NaCl treatment. A total of 401 and 492 genes were upregulated and downregulated in MC1 (1.71 M NaCl), respectively (Figure 3). Notably, GO and KEGG analyses of DEGs revealed significant variations, indicating that NaCl stress considerably affected the growth of the MC1 strain. Our results also showed that the MC1 strain regulated various pathways to cope with salt stress. Studies have illustrated that bacteria can induce plants to adapt to salt stress [33,34]. Our data indicate that the bacterium itself induced its own capability to avoid hostile environments.
The total gene expression significantly changed after salt treatment (Figure 3). This result suggests that MC1 responded to abiotic stress to retain stable growth. The number of DEGs identified in this study was lower than that identified in a previous work [35]. The cellular components with the highest enrichment included the outer membrane-bounded periplasmic space (GO:0030288), plasma membrane proton-transporting ATP synthase complex (GO:0045260), and proton-transporting ATP synthase complex (GO:0045259) (Table 2). It has been reported that ATPases is involved in ATP biosynthesis and is dependent on the proton motive force created by the action of H+ ATPases. This enzyme is also found important in salt tolerance related genes in tomato or maize seedlings [36,37]. The number of genes in the outer membrane-bounded periplasmic space was higher than that in the control. A previous study has reported that numerous proteinslocated in the outer membrane-bounded periplasmic space help bacteria adapt to adverse conditions [38]. Our findings suggest that the MC1 strain upregulated a large number of genes involved in the membrane-bounded space to resist salt stress. A recent study identified the outer membrane-bounded periplasmic space as one of the top three enriched terms in the cell component category [39].
ATPase activity coupled with the transmembrane movement of substances (GO:0042626), active transmembrane transporter activity (GO:0022804), and primary active transmembrane transporter activity (GO:0015399) were significantly enriched in the molecular function category (Figure 4). A previous work showed that Brevibacterium confers salt tolerance by regulating the ATPase activity [40]. In accordance with this result, our data suggest that this activity aids bacteria in surviving under salt stress. ATPase activity is a key indicator in cell analysis [41]. Na+/K+-ATPase activities differ in bacteria exposed to different salinities [42]. Our study indicates that the high capacity of MC1 in salt tolerance was correlated with high ATPase activities.
Catabolic process (GO:0009056), proton transmembrane transport (GO:1902600), and ion transmembrane transport (GO:0034220) were significantly enriched in the biological process category. The most regulated included those involved in the catabolic process and ion transmembrane transport (Table 2). A previous study has shown that soil type substantially affects plant colonization and catabolic gene expression under the inoculation of bacterial strains [43]. Catabolic processes are crucial for the bacterial resistance to different abiotic stresses [44]. Bacterial catabolic genes are vital not only in agricultural soils, but also in marine conditions [45,46]. We also noted that ion transmembrane transport genes were regulated, suggesting that salt stimulates ion transport in the membrane space. The MC1 strain regulated genes to resist salt stress to balance the osmotic pressure. A previous study has demonstrated that salt stress induces changes including ion diffusion in the exoproteome of halotolerant bacteria [47].
The KEGG pathway database contains information on molecular interactions in known metabolic and regulatory pathways [48]. In this study, the DEGs in MC1 were matched to 104 different KEGG pathways. This result suggests that MC1 maintained survival under salt stress by regulating cellular and metabolic processes as well as pyruvate metabolism pathways such as organic and carboxylic acid catabolism. Our data showed that the most significant pathways included ABC transporters. A total of 224 genes including 129 DEGs were annotated to this pathway (Figure 5, Table 3). ABC transporters play important functions such as the high-affinity uptake of nutrients and export of cytotoxic compounds in bacterial cells [49]. We speculated that MC1 regulated ABC transporters to adapt to high salt stress. A total of 66 genes in MC1 strain were allocated to the valine, leucine, and isoleucine degradation pathway (Table 3). This pathway is highly related to residual feed intake [50]. A previous researcher has reported similar results and pointed out that leucine and isoleucine degradation occurs when Staphylococcus aureus is subjected to methicillin treatment in the presence of glucose [51]. Our data suggest that Halomonas sp. MC1 survives under salt stress by regulating the valine, leucine, and isoleucine degradation pathway. KEGG analysis yielded fewer enriched pathways than the GO analysis. The high enrichment of the outer membrane-bounded periplasmic space in the GO analysis suggests that MC1 regulates the outer membrane genes to confront salt stress. A study has reported that the membrane lipid bilayer is a regulated barrier for coping with detrimental ionic conditions [52]. We believe that our results are potentially helpful for analyzing other salt-tolerant bacteria and provide new conclusions in the analysis of gene expression under saline stress.
An enhanced understanding of a beneficial EB interaction with salt stress can improve the handling and application of plant growth-promoting microbes. Although microbial-mediated drought or heavy metal tolerance in plants [53,54] has been elucidated, our understanding of the salt tolerance mechanisms of EB remains lacking. A recent valuable work has proven that ion accumulation and the expression of ion homeostasis-related genes contribute to the NaCl-stimulated growth enhancement in halophytes, especially the common ice plant [18]. Nevertheless, the current study of Halomonas sp. bacteria indicates that future research features considerable potential to provide new insights into salt resistance. Collectively, our results suggest that MC1 regulates cellular and metabolic processes as well as pyruvate metabolism pathways such as organic and carboxylic acid catabolic activities to survive under salt stress. This behavior indicates that MC1 possesses a strong capability to adapt to extremely adverse environments. Given our results and the widely reported bacterial salt resistance, we highlight the mechanism of Halomonas sp. MC1 to elucidate the dynamics of complex salt–microbe interactions. Meanwhile, our genome-wide survey of MC1 provides candidate genes for further application of this strain.
5. Conclusions
We examined the effect of salt stress on the growth of Halomonas sp. strain MC1 by using a dataset generated through de novo assembly of next-generation sequencing data. Salt treatment caused significant changes in 893 genes including 401 upregulated and 492 downregulated genes. Our results suggest that MC1 survives under salt stress through various pathways, that is, by regulating the genes involved in the outer membrane-bounded periplasmic space, plasma membrane proton-transporting ATP synthase complex, and ABC transporters. MC1 maintained survival under salt stress by regulating cellular and metabolic processes as well as pyruvate metabolism pathways such as organic and carboxylic acid catabolic activities. Our data on DEGs can also provide potential candidate genes for the functional analyses of MC1 for survival in salt stress. Exploration of salt-resistant genes can determine which ones can be cloned or stimulated before using the bacterial strain.
Acknowledgments
We would also like to thank two undergraduate students, Jing Chen and Yu Cao, from the School of Horticulture at Anhui Agricultural University for their assistance with the experiment.
Abbreviations
| EB | endophytic bacteria |
| CFU | colony-forming units |
| KEGG | Kyoto Encyclopedia of Genes and Genomes |
| GO | Gene Ontology |
| DEGs | differential expression genes |
| FDR | false discovery rate |
Supplementary Materials
The following are available online at https://www.mdpi.com/2076-2607/8/1/88/s1, Table S1: Oligonucleotide primers for qRT-PCR for differentially expressed gene validation.
Author Contributions
J.Z. planed and designed the research. J.Z., P.W., H.T., Z.T., and T.G. performed the experiments. J.Z. and P.W. analyzed the data. J.Z. and P.W. wrote the manuscript. All authors have read and agreed to the published version of the manuscript.
Funding
This research was funded by the National Natural Science Foundation of China (Grant No. 31701968), the Anhui Key Basic Research Project (Grant No. 201904a06020004), and the Second Level Youth Development Fund from the Anhui Academy of Agricultural Sciences.
Conflicts of Interest
The authors declare no conflicts of interest. The funders had no role in the design of the study; in the collection, analyses, or interpretation of data; in the writing of the manuscript, or in the decision to publish the results.
References
- 1.Foyer C.H., Rasool B., Davey J.W., Hancock R.D. Cross-tolerance to biotic and abiotic stresses in plants: A focus on resistance to aphid infestation. J. Exp. Bot. 2016;67:2025–2037. doi: 10.1093/jxb/erw079. [DOI] [PubMed] [Google Scholar]
- 2.Ali S., Charles T.C., Glick B.R. Amelioration of high salinity stress damage by plant growth-promoting bacterial endophytes that contain ACC deaminase. Plant Physiol. Biochem. 2014;80:160–167. doi: 10.1016/j.plaphy.2014.04.003. [DOI] [PubMed] [Google Scholar]
- 3.Krasensky J., Jonak C. Drought, salt, and temperature stress-induced metabolic rearrangements and regulatory networks. J. Exp. Bot. 2012;63:1593–1608. doi: 10.1093/jxb/err460. [DOI] [PMC free article] [PubMed] [Google Scholar]
- 4.Shrivastava P., Kumar R. Soil salinity: A serious environmental issue and plant growth promoting bacteria as one of the tools for its alleviation. Saudi J. Biol. Sci. 2015;22:123–131. doi: 10.1016/j.sjbs.2014.12.001. [DOI] [PMC free article] [PubMed] [Google Scholar]
- 5.Khan Z., Rho H., Firrincieli A., Hung S.H., Luna V., Masciarelli O., Kim S.-H., Doty S.L. Growth enhancement and drought tolerance of hybrid poplar upon inoculation with endophyte consortia. Curr. Plant Biol. 2016;6:38–47. doi: 10.1016/j.cpb.2016.08.001. [DOI] [Google Scholar]
- 6.Dimkpa C., Weinand T., Asch F. Plant–rhizobacteria interactions alleviate abiotic stress conditions. Plant Cell Environ. 2009;32:1682–1694. doi: 10.1111/j.1365-3040.2009.02028.x. [DOI] [PubMed] [Google Scholar]
- 7.Gouda S., Kerry R.G., Das G., Paramithiotis S., Shin H.-S., Patra J.K. Revitalization of plant growth promoting rhizobacteria for sustainable development in agriculture. Microbiol. Res. 2018;206:131–140. doi: 10.1016/j.micres.2017.08.016. [DOI] [PubMed] [Google Scholar]
- 8.Palacios O.A., Bashan Y., de-Bashan L.E. Proven and potential involvement of vitamins in interactions of plants with plant growth-promoting bacteria-an overview. Biol. Fertil. Soils. 2014;50:415–432. doi: 10.1007/s00374-013-0894-3. [DOI] [Google Scholar]
- 9.Zinniel D.K., Lambrecht P., Harris N.B., Feng Z., Kuczmarski D., Higley P., Ishimaru C.A., Arunakumari A., Barletta R.G., Vidaver A.K. Isolation and characterization of endophytic colonizing bacteria from agronomic crops and prairie plants. Appl. Environ. Microbiol. 2002;68:2198. doi: 10.1128/AEM.68.5.2198-2208.2002. [DOI] [PMC free article] [PubMed] [Google Scholar]
- 10.Jha P., Panwar J., Jha P.N. Mechanistic insights on plant root colonization by bacterial endophytes: A symbiotic relationship for sustainable agriculture. Environ. Sustain. 2018;1:25–38. doi: 10.1007/s42398-018-0011-5. [DOI] [Google Scholar]
- 11.Rai R., Dash P.K., Prasanna B.M., Singh A. Endophytic bacterial flora in the stem tissue of a tropical maize (Zea mays L.) genotype: Isolation, identification and enumeration. World J. Microbiol. Biotechnol. 2007;23:853–858. doi: 10.1007/s11274-006-9309-z. [DOI] [Google Scholar]
- 12.Brader G., Compant S., Vescio K., Mitter B., Trognitz F., Ma L.J., Sessitsch A. Ecology and genomic insights into plant-pathogenic and plant-nonpathogenic endophytes. Ann. Rev. Phytopathol. 2017;55:61–83. doi: 10.1146/annurev-phyto-080516-035641. [DOI] [PubMed] [Google Scholar]
- 13.Li X., Ma L., Li Y., Wang L., Zhang L. Endophyte infection enhances accumulation of organic acids and minerals in rice under Pb2+ stress conditions. Ecotoxicol. Environ. Saf. 2019;174:255–262. doi: 10.1016/j.ecoenv.2019.02.072. [DOI] [PubMed] [Google Scholar]
- 14.Khatabi B., Gharechahi J., Ghaffari M.R., Liu D., Haynes P.A., McKay M.J., Mirzaei M., Salekdeh G.H. Plant-microbe symbiosis: What has proteomics taught us? Proteomics. 2019 doi: 10.1002/pmic.201800105. [DOI] [PubMed] [Google Scholar]
- 15.Berg G., Rybakova D., Grube M., Köberl M. The plant microbiome explored: Implications for experimental botany. J. Exp. Bot. 2015;67:995–1002. doi: 10.1093/jxb/erv466. [DOI] [PMC free article] [PubMed] [Google Scholar]
- 16.Afzal I., Shinwari Z.K., Sikandar S., Shahzad S. Plant beneficial endophytic bacteria: Mechanisms, diversity, host range and genetic determinants. Microbiol. Res. 2019;221:36–49. doi: 10.1016/j.micres.2019.02.001. [DOI] [PubMed] [Google Scholar]
- 17.Chebotar V.K., Malfanova N.V., Shcherbakov A.V., Ahtemova G.A., Borisov A.Y., Lugtenberg B., Tikhonovich I.A. Endophytic bacteria in microbial preparations that improve plant development. Appl. Biochem. Microbiol. 2015;51:271–277. doi: 10.1134/S0003683815030059. [DOI] [PubMed] [Google Scholar]
- 18.Tran D.Q., Konishi A., Cushman J.C., Morokuma M., Toyota M., Agarie S. Ion accumulation and expression of ion homeostasis-related genes associated with halophilism, NaCl-promoted growth in a halophyte Mesembryanthemum crystallinum L. Plant Prod. Sci. 2019:1–12. doi: 10.1080/1343943X.2019.1647788. [DOI] [Google Scholar]
- 19.Dong Z.-Y., Narsing Rao M.P., Wang H.-F., Fang B.-Z., Liu Y.-H., Li L., Xiao M., Li W.-J. Transcriptomic analysis of two endophytes involved in enhancing salt stress ability of Arabidopsis thaliana. Sci. Total Environ. 2019;686:107–117. doi: 10.1016/j.scitotenv.2019.05.483. [DOI] [PubMed] [Google Scholar]
- 20.Wang T.T., Ding P., Chen P., Xing K., Bai J.L., Wan W., Jiang J.H., Qin S. Complete genome sequence of endophyte Bacillus flexus KLBMP 4941 reveals its plant growth promotion mechanism and genetic basis for salt tolerance. J. Biotechnol. 2017;260:38–41. doi: 10.1016/j.jbiotec.2017.09.001. [DOI] [PubMed] [Google Scholar]
- 21.Gond S.K., Torres M.S., Bergen M.S., Helsel Z., White J.F., Jr. Induction of salt tolerance and up-regulation of aquaporin genes in tropical corn by rhizobacterium Pantoeaagglomerans. Lett. Appl. Microbiol. 2015;60:392–399. doi: 10.1111/lam.12385. [DOI] [PubMed] [Google Scholar]
- 22.Wani Z.A., Ashraf N., Mohiuddin T., Riyaz-Ul-Hassan S. Plant-endophyte symbiosis, an ecological perspective. Appl. Microbiol. Biotechnol. 2015;99:2955–2965. doi: 10.1007/s00253-015-6487-3. [DOI] [PubMed] [Google Scholar]
- 23.Vaishnav A., Shukla A.K., Sharma A., Kumar R., Choudhary D.K. Endophytic bacteria in plant salt stress tolerance: Current and future prospects. J. Plant Growth Regul. 2019;38:650–668. doi: 10.1007/s00344-018-9880-1. [DOI] [Google Scholar]
- 24.Nelson D.E., Koukoumanos M., Bohnert H.J. Myo-inositol-dependent sodium uptake in ice plant. Plant Physiol. 1999;119:165–172. doi: 10.1104/pp.119.1.165. [DOI] [PMC free article] [PubMed] [Google Scholar]
- 25.Nanhapo P.I., Yamane K., Iijima M. Mixed cropping with ice plant alleviates the damage and the growth of cowpea under consecutive NaCl treatment and after the recovery from high salinity. Plant Prod. Sci. 2017;20:111–125. doi: 10.1080/1343943X.2017.1282828. [DOI] [Google Scholar]
- 26.Zhang J., Wang P., Tian H., Jiang H., Wang Y., Yan C. Identification of interior salt-tolerant bacteria from ice plant Mesembryanthemumcrystallinum and evaluation of their promoting effects. Symbiosis. 2018;76:243–252. doi: 10.1007/s13199-018-0551-6. [DOI] [Google Scholar]
- 27.Tjaden B. De novo assembly of bacterial transcriptomes from RNA-seq data. Genome Biol. 2015;16:1. doi: 10.1186/s13059-014-0572-2. [DOI] [PMC free article] [PubMed] [Google Scholar]
- 28.Grabherr M.G., Haas B.J., Yassour M., Levin J.Z., Thompson D.A., Amit I., Adiconis X., Fan L. Full-length transcriptome assembly from RNA-Seq data without a reference genome. Nat. Biotechnol. 2011;29:644–652. doi: 10.1038/nbt.1883. [DOI] [PMC free article] [PubMed] [Google Scholar]
- 29.Levin J.Z., Yassour M., Adiconis X., Nusbaum C., Thompson D.A., Friedman N., Gnirke A., Regev A. Comprehensive comparative analysis of strand-specific RNA sequencing methods. Nat. Methods. 2010;7:709. doi: 10.1038/nmeth.1491. [DOI] [PMC free article] [PubMed] [Google Scholar]
- 30.Altermann E., Klaenhammer T.R. PathwayVoyager: Pathway mapping using the Kyoto Encyclopedia of Genes and Genomes (KEGG) database. BMC Genom. 2005;6:60. doi: 10.1186/1471-2164-6-60. [DOI] [PMC free article] [PubMed] [Google Scholar]
- 31.Pinard D., Fierro A.C., Marchal K., Myburg A.A., Mizrachi E. Organellar carbon metabolism is coordinated with distinct developmental phases of secondary xylem. New Phytol. 2019;222:1832–1845. doi: 10.1111/nph.15739. [DOI] [PubMed] [Google Scholar]
- 32.Song Y., Shin J., Jin S., Lee J.K., Kim D.R., Kim S.C., Cho S., Cho B.K. Genome-scale analysis of syngas fermenting acetogenic bacteria reveals the translational regulation for its autotrophic growth. BMC Genom. 2018;19:837. doi: 10.1186/s12864-018-5238-0. [DOI] [PMC free article] [PubMed] [Google Scholar]
- 33.Orozco-Mosqueda M.d.C., Duan J., DiBernardo M., Zetter E., Campos-García J., Glick B.R., Santoyo G. The production of ACC deaminase and trehalose by the plant growth promoting bacterium Pseudomonas sp. UW4 synergistically protect tomato plants against salt stress. Front. Microbiol. 2019;10:1392. doi: 10.3389/fmicb.2019.01392. [DOI] [PMC free article] [PubMed] [Google Scholar]
- 34.Niu S.-Q., Li H.-R., Paré P.W., Aziz M., Wang S.-M., Shi H., Li J., Han Q.-Q., Guo S.-Q., Li J., et al. Induced growth promotion and higher salt tolerance in the halophyte grass Puccinelliatenuiflora by beneficial rhizobacteria. Plant Soil. 2016;407:217–230. doi: 10.1007/s11104-015-2767-z. [DOI] [Google Scholar]
- 35.Kurt-Kızıldoğan A., Abanoz B., Okay S. Global transcriptome analysis of Halolamina sp. to decipher the salt tolerance in extremely halophilic archaea. Gene. 2017;601:56–64. doi: 10.1016/j.gene.2016.11.042. [DOI] [PubMed] [Google Scholar]
- 36.Zhu M., Chen G., Dong T., Wang L., Zhang J., Zhao Z., Hu Z. SlDEAD31, a putative DEAD-Box RNA helicase gene, regulates salt and drought tolerance and stress-related genes in tomato. PLoS ONE. 2015;10:e0133849. doi: 10.1371/journal.pone.0133849. [DOI] [PMC free article] [PubMed] [Google Scholar]
- 37.Fu J., Wang Y.-F., Liu Z.-H., Li Z.-T., Yang K.-J. Trichodermaasperellum alleviates the effects of saline–alkaline stress on maize seedlings via the regulation of photosynthesis and nitrogen metabolism. Plant Growth Regul. 2018;85:363–374. doi: 10.1007/s10725-018-0386-4. [DOI] [Google Scholar]
- 38.Yang M., Ye J., Qin H., Long Y., Li Y. Influence of perfluorooctanoic acid on proteomic expression and cell membrane fatty acid of Escherichia coli. Environ. Pollut. 2017;220:532–539. doi: 10.1016/j.envpol.2016.09.097. [DOI] [PubMed] [Google Scholar]
- 39.Zeng J., Yu H., Kjellberg F. Transcriptome analysis of genes involved in the response of a pollinator fig wasp to volatile organic compounds from its host figs. ActaOecologica. 2018;90:91–98. doi: 10.1016/j.actao.2018.01.003. [DOI] [Google Scholar]
- 40.Chatterjee P., Samaddar S., Niinemets Ü., Sa T.-M. Brevibacterium linens RS16 confers salt tolerance to Oryza sativa genotypes by regulating antioxidant defense and H+ ATPase activity. Microbiol. Res. 2018;215:89–101. doi: 10.1016/j.micres.2018.06.007. [DOI] [PubMed] [Google Scholar]
- 41.Valabhoju V., Agrawal S., Sen R. Molecular basis of NusG-mediated regulation of Rho-dependent transcription termination in bacteria. J. Biol. Chem. 2016;291:22386–22403. doi: 10.1074/jbc.M116.745364. [DOI] [PMC free article] [PubMed] [Google Scholar]
- 42.Yang H., Meng Y., Song Y., Tan Y., Warren A., Li J., Lin X. Salinity fluctuation influencing biological adaptation: Growth dynamics and Na+/K+-ATPase activity in a euryhaline bacterium. J. Basic Microbiol. 2017;57:617–624. doi: 10.1002/jobm.201700124. [DOI] [PubMed] [Google Scholar]
- 43.Afzal M., Yousaf S., Reichenauer T.G., Kuffner M., Sessitsch A. Soil type affects plant colonization, activity and catabolic gene expression of inoculated bacterial strains during phytoremediation of diesel. J. Hazard. Mater. 2011;186:1568–1575. doi: 10.1016/j.jhazmat.2010.12.040. [DOI] [PubMed] [Google Scholar]
- 44.Sarkar P., Roy A., Pal S., Mohapatra B., Kazy S.K., Maiti M.K., Sar P. Enrichment and characterization of hydrocarbon-degrading bacteria from petroleum refinery waste as potent bioaugmentation agent for in situ bioremediation. Bioresour. Technol. 2017;242:15–27. doi: 10.1016/j.biortech.2017.05.010. [DOI] [PubMed] [Google Scholar]
- 45.Yun E.J., Lee S., Kim H.T., Pelton J.G., Kim S., Ko H.-J., Choi I.-G., Kim K.H. The novel catabolic pathway of 3,6-anhydro-L-galactose, the main component of red macroalgae, in a marine bacterium. Environ. Microbiol. 2015;17:1677–1688. doi: 10.1111/1462-2920.12607. [DOI] [PubMed] [Google Scholar]
- 46.Douglass J.F., Radosevich M., Tuovinen O.H. Microbial attenuation of atrazine in agricultural soils: Biometer assays, bacterial taxonomic diversity, and catabolic genes. Chemosphere. 2017;176:352–360. doi: 10.1016/j.chemosphere.2017.02.102. [DOI] [PubMed] [Google Scholar]
- 47.Rubiano-Labrador C., Bland C., Miotello G., Armengaud J., Baena S. Salt Stress Induced Changes in the Exoproteome of the Halotolerant Bacterium Tistliaconsotensis Deciphered by Proteogenomics. PloS ONE. 2015;10:e0135065. doi: 10.1371/journal.pone.0135065. [DOI] [PMC free article] [PubMed] [Google Scholar]
- 48.Kauffmann A., Huber W. Microarray data quality control improves the detection of differentially expressed genes. Genomics. 2010;95:138–142. doi: 10.1016/j.ygeno.2010.01.003. [DOI] [PubMed] [Google Scholar]
- 49.Locher K.P. Mechanistic diversity in ATP-binding cassette (ABC) transporters. Nat. Struct. Mol. Biol. 2016;23:487. doi: 10.1038/nsmb.3216. [DOI] [PubMed] [Google Scholar]
- 50.Duarte D.A.S., Newbold C.J., Detmann E., Silva F.F., Freitas P.H.F., Veroneze R., Duarte M.S. Genome-wide association studies pathway-based meta-analysis for residual feed intake in beef cattle. Anim. Genet. 2019;50:150–153. doi: 10.1111/age.12761. [DOI] [PubMed] [Google Scholar]
- 51.Rutowski J., Zhong F., Xu M., Zhu J. Metabolic shift of Staphylococcus aureus under sublethal dose of methicillin in the presence of glucose. J. Pharm. Biomed. Analy. 2019;167:140–148. doi: 10.1016/j.jpba.2019.02.010. [DOI] [PubMed] [Google Scholar]
- 52.Wagatsuma T. The membrane lipid bilayer as a regulated barrier to cope with detrimental ionic conditions: Making new tolerant plant lines with altered membrane lipid bilayer. Soil. Sci. Plant Nut. 2017;63:507–516. doi: 10.1080/00380768.2017.1369362. [DOI] [Google Scholar]
- 53.Etesami H. Bacterial mediated alleviation of heavy metal stress and decreased accumulation of metals in plant tissues: Mechanisms and future prospects. Ecotoxicol. Environ. Saf. 2018;147:175–191. doi: 10.1016/j.ecoenv.2017.08.032. [DOI] [PubMed] [Google Scholar]
- 54.Kumar A., Verma J.P. Does plant-microbe interaction confer stress tolerance in plants: A review? Microbiol. Res. 2018;207:41–52. doi: 10.1016/j.micres.2017.11.004. [DOI] [PubMed] [Google Scholar]
Associated Data
This section collects any data citations, data availability statements, or supplementary materials included in this article.


