

Abstract
Background:
Advanced prostate cancers depend on protein synthesis for continued survival and accelerated rates of metabolism for growth. RNA polymerase I (Pol I) is the enzyme responsible for ribosomal RNA (rRNA) transcription and a rate-limiting step for ribosome biogenesis. We have shown using a specific and sensitive RNA probe for the 45S rRNA precursor that rRNA synthesis is increased in prostate adenocarcinoma compared to nonmalignant epithelium. We have introduced a first-in-class Pol I inhibitor, BMH-21, that targets cancer cells of multiple origins, and holds potential for clinical translation.
Methods:
The effect of BMH-21 was tested in prostate cancer cell lines and in prostate cancer xenograft and mouse genetic models.
Results:
We show that BMH-21 inhibits Pol I transcription in metastatic, castration-resistant, and enzalutamide treatment-resistant prostate cancer cell lines. The genetic abrogation of Pol I effectively blocks the growth of prostate cancer cells. Silencing of p53, a pathway activated downstream of Pol I, does not diminish this effect. We find that BMH-21 significantly inhibited tumor growth and reduced the Ki67 proliferation index in an enzalutamide-resistant xenograft tumor model. A decrease in 45S rRNA synthesis demonstrated on-target activity. Furthermore, the Pol I inhibitor significantly inhibited tumor growth and pathology in an aggressive genetically modified Hoxb13-MYC|Hoxb13-Cre|Ptenfl/fl (BMPC) mouse prostate cancer model.
Conclusion:
Taken together, BMH-21 is a novel promising molecule for the treatment of castration-resistant prostate cancer.
Keywords: androgen receptor, ribosome biogenesis, RNA polymerase I, small molecule, therapeutics, transcription
1 |. INTRODUCTION
Prostate cancers harbor numerous genetic and epigenetic abnormalities that drive unrestricted cellular growth and increased metabolic demands.1 These changes include mutations and/or deletions in critical tumor suppressor genes, such as TP53 on chromosome 17p13 and PTEN on 10q23, which are linked to the progression of the disease.2 The proto-oncogene MYC on chromosome 8q24 is frequently amplified and dysregulated in 70% of all cancers including prostate cancer and has been demonstrated to broadly impact the cellular transcriptome.3,4 These changes drive the upregulation of anabolic cellular metabolism that supports the cancer cell phenotype. Specifically, cancer cells meet this demand by increasing the abundance of ribosomes needed for protein synthesis.5,6 Ribosomal biogenesis is directed by RNA polymerase I (Pol I), a multisubunit enzyme that transcribes ribosomal DNA (rDNA) to ribosomal RNA (rRNA).7
rRNA transcription is compartmentalized in the nucleolus, where the rDNA genes are located in multicopy tandem repeats. rRNA transcription constitutes 60% of total cellular transcription and is a highly regulated multistep process.8 Briefly, rRNA transcription initiation occurs upon the assembly of multisubunit preinitiation complex including SL1 and RRN3 that binds the rDNA promoter and facilitates the loading of the 13-subunit Pol I complex.9,10 Pol I transcribes a long polycistronic 47S rRNA precursor. The 47S rRNA contains 5′ and 3′ external transcribed spacers (ETS) and internal transcribed spacers that are rapidly cleaved to yield mature 28S, 18S, and 5.8S rRNAs, which are assembled into the large and small subunit ribosomes through multiple maturation and processing steps.8,11
Clinical therapies for prostate cancer are multifaceted. Given that a majority of prostate cancers initially depend on the androgen receptor (AR) pathway, treatments that target and inhibit androgen biosynthesis, such as abiraterone, or target AR and compete with its ligands, such as bicalutamide and enzalutamide (MDV3100), are widely used.12 While these therapies are initially effective, resistance and progression of disease often occur, underscoring the need to develop new treatments.12 Of note, Pol I is highly upregulated in prostate cancer and in advanced, metastatic disease.13,14 The increase in Pol I may result from activation of Myc, or other driver genes, such as protein kinase B, mammalian target of rapamycin, or mitogen-activated protein kinase/extracellular signal-regulated kinase signaling pathways that are commonly altered in prostate cancer.15–17 Furthermore, the loss of negative regulators of Pol I transcription including PTEN, p53, or retinoblastoma protein can further lead to overt activation of the Pol I transcription program.18–20 In addition, androgen was reported to stimulate RNA synthesis in prostate cancer,21,22 further suggesting that RNA biogenesis can be broadly altered in prostate cancers. Given these findings, targeting Pol I could provide means independent of known resistance mechanisms associated with the AR pathway inhibitors.
Several chemotherapeutic agents, such as topoisomerase I and poisons, act also as Pol I inhibitors.23 Actinomycin D (ActD) and CX-5461 are also known Pol I inhibitors.24,25 ActD exhibits nonspecific effects on both DNA and RNA and causes DNA damage, leading to toxicity and dose limitations.24 CX-5461, in addition to Pol I inhibition, has pleiotropic effects by binding G4 DNA structures26 and has shown efficacy against prostate cancer when combined with inhibitors of the PIM kinase.27 We have recently discovered a novel first-in-class small molecule, termed BMH-21, that targets Pol I.28 BMH-21 potently upregulates p53, but is not dependent upon its expression for inhibition of cell growth.28,29 This study evaluates the efficacy of BMH-21 in targeting prostate cancer cells in vitro and in preclinical xenograft and genetic prostate cancer mouse models.
2 |. MATERIALS AND METHODS
2.1 |. Cells and compounds
LNCaP (clone FGC), PC-3, and VCaP prostate cancer cells were purchased from American Type Culture Collection. The MR49F cell line was a kind gift from Dr Martin Gleave (Vancouver Prostate Center, Vancouver, BC). All cells were maintained at 37°C in a humidified atmosphere containing 5% CO2. LNCaP and PC-3 cells were cultured in the Roswell Park Memorial Institute-1640 (RPMI-1640) media supplemented with 10% fetal bovine serum (FBS) and VCaP cells were cultured in Dulbecco’s modified Eagle’s medium (DMEM) media supplemented with 10% FBS. The enzalutamide-resistant derivative of the LNCaP cell line, MR49F, was cultured in RPMI-1640 media supplemented with 10% FBS and 10 μM MDV3100.30 MDV3100 was purchased from SelleckChem (S1250; Houston, TX). All cell lines used were authenticated by short tandem repeat analyses at the Johns Hopkins Genetic Resources Core Facility. BMPC-1 cells were as in Markowski et al31 and were cultured in DMEM supplemented with 10% FBS.
BMH-21 was synthesized at the Drug Discovery Division, Lieber Institute (Baltimore, MD), and the chemical structure and purity were verified using liquid chromatography-mass spectrometry and proton nuclear magnetic resonance.
2.2 |. Antibodies
The following primary antibodies were used: RPA194 (C-1) and p53 (DO1) were purchased from Santa Cruz Biotechnology (Santa Cruz, CA). AR antibody (06-680) was from MilliporeSigma (Burlington, MA). β-Actin and GAPDH were purchased from Sigma Aldrich (St. Louis, MO). Ki67 was purchased from Leica (Wetzlar, Germany). Horseradish peroxidase (HRP)-conjugated secondary antibodies were from Agilent Dako (Santa Clara, CA). Powervision poly-HRP anti-mouse antibody was purchased from Leica (Wetzlar).
2.3 |. Cell growth and viability assays
For cell proliferation assays, cells were plated in six-well plates and treated with BMH-21 and/or MDV3100 for 48 to 72 hours. Cells were harvested and counted using Cellometer Auto T4 cell counter (St. Lawrence, MA). For cell viability assays, cells were seeded in 96-well plates, incubated with BMH-21 and/or MDV3100 for 48 to 72 hours and cell viability was determined with CellTiter-Blue (Madison, WI) according to manufacturer’s instructions.
2.4 |. Quantitative real-time polymerase chain reaction
Real-time quantitative polymerase chain reaction (qPCR) was performed as described earlier.28 RNA was extracted using TRIzol (Life Technologies, Carlsbad, CA), reverse transcribed to complementary DNA with SuperScript II (Invitrogen, Carlsbad), and amplified with primers for the specific genes or locations using ABI 7900 qPCR (Foster City, CA). rRNA transcription was assessed using primers specific to the 5’ETS region of the precursor rRNA. The primer sequences used in this study are as follows: 5′ETS: forward GAACGGTGGTGTGTCGTT, reverse GCGTCTCGTCTCGTCTCACT; KLK3: forward TTTCAGGTCAG CCACAGCTT, reverse GGGGTCAAGAACTCCTCTGG; TMPRSS2: forward CAGCAAGTGCTCCAACTCTG, reverse ACACAC CGATTCTCGTCCTC; NKX3.1: forward TTCTCCCACACTCAGG TGATC, reverse GTGAGCTTGAGGTTCTTGGC; AR: forward CCTGGCTTCCGCAACTTACAC, reverse GGACTTGTGCATGCG GTACTC.
p53: forward TCAAGACAGAAGGGCCTGAC, reverse CAAGGGT TCAAAGACCCAAA.
2.5 |. Immunofluorescence and imaging
Cells were seeded on glass coverslips in culture plates and treated with dimethyl sulfoxide or indicated concentrations of BMH-21 for the specified times. After treatment, cells were washed with phosphate-buffered saline (PBS) and fixed with 3.5% paraformaldehyde. Staining was performed as previously described.28 Briefly, cells were permeabilized with 0.5% NP-40, blocked in 3% bovine serum albumin, and incubated with primary antibody for 1 hour at room temperature and washed three times with PBS. The secondary antibody was incubated for 1 hour, washed three times with PBS, and DNA was stained with Hoechst 33352 (Sigma-Aldrich, St. Louis). Coverslips were mounted on glass slides using Vecta Mounting Media. Images were captured using a Zeiss Axioplan 2 epifluorescence microscope equipped with AxioCam HRC CCD-camera and AxioVision 4.5 software using EC Plan-Neofluar Õ20/0.5 objective (Zeiss, Germany). Brightfield images were acquired using the EVOS FL Auto microscope (ThermoFisher Scientific, Waltham, MA).
2.6 |. Immunoblotting
Briefly, protein lysate was collected from cells using radioimmunoprecipitation assay buffer and was quantified by bicinchoninic acid assay (Life Technologies, Carlsbad). A 20 μg of protein was mixed with 2X Laemmli buffer (Bio-Rad, Hercules, CA), boiled at 100°C for 10 minutes, and loaded into Tris-acetate sodium dodecyl sulfate-polyacrylamide gel electrophoresis gel and resolved at 100 V for 90 minutes. Proteins were transferred to polyvinylidene difluoride membrane, blocked with 5% milk in TBST at 4°C overnight with shaking. Following probing of the membrane with primary antibodies, HRP-conjugated secondary antibody (Agilent Dako) was added for 1 hour. Visualization was performed by enhanced chemiluminescence reagent (GE Amersham, UK) and imaged using a Bio-Rad Gel Doc+System (Bio-Rad).
2.7 |. In situ hybridization
Cells were fixed in neutral buffered 10% formalin for 72 hours. ACD RNAscope 2.0 Brown Kit (Advanced Cell Diagnostics, Newark, CA) was used for 45S rRNA chromogenic in situ hybridization. Hybridization was carried out as stated in the manufacturer’s protocol as described earlier.14
2.8 |. Small interfering RNA
LNCaP, VCaP, and PC-3 cells were transfected with control small interfering RNA (siRNA) or siRNAs that target p53 (Ambion Assay ID: S605 and S606), RPA194 (Ambion Assay ID: S405), or nontargeting control siRNA (Ambion Catalog Number 4390844) (ThermoFisher Scientific) with a final concentration of 10 nM using Lipofectamine RNAiMAX (ThermoFisher Scientific). Cells were incubated for 96 hours and harvested for subsequent analyses.
2.9 |. RNA-sequencing
LNCaP and MR49F cells were seeded and treated the following day with BMH-21 and total RNA was extracted with TRIzol (Life Technologies, Carlsbad). RNA was isolated from three biological experiments for each cell line. RNA-seq was conducted on Illumina NextSeq 500 sequencing platform at the Johns Hopkins Medical Institution Deep Sequencing and Microarray Core. The sequencing depth for each sample was approximately 50 million reads. Illumina’s CASAVA 1.8.4 was used to convert BCL files to FASTQ files using default parameters. rsem-1.2.9 was used for running the alignments as well as generating gene expression levels. The data were aligned to hg19 human reference genome using RefSeq annotation. rsem-1.2.9’s EBSeq was used for differential expression analysis on the gene level. “rsem-run-ebseq,” a R script provided by RNA-Seq by Expectation Maximization (RSEM) was used to run the EBSeq package. “rsem-control-FDR”“FDR_rate” script was used to control for the false discovery rate (FDR) at 0.05. Posterior probability of being equally expressed, the posterior probability of being differentially expressed, posterior fold change and real fold change were defined for all transcripts with FDR < 0.05. Pathway analyses were conducted using gene set enrichment analysis (GSEA).
2.10 |. Immunohistochemistry and quantitative analysis
Paraffin-embedded slides were stained for Ki67 at the Oncology Tissue Services Core Facility of Johns Hopkins University. Following staining, the slides were imaged using EVOS FL Auto microscope. Five fields were captured and the fraction of Ki67-positive area as compared to total tumor area was quantified using Frida image analysis software. Statistical analysis was calculated with GraphPad Prism v6 (San Diego, CA).
2.11 |. Xenograft study
For xenografts, Nu/Nu male nude mice (4-6 weeks old) were obtained from Charles Rivers (Wilmington, MA) and injected with MR49F cells (2 × 10⁶ cells in 10% Matrigel) in the left flank. The treatment protocol was approved by the University of Maryland, Baltimore County Institutional Animal Care and Use Committee (IACUC). Tumors were monitored until the cohort average was 150 mm3, at which point the mice were randomly assigned to treatment groups (N = 8 per group). The groups were vehicle, 40 mg/kg BMH-21 (intraperitoneal injection), 10 mg/kg MDV3100 (oral gavage), and combination of BMH-21 and MDV3100. These doses were selected based on previous studies demonstrating their activity and tolerance. Tumors were measured every 2 to 3 days using a caliper. Tumor volumes were calculated as follows: (length × width2/2). The study was terminated on day 28 as control animals reached the maximum allowable tumor size, except for the cohort receiving MDV3100, which were terminated on day 23 due to tumor growth reaching maximum allowed sizes. Each tumor was cut into two, with one-half snap-frozen for RNA extraction, while the other was fixed in formalin for immunohistochemistry analysis.
2.12 |. Genetic mouse model
The Hoxb13-MYC|Hoxb13-Cre|Ptenfl/fl mouse model (designated as BMPC) was generated as described earlier.32 Animals were housed and treated in accordance with the University of Maryland, Baltimore County IACUC approved animal protocols. Mice were randomized at 20 weeks of age and received a daily intraperitoneal injection of vehicle or BMH-21 (50 mg/kg) until death. At the end of this study, urogenital blocks were collected, weighed, and processed for hematoxylin and eosin staining. A pathologist (GG) assessed the histology of the urogenital blocks in a blinded fashion to determine the fraction of area involved with benign/normal prostate, preinvasive lesions (high grade prostatic intraepithelial neoplasia [PIN] and cribriform PIN/carcinoma in situ), or invasive adenocarcinoma as described.32
2.13 |. Statistics
Statistics were computed with GraphPad Prism 6 (San Diego) using the Student two-tailed t test, Mann-Whitney nonparametric t test, or one-way analysis of variance as indicated. N represents biological replicates unless otherwise stated. Data are presented as mean ± SD.
3 |. RESULTS
3.1 |. BMH-21 inhibits prostate cancer cell growth
We have previously shown that BMH-21 is a broad inhibitor of cancer cell growth across the NCI60 cancer cell line panel.28 To further examine the effectiveness of Pol I inhibition in prostate cancers, we used LNCaP, VCaP, and PC-3 cell lines. This panel included lines with the expression of AR-V7 (VCaP), androgen independence (PC-3), and mutations of TP53 (VCaP, PC-3). Cells were treated with BMH-21 at increasing concentrations over the course of 5 days. BMH-21 inhibited the growth of all cell lines in a dose-dependent manner (Figure 1A–C). The inhibitory concentrations of 50 (IC50) were 0.28, 0.19, and 0.18 μM in LNCaP, VCaP, and PC-3 cells, respectively.
FIGURE 1.
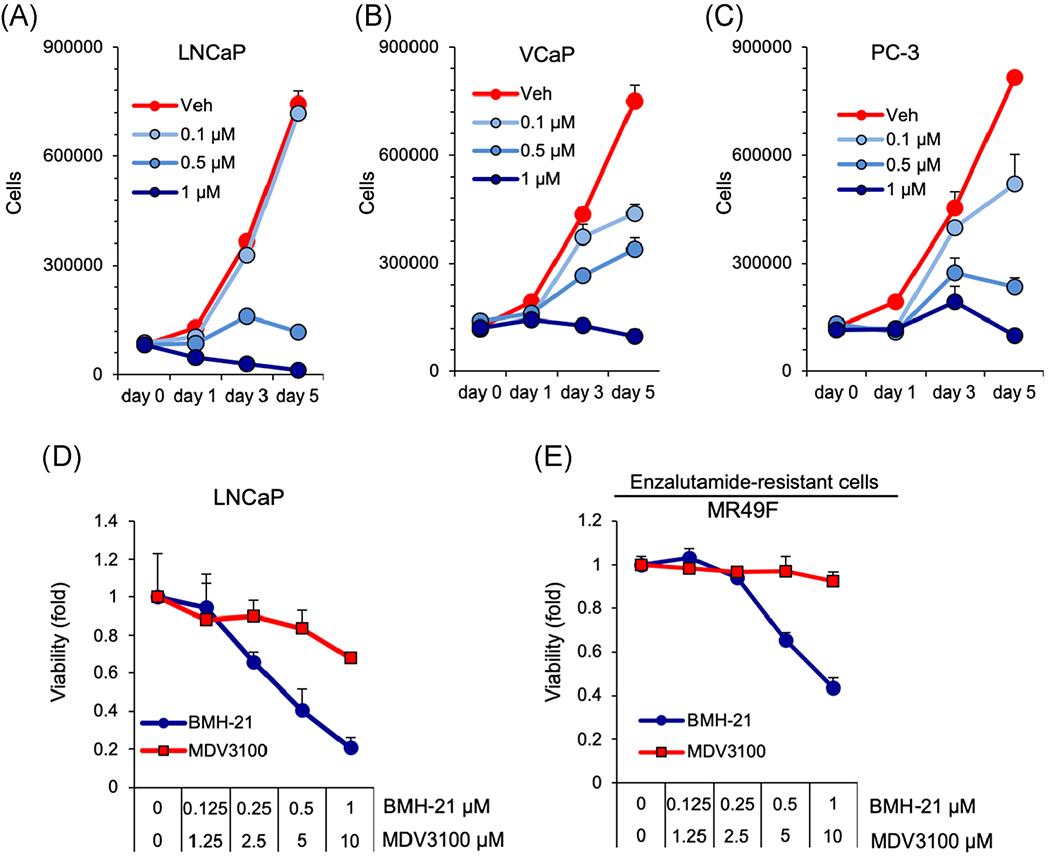
BMH-21 inhibits the growth of prostate cancer cell lines in a dose-dependent manner. A, LNCaP, B, VCaP, and C, PC-3 cells were treated with vehicle, 0.1, 0.5, or 1 μM BMH-21 for 1, 3, or 5 days, and cell numbers were counted (n = 3 biological replicates). D,E LNCaP and MR49F cells were treated with 0.1, 0.5, or 1 μM BMH-21 or 1.25, 2.5, 5, or 10 μM MDV3100 for 48 hours and cell viability was determined using WST1 assay [Color figure can be viewed at wileyonlinelibrary.com]
We also tested the effect of BMH-21 in an MDV3100 (enzalutamide)-resistant derivative of LNCaP, MR49F. The responses were monitored using a viability assay following 48 hours of treatment. BMH-21 decreased the viability of LNCaP and MR49F cells at IC50 0.46 and 0.73 μM, respectively, while MDV3100 had much lower potency in LNCaP cells and did not affect MR49F cells (Figure 1D and 1E). The results show that BMH-21 inhibits growth and viability of androgen-independent and MDV3100-resistant prostate cancer cell lines.
3.2 |. BMH-21 inhibits rRNA transcription in prostate cancer cell lines
Our previous studies show that BMH-21 is a potent inhibitor of Pol I transcription. To evaluate the efficacy of BMH-21 to inhibit Pol I activity specifically in prostate cancer, we treated the cells with BMH-21 (1 μM) for 24 hours, and performed qPCR using primers specific for the 5′ETS rRNA short-lived transcript. We observed prominent and significant repression of 5′ETS precursor rRNA in all cell lines tested (Figure 2A–D). We additionally tested the dose dependence of rRNA inhibition to BMH-21. We observed a dose-dependent decrease of rRNA transcription at an IC50 of 0.286, 0.09, and 0.216 μM in LNCaP, MR49F, and PC-3 cells, respectively (Figure 2E).
FIGURE 2.

Regulation of Pol I transcription by BMH-21. qPCR analysis of 5′ETS precursor rRNA transcript in A, LNCaP, B, MR49F, C, VCaP, and D, PC-3 cells after treatment with BMH-21 (1 μM) for 24 hours. Statistical analyses using nonparametric Mann-Whitney two-tailed t test, ***P < .001. n = 3 Biological replicates for each assay. E, LNCaP, MR49F, and PC-3 cells were treated with increasing concentrations of BMH-21 for 24 hours. qPCR analysis for 5′ETS rRNA transcript was conducted, and fold change as compared with vehicle-treated control is plotted using nonlinear regression analysis. The inhibitory concentration of 50 (IC50) for each cell line is shown. n = 3 biological replicates. F, 5′ETS/45S precursor rRNA in situ hybridization of LNCaP and MR49F cells treated with vehicle or BMH-21 (1 μM) for 24 hours. Note the exclusive nucleolar location of the signal. Scale bar = 50 μm. ETS, external transcribed spacer; Pol I, polymerase I; qPCR, quantitative polymerase chain reaction; rRNA, ribosomal RNA [Color figure can be viewed at wileyonlinelibrary.com]
We have recently developed an in situ hybridization assay for assessing 45S precursor rRNA transcripts in adherent cells and paraffin-embedded samples utilizing RNA probes specific for the 5′ ETS region.14 We treated LNCaP and MR49F cells with DMSO or BMH-21 (1 μM) for 24 hours and assessed the presence of 45S precursor rRNA transcript using this probe. We observed a prominent decrease in the 45S transcript signal (Figure 2F). This finding is concordant with the qPCR for 5′ETS rRNA.
3.3 |. Prostate cancer cell lines are dependent on Pol I transcription for viability
We next assessed the dependence of prostate cancer cell lines on Pol I transcription. To do so, we used siRNA to silence the expression of RPA194, the catalytic subunit in the Pol I complex. LNCaP, VCaP, and PC-3 cells were transfected with siRNAs targeting RPA194 and incubated for 72 hours. Knockdown of RPA194 protein was confirmed by western blot analysis and immunofluorescence staining of the cells (Figure 3A and 3B). In parallel, the assessment of rRNA transcription was measured by qPCR for the 5′ETS rRNA transcript and showed that it was decreased by approximately 80% in all cell lines (Figure 3C). We observed a significant decrease in the growth of LNCaP, VCaP, and PC-3 cells (P = .002, P = .011, and P = .022, respectively) (Figure 3D). To further assess the dependence of BMH-21 on RPA194, we proceeded to knockdown RPA194, treated the cells with increasing concentrations of BMH-21, and counted the cells. We chose to use PC-3 cells for this purpose given that this line does not express p53 that might interfere in this assay. Whereas cells transfected with control siRNA were robustly inhibited by BMH-21, cells in which RPA194 was knocked down were resistant (Figure 3E). These results show that the inhibition of Pol I transcription compromises the growth of prostate cancer cells and identifies Pol I as a potential therapeutic target.
FIGURE 3.

Depletion of Pol I catalytic subunit RPA194 recapitulates BMH-21 mediated response. LNCaP, VCaP, and PC-3 cells were transfected with control siRNA or siRNAs for RPA194 and incubated for 96 hours. A, Western blot analysis analysis of RPA194. B, Immunofluorescence analysis of RPA194. Scale bar 10 μm. C, qPCR analysis of 5′ETS precursor rRNA transcript (n = 3 biological replicates). D, Cell numbers were counted after 96 hours incubation (n = 3 biological replicates). E, PC-3 cells were transfected with the siRNAs and incubated for 48 hours followed by addition of increasing concentrations of BMH-21. After 48 hours, cells were counted. Fold change in cell number is shown and is plotted using nonlinear regression analysis. Statistical analyses using the Student two-tailed t test. Ctrl, control; ETS, external transcribed spacer; Pol I, polymerase I; qPCR, quantitative polymerase chain reaction; rRNA, ribosomal RNA; siRNA, small interfering RNA. **P < .01; *P < .05 [Color figure can be viewed at wileyonlinelibrary.com]
3.4 |. BMH-21-mediated inhibition of cell viability is independent of p53
p53 represses Pol I transcription and is also a sensor of Pol I transcription stress.33–35 Thus, p53 is a downstream target of Pol I inhibition by BMH-21.28,29 However, our previous studies have indicated that the activity of BMH-21 is independent of p53.28,29 Accordingly, as shown above, BMH-21 prominently repressed the growth of VCaP and PC-3 prostate cancer cells that harbor mutant TP53 (Figure 1B and 1C). To further test this in p53 wild-type LNCaP cells, we used siRNA to knockdown p53. We transfected LNCaP cells with p53 or control siRNAs and measured the efficiency of silencing by qPCR and western blot analysis (Figure 4A and 4B). Notably, the knockdown also abolished BMH-21-mediated stabilization of p53 (Figure 4A). Interestingly, p53 depletion led to an approximately threefold increase in the 5′ETS precursor rRNA transcript (Figure 4C). This observation is consistent with earlier publications showing that p53 represses Pol I transcription.19,33 The depletion of p53 led to a twofold increase in the cell number (Figure 4D). However, BMH-21 repressed Pol I transcription and growth in the p53 knockdown cells (Figure 4C and 4D). Taken together, BMH-21 effectively inhibits the growth of p53 knockdown cells suggesting a p53-independent mechanism in growth inhibition also in prostate cancer.
FIGURE 4.

BMH-21 mediated response is independent of p53. LNCaP cells were transfected with control siRNA or p53 siRNA and incubated for 48 hours followed by treatment with vehicle or BMH-21 (1 μM) for 24 hours. Thereafter, protein lysates were analyzed for A, p53 protein by western blot analysis; B, p53 transcript by qPCR; C, 5′ETS precursor rRNA transcript by qPCR; and D, cell numbers were counted. n = 3 biological replicates for each assay. Statistical analyses using the Student two-tailed t test. ETS, external transcribed spacer; ns, not significant; qPCR, quantitative polymerase chain reaction; rRNA, ribosomal RNA; siRNA, small interfering RNA. ****P < .0001, ***P < .001; **P < .01; *P < .05
3.5 |. RNA-seq analysis reveals distinct pathway profiles in response to BMH-21
Given that the inhibition of Pol I is likely to cause cell stress, we considered that it may additionally activate changes in the global cellular transcriptome. To better understand the downstream transcriptional response to BMH-21, we performed RNA-seq analysis. LNCaP and MR49F cells were treated with BMH-21 (1 μM) for 6 hours in three independent biological experiments and analyzed by RNA-seq. Overall, we observed 994 and 939 significantly up- and downregulated transcripts in LNCaP cells and 1240 and 1459 up- and downregulated transcripts in MR49F cells (Figure 5A). The distribution of up- and downregulated transcripts suggested that BMH-21 did not induce global repression of Pol II regulated transcripts. This finding is consistent with our previous analyses.28,29
FIGURE 5.

LNCaP and MR49F cells show dynamic RNA profiles after treatment with BMH-21. LNCaP and MR49F cells were analyzed by RNA-seq (n = 3 biological replicates). A, Log2 fold changes of significantly altered transcripts (FDR < 0.05). B,C, gene set enrichment analysis (GSEA) of RNA profiles in LNCaP and MR49F cells, respectively. Selected significantly altered pathways are shown. Normalized enrichment score (NES) and P values are shown. D,E, Selected transcripts and fold change in LNCaP cells and MR49F cells, respectively. All transcripts represent transcripts with FDR < 0.05. Ctrl, control; FDR, false discovery rate; NF-κB, nuclear factor-κB; RNA-seq, RNA-sequencing; TNF-α, tumor necrosis factor-α [Color figure can be viewed at wileyonlinelibrary.com]
Next, we performed GSEA on these datasets to identify key regulated pathways. Based on the analysis, we observed significant enrichment (P < .0001) of the p53, tumor necrosis factor-α (TNF-α), and apoptosis pathways in LNCaP (normalized enrichment score [NES]) 4.6, 3.3, and 2.5, respectively) and MR49F cells (NES 5.6, 3.2, and 2.5, respectively) (Figure 5B and 5C and Table S1). In addition, the androgen response pathway was negatively enriched in MR49F cells (NES −1.5), but this did not reach statistical significance. Further analysis of the dataset showed relevant and robust regulation of known transcripts in each pathway. These included p53 pathway genes, such as MDM2, CDKN1A, and GADD45A, TNF-α, and nuclear factor-κB (NF-κB) pathway genes, such as LIF, FOS, and TNF receptor family, and apoptosis pathway transcripts FAS, TRIAP1, BAX, and BIK1 (Figure 5D and 5E).
Given the trend of downregulation of the androgen response pathway in MR49F cells, including well-known targets, such as TMPRSS2, NKX3.1, and KLK3 (Figure 5D and 5E), we analyzed these using qPCR after BMH-21 or MDV3100 treatment in LNCaP and MR49F cells. We noted significant AR target gene repression in LNCaP cells by BMH-21 as well as by MDV3100 treatment (Figure 6A). However, BMH-21, but not MDV3100, was effective in suppressing AR target genes in MR49F cells (Figure 6B). We further assessed AR messenger RNA and protein in LNCaP and MR49F cells (and used PC-3 cells as a negative control for AR protein). We observe that treatment with BMH-21 somewhat diminishes both AR transcript (44%) and protein (30%; Figure 6C and 6D). Taken together, our comprehensive RNA-seq analysis determined that p53, stress, and apoptosis pathways were altered as a consequence of Pol I inhibition by BMH-21. To some extent, BMH-21 alters AR pathway but further studies are required to better understand this relationship.
FIGURE 6.

Alterations in AR target genes and AR transcript in LNCaP and MR49F cells. qPCR verification of AR target gene alterations in (A), LNCaP and (B), MR49F cells after BMH-21 (1 μM) or MDV3100 (10 μM) treatment. n = 3 biological replicates. Statistical analyses using nonparametric Mann-Whitney two-tailed t test. C, The indicated cell lines were treated with BMH-21 (1 μM) for 6 hours and cell lysates were analyzed by western blot analysis and quantified (D), based on two independent experiments. AR, androgen receptor; ns, not significant; qPCR, quantitative polymerase chain reaction [Color figure can be viewed at wileyonlinelibrary.com]
3.6 |. BMH-21 inhibits MDV3100-resistant tumor growth in vivo
To test preclinical translation of our compound in vivo, we used MR49F xenografts. BMH-21, but not MDV3100, treatment significantly decreased tumor volume (P <.002; Figure 7A). A combination treatment of BMH-21 and MDV3100 also significantly decreased tumor volume (P < .0001; Figure 7A). Mouse weights were monitored throughout the study, and decreases were noted in all cohorts including the control arm (6%, 18%, 6%, and 20% in the vehicle, BMH-21, MDV3100, and BMH-21+MDV3100, respectively). This indicated that alternative treatment protocols should be tested in subsequent studies to avoid potential toxicity. At the end of the treatments, tumors were collected, processed, and stained for Ki67 proliferation marker (Figure 7B). BMH-21 (P <.007) and combination (P < .0033) treatment significantly reduced Ki67 staining compared with vehicle and MDV3100 alone (Figure 7C). We then used qPCR to assess changes in 5′ETS precursor rRNA and AR targets KLK3, TMPRSS2, and NKX3.1. BMH-21 and the combination treatment inhibited the expression of 5′ETS precursor rRNA, KLK3, and TMPRSS2 transcripts (Figure 7D–F). In addition, combination treatment significantly repressed the expression of NKX3.1 in the resected tumors whereas MDV3100 alone had no effect (Figure 7G). These data suggest BMH-21, either alone or in combination with MDV3100 effectively inhibits growth and possibly alters the androgen response pathway in treatment-resistant prostate cancer tumors.
FIGURE 7.
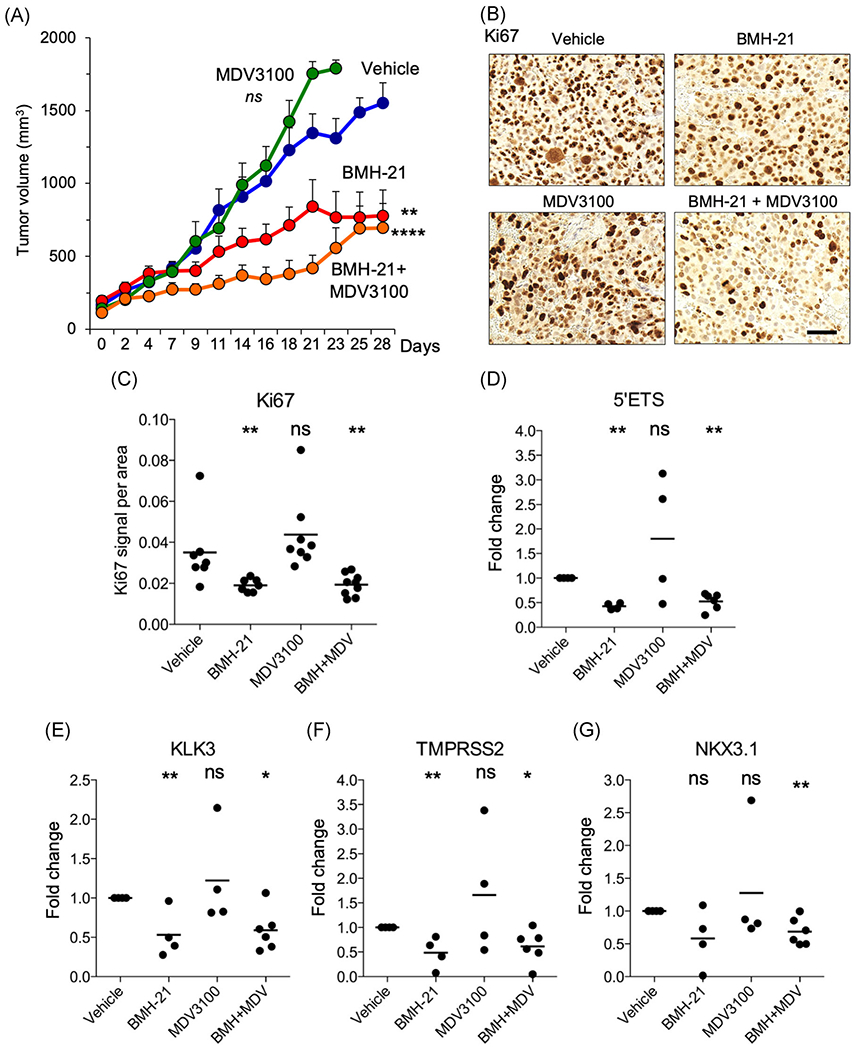
BMH-21 inhibits tumor growth in enzalutamide-resistant MR49F tumor xenografts. Nude mice were implanted with MR49F cells. When tumors reached a mean volume of 150 mm3, mice were randomly assigned to treatment groups (n = 7 mice per group) of vehicle, MDV3100 (10 mg/kg), BMH-21 (40 mg/kg), or BMH-21 and MDV3100 and treated daily up to 28 days or until the tumor reached maximum allotted size. A, Tumor volumes (mm3). Statistical analysis using two-way ANOVA. B, Immunohistochemical analysis of tumors for Ki67 proliferation index marker and C, quantification of Ki67 staining. D, 5′ETS precursor rRNA transcript. E-G, qPCR for androgen receptor target genes. D,E, Data are plotted as fold change compared with vehicle control. Statistical analysis using nonparametric Mann-Whitney two-tailed t test. ANOVA, analysis of variance; ETS, external transcribed spacer; ns, not significant; qPCR, quantitative polymerase chain reaction; rRNA, ribosomal RNA. ****P < .0001, ***P < .001; **P < .01; *P < .05 [Color figure can be viewed at wileyonlinelibrary.com]
3.7 |. BMH-21 inhibits prostate cancer development in a genetic mouse model
To further understand the role of BMH-21 in prostate tumorigenesis in another preclinical prostate cancer model, we used the Hoxb13-MYC|Hoxb13-Cre|Ptenfl/fl (BMPC) mouse prostate cancer model in which the development of aggressive tumors is detected at 16 to 20 weeks of age.32 The BMPC mice develop castration resistance and lose expression of AR around 20 weeks of age. As observed in Figure 7C, cells isolated from BMPC tumors31 had negligible AR expression. We then treated BMPC-1 cells with BMH-21 for 48 hours. We observed a robust reduction in their growth (Figure 8A). To explore the potential of BMH-21 to repress tumor growth on these established tumors, we initiated treatments using an intraperitoneal administration of BMH-21 at 50 mg/kg at the age of 20 weeks and followed individual mice until the palpable tumor burden reached a euthanasia endpoint (Figure 8B). There was no statistical difference between the survival of vehicle and BMH-21 treated mice (Figure 8C). However, we observed that BMH-21 treatment significantly reduced the tumor burden as measured by urogenital block size compared to vehicle control (Figure 8C). Histological analysis of the urogenital block also demonstrated a reduction in invasion compared to vehicle control (Figure 8D and 8E). The findings from this genetic mouse model suggest that BMH-21 may be a potential first-in-class molecule that is able to inhibit prostate tumorigenesis.
FIGURE 8.

BMH-21 suppresses prostate cancer development in BMPC genetic prostate cancer model. A, BMPC-1 cells were treated with increasing concentrations of BMH-21 for 48 hours followed by counting of the cells. n = 3 biological replicates. B, BMPC mice develop aggressive tumors characterized by invasion, metastasis, genomic instability, and castration resistance starting from 16 weeks of age. Treatment scheme: mice were treated daily with vehicle or BMH-21 (50 mg/kg) using intraperitoneal injection starting at the age of 20 weeks until death. C, Lifespan of the mice on the study and urogenital blocks collected and weighed at the end of the study. ns, P > .05; **P < .01, Mann-Whitney nonparametric t test. n = 7 (vehicle), n = 13 (BMH-21). D, Histopathological analysis of urogenital blocks. Each region was classified as noninvasive (benign, PIN, cribiform PIN/carcinoma in situ) or invasive adenocarcinoma in a blinded fashion. n = 473 total regions analyzed. E, Representative images and histology of urogenital blocks from mice receiving vehicle or BMH-21 treatment and stained with H&E. Scale bar = 100 μm. H&E, hematoxylin and eosin; ns, not significant, PIN, prostatic intraepithelial neoplasia [Color figure can be viewed at wileyonlinelibrary.com]
4 |. DISCUSSION
New targets and therapeutic interventions are needed for advanced and treatment-resistant prostate cancers. Given that RNA Pol I activity is upregulated in prostate cancers and essential for the increased proteosynthetic demands of cancer cells it presents as an attractive therapeutic target.13 In this study, we have demonstrated the effectiveness of BMH-21, a novel first-in-class small molecule inhibitor of Pol I transcription to inhibit the growth of prostate cancer cells and tumors of different genetic backgrounds and in therapy resistance. BMH-21 causes a block in Pol I transcription, resulting in rapid inhibition of transcription and consequent nucleolar stress evident by translocation of nucleolar proteins.28,36 Other less selective Pol I inhibitors, such as ActD37 and CX-5461 have also been tested in prostate cancers. CX-5461 targets Pol I, upregulates the expression of p53, and acts synergistically with PIM1 inhibition to block proliferation and suppression of prostate tumorigenesis.25,27 However, CX-5461 causes DNA damage by stabilizing G-quadruplex structures.26 In contrast, BMH-21 does not cause DNA damage, blocks transcription, and the enzyme activity, and, hence, differs mechanistically from other indirect Pol I inhibitors.28,36,38 These differences in mechanisms of action are relevant to consider in potential patient selection strategies.
Here, we show that Pol I inhibitor BMH-21 decreased prostate cancer cell growth in prostate cancer cell lines with different genetic backgrounds in a dose-dependent manner. These included lines with and without p53 and diverse alterations in AR including lines with AR null, AR activating mutations, AR-V7 variant expression, and a cell line with resistance to the competitive AR inhibitor MDV3100. We analyzed pre-rRNA 5′ ETS transcript and documented dose-dependent decreases in precursor rRNA transcription in LNCaP, PC-3, and MR49F cells, and corroborated these studies using in situ hybridization with a probe against the precursor rRNA. Furthermore, using RNA interference (RNAi) against Pol I catalytic subunit RPA194, we recapitulated our previous findings that siRNA mediated knockdown of Pol I is essential also for prostate cancer cell growth and responsiveness to BMH-21. Finally, to assess whether the repression of growth was p53 dependent, we used RNAi against p53 and observed, as shown in previous studies,19,33 that Pol I transcription was substantially increased following p53 knockdown. Despite this, cell growth was effectively inhibited by the Pol I inhibitor. These findings indicated that Pol I inhibitory strategy was effective regardless of the common events that are associated with treatment resistance and castration resistance. This is promising for positioning BMH-21 toward a variety of genetically diverse prostate cancer subtypes.
We have earlier shown that BMH-21 is not a broad inhibitor of RNA Pol II transcription, but also noted alterations in several cell stress pathways.28,29 To further understand the effect BMH-21 has on prostate cancer cell lines, we utilized RNA-seq to query the impact of Pol I inhibition on other cellular programs. Strikingly, we did not observe the global repression of Pol II-dependent transcripts. Instead, GSEA revealed a number of pathways affected by Pol I inhibition, including the expected activation of the p53 pathway. We also observed activation of the NF-κβ and apoptosis pathways, which is consistent both with the activation of cell stress and p53 pathways. Unexpectedly, we found that several AR target genes were downregulated in the MR49F cells, although the NES did not reach statistical significance. We verified these findings using qPCR and observed that three core AR-dependent transcripts were downregulated in both LNCaP and MDV3100 cells. We also observed that BMH-21 moderately decreased both AR transcript and protein. These findings are notable given that MR49F cells are resistant to MDV3100, suggesting that the treatment resistance could be overcome by alternative strategies. Several previous studies have explored a potential connection between Pol I transcription and the AR pathway.21,22,39,40 These studies are compromised by the inability to distinguish between the effects of AR and Pol I on growth and differentiation of the prostate cancer cells, and lack of a satisfactory mechanistic model. For example, nucleophosmin, a nucleolar histone chaperone involved in late stages of ribosome biogenesis has been suggested to bind to androgen response elements, but its role in promoting deregulated AR activity or therapy resistance requires further confirmation.40 With keeping that in mind, this warrants further investigation to elucidate whether Pol I and AR signaling pathways are connected, the extent of AR transcriptomic changes by BMH-21, and mechanisms involved.
To assess the activity of BMH-21 in vivo, we tested the efficacy of BMH-21 in MDV3100-resistant tumor xenografts. BMH-21 significantly decreased tumor growth. We also tested the combination of BMH-21 and MDV3100 but were not able to discern differences in comparison to BMH-21 treatment alone. Analysis of the tumors showed a substantial decrease in Pol I transcription and Ki67 proliferation index marker. Also, the expression of KLK3 and TMPRSS2 was decreased. We further tested the effect of BMH-21 in the prostate epithelium of a triple transgenic model that utilizes overexpressed Myc and Pten loss under control of the Hoxb13 promoter. These mice were enrolled on either the Pol I inhibitor or vehicle treatment at 20 weeks of age when the tumors have developed. BMH-21 effectively reduced urogenital block size and invasiveness in these mice, providing further confidence to position BMH-21 as a potential treatment modality for prostate cancer. Although previous studies showed BMH-21 has a promising anticancer activity,28,41 this study is the first to show that BMH-21 is effective in treatment-resistant tumors in the preclinical setting.
5 |. CONCLUSION
Treatment resistance to current therapies such as antiandrogens is a persistent problem in managing prostate cancer in the clinic.42,43 Moreover, prostate cancers present with multiple genetic abnormalities and subclasses of disease.44 In metastatic disease, patients present with a remarkable variability of the genetic composition of the individual metastases presenting a major therapeutic challenge for adequate targeting. Given these considerations, an attractive option is to engage a fundamental target that the cancer cells depend on. Ribosome biogenesis is absolutely essential for cancer cell growth. Moreover, Pol I transcription, the key upstream step governing the process is nonredundant and offers no opportunity for typical substitutive processes, such as adaptation, compensation, or evolution. We have previously demonstrated that Pol I activity is highly upregulated in prostate cancer. In this study, we demonstrate the effectiveness of a unique Pol I inhibitor in treatment-resistant prostate cancer using in vitro and preclinical models. Further studies are required to assess the utility of Pol I inhibition in the treatment of prostate cancers and during treatment resistance and advanced disease.
Supplementary Material
ACKNOWLEDGMENTS
This study was supported by the Prostate Cancer Foundation 2014 Safeway Foundation-PCF Challenge Award, NIH P30 CA006973 (to ML and AMDM), NIH/NCI Prostate SPORE P50CA058236, Harrington Discovery Institute, and Patrick C. Walsh Prostate Cancer Research Fund.
Funding information
NIH/NCI Prostate SPORE, Grant/Award Number: P50CA058236; Patrick C. Walsh Prostate Cancer Research Fund; NIH, Grant/Award Number: P30 CA006973; Prostate Cancer Foundation 2014 Safeway Foundation-PCF Challenge Award
Footnotes
CONFLICT OF INTERESTS
ML holds patents on BMH-21, which are managed by the Johns Hopkins University. The other authors declare that there are no conflict of interests.
SUPPORTING INFORMATION
Additional supporting information may be found online in the Supporting Information section.
REFERENCES
- 1.Yadav SS, Stockert JA, Hackert V, Yadav KK, Tewari AK. Intratumor heterogeneity in prostate cancer. Urol Oncol. 2018;36:349–360. [DOI] [PubMed] [Google Scholar]
- 2.Dean JL, Knudsen KE. The role of tumor suppressor dysregulation in prostate cancer progression. Curr Drug Targets. 2013;14:460–471. [DOI] [PubMed] [Google Scholar]
- 3.Koh CM, Bieberich CJ, Dang CV, Nelson WG, Yegnasubramanian S, De Marzo AM. MYC and prostate cancer. Genes & Cancer. 2010;1:617–628. [DOI] [PMC free article] [PubMed] [Google Scholar]
- 4.Dang CV. MYC on the path to cancer. Cell. 2012;149:22–35. [DOI] [PMC free article] [PubMed] [Google Scholar]
- 5.Ruggero D. Revisiting the nucleolus: from marker to dynamic integrator of cancer signaling. Sci Signal. 2012;5:pe38. [DOI] [PMC free article] [PubMed] [Google Scholar]
- 6.Bywater MJ, Pearson RB, McArthur GA, Hannan RD. Dysregulation of the basal RNA polymerase transcription apparatus in cancer. Nat Rev Cancer. 2013;13:299–314. [DOI] [PubMed] [Google Scholar]
- 7.Haag JR, Pikaard CS. RNA polymerase I: a multifunctional molecular machine. Cell. 2007;131:1224–1225. [DOI] [PubMed] [Google Scholar]
- 8.Grummt I. Wisely chosen paths-regulation of rRNA synthesis. FEBS J. 2010;277:4626–4639. [DOI] [PubMed] [Google Scholar]
- 9.Moss T, Langlois F, Gagnon-Kugler T, Stefanovsky V. A housekeeper with power of attorney: the rRNA genes in ribosome biogenesis. Cell Mol Life Sci. 2007;64:29–49. [DOI] [PMC free article] [PubMed] [Google Scholar]
- 10.Engel C, Neyer S, Cramer P. Distinct mechanisms of transcription initiation by RNA polymerases I and II. Annu Rev Biophys. 2018;47:425–446. [DOI] [PubMed] [Google Scholar]
- 11.Russell J, Zomerdijk JC. The RNA polymerase I transcription machinery. Biochem Soc Symp. 2006;73:203–216. [DOI] [PMC free article] [PubMed] [Google Scholar]
- 12.Nuhn P, De Bono JS, Fizazi K, et al. Update on systemic prostate cancer therapies: management of metastatic castration-resistant prostate cancer in the era of precision oncology. Eur Urol. 2019;75(1):88–99. [DOI] [PubMed] [Google Scholar]
- 13.Uemura M, Zheng Q, Koh CM, Nelson WG, Yegnasubramanian S, De Marzo AM. Overexpression of ribosomal RNA in prostate cancer is common but not linked to rDNA promoter hypomethylation. Oncogene. 2012;31:1254–1263. [DOI] [PMC free article] [PubMed] [Google Scholar]
- 14.Guner G, Sirajuddin P, Zheng Q, et al. Novel assay to detect RNA polymerase I activity in vivo. Mol Cancer Res. 2017;15:577–584. [DOI] [PMC free article] [PubMed] [Google Scholar]
- 15.Arabi A, Wu S, Ridderstråle K, et al. c-Myc associates with ribosomal DNA and activates RNA polymerase I transcription. Nat Cell Biol. 2005;7:303–310. [DOI] [PubMed] [Google Scholar]
- 16.Chan JC, Hannan KM, Riddell K, et al. AKT promotes rRNA synthesis and cooperates with c-MYC to stimulate ribosome biogenesis in cancer. Sci Signal. 2011;4:ra56. [DOI] [PubMed] [Google Scholar]
- 17.Zhao J, Yuan X, Frödin M, Grummt I. ERK-dependent phosphorylation of the transcription initiation factor TIF-IA is required for RNA polymerase I transcription and cell growth. Mol Cell. 2003;11:405–413. [DOI] [PubMed] [Google Scholar]
- 18.Zhang C, Comai L, Johnson DL. PTEN represses RNA polymerase I transcription by disrupting the SL1 complex. Mol Cell Biol. 2005;25:6899–6911. [DOI] [PMC free article] [PubMed] [Google Scholar]
- 19.Zhai W, Comai L. Repression of RNA polymerase I transcription by the tumor suppressor p53. Mol Cell Biol. 2000;20:5930–5938. [DOI] [PMC free article] [PubMed] [Google Scholar]
- 20.Voit R, Schäfer K, Grummt I. Mechanism of repression of RNA polymerase I transcription by the retinoblastoma protein. Mol Cell Biol. 1997;17:4230–4237. [DOI] [PMC free article] [PubMed] [Google Scholar]
- 21.Ray S, Johnston R, Campbell DC, et al. Androgens and estrogens stimulate ribosome biogenesis in prostate and breast cancer cells in receptor dependent manner. Gene. 2013;526:46–53. [DOI] [PubMed] [Google Scholar]
- 22.Suzuki N, Urata M, Miyauchi T, Wakisaka M, Shimazaki J, Hosoya T. In vivo effect of androgen on RNA synthesis in nuclei from androgen-independent subline of Sionogi carcinoma (CS 2). Endocrinol Jpn. 1983;30:657–661. [DOI] [PubMed] [Google Scholar]
- 23.Burger K, Mühl B, Harasim T, et al. Chemotherapeutic drugs inhibit ribosome biogenesis at various levels. J Biol Chem. 2010;285:12416–12425. [DOI] [PMC free article] [PubMed] [Google Scholar]
- 24.Hadjiolova KV, Hadjiolov AA, Bachellerie JP. Actinomycin D stimulates the transcription of rRNA minigenes transfected into mouse cells. Implications for the in vivo hypersensitivity of rRNA gene transcription. Eur J Biochem. 1995;228:605–615. [DOI] [PubMed] [Google Scholar]
- 25.Drygin D, Lin A, Bliesath J, et al. Targeting RNA polymerase I with an oral small molecule CX-5461 inhibits ribosomal RNA synthesis and solid tumor growth. Cancer Res. 2011;71:1418–1430. [DOI] [PubMed] [Google Scholar]
- 26.Xu H, Di Antonio M, McKinney S, et al. CX-5461 is a DNA G-quadruplex stabilizer with selective lethality in BRCA1/2 deficient tumours. Nat Commun. 2017;8:14432. [DOI] [PMC free article] [PubMed] [Google Scholar]
- 27.Rebello RJ, Kusnadi E, Cameron DP, et al. The dual inhibition of RNA Pol I transcription and PIM kinase as a new therapeutic approach to treat advanced prostate cancer. Clin Cancer Res. 2016;22:5539–5552. [DOI] [PubMed] [Google Scholar]
- 28.Peltonen K, Colis L, Liu H, et al. A targeting modality for destruction of RNA polymerase I that possesses anticancer activity. Cancer Cell. 2014;25:77–90. [DOI] [PMC free article] [PubMed] [Google Scholar]
- 29.Peltonen K, Colis L, Liu H, et al. Identification of novel p53 pathway activating small-molecule compounds reveals unexpected similarities with known therapeutic agents. PLOS One. 2010;5:e12996. [DOI] [PMC free article] [PubMed] [Google Scholar]
- 30.Toren PJ, Kim S, Pham S, et al. Anticancer activity of a novel selective CYP17A1 inhibitor in preclinical models of castrate-resistant prostate cancer. Mol Cancer Ther. 2015;14:59–69. [DOI] [PubMed] [Google Scholar]
- 31.Markowski MC, Hubbard GK, Hicks JL, et al. Characterization of novel cell lines derived from a MYC-driven murine model of lethal metastatic adenocarcinoma of the prostate. The Prostate. 2018;78:992–1000. [DOI] [PMC free article] [PubMed] [Google Scholar]
- 32.Hubbard GK, Mutton LN, Khalili M, et al. Combined MYC activation and Pten loss are sufficient to create genomic instability and lethal metastatic prostate cancer. Cancer Res. 2016;76:283–292. [DOI] [PMC free article] [PubMed] [Google Scholar]
- 33.Budde A, Grummt I. p53 represses ribosomal gene transcription. Oncogene. 1999;18:1119–1124. [DOI] [PubMed] [Google Scholar]
- 34.Boulon S, Westman BJ, Hutten S, Boisvert FM, Lamond AI. The nucleolus under stress. Mol Cell. 2010;40:216–227. [DOI] [PMC free article] [PubMed] [Google Scholar]
- 35.Golomb L, Volarevic S, Oren M. p53 and ribosome biogenesis stress: the essentials. FEBS Lett. 2014;588:2571–2579. [DOI] [PubMed] [Google Scholar]
- 36.Wei T, Najmi SM, Liu H, et al. Small-molecule targeting of RNA polymerase I activates a conserved transcription elongation checkpoint. Cell Rep. 2018;23:404–414. [DOI] [PMC free article] [PubMed] [Google Scholar]
- 37.Paramanathan T, Vladescu I, McCauley MJ, Rouzina I, Williams MC. Force spectroscopy reveals the DNA structural dynamics that govern the slow binding of actinomycin D. Nucleic Acids Res. 2012;40:4925–4932. [DOI] [PMC free article] [PubMed] [Google Scholar]
- 38.Colis L, Peltonen K, Sirajuddin P, et al. DNA intercalator BMH-21 inhibits RNA polymerase I independent of DNA damage response. Oncotarget. 2014;5:4361–4369. [DOI] [PMC free article] [PubMed] [Google Scholar]
- 39.Kabler RL, Srinivasan A, Taylor LJ, Mowad J, Rothblum LI, Cavanaugh AH. Androgen regulation of ribosomal RNA synthesis in LNCaP cells and rat prostate. J Steroid Biochem Mol Biol. 1996;59:431–439. [DOI] [PubMed] [Google Scholar]
- 40.Léotoing L, Meunier L, Manin M, et al. Influence of nucleophosmin/B23 on DNA binding and transcriptional activity of the androgen receptor in prostate cancer cell. Oncogene. 2008;27:2858–2867. [DOI] [PubMed] [Google Scholar]
- 41.Fu X, Xu L, Qi L, et al. BMH-21 inhibits viability and induces apoptosis by p53-dependent nucleolar stress responses in SKOV3 ovarian cancer cells. Oncol Rep. 2017;38(2):859–865. [DOI] [PMC free article] [PubMed] [Google Scholar]
- 42.Antonarakis ES, Lu C, Wang H, et al. AR-V7 and resistance to enzalutamide and abiraterone in prostate cancer. N Engl J Med. 2014;371:1028–1038. [DOI] [PMC free article] [PubMed] [Google Scholar]
- 43.Miyahira AK, Den RB, Carlo MI, et al. Tumor cell heterogeneity and resistance; report from the 2018 Coffey-Holden prostate cancer academy meeting. The Prostate. 2019;79:244–258. [DOI] [PubMed] [Google Scholar]
- 44.Armenia J, Wankowicz SAM, Liu D, et al. The long tail of oncogenic drivers in prostate cancer. Nat Genet. 2018;50:645–651. [DOI] [PMC free article] [PubMed] [Google Scholar]
Associated Data
This section collects any data citations, data availability statements, or supplementary materials included in this article.