Abstract
Metabolomics is a powerful systems biology approach that monitors changes in biomolecule concentrations to diagnose and monitor health and disease. The leading metabolomics technologies, such as NMR and mass spectrometry (MS), currently access only a small portion of the metabolome, suggesting that new technologies with orthogonal and chemically specific capabilities can provide increased metabolome coverage and further advance the diagnostic power of metabolomics. Here we report a novel approach using the high sensitivity and chemical specificity of surface enhanced Raman scattering (SERS) for online detection of metabolites from tumor lysates following liquid chromatography (LC). Our results demonstrate that this LC-SERS approach has metabolite detection capabilities comparable to the state-of-art LC-MS but suggest a selectivity for the detection of a different subset of metabolites. Analysis of replicate LC-SERS experiments exhibit reproducible metabolite patterns that we convert into barcodes, which can differentiate different tumor models. Our work demonstrates the potential of LC-SERS technology for metabolomics-based diagnosis and treatment of cancer.
Keywords: Surface-Enhanced Raman Scattering, LC-SERS, Tumor, Metabolomics, Metabolic Fingerprinting
Graphical Abstract
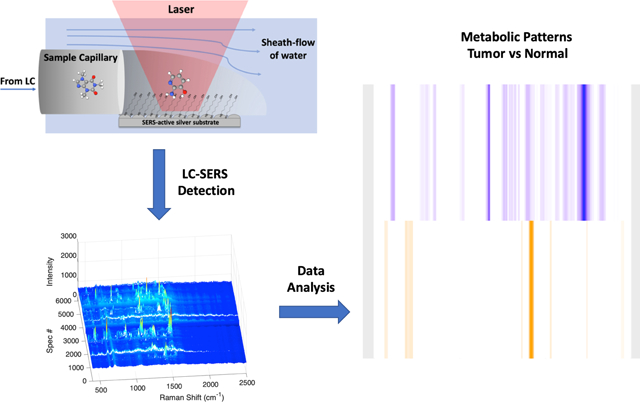
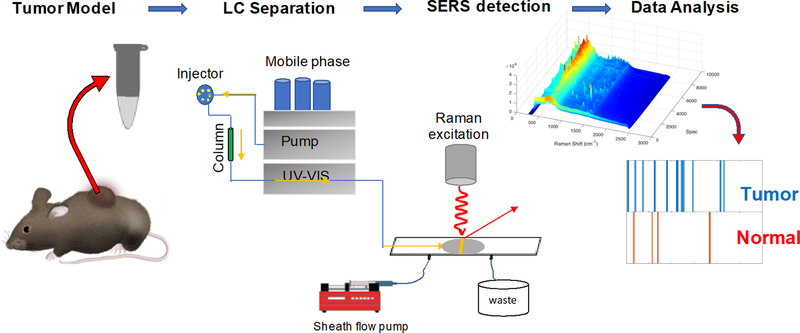
This is the first demonstration of surface-enhanced Raman scattering (SERS) for untargeted tumor metabolomics. Metabolic fingerprinting with SERS is a promising approach to capturing biological and metabolic information without the requirement of absolute metabolite identification, which can leverage the use of previously discarded data of unidentified metabolites for tumor metabolomics.
For decades, cancer research has investigated effective screening methods for early cancer detection and treatment, identifying biomarker molecules representative of a cancer’s phenotype and possible therapeutic targets. Systems biology approaches, including genomics, transcriptomics, proteomics, and metabolomics, have emerged as promising routes to study their global profiles within cancer and other human diseases.[1–3] Among these “omics” techniques, metabolomics is becoming an increasingly popular tool for cancer diagnostic and biomarker discovery,[4, 5] since the metabolome is considered most representative of a specific disease phenotype. Despite the rapidly growing interest and promising potential of metabolomics in cancer biomarker discovery, the challenge of metabolite identification is tremendous. Less than 2% of the recorded mass spectra in metabolomics experiments can be attributed to specific known metabolites, with the remainder being unidentified.[6] Improved diagnostics in cancer metabolomics that quantify and distinguish these unidentified metabolites may result in significant indicators relevant to disease.
The current state-of-the art technologies in metabolomics are nuclear magnetic resonance spectroscopy (NMR)[7–9] and mass spectrometry (MS).[10–12] NMR benefits from its superb deconvolution power that allows universal identification and quantification of individual metabolites in their native states. However, NMR suffers from low sensitivity and typically requires millimolar concentrations of an analyte and milliliter sample volumes for detection,[13] which are difficult to obtain for many biological samples. MS, coupled with chromatography techniques (e.g. LC and GC), has achieved detection at concentrations as low as nanomolar.[14] In particular, the development of nanoflow LC systems has enabled MS investigations of high-value biological samples with nanoliter volumes.[15, 16] However, certain classes of molecules, such as structural isomers and poorly ionizing molecules, present challenges for MS-based metabolomics, which may comprise many of the unidentified metabolite features. Orthogonal and chemically specific detection methods with sensitivity comparable to MS would provide additional detection, characterization, and diagnostic power.
Surface-enhanced Raman scattering (SERS) is a promising technique for biomedical diagnostics because it produces chemically specific signals and can push the limit of detection down to the single-molecule level.[17] In SERS, plasmonic nanostructures are used as signal amplifiers to selectively enhance the weak Raman scattering of molecules when they are within a few nanometers of a plasmonic nanostructure. Nanoparticle colloids and nanostructured surfaces have been used to produce highly enhanced SERS signals for metabolite identification in solution.[18–20] However, effective transport of metabolites close to enhancing nanostructures is a challenge.[21] The observed spectra often vary, depending on the specific nanostructures that give rise to the enhanced Raman signal.[22] In addition, interactions with the surface often cause irreversible adsorption, or fouling. Our laboratory recently demonstrated the use of hydrodynamic focusing by a fast sheath flow to improve mass transport and the efficiency of SERS detection in solution on planar substrates.[23] By confining analyte molecules near the SERS substrate, the limit of detection was more than 1000-fold improved. In proof-of-concept experiments, the detection and disappearance of rhodamine was observed, which indicates fouling is avoidable.[23] In addition, coupling the sheath-flow SERS approach with chromatography techniques (e.g. CZE and LC) allows for sequential detection of low concentration analytes, such as amino acids,[24] peptides,[25] b-vitamins,[26] and phosphorylated sugars.[27] In our most recent work, phosphorylated sugars were identified and quantified in the presence of cell culture media, suggesting complex biological matrices are feasible to use as analytes.[27]
In this study, we demonstrate the use of LC-SERS with sheath flow confinement to detect distinct changes in metabolites from cell lysate samples of tumors. MMTV-Wnt1 and C3-TAg mouse tumor models are used in this study due to their upregulated metabolite levels.[28] We show SERS is comparable to MS for metabolite detection but has different sensitivity to certain metabolites. Furthermore, SERS has the potential to classify tumor and normal samples based on the detected metabolite patterns, also known as metabolic fingerprinting.[29] This approach is typically used as a preliminary measure before a more comprehensive analysis to find discriminatory patterns among groups of samples, which has been applied, in recent years, in NMR- and MS-based metabolomics studies for disease diagnostics.[30–34] To our knowledge, this is the first report to use SERS for untargeted tumor metabolic fingerprinting.
In our experimental approach (Scheme 1), the sheath-flow SERS detector is connected to a nanoflow LC system with a flow rate of 300 nL/min. A faster moving sheath fluid (30 μL/min) is introduced to the flow cell that confines the eluting molecules to the surface of the SERS active Ag nanostructured substrate. We previously found enhanced signal with the analyte confinement of sheath-flow.[23] For each LC-SERS run, a 1μL sample of metabolites extracted from primary tissue was injected and separated over a 20 min LC run monitored by the sequential acquisition of 6000 SERS spectra, acquired with a 0.2 second per spectrum. Details of the sample preparation are provided in the supplementary materials. Because of the signal enhancement from the SERS substrate, we were able to use small sample volumes and short acquisition times for high-throughput chemical analysis.
Scheme 1.
Schematic illustration of the LC-SERS based metabolic fingerprinting. Metabolites extracted from mouse tumors are separated by HPLC and detected using sheath-flow SERS. A series of SERS spectra at each retention time are used to generate a barcode indicative of a tumor or normal tissue.
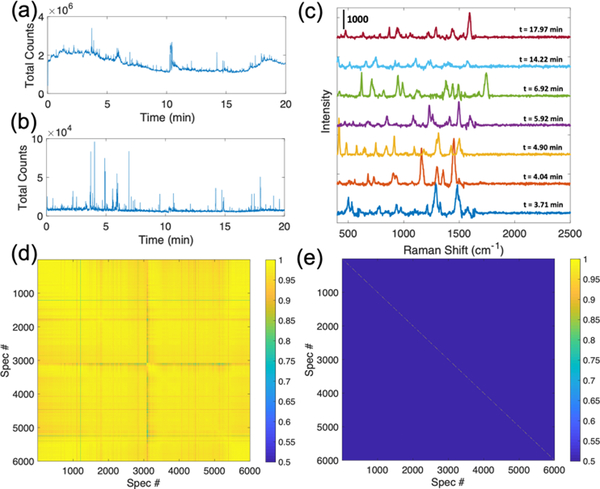
LC-SERS analysis of a MMTV-Wnt1 tumor sample demonstrate the detection of metabolites within the complex tumor samples (Figure 1). The SERS chromatogram shows sharp peaks at different separation times, with each peak representing a spectrum detected at different elution times from the chromatography. The raw SERS chromatogram shows high and variable background signal (Figure 1a), which causes issues in signal identification. Data comparison algorithms recognize changes in the background over the lower intensity signal from the eluting analytes. We developed an algorithm that corrects the background and facilitates spectral identification (see supporting information). This algorithm assumes that SERS signals from analytes are spectral features with sharp peaks (peak width < 50 cm−1), which are typical for a SERS spectrum, and appear transiently (time duration < 10 seconds) in the SERS chromatogram, consistent with previous work.[27] The background-removed SERS chromatogram includes numerous spiked features that are reflective of the high intensity SERS signals being detected (Figure 1b). Distinct spectra are observed at different elution times as shown in Figure 1c, indicating that different molecules are detected throughout the LC separation. The Pearson correlation coefficient is used as a similarity metric to compare different spectra and to identify the unique signals within a SERS dataset. Given that SERS signals arise from the brief time period (less than 10 seconds) when metabolites interact with the substrate, consecutive highly similar spectra (Corr. Coef. > 0.5) are considered to originate from the same analyte, which we called a “unique” signal. The cross-correlation diagram (Figure 1d) of the raw SERS data (from Figure 1a) shows an ultra-high similarity (Corr. Coef. > 0.9) in most of the 6000 spectra due to the significant similarity between the high intensity background signals. However, by counting the slowly changing spectral features as background to identify the more quickly changing short Raman signals, the cross-correlation diagram of the background-removed data shows high correlation coefficients only on the main diagonal (Figure 1e), indicating unique spectra at each elution time. Comparing Figs. 1d and 1e clearly demonstrates the necessity of background removal in signal identification. The absence of off-diagonal peaks demonstrates that the SERS signature of each detected analyte is unique.
Fig 1.
Total photon LC-SERS chromatograms of (a) raw and (b) background-removed SERS signals for a 20-min (6000-spectra) LC-SERS run of a MMTV-Wnt1 sample using gradient mobile phase (method I, supplementary materials). Each peak in the LC-SERS chromatogram corresponds to a Raman spectrum. (c) Examples of the high-intensity SERS spectra at different elution times during the LC separation are shown. (d, e) Cross correlation diagrams of the (d) raw and (e) background-removed SERS spectra in the same LC-SERS run. Color scale represents the Pearson correlation coefficients. The high correlations along the background corrected spectra and the absence of cross-peaks indicates unique analytes are detected.
To compare SERS and MS signals, we next analyzed the signals detected by MS from the same MMTV-Wnt1 tumor sample lysates and compared them to SERS. MS and SERS chromatograms show different patterns of detected signals (Figure S1) due to the different analyte selection rules of the respective techniques. A total number of 139 metabolites are identified from the LC-MS detection by matching the detected signals with the MS database. 95 unique SERS spectra, distinct spectra at non-consecutive time points, are identified from the SERS data. These unique SERS signals can be attributed to different metabolites detected by SERS as discussed above (Figure 1). Our previous report has demonstrated that only molecules that at least temporarily adsorbed to the SERS substrate would be detected in solution.[35] In the case of co-eluting metabolites, composite SERS spectra may present due to the competition of adsorption of metabolites to the SERS substrate.
Identification of the metabolites detected by SERS will require development of a reference spectral library database that is currently unavailable. Towards this goal, we cross-examined the SERS data with MS-identified metabolites to assess whether MS and SERS detect the same or different subsets of metabolites. A list of five MS-identified metabolites with unique elution times are shown in Table S1. Among these identified metabolites, 2-amino-3-hydroxypyridine (AHP) gives a strong and consistent SERS signal (Figure S3), while 1-(1,3-benzodioxol-5-yl)ethanamine, for example, did not produce consistent signals detected by our sheath-flow SERS detector (Figure S2). Of the few commercially available, non-coeluting metabolites tested, only AHP was readily detected by SERS, which suggests that SERS may be selective for a different subset of metabolites.
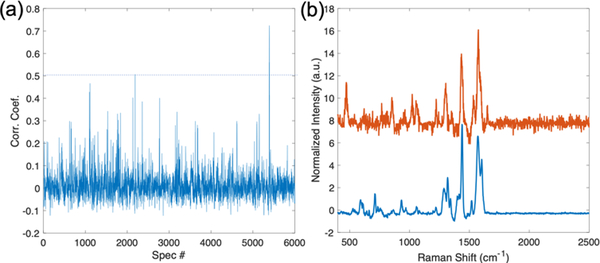
The reference spectrum of AHP acquired under LC-SERS experimental conditions (Figure S3) can be used to identify signal from SERS chromatograms, like the chromatogram shown in Figure 1b. Figure 2a shows the Pearson correlation coefficients between AHP reference spectrum and each spectrum in the SERS chromatogram. The highest correlation is observed at spectrum index = 5393 (t = 17.977 min), with a correlation coefficient calculated to be 0.7242. AHP was detected at similarly late retention times in both MS and SERS experiments (Figure S1). The absolute differences in retention time are expected due to the different columns and LC-equipment used in our lab compared to the MS core facility. Figure 2b plots the highest correlation spectrum along with the AHP reference spectrum. The two spectra are similar, suggesting the detected SERS spectrum from the tumor sample may be associated with the metabolite AHP. However, some variations in peaks may be caused by the low concentration of AHP in the tumor sample or by co-eluting metabolites that affect the spectrum. Prior work indicates the observed spectra originate from a small number of molecules, possibly 1, interacting at hotspots;[35, 36] however, to populate these hotspots generally requires many molecules in the sample. The successful recovery of AHP signal in the tumor sample demonstrates the potential use of SERS in targeted metabolomics of known metabolites.
Figure 2.
(a) Pearson correlation coefficients between AHP reference spectrum and each spectrum in the SERS chromatogram shown in Figure 1b. The spectrum that exceeds the threshold (dashed line: Corr. Coef. = 0.5) is shown in (b). (b) The reference SERS spectra of AHP (blue) and the highest correlation spectrum (Red) from the LC-SERS experiment in (a) show strong agreement.
While the SERS substrate is not readily fouled by the analytes at low concentrations, it gradually degrades under long laser exposure, which can cause signal variations between multiple repeated LC-SERS runs. Previously, addition of a self-assembled monolayer (SAM) improved analyte interactions with the substrate that significantly improved detection.[27, 37, 38] In our experiment, a self-assembled monolayer (SAM) of 6-mercapto-1-hexanol is assembled on the SERS substrate to improve its stability throughout multiple LC-SERS runs, as is evidenced by the relatively conserved background spectra after multiple LC-SERS runs (Figure S4).
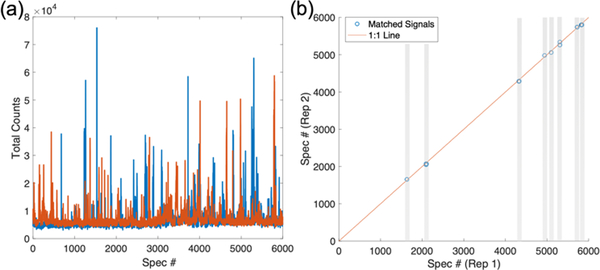
Signal fluctuation is observed in the SERS chromatograms of two replicate LC-SERS measurements of a MMTV-Wnt1 tumor sample (Figure 3a). The number of unique signals detected in each replicate are calculated to be 192 and 171, respectively. The differences in both the number of detected signals and signal intensities can be attributed to both a relatively low number of metabolites injected as well as short signal acquisition time in this experiment, which lead to only a few molecules being detected in each spectral acquisition. To find the signals that are reproducibly detected in both replicates, we calculate the Pearson correlation coefficients between all spectra in each replicate. The matched signals are detected in both replicates (Figure 3b), which are determined by two criteria: (1) correlation coefficient > 0.5 and (2) elution time difference < 10 seconds. Multiple matched signals are detected throughout the LC separation. Representative spectra of the matched signals are shown (Figure S5).
Figure 3.
(a) SERS chromatograms of 2 replicate LC-SERS runs of a MMTV-Wnt1 sample (CN466) using isocratic mobile phase (method II, supplementary materials). (b) A Pearson’s cross-correlation was used to determine matched signals in both replicate SERS chromatogram. The signals were considered to match when spectra in each replicate satisfied the following constraints: (1) Corr. Coef. > 0.5; (2) elution time difference < 10 seconds (spectral index difference < 50). The gray bars highlight matched signals.
The ability to use small sample volumes for metabolomics is important, since many biological samples, including patient samples collected from biopsies, are difficult to obtain. The development of nanoflow LC system has enabled ultra-small-volume MS-based metabolomics studies.[16, 39] Our results demonstrate that SERS can detect reproducible metabolite signals, even with small sample volume and nanoflow LC separation, and suggest SERS can be utilized as a technique that is complementary to MS for global metabolic profiling. To more easily represent the metabolite signals, the reproducible signals can be converted into a barcode, where the location of a bar represents a pair of matched SERS spectra between different LC-SERS runs at the same elution time (Figure 3b).
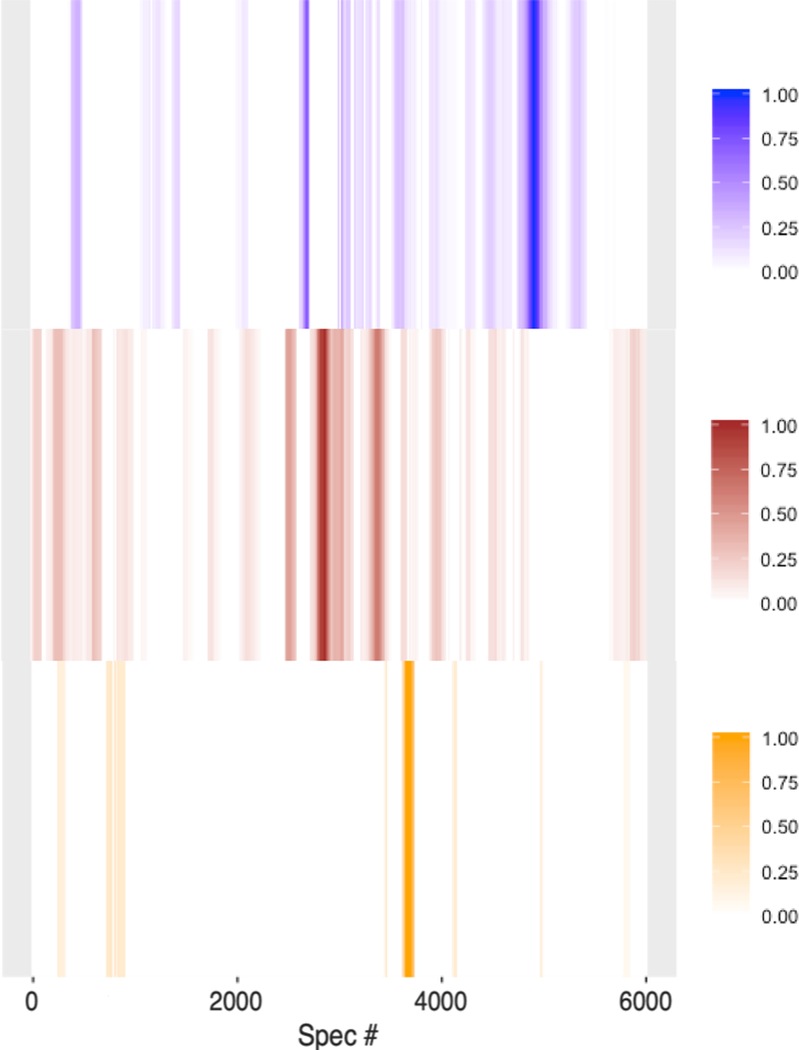
A unique metabolic fingerprint for a tumor can be detected without knowing the identity of the component metabolites. We performed multiple replicate LC-SERS experiments to find the spectra that are reproducibly detected from a specific biological sample. Greyscale barcodes were generated from the reproducible signals from three or more replicate LC-SERS runs from MMTV-Wnt1 and MMTV-Neu tumor samples, and from a healthy mammary gland sample (Figure 4). The color intensity of each bar represents the reproducibility of the detected signals as determined by the cumulative pairwise correlation coefficients normalized between 0 and 1, with a higher value indicating a higher reproducibility of the detected signals at certain time points in the LC-separation (denoted by spectrum # in the chromatogram). The lower number of detected signals within the normal sample is attributed to the lower metabolite concentration in normal tissue compared to their cancerous counterparts. Interestingly, the barcodes of the three samples show strikingly clear differences. The reproducible detection of metabolite signals, even without knowing the identities of the metabolites, demonstrates the potential use of LC-SERS as a metabolic fingerprinting approach to classify samples based on the detected metabolite patterns. The distinct barcode patterns for each sample shown in Figure 4 demonstrate that our LC-SERS approach has the potential not only to classify tumor and normal samples, but also to differentiate between different tumor types. Further investigation will assess how the biological heterogeneity within tumors affects this analysis.[40, 41] Future investigation will also define specific metabolite fingerprints that can be used not only to differentiate between tumor and normal samples, but also to assess potential metabolite profiles that can be used to diagnose and guide cancer treatment.
Figure 4.
Bar code plots of tumors MMTV-Wnt1 (blue, n=4), MMTV-Neu (brown, n=4) and normal mammary gland sample (orange, n=4). Bar codes represent the reproducible SERS signals from at least 3 replicate LC-SERS runs. Color scales represent cumulative pairwise correlation coefficients normalized between 0 and 1.
In summary, we demonstrated that SERS is capable of detecting metabolites, sequentially eluted after a LC separation, in complex tumor lysate samples. Our results showed that LC-SERS has comparable capability to LC-MS in terms of metabolite detection. A model metabolite, AHP, which was identified by MS, was also successfully detected by SERS. While global metabolite identification by SERS would require the annotation of a reference library of metabolites, here we demonstrate that metabolic fingerprinting with SERS is a promising approach to capturing biological and metabolic information without the requirement of absolute metabolite identification. This approach can leverage the use of previously discarded data of unidentified metabolites detected by metabolomics. Our LC-SERS approach provides a complementary characterization that would increase the coverage of the metabolome and promote the use of metabolomics as a tool for biomarker discovery and clinical diagnostics.
Supplementary Material
Acknowledgements ((optional))
Research reported in this publication was supported by The Ohio State University Comprehensive Cancer Center and the National Institutes of Health under grant number P30 CA016058, and the National Cancer Institute Award R33 CA206922. The content is solely the responsibility of the authors and does not necessarily represent the official views of the National Institutes of Health.
Footnotes
Supporting information for this article is given via a link at the end of the document.
Contributor Information
Lifu Xiao, Department of Chemistry and Biochemistry, The Ohio State University, Columbus, OH 43210.
Chuanqi Wang, Department of Applied and Computational Mathematics and Statistics, University of Notre Dame, Notre Dame, IN 46556; Harper Cancer Research Institute, South Bend, IN 46617.
Chen Dai, Department of Chemistry and Biochemistry, University of Notre Dame, Notre Dame, IN 46556; Harper Cancer Research Institute, South Bend, IN 46617.
Laurie E Littlepage, Department of Chemistry and Biochemistry, University of Notre Dame, Notre Dame, IN 46556; Harper Cancer Research Institute, South Bend, IN 46617.
Jun Li, Department of Applied and Computational Mathematics and Statistics, University of Notre Dame, Notre Dame, IN 46556; Harper Cancer Research Institute, South Bend, IN 46617.
Zachary D Schultz, Department of Chemistry and Biochemistry, The Ohio State University, Columbus, OH 43210; Comprehensive Cancer Center, The Ohio State University, Columbus, OH 43210.
References
- [1].Kreeger PK, Lauffenburger DA, Carcinogenesis 2009, 31, 2–8. [DOI] [PMC free article] [PubMed] [Google Scholar]
- [2].Aderem A, Adkins JN, Ansong C, Galagan J, Kaiser S, Korth MJ, Law GL, McDermott JG, Proll SC, Rosenberger C, Schoolnik G, Katze MG, MBio 2011, 2, e00325–10. [DOI] [PMC free article] [PubMed] [Google Scholar]
- [3].Werner HM, Mills GB, Ram PT, Nat. Rev. Clin. Oncol 2014, 11, 167–176. [DOI] [PMC free article] [PubMed] [Google Scholar]
- [4].Armitage EG, Barbas C, J. Pharm. Biomed. Anal 2014, 87, 1–11. [DOI] [PubMed] [Google Scholar]
- [5].Spratlin JL, Serkova NJ, Eckhardt SG, Clin. Cancer Res 2009, 15, 431–440. [DOI] [PMC free article] [PubMed] [Google Scholar]
- [6].da Silva RR, Dorrestein PC, Quinn RA, Proc. Natl. Acad. Sci. U. S. A 2015, 112, 12549–12550. [DOI] [PMC free article] [PubMed] [Google Scholar]
- [7].Zhang J, Wei S, Liu L, Gowda GN, Bonney P, Stewart J, Knapp DW, Raftery D, Biochimica et Biophysica Acta (BBA)-Molecular Basis of Disease 2012, 1822, 1807–1814. [DOI] [PubMed] [Google Scholar]
- [8].Zhang L, Jin H, Guo X, Yang Z, Zhao L, Tang S, Mo P, Wu K, Nie Y, Pan Y, Clin. Biochem 2012, 45, 1064–1069. [DOI] [PubMed] [Google Scholar]
- [9].Vignoli A, Ghini V, Meoni G, Licari C, Takis PG, Tenori L, Turano P, Luchinat C, Angewandte Chemie International Edition 2019, 58, 968–994. [DOI] [PMC free article] [PubMed] [Google Scholar]
- [10].Li F, Qin X, Chen H, Qiu L, Guo Y, Liu H, Chen G, Song G, Wang X, Li F, Rapid Communications in Mass Spectrometry 2013, 27, 24–34. [DOI] [PubMed] [Google Scholar]
- [11].Liesenfeld DB, Habermann N, Owen RW, Scalbert A, Ulrich CM, Cancer Epidemiol. Biomarkers Prev 2013, 22, 2182–2201. [DOI] [PMC free article] [PubMed] [Google Scholar]
- [12].Ganti S, Taylor SL, Abu Aboud O, Yang J, Evans C, Osier MV, Alexander DC, Kim K, Weiss RH, Cancer Res. 2012, 72, 3471–3479. [DOI] [PMC free article] [PubMed] [Google Scholar]
- [13].Beckonert O, Keun HC, Ebbels TM, Bundy J, Holmes E, Lindon JC, Nicholson JK, Nature protocols 2007, 2, 2692. [DOI] [PubMed] [Google Scholar]
- [14].Johnson CH, Gonzalez FJ, J. Cell. Physiol 2012, 227, 2975–2981. [DOI] [PMC free article] [PubMed] [Google Scholar]
- [15].Li Z, Tatlay J, Li L, Anal. Chem 2015, 87, 11468–11474. [DOI] [PubMed] [Google Scholar]
- [16].Deng J, Zhang G, Neubert TA, 2018, 125–134. [DOI] [PubMed] [Google Scholar]
- [17].Zong C, Xu M, Xu L, Wei T, Ma X, Zheng X, Hu R, Ren B, Chem. Rev 2018, 118, 4946–4980. [DOI] [PubMed] [Google Scholar]
- [18].Chen N, Rong M, Shao X, Zhang H, Liu S, Dong B, Xue W, Wang T, Li T, Pan J, Int. J. Nanomedicine 2017, 12, 5399–5407. [DOI] [PMC free article] [PubMed] [Google Scholar]
- [19].Carrillo-Carrión C, Armenta S, Simonet BM, Valcárcel M, Lendl B, Anal. Chem 2011, 83, 9391–9398. [DOI] [PubMed] [Google Scholar]
- [20].Alharbi O, Xu Y, Goodacre R, Analyst 2014, 139, 4820–4827. [DOI] [PubMed] [Google Scholar]
- [21].White IM, Yazdi SH, Wei WY, Microfluidics and nanofluidics 2012, 13, 205–216. [Google Scholar]
- [22].Ye J, Wen F, Sobhani H, Lassiter JB, Van Dorpe P, Nordlander P, Halas NJ, Nano letters 2012, 12, 1660–1667. [DOI] [PubMed] [Google Scholar]
- [23].Negri P, Jacobs KT, Dada OO, Schultz ZD, Anal. Chem 2013, 85, 10159–10166. [DOI] [PMC free article] [PubMed] [Google Scholar]
- [24].Negri P, Schultz ZD, Analyst 2014, 139, 5989–5998. [DOI] [PMC free article] [PubMed] [Google Scholar]
- [25].Negri P, Sarver SA, Schiavone NM, Dovichi NJ, Schultz ZD, Analyst 2015, 140, 1516–1522. [DOI] [PMC free article] [PubMed] [Google Scholar]
- [26].Nguyen Anh, Schultz ZD, Analyst 2016, 141, 3630–3635. [DOI] [PubMed] [Google Scholar]
- [27].Nguyen AH, Deutsch JM, Xiao L, Schultz ZD, Anal. Chem 2018, 90, 11062–11069. [DOI] [PMC free article] [PubMed] [Google Scholar]
- [28].Dai C, Arceo J, Arnold J, Sreekumar A, Dovichi NJ, Li J, Littlepage LE, Cancer & Metabolism 2018, 6, 5. [DOI] [PMC free article] [PubMed] [Google Scholar]
- [29].Ellis DI, Dunn WB, Griffin JL, Allwood JW, Goodacre R, 2007, 8, 1243–1266. [DOI] [PubMed] [Google Scholar]
- [30].Suman S, Sharma RK, Kumar V, Sinha N, Shukla Y, J. Pharm. Biomed. Anal 2018, 160, 38–45. [DOI] [PubMed] [Google Scholar]
- [31].Wallner-Liebmann S, Tenori L, Mazzoleni A, Dieber-Rotheneder M, Konrad M, Hofmann P, Luchinat C, Turano P, Zatloukal K, Journal of proteome research 2016, 15, 1787–1793. [DOI] [PubMed] [Google Scholar]
- [32].Turano P, Expert Rev. Gastroenterol. Hepatol 2014, 8, 847–849. [DOI] [PubMed] [Google Scholar]
- [33].Hackshaw KV, Aykas DP, Sigurdson GT, Plans M, Madiai F, Yu L, Buffington CAT, Giusti MM, Rodriguez-Saona L, J. Biol. Chem 2019, 294, 2555–2568. [DOI] [PMC free article] [PubMed] [Google Scholar]
- [34].Buszewska-Forajta M, Rachoń D, Stefaniak A, Wawrzyniak R, Konieczna A, Kowalewska A, Markuszewski MJ, Steroid Biochem J. Mol. Biol 2019, 186, 176–184. [DOI] [PubMed] [Google Scholar]
- [35].Asiala SM, Schultz ZD, Anal. Chem 2014, 86, 2625–2632. [DOI] [PMC free article] [PubMed] [Google Scholar]
- [36].Fang Y, Seong N-H, Dlott DD, Science 2008, 321, 388–392. [DOI] [PubMed] [Google Scholar]
- [37].Yonzon CR, Haynes CL, Zhang X, Walsh JT, Van Duyne RP, Anal. Chem 2004, 76, 78–85. [DOI] [PubMed] [Google Scholar]
- [38].Lyandres O, Shah NC, Yonzon CR, Walsh JT, Glucksberg MR, Van Duyne RP, Anal. Chem 2005, 77, 6134–6139. [DOI] [PubMed] [Google Scholar]
- [39].Chetwynd AJ, Ogilvie LA, Nzakizwanayo J, Pazdirek F, Hoch J, Dedi C, Gilbert D, Abdul-Sada A, Jones BV, Hill EM, Journal of Chromatography A 2019, 1600, 127–136. [DOI] [PubMed] [Google Scholar]
- [40].Kidd EA, Grigsby PW, Clin. Cancer Res 2008, 14, 5236–5241. [DOI] [PubMed] [Google Scholar]
- [41].Hensley CT, Faubert B, Yuan Q, Lev-Cohain N, Jin E, Kim J, Jiang L, Ko B, Skelton R, Loudat L, Cell 2016, 164, 681–694. [DOI] [PMC free article] [PubMed] [Google Scholar]
Associated Data
This section collects any data citations, data availability statements, or supplementary materials included in this article.


