Abstract
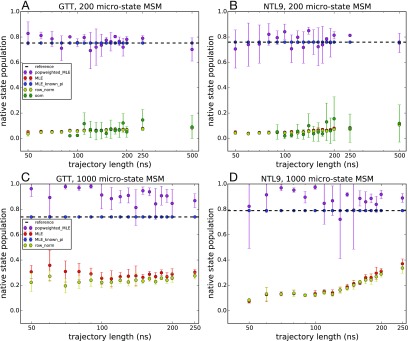
In the last decade, advances in molecular dynamics (MD) and Markov State Model (MSM) methodologies have made possible accurate and efficient estimation of kinetic rates and reactive pathways for complex biomolecular dynamics occurring on slow time scales. A promising approach to enhanced sampling of MSMs is to use “adaptive” methods, in which new MD trajectories are “seeded” preferentially from previously identified states. Here, we investigate the performance of various MSM estimators applied to reseeding trajectory data, for both a simple 1D free energy landscape and mini-protein folding MSMs of WW domain and NTL9(1–39). Our results reveal the practical challenges of reseeding simulations and suggest a simple way to reweight seeding trajectory data to better estimate both thermodynamic and kinetic quantities.
I. INTRODUCTION
In the last decade, Markov State Model (MSM) methodologies have made possible accurate and efficient estimation of kinetic rates and reactive pathways for slow and complex biomolecular dynamics.1–5 One of the key advantages touted by MSM methods is the ability to use large ensembles of short-time scale trajectories for sampling events that occur on slow time scales. The main idea is that sufficient sampling using many short trajectories can circumvent the need to sample long trajectories.
With this in mind, many “adaptive” methods have been developed for the purpose of accelerating sampling of MSMs. The simplest of these can be called adaptive seeding, where one or more new rounds of unbiased simulations are performed by “seeding” swarms of trajectories throughout the landscape.6 The choice of seeds is based on some initial approximation of the free energy landscape, possibly from nonequilibrium or enhanced-sampling methods. Adaptive seeding can be performed by first identifying a set of metastable states and then initiating simulations from each state. If the seeding trajectories provide sufficient connectivity and statistical sampling of transition rates, an MSM can be constructed to accurately estimate both kinetics and thermodynamics.
Similarly, so-called adaptive sampling algorithms have been developed for MSMs in which successive rounds of targeted seeding simulations are performed, updating the MSM after each round.7,8 A simple adaptive sampling strategy is to start successive rounds of simulations from undersampled states, for instance, from the state with the least number of transition counts.9 A more sophisticated approach is the FAST algorithm, which is designed to discover states and reactive pathways of interest by choosing new states based on an objective function that balances undersampling with a reward for sampling desired structural observables.10,11 Other algorithms include REAP, which efficiently explores folding landscapes by using reinforcement learning to choose new states,12 and surprisal-based sampling,7 which chooses new states that will minimize the uncertainty of the relative entropy between two or more MSMs.
A key problem with adaptive sampling of MSMs arises because we are often interested in equilibrium properties, while trajectory seeding is decidedly nonequilibrium. This may seem like a subtle point, because the dynamical trajectories themselves are unbiased, but of course, the ensemble of starting points for each trajectory are almost always statistically biased; i.e., the seeds are not drawn from the true equilibrium distribution. This can be problematic because most MSMs are constructed from transition rate estimators that enforce detailed balance and assume trajectory data are obtained at equilibrium. The distribution of sampled transitions, however, will only reflect equilibrium conditions in the limit of long trajectory length.
One way around this problem is to focus mostly on the kinetic information obtained by adaptive sampling. A recent study of the ability of FAST to accurately describe reactive pathways concluded that the most reliable MSM estimator to use with adaptive sampling data is a row-normalized transition count matrix.11 Indeed, weighted-ensemble path sampling algorithms focus mainly on sampling the kinetics of reactive pathways, information which can be used to recover global thermodynamic properties.13–17 A major disadvantage of this approach is that it ignores potentially valuable equilibrium information. As shown by Trendelkamp-Schroer and Noé,18 detailed balance is a powerful constraint to infer rare-event transition rates from equilibrium populations. Specifically, when faced with limited sampling, dedicating half of one’s simulation samples toward enhanced thermodynamic sampling (e.g., umbrella sampling) can result in a significant reduction in the uncertainty of estimated rates, simply because the improved estimates of equilibrium state populations inform the rate estimates through detailed balance.
Another way around this problem, recently described by Nüske et al., is to use an estimator based on observable operator model (OOM) theory, which utilizes information from transitions observed at lag times τ and 2τ to obtain estimates unbiased by the initial distribution of seeding trajectories.19 Although the OOM estimator is able to make better MSM estimates at shorter lag times, it requires the storage of transition count arrays that scale as the cube of the number states and dense-matrix singular-value decomposition, which can be impractical for MSMs with large numbers of states. Nüske et al. derived an expression quantifying the error incurred by nonequilibrium seeding, from which they conclude that such bias is difficult to remove without either increasing the lag time or improving the state discretization.
Here, we explore an alternative way to recover accurate MSM estimates from biased seeding trajectories, by reweighting sampled transition counts to better approximate counts that would be observed at equilibrium. Like the Trendelkamp-Schroer and Noé method,18 this requires some initial estimate of state populations, perhaps obtained from the previous rounds of adaptive sampling.
We are particularly interested in examining how the performance of this reweighting method compares with other estimators, in cases where it is impractical to generate long trajectories and instead one must rely on ensembles of short seeding trajectories. An example of a case like this is adaptive seeding of protein folding MSMs built from ultralong trajectories simulated on the Anton supercomputer.20 Because such computers are not widely available, adaptive seeding using conventional computers may be one of the only practical ways to leverage MSMs to predict the effect of mutations, for example.
In this manuscript, we first perform adaptive seeding tests using 1D-potential energy models and compare how different estimators perform at accurately capturing kinetics and thermodynamics. We then perform similar tests for MSMs built from ultralong reversible folding trajectories of two mini-proteins, WW domain and NTL9(1–39). Our results, described below, suggest that reweighting trajectory counts with estimates of equilibrium state populations can achieve a good balance of kinetic and thermodynamic estimation.
A. Estimators
We explored the accuracy and efficiency of several different transition probability estimators using adaptive seeding trajectory data as input: (1) a maximum-likelihood estimator (MLE), (2) an MLE estimator where the exact equilibrium populations πi of each state i are known a priori, (3) an MLE estimator where each input trajectory is weighted by an a priori estimate of the equilibrium population of its starting state, (4) row-normalized transition counts, and (5) an observable operator model (OOM) estimator.
B. Maximum-likelihood estimator (MLE)
The MLE for a reversible MSM assumes that observed transition counts are independent and drawn from the equilibrium distribution so that reversibility (i.e., detailed balance) can be used as a constraint. The likelihood of observing a set of given transition counts, , when maximized under the constraint that πipij = πjpji, for all i, j, yields a self-consistent expression that can be iterated to find the equilibrium populations,3,21,22
| (1) |
where Ni = ∑jcij. The transition probabilities pij are given by
| (2) |
C. Maximum-likelihood estimator (MLE) with known populations
Maximization of the likelihood function above, with the additional constraint of fixed populations πi, yields a similar self-consistent equation that can be used to determine a set of Lagrange multipliers,18
| (3) |
from which the transition probabilities pij can be obtained as
| (4) |
D. Maximum-likelihood estimator (MLE) with population-weighted trajectory counts
For this estimator, first a modified count matrix is calculated,
| (5) |
where transition counts from trajectory k are weighted in proportion to = π(k), the estimated equilibrium population of the initial state of the trajectory. The idea behind this approach is to counteract the statistical bias from adaptive seeding by scaling the observed transition counts proportional to their equilibrium fluxes. The modified counts are then used as input to the MLE.
E. Row-normalized counts
For this estimator, the transition probabilities are approximated as
| (6) |
This approach does not guarantee reversible transition probabilities, which only occurs in the limit of large numbers of reversible transition counts. In practice, however, the largest eigenvectors of the transition probability matrix have very nearly real eigenvalues such that we can report relevant relaxation time scales and equilibrium populations.
F. Observable operator model (OOM) theory
For an introduction to OOMs and their use in estimating MSMs, see Refs. 19, 23, and 24. OOMs are closely related to Hidden Markov Models (HMMs) but have the advantage, like MSMs, that they can be learned directly from observable-projected trajectory data.24 Unlike MSMs, they require the collection of both one-step transition count matrices and a complete set of two-step transition count matrices. With enough training data and sufficient model rank, OOMs can recapitulate exact relaxation time scales, uncontaminated by MSM state discretization error.19
We used the OOM estimator as described by Nüske et al.19 and implemented in PyEMMA 2.3,25 using the default method of choosing the
OOM model rank by discarding singular values that contribute a bootstrap-estimated
signal-to-noise ratio of less than 10. The settings used to instantiate the model in
PyEMMA are as follows:
The OOM estimator returns two estimates: (1) a so-called corrected MSM, which derives from using the unbiased OOM equilibrium correlation matrices to construct a matrix of MSM transition probabilities, and (2) the OOM time scales, which (given sufficient training data) estimate the relaxation time scales uncontaminated by discretization error. Note that there is no corresponding MSM for the OOM time scales.
II. RESULTS
A. A simple example of adaptive seeding estimation error
To illustrate some of the estimation errors that can arise with adaptive seeding, we first consider a simple model of 1D diffusion over a potential energy surface V(x). The continuous time evolution of a population distribution p(x, t) is analytically described by the Fokker-Planck equation,
| (7) |
where D is the diffusion constant and μ = D/kBT is the mobility. Here, x and t are unitless values with D set to unity and the energy function V(x) in units of kBT.
Here, we consider a “flat-bottom” landscape, over a range x ∈ (0, 2) with periodic boundaries, described by
| (8) |
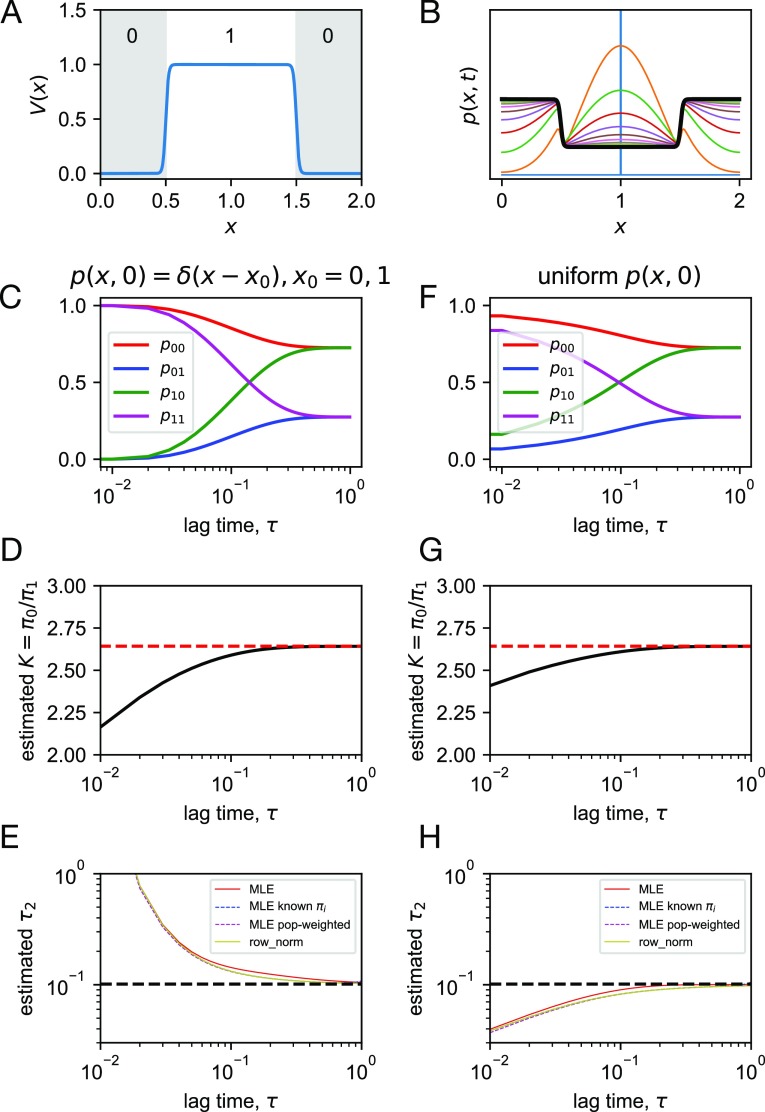
where b = 100. The landscape is partitioned into two states: x is assigned to state 0 if x < 0.5 or x ≥ 1.5 and to state 1 otherwise [Fig. 1(a)]. In the limit of b → ∞, the free energy difference between the states is exactly 1 (kBT), with an equilibrium constant of K = e ≈ 2.718. When b = 100, K ≈ 2.643. This value of b was chosen to help the stability of numerical integration (performed at a resolution of Δx = 2.5 × 10⁻³ and Δt = 5 × 10⁻⁷).
FIG. 1.
Adaptive seeding in a simple two-state system. (a) The potential energy surface V(x), annotated with state indices. (b) Propagation of an initial distribution p(x, 0) = δ(x − 1) (blue), plotted at increments Δt = 0.1, up to t = 1. Starting from an initial distribution p(x, 0) = δ(x − x0) using x0 = 0, 1, shown are estimated quantities as a function of lag time τ: (c) transition probabilities pij, (d) equilibrium constant K = π0/π1, and (e) relaxation time scale τ2, as computed by various estimators. Starting from uniform distributions p(x, 0) over each state, shown are estimated quantities as a function of lag time τ: (f) transition probabilities pij, (g) equilibrium constant K = π0/π1, and (h) relaxation time scale τ2, as computed by various estimators.
To emulate adaptive seeding, we propagate the continuous dynamics starting from an initial distribution p(x, 0) centered on state i and compute the transition probabilities pij from state i to j from the evolved density after some lag time τ [Fig. 1(b)].
We first consider a seeding strategy where simulations are started from the center of each state, which we model by propagating density from an initial distributions p(x, 0) = δ(x) to compute p00 and p01 as a function of τ and from p(x, 0) = δ(x − 1) to compute p10 and p11 [Fig. 1(c)]. By t = 1, the population has reached equilibrium. By detailed balance, the estimated equilibrium constant is , which systematically underestimates the true value [Fig. 1(d)]. This is because the initial distribution is nonequilibrium, in the direction of being too uniform. There are also errors in estimating the relaxation time scales. The different estimators described above (MLE, MLE with known equilibrium populations πi, population-weighted MLE, and row-normalized counts) were applied to estimate the implied time scale τ2 [Fig. 1(e)]. For this simple two-state system, all estimates are very similar to the analytical two-state result τ2 = −τ/ln(1 − p10 − p01) (with the exception of MLE, which yields τ2 estimates that are about 9% larger when t = 0.1), which approaches the true slowest relaxation time scale of the Fokker-Plank dynamics (τ2 = 0.1013) as the lag time increases. Until the population density becomes equilibrated, however, the computed value of τ2 is overestimated. This is because at early times, outgoing population fluxes are underestimated.
We also consider a seeding strategy where simulations are started from randomly from inside each state, which we model by propagating density from initially uniform distributions across each state [Fig. 1(f)]. As before, we find that the equilibrium constant is underestimated, again, because the initial seeding is out of equilibrium [Fig. 1(g)]. The estimate is somewhat improved, however, by the “pre-equilibration” of each state. In this case, the implied time scale τ2 is underestimated at early times [Fig. 1(h)]. This can be understood as arising from the overestimation of outgoing population fluxes, as not enough population has yet reached the ground state (state 0).
From these two scenarios, we can readily understand that the success of estimating both kinetics and thermodynamics from adaptive seeding greatly depends on how well the initial seeding distribution approximates the equilibrium distribution. Moreover, we can see that time scale estimates can be either underestimated or overestimated, depending on the initial seeding distribution. It is important to note that these errors arise primarily because of the nonequilibrium sampling rather than finite sampling error or discretization error.3
B. Seeding of a 1-D potential energy surface
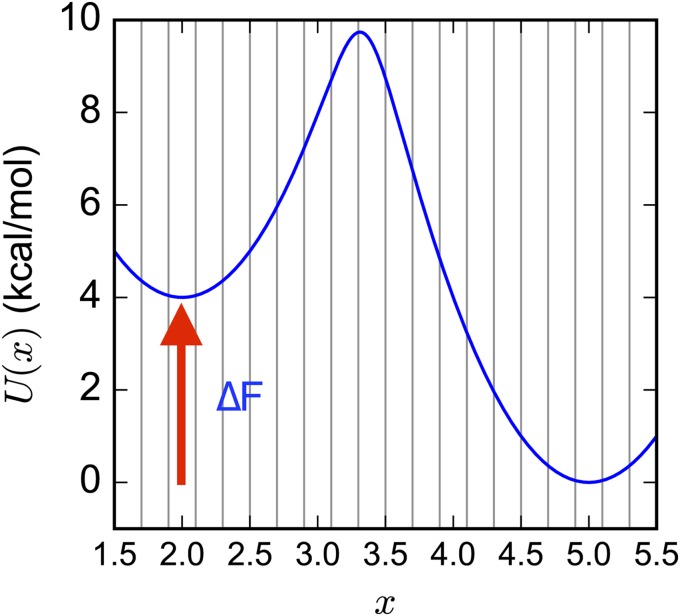
We next consider the following two-well potential energy surface, as used by Stelzl et al.:26 for x ∈ [1.5, 5.5] and kBT = 0.596 kcal mol−1. The state space is uniformly divided into 20 states of width 0.2 to calculate discrete-state quantities. Diffusion on the 1-D landscape is approximated by a Markov Chain Monte Carlo (MCMC) procedure in which new moves are translations randomly chosen from δ ∈ [−0.05, +0.05] and accepted with probability min(1, exp(−β[U(x + δ) − U(x)])), i.e., the Metropolis criterion (Fig. 2).
FIG. 2.
A 1-D two-state potential was used to test the performance of MSM estimators on seeding trajectory data. Vertical lines denote the 20 uniformly spaced discrete states.
As a standard against which to compare estimates from seeding trajectories, we used a set of very long trajectories to construct an optimal MSM model using the above state definitions. To estimate the “true” relaxation time scales of the optimal model, we generated long MCMC trajectories of 109 steps, sampling from a series of scaled potentials U(λ) (x) = λU(x) for λ ∈ [0.5, 0.6, 0.7, 0.8, 0.9, 1.0]. For each λ value, 20 trajectories were generated, with half of them starting from x = 2.0 and the other half starting from x = 5.0, resulting in a total of 120 trajectories. The DTRAM estimator of Wu et al.21 was used to estimate the slowest relaxation time scale as 9.66 (±1.37) × 106 steps, using a lag time of 1000 steps.
We next generated adaptive seeding trajectory data for this system. We limited the lag time to τ = 100 steps and generated s trajectories (5 ≤ s ≤ 1000) of length nτ (for n = 10, 100, 1000 by initiating MCMC dynamics from the center positions of all 20 bins. The resulting data consisted of 20 × s × n transition counts between all states i and j in lag time τ, stored in a 20 × 20 count matrix of entries cij. From these counts, estimates of the transition probabilities, pij, were made.
Estimates of the slowest MSM implied time scales were computed as τ2 = −τ/ln μ2, where μ2 is the largest nonstationary eigenvalue of the matrix of transition probabilities. Estimates of the free energy difference ΔF between the two wells were computed as − kBT ln(πL/(1 − πL)), where πL is the estimated total equilibrium population of MSM states with x < 3.3. To estimate uncertainties in ln τ2 and ΔF, 20 bootstraps were constructed by sampling from the s trajectories with replacement.
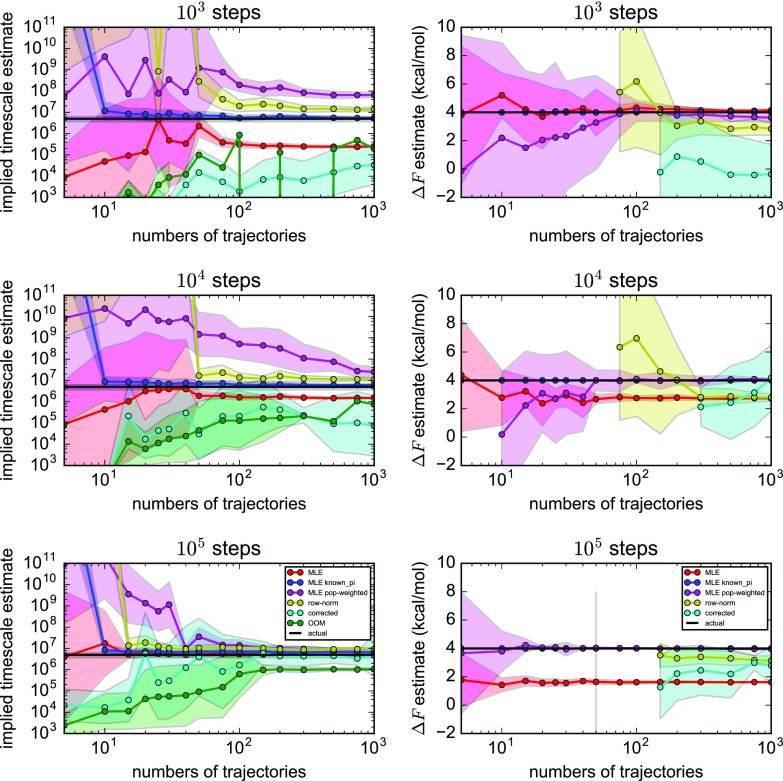
Results for the five different estimators are shown in Fig. 3. In all cases, time scale estimates improve with larger numbers of seeding trajectories and greater numbers of steps in each trajectory. From these results, one can clearly see that MLE (red lines in Fig. 3), the default estimator in software packages like PyEMMA25 and MSMBuilder,27 consistently underestimates the implied time scale, although this artifact becomes less severe as more trajectory data is incorporated. At the same time, MLE estimates of equilibrium populations become systematically worse with more trajectory data. This is precisely because uniform seeding produces a biased, nonequilibrium distribution of sampled trajectories, but the MLE assumes that trajectory data are drawn from equilibrium. In contrast, the MLE with known equilibrium populations (blue lines in Fig. 3) accurately predicts implied time scales with much less trajectory data, underscoring the powerful constraint that detailed balance provides in determining rates. Of all the estimators, this method is the most accurate but relies on having very good estimates of equilibrium state populations a priori.
FIG. 3.
Estimates of the slowest implied time scales (left) and two-well free energy differences (right), shown as a function of number of seeding trajectories of various lengths. Shown are results for (red) MLE, (blue) MLE with known equilibrium populations, (magenta) MLE with population-weighted trajectory counts, (yellow) row-normalized counts, (cyan) corrected MSMs, and (green) OOM time scales. Black horizontal lines denote the highly converged estimates from DTRAM. Shaded bounds represent uncertainties estimated from a bootstrap procedure.
The row-normalized counts estimator (yellow lines in Fig. 3) estimates time scales well, provided that a sufficient number of observed transitions must be sampled to obtain proper estimates. This is necessary to achieve connectivity and to ensure that the transition matrix is at least approximately reversible. However, the free energy differences estimated by row-normalized counts are highly uncertain, and in the limit of large numbers of sufficiently long trajectories (105 steps), estimates of free energies become systematically incorrect due to the statistical bias from seeding. In comparison, the MLE with population-weighted trajectory counts (magenta lines in Fig. 3) is able to make much more accurate estimates of free energies with less trajectory data. We note that while here we are reweighting the transition counts with the known populations, the results are similar if reasonable approximations of the state populations are used (data not shown). Compared with the row-normalized counts estimator, implied time scales are slower to converge with more trajectory data but are comparable when the seeding trajectories are sufficiently long (105 steps). With sufficiently long trajectories (105 steps), the MLE time scales are better estimated than either the row-normalized counts estimator or the population-weighted trajectory counts, but MLE is flawed because the free energies are so biased from the seeding. The population-weighting trajectory counts estimator avoids this artifact to give good estimates of free energies.
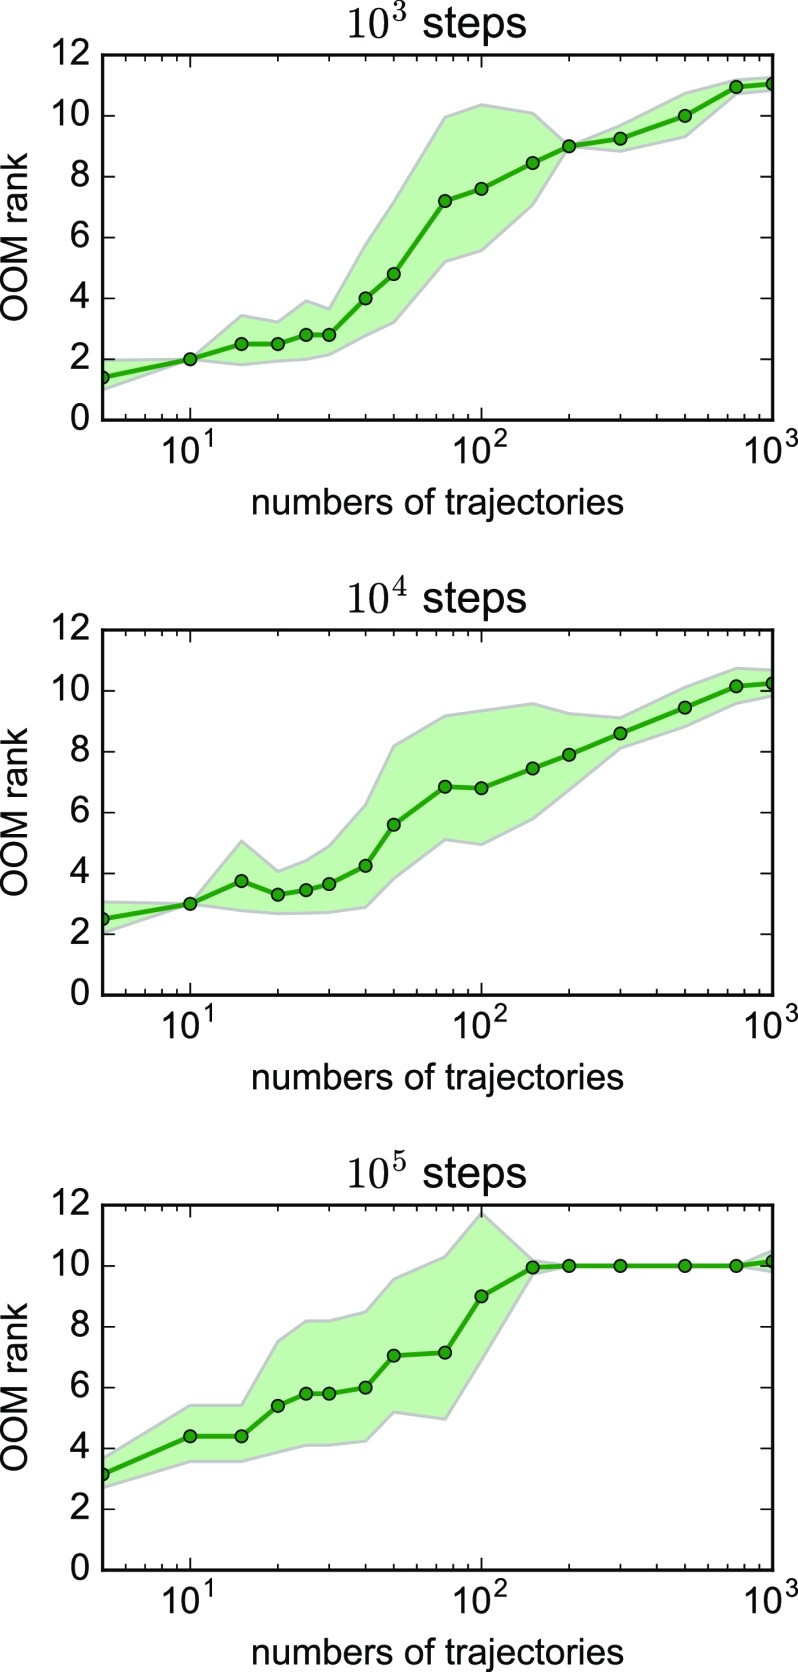
The “corrected” and OOM time scales from the OOM estimator consistently underestimate the slowest implied time scale for this test system, although these estimates improve with greater numbers and lengths of trajectories (cyan and green lines in Fig. 3). The OOM estimator is susceptible statistical noise, as evidenced by the average OOM model rank selected by the PyEMMA implementation, which increases from 2 to 10 as the numbers of trajectories are increased (Fig. 4). Like the row-normalized counts estimator, the OOM estimator gives poorly converged estimates of two-well free energy differences.
FIG. 4.
The average OOM rank increases with the number of trajectories. Shaded bounds represent uncertainties estimated from a bootstrap procedure.
C. Adaptive seeding of folding landscapes for WW domain and NTL9(1–39)
For studying protein folding, an adaptive seeding strategy may be useful for several reasons. For one, generating ensembles of short trajectories may simply be a practical necessity, due to the limited availability of special-purpose hardware to generate ultralong trajectories. Adaptive seeding may also be able to efficiently leverage an existing MSM (perhaps built from ultralong trajectory data) to predict perturbations to folding by mutations or to examine the effect of different simulation parameters like force field or temperature.
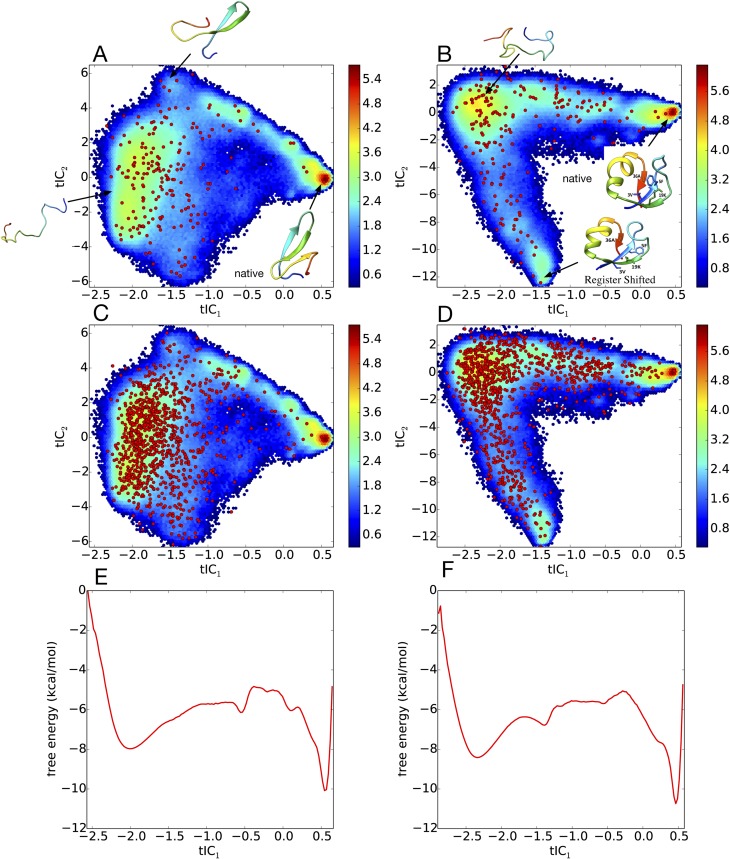
How can we best utilize adaptive seeding of MSMs built from ultralong trajectory data to make good estimates of both kinetics and thermodynamics? To address this question, here, we test the performance of various MSM estimators on the challenging task of estimating MSMs from adaptive seeding of protein folding landscapes. The folding landscapes come from MSMs built from ultralong reversible folding trajectories of fast-folding mini-proteins WW domain and NTL9(1–39).
WW domain is a 35-residue protein signaling domain with a three-stranded β-sheet structure that binds to proline-rich peptides. Its folding kinetics and thermodynamics have been studied extensively by time-resolved spectroscopy,28–32 and its folding mechanism has been probed extensively using molecular simulation studies.33–35 Moreover, an impressively large number of site-directed mutants of WW domain have been constructed to investigate folding mechanism and discover fast-folding variants, including the Fip mutant (Fip35) of human pin1 WW domain, for which mutations in first hairpin loop region result in a fast folding time of ∼13.3 μs at 77.5 °C.29,36 Further mutation of the second hairpin loop of Fip35 produced an even faster-folding variant, called GTT, in which the native sequence Asn-Ala-Ser (NAS) was replaced with Gly-Thr-Thr (GTT), resulting in a fast relaxation time ∼4.3 μs at 80 °C.35
NTL9(1–39) domain is a 39-residue truncation variant of the N-terminal domain of ribosomal protein L9, whose folded state consists of an α-helix and a three-strand β-sheet. NTL9(1–39), which has a folding relaxation time of ∼1.5 ms at 25 °C,37 has been extensively probed by both experimental and computational studies.38–41 The K12M mutant of NTL9(1–39) is a fast-folding variant with a folding time scale of ∼700 μs at 25 °C (Figs. 5 and 6).37,42
FIG. 5.
200-state MSMs of (a) GTT WW domain and (b) K12M NTL9(1–39), built from ultralong folding trajectory data, are shown projected onto the two largest tICA components. Red circles show the locations of the MSM microstates. The heat map shows a density plot of the raw trajectory data, with color bar values denoting the natural logarithm of histogram counts. 1000-state MSMs are shown for (c) GTT WW domain and (d) K12M NTL9(1–39). (e) and (f) Corresponding 1-D free energy profiles along the first tICA component, calculated from histogramming the trajectory data in bins of width 0.025.
FIG. 6.
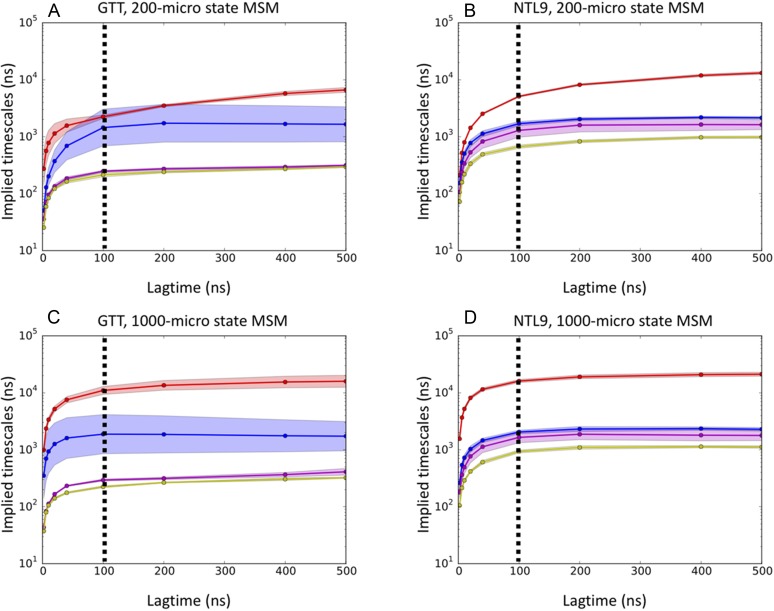
Implied time scale plots for 200-state MSMs of (a) GTT WW domain and (b) K12M NTL9(1–39) and for 1000-state MSMs of (c) GTT WW domain and (d) K12M NTL9(1–39). Uncertainties (shaded areas) for GTT and NTL9 were estimated using 5-fold and 8-fold leave-one-out bootstraps, respectively. The dotted vertical line marks the lag time of 100 ns chosen to construct the MSMs.
D. Markov state model construction
Molecular simulation trajectory data for GTT WW domain and K12M NTL9(1–39) were provided by Shaw et al.,20 Our first objective was to construct high-quality reference MSMs from the available trajectory data, to be used as benchmarks against which we could compare adaptive seeding results.
Two independent ultralong trajectories of 651 and 486 μs, performed at 360K using the CHARMM22* force field, were used to construct MSMs of GTT WW domain, as previously described by Wan and Voelz.43 The MSM was constructed by first projecting the trajectory data to all pairwise distances between Cα and Cβ atoms, performing dimensionality reduction via tICA (time-lagged independent component analysis),44,45 and then clustering in this lower-dimensional space using the k-centers algorithm to define a set of metastable states. A 1000-state MSM for GTT WW domain was constructed using a lag time of 100 ns. The generalized matrix Raleigh quotient (GMRQ) method46 was used to choose the optimal number of states (1000) and the number of independent tICA components (eight). The MSM gives an estimated folding relaxation time scale of 10.2 μs, which is comparable with the folding time of 21 ± 6 μs estimated from the analysis of the trajectory data by Lindorff-Larsen et al.20 It is also comparable with the 8 μs time scale estimate from a three-state MSM model built using sliding constraint rate estimation by Beauchamp et al.47 As described below, since seeding trajectory data for a 1000-state MSM were too expensive to analyze using the OOM estimator, we additionally built a 200-state model, using the same methods, which gives an estimated folding time scale of 2.3 μs.
Four trajectories of the K12M mutant of NTL9(1–39), of lengths 1052 μs, 990 μs, 389 μs, and 377 μs, simulated at 355 K using the CHARMM22* force field, were provided by Shaw et al.20 Choosing a lag time of 200 ns, we constructed an MSM using the same methodology as GTT WW domain described above, resulting in a 1000-state model utilizing 6 tICA components, which gives a folding time scale estimate of ∼18 μs. Although this is a faster time scale than the experimentally measured value at 25 °C, it accurately reflects the time scale of folding events observed in the trajectory data (at 355 K) and is similar to folding time scales measured by T-jump 2-D IR spectroscopy at 80 °C (∼26.4 μs).41 We also note that the previous analysis of the K12M NTL9(1–39) trajectory data has given similar time scale estimates. Analysis of the trajectory data by Lindorff-Larsen et al. yielded an estimate of ∼29 μs,20 a three-state MSM model built using sliding constraint rate estimation by Beauchamp et al. gives an estimate of ∼16 μs,46 and an MSM by Baiz et al. gives a time scale estimate of 18 μs.41 As we did for GTT WW domain, and using the same methods, we additionally built a 200-state MSM, which gives an estimated folding time scale of 5.2 μs.
E. Estimated folding rates and equilibrium populations from reseeding simulations
To emulate data sets that would be obtained by adaptive reseeding, we randomly sampled segments of the reference trajectory data that start from each metastable state. An advantage of emulating reseeding trajectory data in this way is the ability to recapitulate the original model in the limit of long trajectories. The full set of reference trajectory data (∼1.1 ms) for GTT WW domain composed of 12 reversible folding events, while the full set for K12M NTL9(1–39) (∼ 2.8 ms) composed of 14 reversible folding events.
To test the performance of different estimators on reseeding trajectory data, we sampled either 5 or 10 seeding trajectories of various lengths from each MSM state. By design, the length of the reseeding trajectories was limited to 500 ns for the 200-state MSMs and to 250 ns for the 1000-state MSMs, because trajectories longer than this length result in data sets that exceed the total amount of reference trajectory data. For reseeding 1000-state MSMs with 10 trajectories, the trajectory lengths were limited to 100 ns for GTT and to 200 ns for NTL9 so as not to exceed the total amount of original trajectory data.
For each set of emulated reseeding trajectory data, MSMs were constructed using various estimators and compared with the reference MSM. Implied time scale estimates were computed using a lag time of 40 ns to facilitate the analysis of seeding trajectories as short as 50 ns. For the MLE estimator with population reweighting and the MLE estimator with known populations, we used the equilibrium populations estimated from the reference MSMs. In cases where the row-normalized counts estimator fails at large lag times due to the disconnection of states, a single pseudocount was added to the elements of the transition count matrix that are nonzero in the reference MSM.
1. Estimates of slowest implied time scales
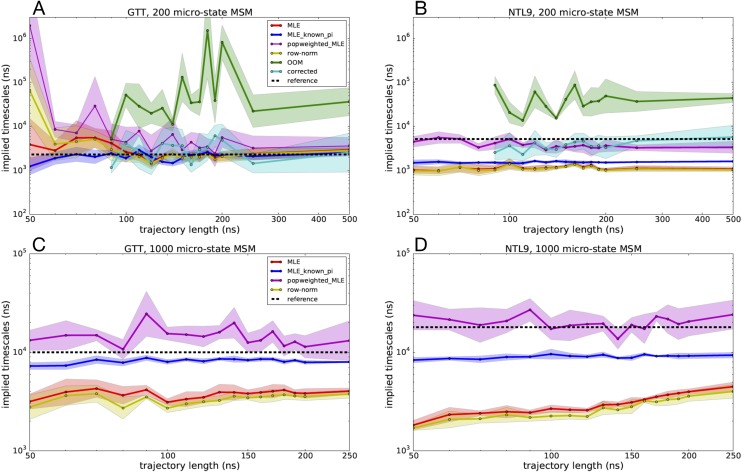
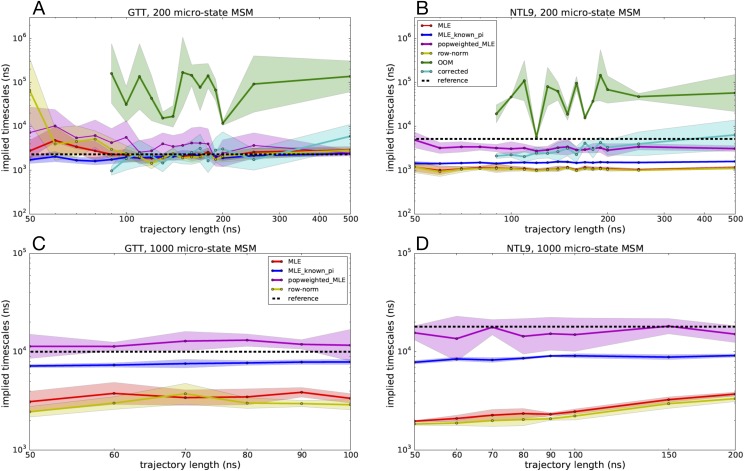
We applied different estimators to the reseeding trajectory data generated for 200-state and 1000-state MSMs of GTT WW domain and K12M NTL9(1–39) and compared the predicted slowest implied time scales to the reference MSMs. Similar implied time scale estimates were obtained using five independent reseeding trajectories initiated from each state (Fig. 7) and ten independent reseeding trajectories (Fig. 8).
FIG. 7.
Slowest implied time scales predicted by various MSM estimators as a function of seeding trajectory length, where five independent trajectories were started from each microstate. Estimated slowest time scales are shown for 200-microstate MSMs of (a) GTT WW domain and (b) K12M NTL9(1–39) and for 1000-microstate MSMs of (c) GTT WW domain and (d) K12M NTL9(1–39). Uncertainties were computed using a bootstrap procedure.
FIG. 8.
Slowest implied time scales predicted by various MSM estimators as a function of seeding trajectory length, where ten independent trajectories were started from each microstate. Estimated slowest time scales are shown for 200-microstate MSMs of (a) GTT WW domain and (b) K12M NTL9(1–39) and for 1000-microstate MSMs of (c) GTT WW domain and (d) K12M NTL9(1–39). Trajectory lengths longer than 100 ns for GTT WW domain and 200 ns for K12M NTL9(1–39) result in trajectory data sets larger than the reference model and are not shown. Uncertainties were computed using a bootstrap procedure.
Across most of the estimators tested, implied time scale estimates are statistically well converged using trajectories of 100 ns or more. For the MLE-based estimators in particular (MLE, MLE with known populations, MLE with population reweighting), the estimates have small uncertainties and are not strongly sensitive to trajectory lengths tested. This suggests that while there is enough seeding data to combat statistical sampling error, there remain systematic errors in estimated time scales, mainly due to the estimation method used.
The MLE performs well for the 200-state MSMs of GTT but consistently underestimates the slowest implied time scale in all other MSMs. As seen with our tests above with the 1-D two-state potential, this error is likely due to using a detailed balance constraint with statistically biased seeding trajectory data. The MLE with known populations is much more accurate at estimating the slowest implied time scale and with less uncertainty. For the NLT9 MSMs, however, the MLE with known populations systematically underestimates the slowest implied time scale, again suggesting that the biased seeding trajectory data have an influence despite the strong constraints enforced by the estimator. MLE with population reweighting has more uncertainty than the other MLE-based estimators but overall is arguably the most accurate estimator across all the MSM reseeding tests.
The OOM-based estimates of the slowest implied time scale (which could only be performed for the computationally tractable 200-state MSMs) required seeding trajectory data of least 90 ns, in order to have sufficient trajectory data to perform the bootstrapped signal-to-noise estimation, from which the OOM rank is selected. While the predicted OOM time scales overestimate the relaxation time scales of the 200-state MSMs of both GTT and NTL9 systems, the time scale estimates from the corrected MSMs more closely recapitulate the reference MSMs time scales, with accuracy comparable with the MLE with population reweighting, especially for seeding trajectories over 200 ns.
The row-normalized counts estimator yields slowest implied time scales estimates accelerated compared with the reference MSM, similar to the MLE results. This acceleration is greater than might be expected given our tests with the 1-D two-state potential and may in part be due to the necessity of adding pseudocounts to the transition count matrix to ensure connectivity.
2. Estimates of native-state populations
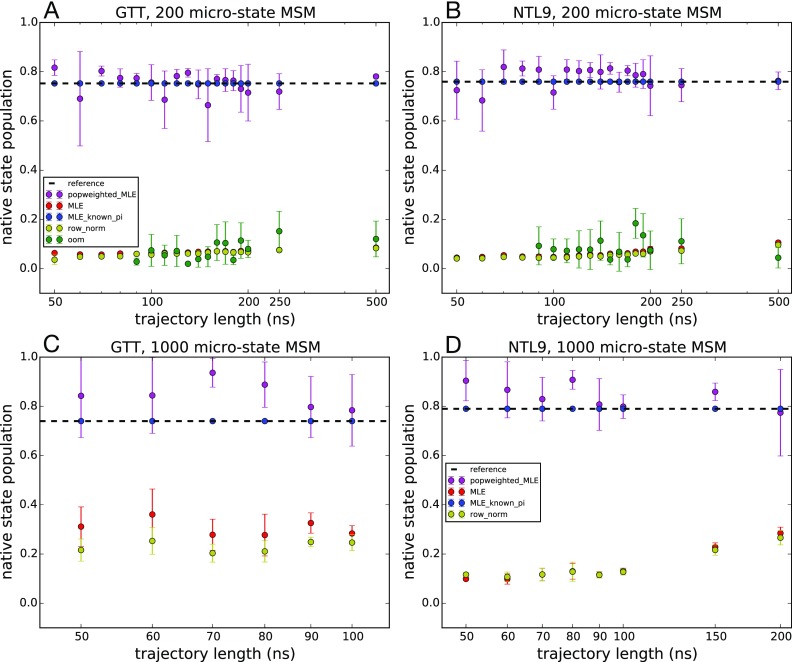
We applied different estimators to the reseeding trajectory data generated for 200-state and 1000-state MSMs of GTT WW domain and K12M NTL9(1–39) and compared the predicted native-state populations with the reference MSMs. The native-state population was calculated as the equilibrium population of the MSM state corresponding to the native conformation. Similar native-state populations were estimated using five independent reseeding trajectories initiated from each state (Fig. 9) and ten independent reseeding trajectories (Fig. 10). These estimates are compared with the native-state populations estimated from the reference MSMs: 75.3% and 74.8% for the 200-state and 1000-state MSMs of GTT WW domain, respectively, and 75.9% and 79.4% for the 200-state and 1000-state MSMs of K12M NTL9(1–39), respectively.
FIG. 9.
Native state populations predicted by various MSM estimators as a function of seeding trajectory length. Estimated populations are shown for 200-microstate MSMs of (a) GTT WW domain and (b) K12M NTL9(1–39) and for 1000-microstate MSMs of (c) GTT WW domain and (d) K12M NTL9(1–39). Adaptive seeding data were generated using five independent trajectories from each microstate. Uncertainties were computed using a bootstrap procedure.
FIG. 10.
Native state populations predicted by various MSM estimators as a function of seeding trajectory length. Estimated populations are shown for 200-microstate MSMs of (a) GTT WW domain and (b) K12M NTL9(1–39) and for 1000-microstate MSMs of (c) GTT WW domain and (d) K12M NTL9(1–39). Adaptive seeding data were generated using ten independent trajectories from each microstate. Trajectory lengths longer than 100 ns for GTT WW domain and 200 ns for K12M NTL9(1–39) result in trajectory data sets larger than the reference model and are not shown. Uncertainties were computed using a bootstrap procedure.
As we saw in our tests using a 1-D two-state potential, obtaining accurate estimates of the equilibrium populations from very short seeding trajectories is a challenging task. In those tests, we found that the most accurate estimates of native-state populations come from estimators that utilize some a priori knowledge of native-state populations. Here, the MLE with known populations recapitulates the native population exactly (by definition), while the MLE with population reweighting successfully captures the native-state population in a 200 microstate model of both GTT and NTL9 and slightly overestimates the native state population for the 1000-state MSMs. In contrast, the MLE, row-normalized counts, and OOM estimators all underestimate the folded populations. With the exception of some slight improvement that begins to occur as the seeding trajectory length increases, these underestimates are independent of the trajectory length, indicating that the nonequilibrium seeding is to blame. The native state populations are underestimated in these cases because there are many more MSM microstates belonging to the unfolded-state basin of the folding landscape.
III. DISCUSSION
Markov state model approaches have enjoyed great success in the last decade due to their ability to integrate ensembles of short trajectories. In light of this success, the allure of adaptive sampling methods, which promises to leverage the focused sampling of short trajectories, is understandable. Recent studies have shown that a judiciously chosen adaptive sampling strategy can accelerate barrier crossing, state discovery, and pathway sampling.11,47
Our work in this manuscript underscores that a key problem with the practical use of adaptive sampling algorithms is the statistical bias introduced by focused sampling, which makes difficult the unbiased estimation of both kinetics and thermodynamics. We have illustrated these problems in simple 1D diffusion models and in large-scale all-atom simulations of protein folding by testing the performance of various MSM estimators on adaptive seeding data. In all cases, we find that estimators that incorporate some form of a priori knowledge about equilibrium populations are able to correct for sampling bias to some extent, resulting in accurate estimates of both slowest implied time scales and equilibrium free energies. Moreover, we have shown that an MLE estimator with population-weighted transition counts is a very simple way to counteract this bias and achieves reasonably accurate results.
As pointed out by others previously,18 the success of such estimators is further demonstration of the importance of incorporating thermodynamic information into MSM estimates, given the powerful constraint that detailed balance provides. With this in mind, it is no surprise that new multiensemble MSM estimators like TRAM48 and DHAMed26 have been able to achieve more accurate results than previous estimators. Thus, while many existing adaptive sampling strategies focus sampling to refine estimated transition rates between states, we expect that improved adaptive sampling estimators may come from similar “on-the-fly” focusing that seeks to refine thermodynamic estimates as well.
As adaptive sampling strategies and estimators continue to improve, we expect the more efficient use of ultralong simulation trajectories combined with ensembles of short trajectories for adaptive sampling, especially to probe the effects of protein mutations, or different binding partners for molecular recognition.
ACKNOWLEDGMENTS
The authors thank the participants of Folding@home, without whom this work would not be possible. We thank D. E. Shaw Research for providing access to folding trajectory data. This research was supported in part by the National Science Foundation through major research instrumentation Grant No. CNS-09-58854 and the National Institutes of Health Grant No. 1R01GM123296 and NIH Research Resource Computer Cluster Grant No. S10-OD020095.
REFERENCES
- 1.Noé F., Schütte C., Vanden-Eijnden E., Reich L., and Weikl T. R., Proc. Natl. Acad. Sci. U. S. A. 106, 19011 (2009). 10.1073/pnas.0905466106 [DOI] [PMC free article] [PubMed] [Google Scholar]
- 2.Voelz V. A., Bowman G. R., Beauchamp K., and Pande V. S., J. Am. Chem. Soc. 132, 1526 (2010). 10.1021/ja9090353 [DOI] [PMC free article] [PubMed] [Google Scholar]
- 3.Prinz J.-H., Wu H., Sarich M., Keller B., Senne M., Held M., Chodera J. D., Schütte C., and Noé F., J. Chem. Phys. 134, 174105 (2011). 10.1063/1.3565032 [DOI] [PubMed] [Google Scholar]
- 4.Chodera J. D. and Noé F., Curr. Opin. Struct. Biol. 25, 135 (2014). 10.1016/j.sbi.2014.04.002 [DOI] [PMC free article] [PubMed] [Google Scholar]
- 5.Noé F., Chodera J., Bowman G., Pande V., and Noé F., An Introduction to Markov State Models and Their Application to Long Timescale Molecular Simulation, Advances in Experimental Medicine and Biology Vol. 797 (Springer, 2014). [Google Scholar]
- 6.Huang X., Bowman G. R., Bacallado S., and Pande V. S., Proc. Natl. Acad. Sci. U. S. A. 106, 19765 (2009). 10.1073/pnas.0909088106 [DOI] [PMC free article] [PubMed] [Google Scholar]
- 7.Voelz V. A., Elman B., Razavi A. M., and Zhou G., J. Chem. Theory Comput. 10, 5716 (2014). 10.1021/ct500827g [DOI] [PubMed] [Google Scholar]
- 8.Shamsi Z., Moffett A. S., and Shukla D., Sci. Rep. 7, 12700 (2017). 10.1038/s41598-017-12874-7 [DOI] [PMC free article] [PubMed] [Google Scholar]
- 9.Doerr S. and De Fabritiis G., J. Chem. Theory Comput. 10, 2064 (2014). 10.1021/ct400919u [DOI] [PubMed] [Google Scholar]
- 10.Zimmerman M. I. and Bowman G. R., J. Chem. Theory Comput. 11, 5747 (2015). 10.1021/acs.jctc.5b00737 [DOI] [PubMed] [Google Scholar]
- 11.Zimmerman M. I., Porter J. R., Sun X., Silva R. R., and Bowman G. R., J. Chem. Theory Comput. 14, 5459 (2018). 10.1021/acs.jctc.8b00500 [DOI] [PMC free article] [PubMed] [Google Scholar]
- 12.Shamsi Z., Cheng K. J., and Shukla D., J. Phys. Chem. B 122, 8386 (2018). 10.1021/acs.jpcb.8b06521 [DOI] [PubMed] [Google Scholar]
- 13.Zhang B. W., Jasnow D., and Zuckerman D. M., J. Chem. Phys. 132, 054107 (2010). 10.1063/1.3306345 [DOI] [PMC free article] [PubMed] [Google Scholar]
- 14.Zwier M. C., Adelman J. L., Kaus J. W., Pratt A. J., Wong K. F., Rego N. B., Suárez E., Lettieri S., Wang D. W., Grabe M., Zuckerman D. M., and Chong L. T., J. Chem. Theory Comput. 11, 800 (2015). 10.1021/ct5010615 [DOI] [PMC free article] [PubMed] [Google Scholar]
- 15.Dickson A. and Lotz S. D., J. Phys. Chem. B 120, 5377 (2016). 10.1021/acs.jpcb.6b04012 [DOI] [PubMed] [Google Scholar]
- 16.Lotz S. D. and Dickson A., J. Am. Chem. Soc. 140, 618 (2018). 10.1021/jacs.7b08572 [DOI] [PubMed] [Google Scholar]
- 17.Dixon T., Lotz S. D., and Dickson A., J. Comput.-Aided Mol. Des. 32, 1001– 1012 (2018). 10.1007/s10822-018-0149-3 [DOI] [PMC free article] [PubMed] [Google Scholar]
- 18.Trendelkamp-Schroer B. and Noe F., Phys. Rev. X 6, 011009 (2016). 10.1103/physrevx.6.011009 [DOI] [Google Scholar]
- 19.Nüske F., Wu H., Prinz J.-H., Wehmeyer C., Clementi C., and Noé F., J. Chem. Phys. 146, 094104 (2017). 10.1063/1.4976518 [DOI] [Google Scholar]
- 20.Lindorff-Larsen K., Piana S., Dror R. O., and Shaw D. E., Science 334, 517 (2011). 10.1126/science.1208351 [DOI] [PubMed] [Google Scholar]
- 21.Wu H., Mey A. S. J. S., Rosta E., and Noé F., J. Chem. Phys. 141, 214106 (2014). 10.1063/1.4902240 [DOI] [PubMed] [Google Scholar]
- 22.Bowman G. R., Beauchamp K. A., Boxer G., and Pande V. S., J. Chem. Phys. 131, 124101 (2009). 10.1063/1.3216567 [DOI] [PMC free article] [PubMed] [Google Scholar]
- 23.Jaeger H., Neural Comput. 12, 1371 (2000). 10.1162/089976600300015411 [DOI] [PubMed] [Google Scholar]
- 24.Wu H., Prinz J.-H., and Noé F., J. Chem. Phys. 143, 144101 (2015). 10.1063/1.4932406 [DOI] [PubMed] [Google Scholar]
- 25.Scherer M. K., Trendelkamp-Schroer B., Paul F., Perez-Hernandez G., Hoffmann M., Plattner N., Wehmeyer C., Prinz J.-H., and Noé F., J. Chem. Theory Comput. 11, 5525 (2015). 10.1021/acs.jctc.5b00743 [DOI] [PubMed] [Google Scholar]
- 26.Stelzl L. S., Kells A., Rosta E., and Hummer G., J. Chem. Theory Comput. 13, 6328 (2017). 10.1021/acs.jctc.7b00373 [DOI] [PubMed] [Google Scholar]
- 27.Harrigan M. P., Sultan M. M., Hernández C. X., Husic B. E., Eastman P., Schwantes C. R., Beauchamp K. A., McGibbon R. T., and Pande V. S., Biophys. J. 112, 10 (2017). 10.1016/j.bpj.2016.10.042 [DOI] [PMC free article] [PubMed] [Google Scholar]
- 28.Nguyen H., Jäger M., Moretto A., Gruebele M., and Kelly J. W., Proc. Natl. Acad. Sci. U. S. A. 100, 3948 (2003). 10.1073/pnas.0538054100 [DOI] [PMC free article] [PubMed] [Google Scholar]
- 29.Jäger M., Zhang Y., Bieschke J., Nguyen H., Dendle M., Bowman M. E., Noel J. P., Gruebele M., and Kelly J. W., Proc. Natl. Acad. Sci. U. S. A. 103, 10648 (2006). 10.1073/pnas.0600511103 [DOI] [PMC free article] [PubMed] [Google Scholar]
- 30.Liu F. and Gruebele M., Chem. Phys. Lett. 461, 1 (2008). 10.1016/j.cplett.2008.04.075 [DOI] [Google Scholar]
- 31.Dave K., Jäger M., Nguyen H., Kelly J. W., and Gruebele M., J. Mol. Biol. 428, 1617 (2016). 10.1016/j.jmb.2016.02.008 [DOI] [PMC free article] [PubMed] [Google Scholar]
- 32.Liu F., Du D., Fuller A. A., Davoren J. E., Wipf P., Kelly J. W., and Gruebele M., Proc. Natl. Acad. Sci. U. S. A. 105, 2369 (2008). 10.1073/pnas.0711908105 [DOI] [PMC free article] [PubMed] [Google Scholar]
- 33.Gao Y., Zhang C., Wang X., and Zhu T., Chem. Phys. Lett. 679, 112 (2017). 10.1016/j.cplett.2017.04.074 [DOI] [Google Scholar]
- 34.Best R. B., Hummer G., and Eaton W. A., Proc. Natl. Acad. Sci. U. S. A. 110, 17874 (2013). 10.1073/pnas.1311599110 [DOI] [PMC free article] [PubMed] [Google Scholar]
- 35.Piana S., Sarkar K., Lindorff-Larsen K., Guo M., Gruebele M., and Shaw D. E., J. Mol. Biol. 405, 43 (2011). 10.1016/j.jmb.2010.10.023 [DOI] [PubMed] [Google Scholar]
- 36.Nguyen H., Jäger M., Kelly J. W., and Gruebele M., J. Phys. Chem. B 109, 15182 (2005). 10.1021/jp052373y [DOI] [PubMed] [Google Scholar]
- 37.Horng J.-C., Moroz V., and Raleigh D. P., J. Mol. Biol. 326, 1261 (2003). 10.1016/s0022-2836(03)00028-7 [DOI] [PubMed] [Google Scholar]
- 38.Cho J.-H. and Raleigh D. P., J. Mol. Biol. 353, 174 (2005). 10.1016/j.jmb.2005.08.019 [DOI] [PubMed] [Google Scholar]
- 39.Schwantes C. R. and Pande V. S., J. Chem. Theory Comput. 9, 2000 (2013). 10.1021/ct300878a [DOI] [PMC free article] [PubMed] [Google Scholar]
- 40.Cho J.-H., Meng W., Sato S., Kim E. Y., Schindelin H., and Raleigh D. P., Proc. Natl. Acad. Sci. U. S. A. 111, 12079 (2014). 10.1073/pnas.1402054111 [DOI] [PMC free article] [PubMed] [Google Scholar]
- 41.Baiz C. R., Lin Y.-S., Peng C. S., Beauchamp K. A., Voelz V. A., Pande V. S., and Tokmakoff A., Biophys. J. 106, 1359 (2014). 10.1016/j.bpj.2014.02.008 [DOI] [PMC free article] [PubMed] [Google Scholar]
- 42.Cho J.-H., Sato S., and Raleigh D. P., J. Mol. Biol. 338, 827 (2004). 10.1016/j.jmb.2004.02.073 [DOI] [PubMed] [Google Scholar]
- 43.Wan H., Zhou G., and Voelz V. A., J. Chem. Theory Comput. 12, 5768 (2016). 10.1021/acs.jctc.6b00938 [DOI] [PubMed] [Google Scholar]
- 44.Perez-Hernandez G., Paul F., Giorgino T., De Fabritiis G., and Noé F., J. Chem. Phys. 139, 015102 (2013). 10.1063/1.4811489 [DOI] [PubMed] [Google Scholar]
- 45.McGibbon R. T. and Pande V. S., J. Chem. Phys. 142, 124105 (2015). 10.1063/1.4916292 [DOI] [PMC free article] [PubMed] [Google Scholar]
- 46.Beauchamp K. A., McGibbon R., Lin Y.-S., and Pande V. S., Proc. Natl. Acad. Sci. U. S. A. 109, 17807 (2012). 10.1073/pnas.1201810109 [DOI] [PMC free article] [PubMed] [Google Scholar]
- 47.Hruska E., Abella J. R., Nüske F., Kavraki L. E., and Clementi C., J. Chem. Phys. 149, 244119 (2018). 10.1063/1.5053582 [DOI] [PubMed] [Google Scholar]
- 48.Wu H., Paul F., Wehmeyer C., and Noé F., Proc. Natl. Acad. Sci. U. S. A. 113, E3221 (2016). 10.1073/pnas.1525092113 [DOI] [PMC free article] [PubMed] [Google Scholar]


