Abstract
Oncogenic activation of Ras is associated with the acquisition of a unique set of metabolic dependencies that contribute to tumor cell fitness. Mutant Ras cells are endowed with the capability to internalize and degrade extracellular protein via a fluid–phase uptake mechanism termed macropinocytosis1. There is a growing appreciation for the role of this Ras-dependent process in the generation of free amino acids that can be used to support tumor cell growth under nutrient limiting conditions2. However, little is known about the molecular steps that mediate the induction of macropinocytosis by oncogenic Ras. Here we identify vacuolar ATPase (v-ATPase) as an essential regulator of Ras-induced macropinocytosis. Oncogenic Ras promotes the translocation of v-ATPase from intracellular membranes to the plasma membrane (PM) via a pathway that requires protein kinase A (PKA) activation by a bicarbonate-dependent soluble adenylate cyclase (sAC). PM accumulation of v-ATPase is necessary for the cholesterol-dependent association of Rac1 with the PM, a prerequisite for the stimulation of membrane ruffling and macropinocytosis. These observations identify a link between v-ATPase trafficking and nutrient supply by macropinocytosis that could be exploited to curtail the metabolic adaptation capacity of mutant Ras tumor cells.
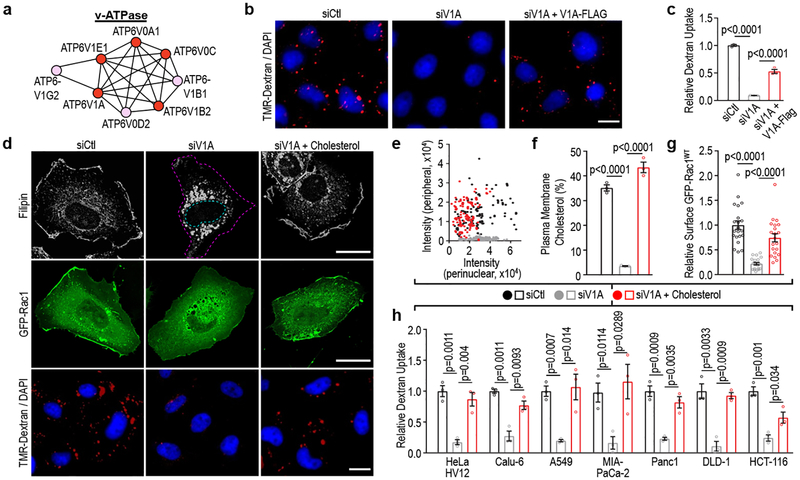
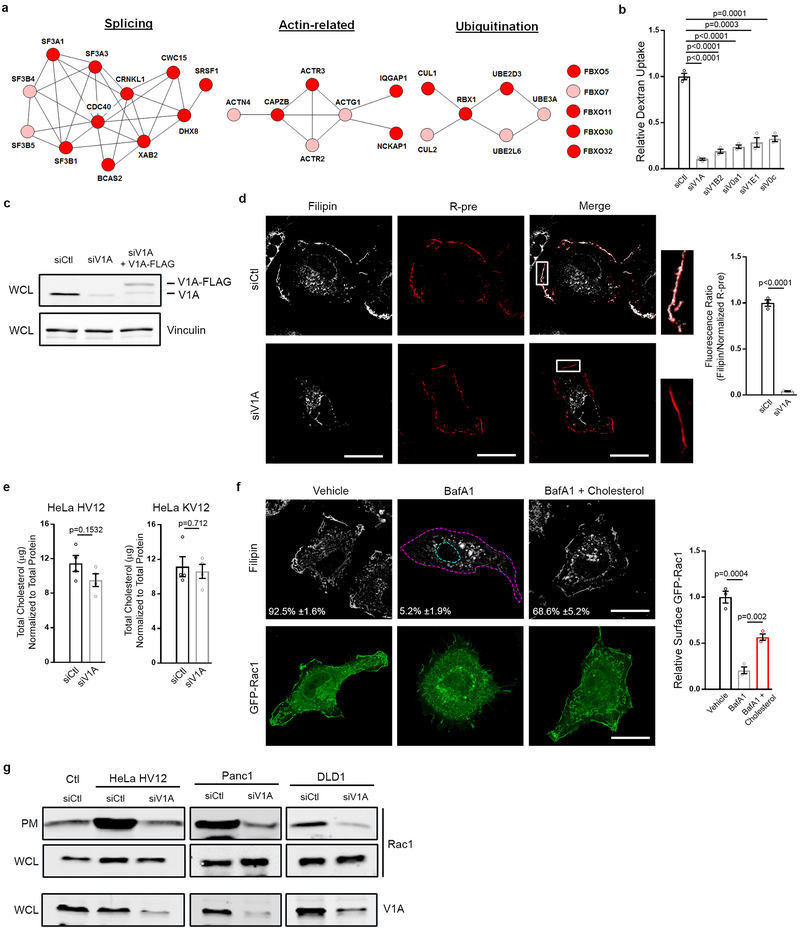
To identify essential mediators of Ras-driven macropinocytosis, we conducted a full genome siRNA screen using a microscopy-based high-throughput assay in which oncogenic HRas (HRasV12)-dependent induction of macropinocytosis in HeLa cells is measured by uptake of fluorescently-labeled high molecular weight dextran3. Confirmed hits from the screen displaying >70% inhibition of macropinocytosis were analyzed using STRING. Four main networks emerged from this analysis corresponding to splicing, actin, ubiquitination, and v-ATPase (Fig. 1a; Extended Data Fig. 1a). Given the striking enrichment of screen hits mapping to the v-ATPase protein complex and the increasing appreciation for the role of v-ATPase in tumorigenesis and metastasis4, we focused on delineating the functional link between v-ATPase and oncogenic Ras-induced macropinocytosis.
Figure 1 |. v-ATPase is required for Ras-induced macropinocytosis and plasma membrane-localized cholesterol.
a, v-ATPase cluster defined by STRING analysis (Pink, 1° screen; Red, 1° and confirmation screen). b-c, Effect of v-ATPase depletion (siV1A) and rescue (siV1A+V1A-FLAG) on macropinocytosis in HeLa T7-HRasV12 (HV12) cells. b, Fluorescence micrographs of TMR-dextran uptake. c, Quantification of TMR-dextran uptake. d-g, Effect of v-ATPase depletion on cholesterol distribution, Rac1 localization, and macropinocytosis in HeLa HV12 cells treated as shown. d, Fluorescence micrographs of cholesterol localization (filipin, top), GFP-Rac1 localization (middle) and TMR-dextran uptake (bottom). Dashed lines delineate the cell and nucleus. e,f, Quantification of cholesterol distribution displayed as (e) scatter plot (each dot represents a cell) and (f) bar graph. g, Quantification of PM localization of GFP-Rac1. h, Quantification of cholesterol-dependent dextran uptake in mutant Ras cells. Images (b,d) are representative of three biological replicates. Scale bars, 10μm. ≥500 (c,h), ≥50 (e,f), and ≥7 (g) cells were quantified in each biological replicate (n=3) with error bars indicating mean ±s.e.m. where shown; p value: unpaired, two-tailed Student t-test.
v-ATPase is required for macropinocytosis
v-ATPase is a multi-subunit transmembrane complex that transduces protons from the cytoplasm to the lumen of organelles and across the PM4. The role of v-ATPase in regulating a wide array of membrane trafficking and intracellular transport processes is well documented; however, its contribution to macropinocytosis has not been described4. We confirmed that knockdown of v-ATPase subunits identified in the screen inhibit macropinocytosis in HeLa HRasV12 cells (Extended Data Fig. 1b). Among these, knockdown of the ATP6V1A (V1A) subunit, a component of the catalytic domain of the pump, was accompanied by the strongest inhibitory effect on macropinocytosis, and thus was selected for further analyses. Knockdown of V1A using siRNA targeting the 3’ un-translated region (UTR) led to a 90% inhibition of macropinocytosis, which could be rescued by ectopic expression of a 3X FLAG-tagged V1A construct, ruling out off-target effects (Fig. 1b,c; Extended Data Fig. 1c).
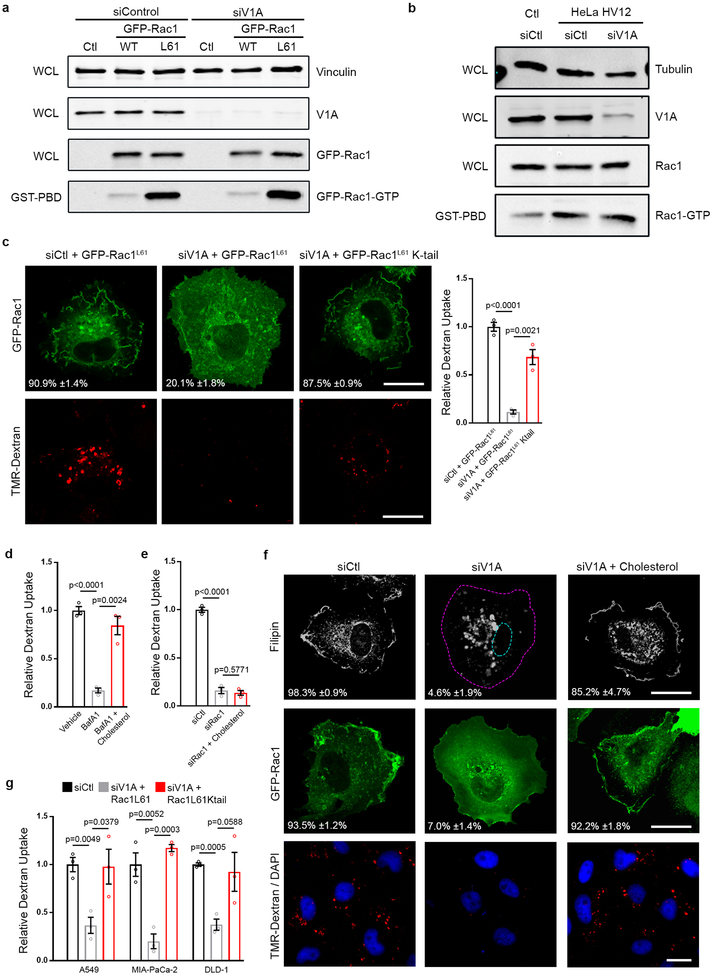
v-ATPase is required for trafficking of cholesterol from endocytic organelles to the PM5. Given that Rac1, a critical regulator of macropinocytosis, is dependent on PM cholesterol for proper localization and activation6,7, we tested whether the contribution of v-ATPase to macropinocytosis might be causally related to cholesterol-dependent PM localization of Rac1. Consistent with previous results5,8, siRNA-mediated depletion of v-ATPase resulted in loss of cholesterol from the PM and its accumulation in intracellular punctae (Fig. 1d–f; Extended Data Fig. 1d). No change in overall cholesterol levels was detected following depletion of v-ATPase (Extended Data Fig. 1e). Additionally, the v-ATPase inhibitor, Bafilomycin A1, resulted in loss of PM cholesterol consistent with a requirement for v-ATPase activity in cholesterol trafficking (Extended Data Fig. 1f). Fluorescence microscopy and biochemical analyses of Rac1 localization demonstrated that redistribution of cholesterol in v-ATPase-depleted or v-ATPase-inhibited cells was accompanied by reduced levels of PM-associated Rac1 (Fig. 1d,g; Extended Data Fig. 1f,g). PM localization of Rac1 has been linked to its activation state6. However, we observed no change in Rac1-GTP levels following v-ATPase depletion (Extended Data Fig. 2a,b) indicating that dependence of Rac1 on v-ATPase for membrane localization is uncoupled from alterations to Rac1 activity, a conclusion further validated using a constitutively-active mutant of Rac1, GFP-Rac1L61. Similarly to wild-type Rac1, this mutant failed to interact with the PM in v-ATPase-depleted cells despite being fully active (Extended Data Fig. 2a,c).
Addition of exogenous cholesterol is a commonly used approach to deliver cholesterol to membranes8. We found that addition of cholesterol to growth medium of v-ATPase-depleted or v-ATPase-inhibited cells restored PM pools of cholesterol and rescued macropinocytosis and Rac1 membrane localization (Fig. 1d–h; Extended Data Fig. 1f; Extended Data Fig. 2d). In contrast, cholesterol addition to Rac1-depleted cells failed to rescue macropinocytosis (Extended Data Fig. 2e). Furthermore, introduction of a Rac1 construct in which the native cholesterol-dependent membrane targeting sequence was replaced with the cholesterol-independent membrane targeting sequence of KRas into v-ATPase-depleted cells was sufficient to rescue macropinocytosis (Extended Data Fig. 2c)9. Lastly, the requirement of v-ATPase for macropinocytosis, which could be bypassed by the addition of cholesterol or the cholesterol-independent Rac1 construct, was displayed by multiple mutant KRas cell lines (Fig. 1h; Extended Data Fig. 2f,g). Together, these results indicate that the failure of oncogenic Ras to induce macropinocytosis in v-ATPase-depleted cells can be attributed to impaired PM localization of Rac1 due to perturbed cholesterol trafficking. Consistent with this conclusion, several screen hits correspond to components of regulatory pathways controlling cholesterol metabolism and trafficking, including peroxisome proliferator-activated receptor subunits (α, γ, δ)10 and StAR-related lipid transfer protein 4[11].
Ras regulates v-ATPase localization
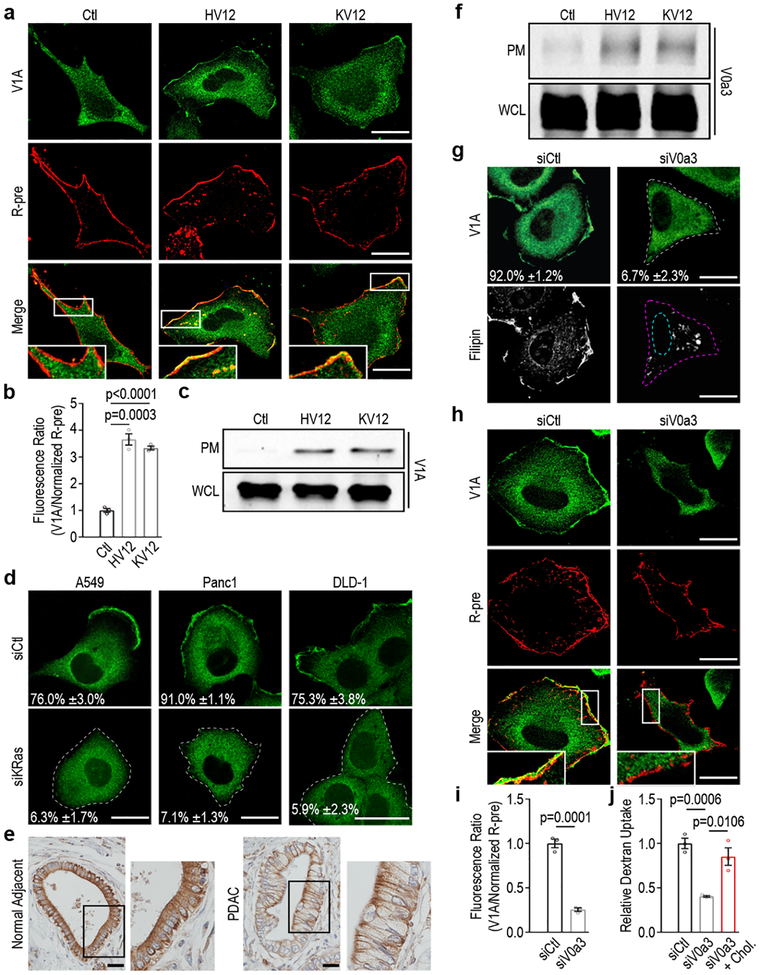
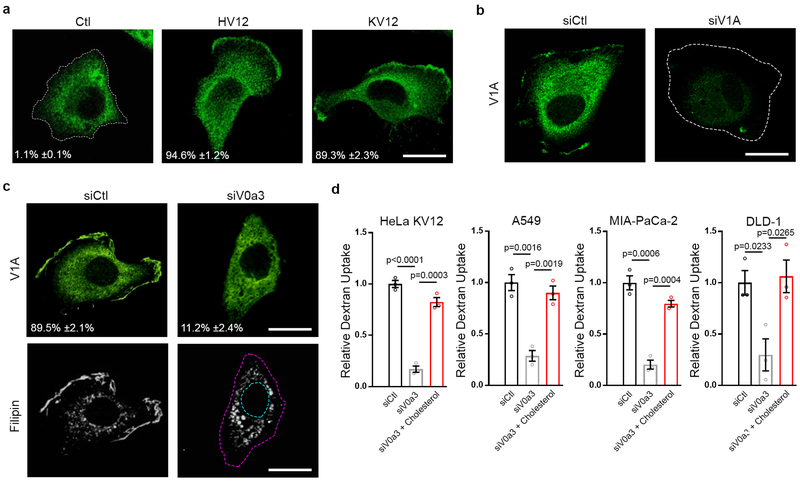
We next investigated the effect of oncogenic Ras on the subcellular distribution of v-ATPase. Whereas in HeLa cells harboring wild-type Ras localization of v-ATPase was predominantly cytoplasmic, expression of HRasV12 or KRasV12 in these cells led to pronounced accumulation of PM v-ATPase as determined by immunofluorescence image analysis using a V1A subunit-specific antibody (Fig. 2a,b; Extended Data Fig. 3a,b), and substantiated by subcellular fractionation (Fig. 2c). Furthermore, depletion of mutant KRas by siRNA in lung, pancreatic, and colon cancer cells was accompanied by loss of PM-associated v-ATPase, indicating an essential role for mutant Ras in maintaining PM pools of v-ATPase (Fig. 2d). Consistent with this postulate, immunohistochemistry staining of v-ATPase in human pancreatic ductal adenocarcinoma (PDAC) specimens revealed prominent cell periphery staining in neoplastic lesions in contrast to predominant cytoplasmic staining observed in adjacent normal tissues (Fig. 2e). Thus, mutant Ras-dependent PM v-ATPase displayed preferential accumulation in membrane ruffles consistent with patterns observed in invasive breast, melanoma and pancreatic cancer cells4,12–14.
Figure 2 |. Oncogenic Ras induces the translocation of v-ATPase to the plasma membrane.
a-d, Effect of oncogenic Ras expression on v-ATPase localization. a, Fluorescence micrographs of HeLa Ctl, HV12, and KV12 cells with V1A immunostaining (top), membrane labeling with R-pre (see Methods, middle), and merge (bottom). b, Quantification of the ratio of V1A to R-pre membrane localization from (a). c, Immunoblots of V1A in the plasma membrane (PM) fraction and whole cell lysate (WCL) from HeLa Ctl, HV12 and KV12 cells. d, Fluorescence micrographs of siRNA-transfected mutant Ras cells immunostained with anti-V1A. e, Immunohistochemical staining of V1A in a section from human pancreatic ductal adenocarcinoma (PDAC) and a section from normal adjacent tissue. Images are representative of staining patterns observed in 11/12 patients. f, Immunoblots of V0a3 in the plasma membrane (PM) fraction and whole cell lysate (WCL) from HeLa Ctl, HV12 and KV12 cells. g, Fluorescence micrographs of V1A immunostaining and filipin labeling of siRNA-transfected HeLa HV12 cells. h, Fluorescence micrographs of V1A immunostaining (top), membrane labeling with R-pre (middle), and merge (bottom) of siRNA-transfected HeLa HV12 cells. i, Quantification of the ratio of V1A to R-pre membrane localization from (h). j, Quantification of TMR-dextran uptake in siRNA-transfected HeLa HV12 cells treated as indicated. Images (a,d,g,h) and immunoblots (c,f) are representative of three biological replicates. For (d,g) the mean percentages ±s.e.m represent the fraction of cells that display V1A PM localization; dashed lines delineate the cell and/or nucleus. Indicated box is enlarged (a,h), inset, or (e), to the right. Scale bars, (a,d,g,h) 10μm and (e) 50μm. ≥500 (d,g,j) and ≥7 (b,i) cells were quantified in each biological replicate (n=3) with error bars indicating mean ±s.e.m. where shown; p value: unpaired, two-tailed Student t-test. For c,f, gel source data located in Supplementary Figure 1.
Mammalian v-ATPase is composed of two domains. The peripheral V1 domain is comprised of eight subunits (A-H) and is responsible for ATP hydrolysis, whereas the membrane-embedded V0 domain is comprised of six subunits (a, c, c’, c”, d and e) and is responsible for proton translocation4. Targeting of v-ATPase to different cellular membranes is controlled by isoforms of subunit a (V0a1-V0a4), with V0a3 and V0a4 responsible for directing v-ATPase complexes to the PM4. We established a role for V0a3 in mediating mutant Ras-dependent PM localization based on the observation that expression of HRasV12 or KRasV12 led to an increase in pools of PM-associated V0a3 (Fig. 2f), and suppression of V0a3 expression via siRNA-mediated targeting was associated with preferential loss of PM-associated v-ATPase (Fig. 2g–i; Extended Data Fig. 3c). We used the latter approach to further assess the specific role of PM-associated v-ATPase in Ras-induced macropinocytosis. Silencing of V0a3 resulted in inhibition of macropinocytosis in cells expressing mutant Ras (Fig. 2j; Extended Data Fig. 3d), indicating that oncogenic Ras-dependent recruitment of v-ATPase to the PM constitutes an essential step in macropinocytosis induction. Significantly, mutant Ras cells in which PM localization of v-ATPase was specifically abrogated displayed loss of PM cholesterol, while addition of cholesterol was sufficient to rescue the defect in macropinocytosis observed in these cells (Fig. 2g,j; Extended Data Fig. 3c,d). Thus, cholesterol trafficking in mutant Ras cells is critically dependent on PM-localized v-ATPase.
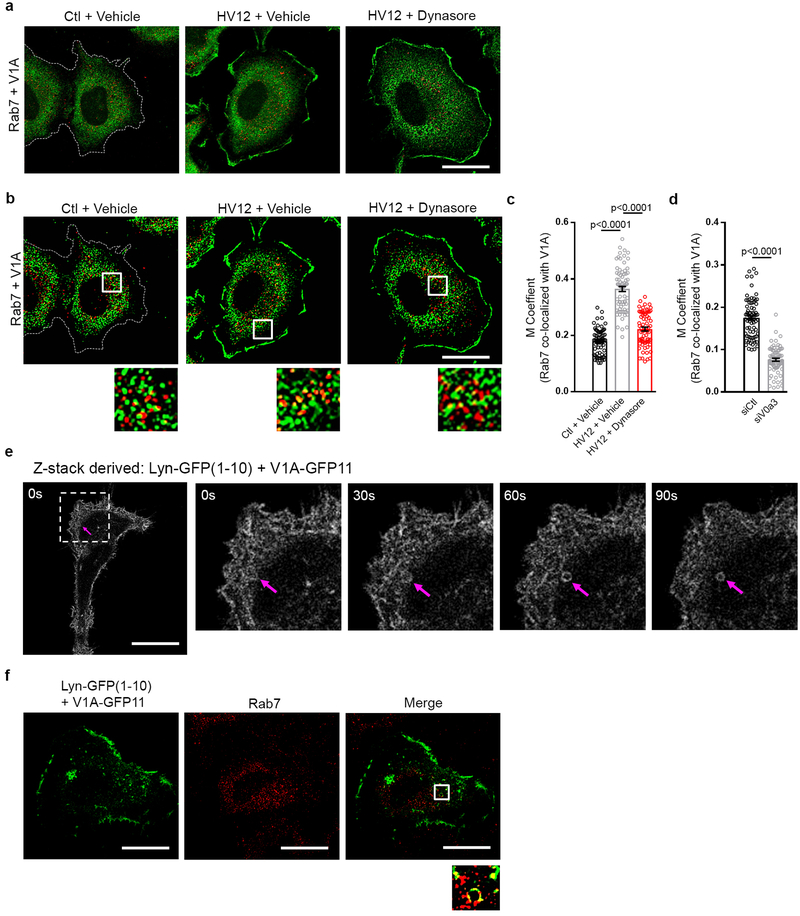
The abundance of PM cholesterol is principally regulated by efflux of cholesterol from endosomes, a process requiring endosomal acidification15. Since it is well established that v-ATPase molecules shuttle between the PM and endosomes16,17, we investigated the relationship between PM and endosomal pools of v-ATPase in mutant Ras cells. Using quantitative colocalization analysis, we found that mutant Ras expression resulted in significant enrichment of endosomal populations dual positive for v-ATPase and the endosomal marker Rab7 (Extended Data Fig. 4a–c). This enrichment was substantially reduced when PM v-ATPase was specifically eliminated by silencing of V0a3 (Extended Data Fig. 4d), suggesting that enrichment of endosomal v-ATPase observed in mutant Ras cells is mediated by endocytic trafficking of PM-associated v-ATPase. Accordingly, blocking endocytic internalization of PM v-ATPase using an endocytosis inhibitor, dynasore, inhibited mutant Ras-dependent accumulation of endosomal v-ATPase (Extended Data Fig. 4b,c). Moreover, using self-complementing split fluorescent protein technology to monitor trafficking of v-ATPase in real time, we found that PM v-ATPase is internalized into intracellular vesicular structures, including Rab7-positive endosomes (Extended Data Fig. 4e,f). Functionally, increased endosomal pools of v-ATPase could promote cholesterol transport by contributing to endosomal acidification15. Collectively, these results indicate that mutant Ras modulates cholesterol trafficking by affecting partitioning of v-ATPase into subcellular compartments that control cholesterol transport.
Ras-bicarbonate signaling and macropinocytosis
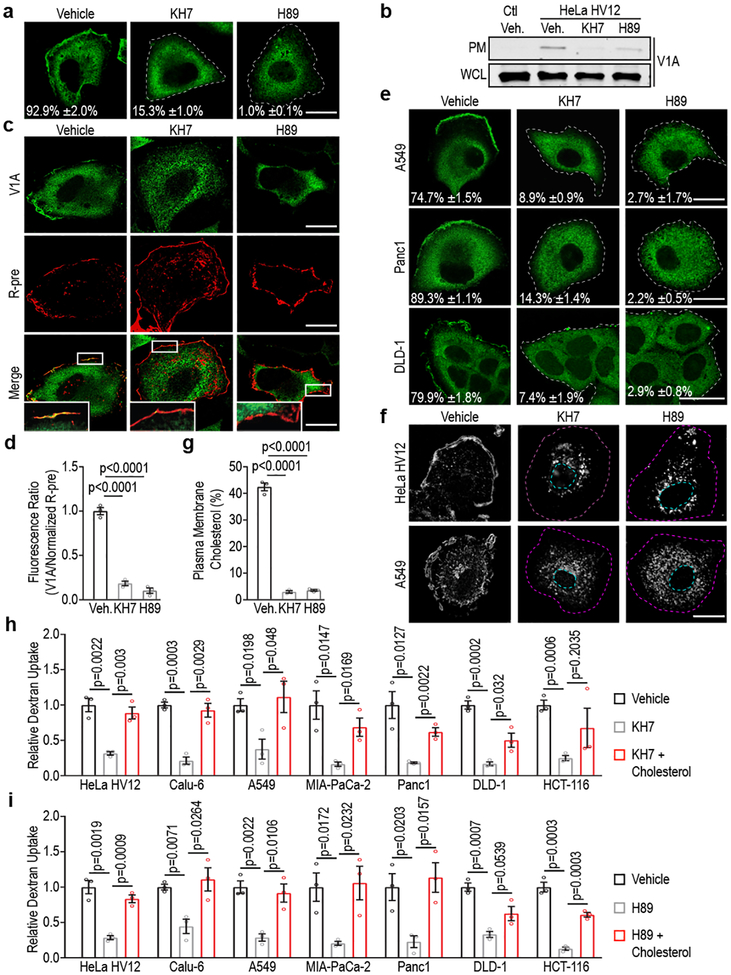
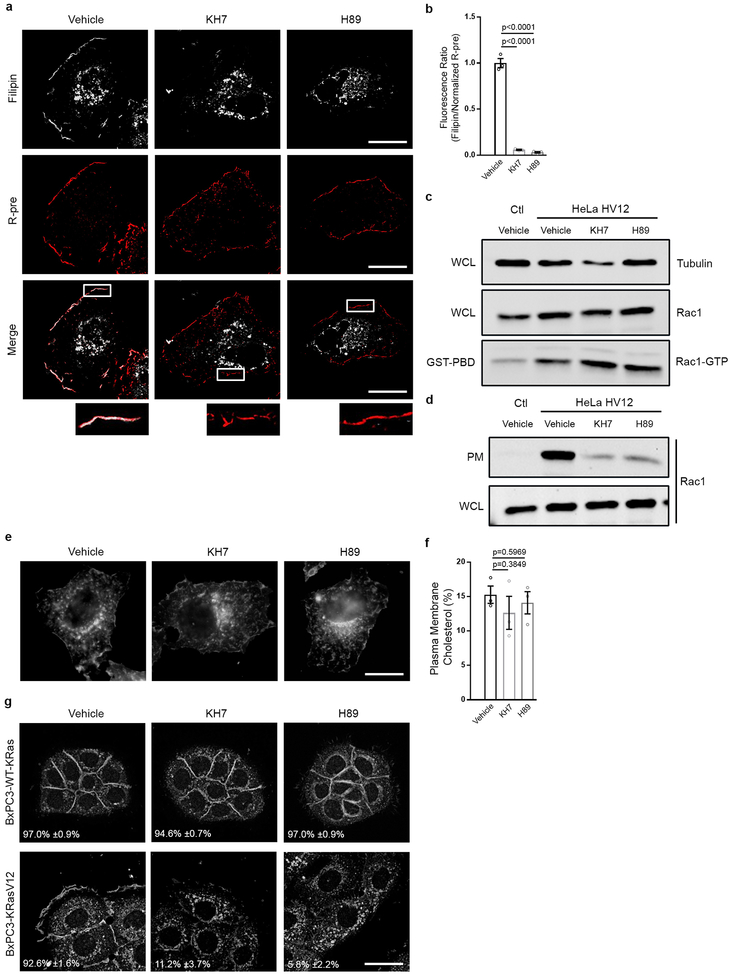
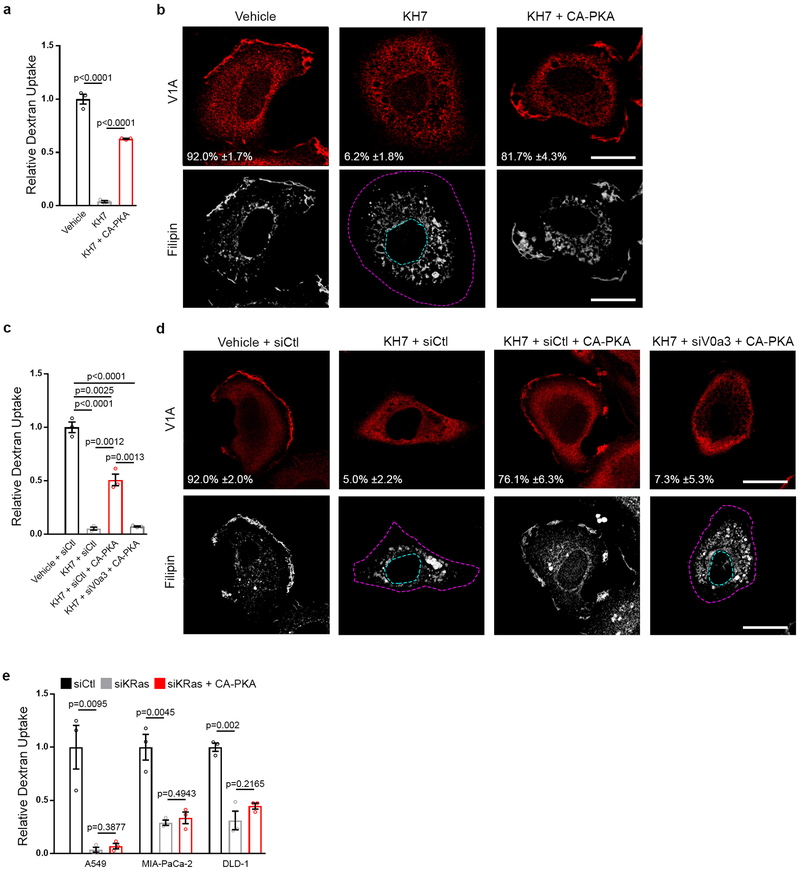
Next, we sought to identify the steps downstream of oncogenic Ras mediating PM-translocation of v-ATPase. Regulation of PM accumulation of v-ATPase has been extensively studied in epithelial cells that rely on PM localization of the pump for extracellular acidification, including renal intercalated cells where v-ATPase is responsible for acid secretion into urine, and epididymal clear cells where acid secretion facilitates sperm maturation4. In these cells, trafficking of v-ATPase to the PM has been shown to be mediated by activation of bicarbonate-dependent sAC, which increases cAMP levels thereby activating PKA4. To test the contribution of the sAC/PKA pathway to oncogenic Ras-dependent translocation of v-ATPase to the PM, cells harboring ectopically expressed or endogenous mutant Ras were treated with the PKA inhibitor H89 and sAC inhibitor KH7. Both agents specifically inhibited PM localization of v-ATPase as determined by microscopic and biochemical analysis (Fig. 3a–e). Interference of v-ATPase membrane localization was accompanied by loss of PM cholesterol and reduced macropinocytosis, which could be rescued by addition of exogenous cholesterol (Fig. 3f–i, Extended Data Fig. 5a,b). Additionally, sAC/PKA inhibition led to impaired Rac1 PM localization without effecting Rac1 activation (Extended Data Fig. 5c,d). Strikingly, neither KH7 nor H89 had an effect on cholesterol distribution in HeLa or BxPC3 cells harboring wild-type Ras (Extended Data Fig. 5e–g). However, upon introduction of oncogenic Ras, BxPC3 cells displayed an appreciable change in cholesterol distribution following KH7 and H89 treatment (Extended Data Fig. 5g). Taken together these results indicate that the observed consequences of perturbing the sAC/PKA axis reflect the specific function of this axis downstream of oncogenic Ras and upstream of v-ATPase/cholesterol-dependent macropinocytosis. This conclusion is further supported by our finding that impaired macropinocytosis as well as PM localization of v-ATPase and cholesterol observed in KH7-treated mutant Ras cells could be rescued by expression of constitutively-active PKA (CA-PKA) (Extended Data Fig. 6a,b). This rescuing effect was abrogated when cells were depleted of PM v-ATPase through knockdown of V0a3, indicating that the effects of PKA are mediated by PM v-ATPase (Extended Data Fig. 6c,d). It is worth noting that CA-PKA failed to rescue macropinocytosis in KRas knockdown cells, indicating that while PKA activation is necessary for mutant KRas-dependent v-ATPase PM translocation and induction of macropinocytosis, it is not sufficient (Extended Data Fig. 6e).
Figure 3 |. Oncogenic Ras-induced macropinocytosis is dependent on sAC/PKA pathway.
a-e, Effect of inhibition of sAC (KH7) or PKA (H89) on v-ATPase membrane translocation. a,e, Immunofluorescence staining pattern of V1A in (a) HeLa HV12 and (e) mutant Ras cells treated as indicated. b, Immunoblots of V1A expression in the plasma membrane (PM) fraction and whole cell lysate (WCL) from HeLa Ctl and HV12 cells treated as indicated. Gel source data located in Supplementary Figure 1. c, Fluorescence micrographs of HeLa HV12 cells treated as indicated with V1A immunostaining (top), membrane labeling with R-pre (middle), and merge (bottom). Indicated box enlarged, inset. d, Quantification of the ratio of V1A to R-pre membrane localization from (c); vehicle (veh). f, Fluorescence micrographs of cholesterol (filipin) distribution in cells treated as indicated. g, Quantification of PM cholesterol in HeLa HV12 cells treated as indicated. h,i, Quantification of TMR-dextran uptake in mutant Ras cells following treatment with vehicle, (h) KH7 or (i) H89 with or without exogenous cholesterol. Images (a,c,e,f) and immunoblot (b) are representative of three biological replicates. For a,e, the mean percentages ±s.e.m represent the fraction of cells that display V1A PM localization. Scale bars, 10μm. Dashed lines delineate cell and/or nucleus. ≥500 (a,e,h,i), ≥7 (d), and ≥50 (g) cells were quantified in each biological replicate (n=3) with error bars indicating mean ±s.e.m. where shown; p value: unpaired, two-tailed Student t-test.
Ras-bicarbonate signaling and tumorigenesis
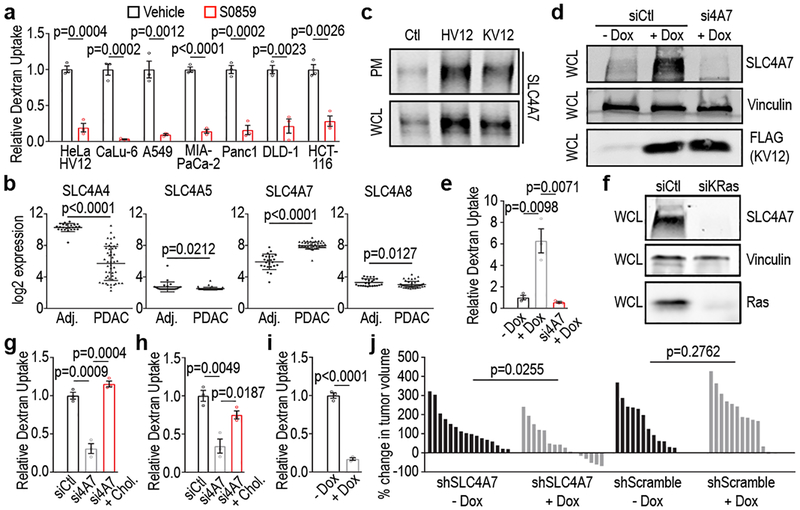
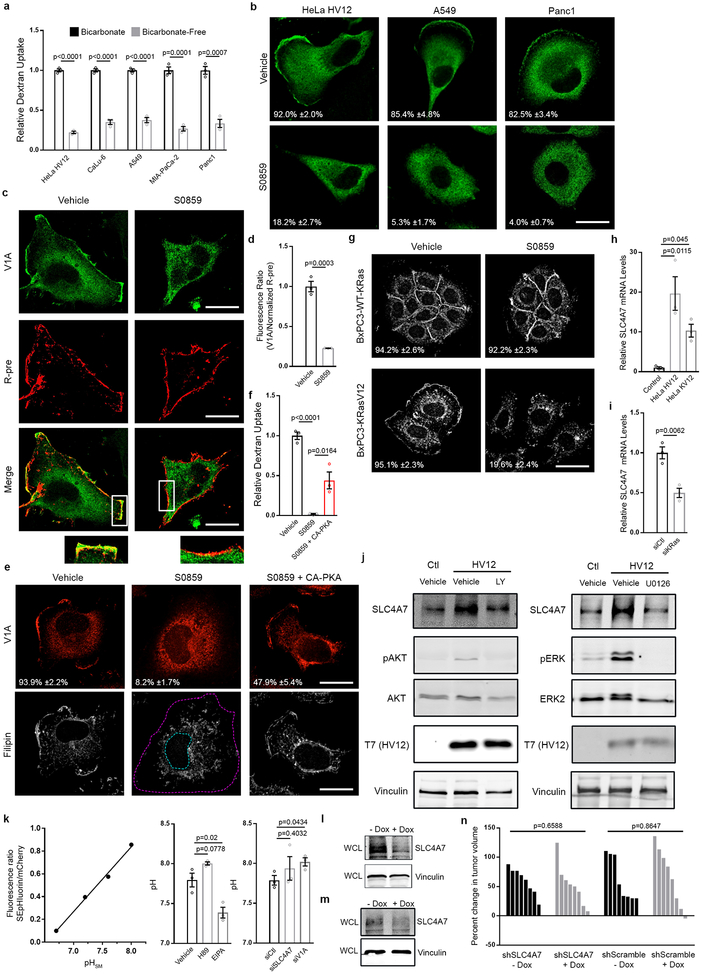
Given the exquisite dependence of sAC activation on bicarbonate18, and the requirement of sAC activity for oncogenic Ras-induced macropinocytosis, we set out to identify the source of bicarbonate potentially contributing to this process. Incubation of cells harboring ectopically expressed or endogenous mutant Ras in bicarbonate-free medium, resulted in inhibition of dextran uptake, indicating an essential role for extracellular bicarbonate in Ras-induced, sAC/PKA-dependent macropinocytosis (Extended Data Fig. 7a). Transmembrane flux of bicarbonate is facilitated by bicarbonate transport proteins19. Several bicarbonate transporters have been implicated in cancer including the SLC4 family of co-transporters19,20. Treatment of mutant Ras cells with the SLC4-family inhibitor S0859 led to significant inhibition of macropinocytosis (Fig. 4a), and mutant Ras-dependent v-ATPase PM localization was abrogated in S0859-treated cells (Extended Data Fig. 7b,c,d). Expression of CA-PKA in S0859-treated mutant Ras cells restored macropinocytosis and PM localization of v-ATPase and cholesterol (Extended Data Fig. 7e,f) consistent with the role of SLC4 transporters in regulating macropinocytosis via sAC-mediated PKA activation. Treatment of BxPC-3 cells with S0859 had no effect on cholesterol distribution (Extended Data Fig. 7g), however, expression of mutant Ras in these cells restored sensitivity to the inhibitor indicating that the dependency on SLC4 transporters is linked to oncogenic mutant Ras signaling (Extended Data Fig. 7g).
Figure 4 |. SLC4A7 is necessary for Ras-induced macropinocytosis and tumor growth.
a, Quantification of TMR-dextran uptake following treatment of mutant Ras cells as shown. b, mRNA transcript levels of SLC4 family members in PDAC compared to normal adjacent (Adj) tissue from 74 patients (n=50 PDAC, n=24 adjacent normal). c, Effect of oncogenic Ras expression on SLC4A7 protein levels. Immunoblots of SLC4A7 in the plasma membrane (PM) fraction and whole cell lysate (WCL) from HeLa Ctl, HV12, or KV12 cells. d,e, Effect of doxycycline-inducible FLAG-KRasV12 (+Dox) expression in BxPC-3 cells on SLC4A7 expression and macropinocytosis. d, Immunoblot of SLC4A7 expression (vinculin, loading control) and (e) quantification of FITC-dextran uptake with or without Dox treatment following SLC4A7 knockdown in BxPC-3 cells. f, Immunoblot of SLC4A7 expression (vinculin, loading control) following KRas knockdown in MIA-PaCa-2 cells. g,h, Quantification of TMR-dextran uptake following SLC4A7 knockdown in (g) HeLa HV12 and (h) MIA-PaCa-2 cells treated as shown. i-j, Effect of dox-inducible SLC4A7 depletion in MIA-PaCa2 cells on macropinocytosis and tumor growth. i, Quantification of FITC-dextran uptake treated as shown. j, Waterfall plots of xenografts treated as shown relative to baseline. Each bar represents a tumor. Immunoblots (c,d,f) are representative of three biological replicates. ≥500 (a,e,g,h,i) cells were quantified in each biological replicate (n=3) with error bars indicating mean ±s.e.m.; p value: unpaired, two-tailed Student t-test. For c,d,f, gel source data located in Supplementary Figure 1.
The SLC4 family comprises 10 genes of which 5 members, SLC4A4, SLC4A5, SLA4A7, SLC4A8 and SLC4A10, are Na+-coupled bicarbonate transporters that mediate bicarbonate import across the PM19,20. Analysis of expression of these transporters in human PDAC datasets revealed that SLC4A7 was uniquely upregulated in PDAC tumors (Fig. 4b). We next investigated the causal relationship between oncogenic Ras and SLC4A7 expression. As illustrated (Figure 4c–e; Extended Data Fig. 7h), ectopic expression of HRasV12 and KRasV12 in wild-type Ras cells (HeLa and BxPC-3) led to increased SLC4A7 expression at both the message and protein levels, the latter reflected in both total and PM-protein levels. Conversely, depletion of mutant KRas expression by siRNA in PDAC cells harboring mutant Ras resulted in decreased SLC4A7 mRNA and protein (Fig. 4f; Extended Data Fig. 7i). Significantly, SLC4A7 loss by siRNA resulted in inhibition of macropinocytosis, an effect that could be rescued by addition of cholesterol (Fig. 4g,h). This suggests that the dependence of mutant Ras-induced macropinocytosis on SLC4A7 relates to its essential role in mediating mutant Ras-driven cholesterol trafficking to the PM. Our interpretation is supported by the observation that sensitivity of cholesterol transport to inhibition of SLC4-mediated bicarbonate transport is specifically displayed by mutant Ras expressing cells (Extended Fig. 7g).
Upregulation of SLC4A7 has been observed in human breast cancer, where it has been linked to ErbB receptor-mediated signaling21. Currently little is known about the relationship between deregulated ErbB signaling and macropinocytosis, however, it is well known that ligand-induced activation of EGFR, a member of the ErbB receptor family, stimulates macropinocytosis22. Furthermore, PI3K/Akt signaling, a critical effector pathway for Ras-induced macropinocytosis23, and MEK/ERK signaling have been implicated in ErbB-dependent upregulation of SLC4A7[21]. Consistent with these observations, we have found that mutant Ras-dependent upregulation of SLC4A7 was abrogated upon treatment with PI3K and MEK inhibitors, indicating the importance of both effector pathways in this initial step of mutant Ras-dependent macropinocytosis (Extended Data Fig. 7j).
Maintenance of submembranous alkaline pH (pHsm) has been shown to be essential for the actin cytoskeleton dynamics that regulate membrane ruffling and macropinocytosis24. To test the extent to which the identified roles of v-ATPase and SLC4A7 in Ras-induced macropinocytosis could be attributed to effects on pHsm, we exploited a dual-emission fluorescent construct to ratiometrically measure pHsm24. Our results demonstrate that depletion of SLC4A7 or v-ATPase does not lead to decreased pHsm indicating that their requirement for mutant Ras-induced macropinocytosis is not linked to alterations in pHsm homeostasis (Extended Data Fig. 7k).
Collectively, our observations implicate SLC4A7 as an essential mediator of Ras-induced macropinocytosis, a process previously shown to support tumor growth1. Therefore, we sought to directly evaluate the role of SLC4A7 in tumor progression using a xenograft mouse model1. A MIA-PaCa-2 stable cell line harboring a doxycycline-inducible short hairpin targeting SLC4A7, which shows decreased macropinocytosis upon knockdown (Fig. 4i; Extended Data Fig. 7l), was implanted into flanks of nude mice. When tumors attained an average volume of 50–100mm3, doxycycline was administered to induce SLC4A7 knockdown. After 14 days, relative to control tumors, tumors induced with doxycycline displayed attenuated growth, and in some cases regression (Fig. 4j). Importantly, doxycycline treatment in MIA-PaCa-2 shScramble had no effect on tumor progression. Furthermore, using the same doxycycline-inducible knockdown of SLC4A7 approach in wild-type Ras BxPC-3 cells had no impact on tumor growth (Extended Data Fig. 7m,n). These results identify an essential role for SLC4A7 in mutant RAS-dependent pancreatic tumor growth.
This study implicates for the first time PM v-ATPase as a key mediator of oncogenic Ras-induced macropinocytosis. Engagement of the bicarbonate-dependent sAC/PKA signaling axis as the principle mechanism by which oncogenic Ras promotes membrane accumulation of v-ATPase may afford the coupled regulation of pH homeostasis and metabolic adaptation in mutant Ras-driven tumors. PM v-ATPases have been implicated in regulation of tumor cell drug sensitivity and invasive capacity4. Thus, in addition to its role in macropinocytosis, oncogenic Ras-induced translocation of v-ATPase to the PM might have a broader impact on critical fitness features of mutant Ras cells. Moreover, selective targeting of PM v-ATPase could offer a strategy for the development of therapeutics against mutant Ras tumors.
Methods:
Reagents and Constructs
70 kDa TMR-Dextran and FITC-Dextran were purchased from Fina Biosolutions (Rockville, MD). All chemicals were molecular biology grade. Bafilomycin A1, Dynasore, 5-(N-ethyl-N-isopropyl)-Amiloride (EIPA), LY294002, U0126, KH7, H89, and S0859 were purchased from Cayman Chemical Co (Ann Arbor, MI). Cholesterol-water soluble reagent was purchased from Sigma (cholesterol-methyl-beta-cyclodextran). Non-targeting siRNA pool #1 (D-001206–13), ATP6V1A 3’ UTR-targeting siRNA (Sense: 5’-GCA AUG GUU UGU UGA GAU AUU-3’), siV1A (MU-017590–00), siV0a3 (M-012198–01), siKRas (M-005069–00), siRac1 (M-003560–06), siSLC4A7 (M-007586–01), siV1B2 (M-011589–01), siV0a1 (M-017618–01), siV1E1 (M-011590–01), and siV0c (M-017620–02) were purchased from GE Dharmacon (Lafayette, CO). A complete list of siRNA sequences can be found in Supplementary Table 2.
pCGT was used as a mammalian expression vector to express T7-HRasV12 and T7-KRasV12. pTRIPZ lentiviral inducible shRNA plasmid was from GE Dharmacon. pEGFP-Rac1WT was generated as previously described25. GFP-Rac1L61, GFP-Rac1L61 K-tail, and R-pre constructs were kindly provided by Dr. Mark Philips26. The R-pre construct contains a modified sequence of the membrane targeting domain of KRas linked to red fluorescent protein.
V1A-FLAG construct was cloned from HeLa cDNA into pCMV-3tag-8 vector backbone using the following primers:
fw 5’ – GGAGGACTCGAGACCAGTATGGATTTTTCCAAGCTACCC – 3’
rv 5’ – ACCACCGGATCCTTCAAATCTTCAAGGCTACGGAATGC – 3’.
V1A-GFP11 construct was created by PCR amplifying GFP11 from pEGFP-GFP11-Clathrin light chain. pEGFP-GFP11-Clathrin light chain was a gift from Bo Huang (Addgene plasmid #70217). The following primers were used:
fw 5’ – TCATCAGCGGCCGCGTCGCCACCATGTCGGGAGGTT – 3’
rv 5’ – ATTAATGCGGCCGCCTATCCGGATCCGCCTGTAATCCCAGC – 3’.
The PCR amplified GFP11 was then cloned into the V1A-FLAG construct. The reverse primer introduced a stop codon prior to the c-terminal FLAG-tag. The first NotI site was destroyed and GFP11 was put into frame with V1A by site-directed mutagenesis using the following primers:
fw 5’ – CGTAGCCTTGAAGATGCCGGCCGCGTCGCCACC – 3
rv 5’ – GGTGGCGACGCGGCCGGCATCTTCAAGGCTACG – 3’.
Lyn-GFP1–10 construct was created by cloning a Lyn-tail sequence into pcDNA3.1-GFP(1–10). pcDNA3.1-GFP(1–10) was a gift from Bo Huang (Addgene plasmid # 70219). The following oligonucleotides were used:
fw 5’ – AGCTTGCCACCATGGGATGTATTAAATCAAAAAGGAAAGACGGGACAG – 3
rv 5’ – AATTCTGTCCCGTCTTTCCTTTTTGATTTAATACATCCCATGGTGGCA – 3’.
Lyn-tailed mCherry-SEpHluorin was a gift from Sergio Grinstein (Addgene plasmid #32002).
Constitutively-active PKA was created by mutating His87 to Gln in a GFP-tagged PKA catalytic subunit construct using site-directed mutagenesis according to the manufacturer’s instructions (Quickchange™, Agilent Technologies, Santa Clara, CA)27.
pTRIPZ FLAG-KRasV12 was constructed by inserting a human codon optimized FLAG-tagged KRasV12 into the unique Age1, Mlu1 sites of pTRIPZ, which simultaneously removed RFP and the shRNA targeting region.
Cell Culture and Transfection
Human cancer cell lines HeLa, CaLu-6, A549, MIA-PaCa-2, Panc-1, DLD-1, HCT-116, and BxPC-3 were obtained and originally authenticated by short tandem repeat (STR) from the American Type Culture Collection (Manassas, VA). Cell lines are routinely authenticated in-house by cell morphology. All cell lines used tested negative routinely for mycoplasma contamination by DAPI staining. The BxPC-3 stable cell line with doxycycline-inducible expression of FLAG-KRasV12 was generated with lentiviral particles in accordance with standard protocols. Cells were transduced with lentiviral particles containing pTRIPZ FLAG-KRasV12 and selected with puromycin (2 μg/ml) for 3 days. All cells were maintained under 5% CO2 at 37°C in either DMEM (HeLa, CaLu-6, A549, MIA-PaCa-2, Panc-1, BxPC-3; Invitrogen), RPMI (DLD-1; Invitrogen), or McCoy’s (HCT-116; Invitrogen) supplemented with 10% FBS (Gibco). Transient transfections were performed by using X-tremeGENE 9 reagent (Sigma), following the manufacturer’s recommended protocol. Analyses were performed 48 hours post-transfection of V1A and Ras cDNA expression constructs and 24 hours post-transfection of Rac1, PKA, and R-pre cDNA expression constructs. Transfection of siRNA was performed by using Lipofectamine RNAiMAX reagent (Thermo Fisher Scientific, Waltham, MA), following the manufacturer’s recommended protocol. Analyses were performed 3 days following siRNA treatment.
Experimental Treatment Conditions
Treatment conditions were maintained the same throughout each experimental assay, as follows: KH7 was used at 25μM for a 60-minute pre-incubation period. H89 was used at 15μM for a 60-minute pre-incubation period. S0859 was used at 50μM for a 90-minute pre-incubation period. Cholesterol was used at 10μM and co-incubated with drug treatment or added for 90 minutes prior to fixation or dextran uptake in siRNA-treated cells. For bicarbonate withdrawal experiments, cells were washed in bicarbonate-free DMEM (Sigma, HEPES-buffered) and then placed in 0mM or 44mM bicarbonate conditions for a 90-minute pre-incubation period. Dynasore was used at 80 μM for a 10-minute pre-incubation period. Bafilomycin A1 was used at 150nM for a 60-minute pre-incubation period. LY294002 and U0126 were used for 36 hours at 25μM and 10μM, respectively, starting 6 hours post transfection of T7-HRasV12 or T7-KRasV12. EIPA was used at 50μM for a 30-minute pre-incubation period.
Identification of Functional Clusters
The STRING database was used to identify known and predicted protein-protein interactions between the hits (v9.0)28. Only interactions with scores above 0.7 are reported here.
Macropinosome Visualization and Quantification
Macropinocytosis assays were performed as previously described29. Images were captured using an Axiovert 200 inverted fluorescent microscope (Zeiss). Image analysis and quantification was performed as previously described29.
Immunofluorescence
Cells were seeded onto glass coverslips. Forty-eight to seventy-two hours after cell seeding, cells were serum starved for 3h. After serum starvation, cells were fixed with 3.7% formaldehyde for 30min at room temperature. The following sequential steps were done at room temperature: cells were washed 2x with PBS, quenched (50mM NH4Cl in PBS) for 10 min, permeabilized (0.1% saponin in PBS) for 10 min, blocked (5% goat serum in PBS) for 30 min. Primary antibody for V1A (Abnova, Taiwan) was used at 1:250 dilution. Primary antibody for Rab7 (Cell Signaling, Danvers, MA) was used at 1:100 dilution. Secondary antibody was used at 1:1000 dilution. Cells were DAPI-treated to stain nuclei and coverslips mounted onto slides using DAKO Mounting Media (Agilent). Images were captured using LSM510 META Confocal Microscope (Zeiss). For presentation of microscopy images in the figures, raw images were imported into ImageJ for brightness and contrast enhancements. Cell outlines were delineated by setting the Auto Threshold (triangle) function on ImageJ and manually drawing the cell periphery.
Colocalization Analysis
Images for Rab7/V1A colocalization were acquired as described above to ensure that no pixel saturation is observed (Extended Data Fig. 4a). The same threshold was set for each image across the entire experiment. The ImageJ plugin, JACoP v2.030, was used to calculate the Mander’s overlap colocalization coefficient of the v-ATPase with Rab7 for each cell analyzed. Briefly, the raw images were denoised using an ImageJ function (despeckle). Background subtraction was performed for quantification of signal within endosomes31. Pixel size for background subtraction was determined by Rab7 channel. Segmentation was performed to isolate single cells. Thresholding was set to identify v-ATPase pixel intensity within Rab7-positive endosomes on a per cell basis. To control for random co-localization, we employed Costes’ randomization method. The p-value in Extended Data Figure 4c and 4d was >95%, suggesting that the colocalization was highly probable. Representative images presented in Extended Data Figure 4b were imported into Adobe Photoshop CS and whole image adjustment of brightness was done using curves function to display colocalization.
Split GFP Complementation Assay
Soluble GFP (1–10)32 was targeted to the plasma membrane by the addition of a 16 amino acid Lyn tail33 to the N-terminus. Lyn-GFP(1–10) and V1A-GFP11 were transfected into HeLa HV12 cells. The split fluorescent protein only forms a functional GFP fluorophore if V1A-GFP11 is in the plasma membrane. Lyn-GFP(1–10) or V1A-GFP11 transfection alone does not result in fluorescence. Twenty-four hours after transfection, live cell epifluorescent images were captured using the 488nm laser of a LSM510 META Confocal Microscope (Zeiss). Z-stack time series were captured and processed in ImageJ.
Submembraneous pH Determination
Determination of submembraneous pH (pHsm) was performed as previously described24. Briefly, cells were plated on glass bottom dishes and transfected with the membrane-targeted SEpHluorin/mCherry construct. Measurements were acquired of the SEpHluorin/mCherry fluorescence emission ratio at the plasma membrane by confocal microscopy in live cells. Calibration was performed with K+/nigericin buffer as described previously24.
PAK-Binding Assay
Cells were treated as indicated and the PAK-binding assay was performed as previously described34.
Plasma Membrane Fractionation
Indicated cell lines were grown to 90% confluency. The plasma membrane protein extraction kit (BioVision, Milpitas, CA) was used to separate the plasma membrane fraction from other cellular membranes according to the manufacturer’s recommended protocol.
Immunoblot Analysis
Lysates were resolved on SDS-PAGE and transferred to nitrocellulose membranes. Membranes were incubated with anti-vinculin (Sigma, 1:10000), anti-ATP6V1A (Abnova, 1:1000), anti-ATP6V0a3 (Novus, Centennial, CO; 1:1000), anti-FLAG (Sigma, 1:2000), anti-GFP (Cell Signaling, 1:1000), anti-T7 (Novagen, 1:10000), anti-tubulin (Sigma, 1:10000), anti-Rac1 (BD Transduction Laboratories, 1:1000), anti-AKT (Cell Signaling, 1:1000), anti-pAKT (S473) (Cell Signaling, 1:500), anti-ERK2 (EMD Millipore, 1:2000), anti-pERK1/2 (Cell Signaling, 1:1000), anti-SLC4A7 (Santa Cruz, 1:200), or anti-KRas (Santa Cruz, 1:500) primary antibodies followed by Alexa Fluor 680 goat anti-mouse IgG (Life Technologies, 1:10000) or IRDye 800CW goat anti-rabbit IgG (Li-Cor, 1:10000) secondary antibodies. Blots were analyzed using an Odyssey Classic imager (Li-Cor).
Human Pancreas Specimens
Samples consisted of 5-μm sections that were cut from formalin-fixed, paraffin embedded (FFPE) blocks provided by the Center for Biospecimen Research and Development of the New York University Langone Medical Center. All samples were anonymized prior to being transferred to the investigator’s laboratory and therefore met exempt human subject research criteria.
FFPE Immunohistochemistry
Immunohistochemistry was performed as previously described35. Primary antibody for V1A was used at 1:150. Slides were examined on a Nikon Eclipse 80i microscope.
Quantitative RT-PCR
Extraction and reverse transcription of total RNA from cell lines was performed using RNeasy mini kit (QIAGEN, Hilden, Germany) and QuantiTect reverse transcription kit (QIAGEN), respectively. SYBR Green PCR Master Mix (Thermo Fisher Scientific) was used for amplification, and the samples were amplified by two-step RT-qPCR method and analyzed on a Stratagene Mx 3005P using double delta Ct analysis. Expression levels were normalized by RPL19.
Primers used for qRT-PCR were:
SLC4A7-fw: 5’-GCAAGAAACATTCTGACCCTCA-3’
SLC4A7-rv: 5’-GCTTCCACCACTTCCATTACCT-3’
KRas-fw: 5’-AAGTGTGATTTGCCTTCTAG-3’
KRas-rv: 5’-ATGTTTTCGAATTTCTCGGACT-3’
RPL19-fw: 5’ GAATGCCAGAGAAGGTCACA-3’
RPL19-rv: 5’ GCTGTGATACATGTGGCGAT-3’
Human Data Generation
130 human PDAC tumor (n=75) and normal adjacent pancreatic tissue (n=55) mRNA expression profiles generated on the same array (Affymetrix GeneChip Human Genome U133 Plus 2.0) were downloaded from GEO (https://www.ncbi.nlm.nih.gov/geo/) (GSE1547136, GSE1651537). Adj normal samples clustering with PDAC tumors, PDAC tumor profiles clustering with Adj normal samples and duplicates were discarded (as previously described36), for a remainder of n= 74 tissues (n= 50 PDAC tumor and n= 24 normal tissues). Raw data were processed and normalized in one batch using a GC-content background correction Robust Multi-array Average (RMA) algorithm (GC-RMA), performed in R: A language and environment for statistical computing. SLC plots and unpaired Student’s t test p values were generated in GraphPad Prism (GraphPad Software, CA, USA, www.graphpad.com).
Generation of Inducible shSLC4A7 Cell Lines
Lentiviral particles were generated in accordance with standard protocols. For knockdown experiments, cells were transduced with lentiviral particles containing pTRIPZ scramble shRNA or SLC4A7 shRNA and selected with puromycin (2 μg/ml) for 3 days.
Mouse Experiments
All animal work was approved by New York University Langone Medical Center Institutional Animal Care and Use Committee (IACUC). For xenograft studies, 2 × 10⁶ MIA-PaCa-2 or BxPC-3 cells stable for pTRIPZ-scramble shRNA or pTRIPZ-SLC4A7 shRNA (1:1 in Matrigel, BD Biosciences) were subcutaneously implanted in both flanks of 7-week-old female athymic nude mice (NCRNU, Taconic, Rensselaer, NY). When tumor size reached 50–100 mm3, mice were separated into two groups by initial tumor volume (baseline) to allow for similar ranges in initial tumor volume. Investigators were blinded once the mice were separated into experimental and control arms by the mice being given a coded number. During the experiment, one investigator measured the tumor volume and read the coded number to the second investigator who recorded the data for analysis. Mice were given normal or doxycycline feed (1g/kg), and feed was replaced every 2 days. Tumor volume was determined using electronic calipers to measure length (l), width (w), using the formula (w2 × l)/2. Tumor volume was measured twice a week. IACUC criteria for maximum allowable tumor size was approximately 1500mm^3 or 1.5cm in diameter (equivalent to 5% of body weight of a 25g mouse), which was never exceeded in these experiments. Based on previous experiments using human pancreatic cell lines and xenograft model systems that were utilized in this study, the sample size was deemed sufficiently powered to detect a statistically significant and biologically relevant effect.
Filipin Staining
Cells were seeded and fixed as per the immunofluorescence protocol. Cells were then washed in PBS and stained with filipin (500 μg/ml in PBS) for 30 minutes. Filipin solution was washed off cells 3x with PBS before mounting the coverslips with DAKO mounting media. Images were acquired on a Zeiss Axiovert 200M. Images within an experiment were taken at the same exposure.
Plasma Membrane Cholesterol, v-ATPase, and Rac1 Localization Quantification
Analysis was performed on a per cell basis. For presentation of microscopy images in figures, raw images were imported into ImageJ for brightness and contrast enhancements. ImageJ was used to quantify fluorescence intensities from raw images. For quantification of plasma membrane v-ATPase and cholesterol, we used a plasma membrane-targeting RFP construct and a quantification approach adapted from a previously described method26. Briefly, regions of interest (ROIs) on the plasma membrane and in the cytosol were traced and mean fluorescence intensities for each fluorophore were quantified. The plasma membrane was defined as the outermost region of the cell in which R-pre fluorescent signal was observed. To correct for variations in expression levels of R-pre, the fluorescence intensity for R-pre was calculated according to the formula R-pre plasma membrane/R-pre cytosol (normalized R-pre). The fluorescence ratio of PM v-ATPase to R-pre was defined as PM v-ATPase/(normalized R-pre). A value of 1 indicates similar PM signal intensity and by extension maximal PM abundance. A value of 0 represents a complete absence in the PM.
For quantification of plasma membrane cholesterol and GFP-Rac1 without the R-pre marker, the following approaches were used. Images with free cholesterol staining were processed with the Auto Threshold (triangle) function in ImageJ to delineate the cell outline. On the raw images, ROIs were drawn around the entire cell (whole cell, WC cholesterol) and immediately adjacent to the plasma membrane (cytosol cholesterol). Mean fluorescence intensities were determined within each ROI and percent plasma membrane cholesterol was calculated according to the formula [(WC cholesterol – cytosol cholesterol)/ WC cholesterol]*100. For images with GFP-Rac1, ROIs were drawn around the plasma membrane (PM GFP-Rac1) and immediately adjacent to the plasma membrane (cytosol GFP-Rac1). The plasma membrane was defined as the outermost region of the cell in which fluorescent signal was observed. Mean fluorescence intensities were determined at each ROI border and surface GFP-Rac1 was calculated according to the formula (PM GFP-Rac1 – cytosol GFP-Rac1)/cytosol GFP-Rac1. Graphs display surface GFP-Rac1 values relative to control.
Statistical Analysis
Unless otherwise indicated, data were analyzed by Graphpad Prism built-in test (unpaired, two-tailed Student’s t-tests). For all graphs, error bars indicate mean ±s.e.m. for n≥3 biological replicates and p-values are denoted above the graphs. Number of samples analyzed per experiment is reported in respective figure legend.
Extended Data
Extended Data Figure 1 |. v-ATPase is required for Ras-induced macropinocytosis.
a, Functional clusters within the macropinocytosis screen hits defined by STRING analysis (Pink, 1° screen; Red, 1° and confirmation screen). b, Quantification of TMR-dextran uptake following knockdown of the indicated v-ATPase subunits in HeLa HV12 cells. c, Immunoblot of V1A expression from whole cell lysate (WCL) (vinculin, loading control). d, Effect of v-ATPase depletion (siV1A) on cholesterol localization in Hela HV12 cells. Fluorescence micrographs of filipin staining (left), membrane labeling with R-pre (a transfected construct containing a modified sequence of the membrane targeting domain of KRas linked to RFP, middle), merge of filipin and R-pre with boxed areas enlarged to show PM localization (right), and the quantification of the ratio of filipin to R-pre membrane localization (bar graph) in control (siCtl) or V1A knockdown conditions. e, Effect of V1A knockdown on total cholesterol in HeLa HV12 (left) and KV12 (right) cells. f, Effect of Bafilomycin A1 (BafA1) and rescue by exogenous cholesterol on the localization of cholesterol and Rac1 in HeLa HV12 cells. Fluorescence micrographs of filipin (top), GFP-Rac1 (bottom) and quantification of relative surface GFP-Rac1 (bar graph). g, Effect of oncogenic Ras and V1A expression on Rac1 localization. Immunoblots of Rac1 and V1A in the plasma membrane (PM) fraction and whole cell lysate (WCL) from HeLa T7-vector control (Ctl) and HV12 or oncogenic KRas cell lines with or without V1A knockdown. Images (d,f) and immunoblots (c,g) are representative of three biological replicates. Dashed lines delineate the cell and nucleus and the mean percentages ±s.e.m shown represent the fraction of cells that display PM localization of cholesterol. Scale bars, 10μm. ≥500 (b,f) and 20 (d) cells were quantified in biological replicates (n=3). For e, cholesterol quantification is representative of four biological replicates. For all graphs, error bars indicate mean ±s.e.m. for indicated sample size, p value: unpaired, two-tailed Student t-test. For c,g, gel source data located in Supplementary Figure 1.
Extended Data Figure 2 |. Plasma membrane localized Rac1 is required for Ras-induced macropinocytosis.
a,b, Effect of V1A expression on Rac1 activity. a, Immunoblots of Rac1 wild type (WT) and Rac1L61 (L61) activity (GST-PBD, pulldown of GFP-Rac1-GTP; WCL, whole cell lysate; vinculin loading control) with or without V1A knockdown in HeLa HV12 cells (Ctl, GFP). b, Immunoblot of endogenous Rac1 activity (GST-PBD, pulldown of Rac1-GTP; WCL, whole cell lysate; tubulin loading control) in HeLa Ctl and HV12 cells with or without V1A knockdown. c, Effect of v-ATPase depletion (siV1A) and rescue by PM-targeted Rac1 (GFP-Rac1L61 K-tail) on Rac1L61 localization and macropinocytosis in HeLa HV12 cells. Fluorescence micrographs of GFP-Rac1 (top), TMR-dextran uptake (bottom) and quantification of TMR-dextran (bar graph). d,e, Effect of v-ATPase or Rac1 depletion on macropinocytosis. Quantification of TMR-dextran uptake following (d) BafA1 treatment or (e) Rac1 knockdown in the absence or presence of exogenous cholesterol in HeLa HV12 cells. f, Fluorescence micrographs of cholesterol localization (filipin, top), GFP-Rac1 localization (middle) and TMR-dextran uptake (bottom) in v-ATPase-depleted HeLa KV12 cells in the absence or presence of exogenous cholesterol. g, Quantification of TMR-dextran uptake in mutant Ras cells with V1A knockdown and rescue by PM-targeted Rac1 (GFP-Rac1L61 K-tail). Images (c,f) and immunoblots (a,b) are representative of three biological replicates. For c, the mean percentages ±s.e.m shown represent the fraction of cells that display PM localization of GFP-Rac1L61 or GFP-Rac1L61 K-tail. For f, the dashed lines delineate the cell and nucleus and the mean percentages ±s.e.m shown represent the fraction of cells that display PM localization of cholesterol (top) or GFP-Rac1 (middle). Scale bars, 10μm. ≥500 (c-g) cells were quantified in each biological replicate (n=3) with error bars indicating mean ±s.e.m. where shown; p value: unpaired, two-tailed Student t-test. For a,b, gel source data located in Supplementary Figure 1.
Extended Data Figure 3 |. Plasma membrane v-ATPase regulates cholesterol distribution and macropinocytosis.
a, Fluorescence micrographs of HeLa Ctl and HeLa HV12 or T7-KRasV12 (KV12) cells immunostained with anti-V1A antibody. b, Validation of V1A antibody for immunofluorescence: fluorescence micrographs of V1A immunostaining of HeLa HV12 cells transfected with the indicated siRNAs. c, Fluorescence micrographs of V1A immunostaining and filipin labeling of HeLa KV12 cells transfected with the indicated siRNAs. d, Quantification of TMR-dextran uptake in mutant Ras cell lines transfected with siV0a3 in the presence or absence of exogenous cholesterol. Images (a-c) are representative of three biological replicates. Scale bars, 10μm. For b,c, dashed lines delineate the cell and/or nucleus. For a,c, the mean percentages ±s.e.m shown represent the fraction of cells that display V1A PM localization. ≥500 (a,c,d) cells were quantified in each biological replicate (n=3) with error bars indicating mean ±s.e.m. where shown; p value: unpaired, two-tailed Student t-test.
Extended Data Figure 4 |. Plasma membrane v-ATPase feeds into Rab-7 positive endosomes.
a-b, Fluorescence micrographs of HeLa Ctl and HV12 cells with the indicated treatment showing V1A (green) and Rab7 (red) immunostaining. Representative original image used to calculate Mander’s overlap coefficient (a) and processed image (b). c,d, Quantification of Rab7 with V1A co-localization in HeLa cells treated as indicated using Mander’s overlap coefficient (M Coefficient). e,f, Epifluorescence imaging of self-complementing GFP from HeLa HV12 cells transfected with V1A-GFP11 and PM targeting Lyn-GFP(1–10). Positive fluorescence indicates V1A localization to the PM. e, Fluorescence micrographs of timelapse imaging. The boxed area of the cell (left) was enlarged (four right images) to show PM v-ATPase being internalized over time and forming a vesicle (arrow). Time (seconds) is shown on each micrograph. f, Fluorescence micrographs of self-complementing GFP (left), immunofluorescence of Rab7 (middle) and merge of V1A and Rab7 (right) with boxed area enlarged beneath the image to show Rab-7 co-localization with PM-derived V1A. For a,b, images are representative of three biological replicates. For c,d, 25 cells were quantified in each biological replicate (n=3) with error bars indicating mean ±s.e.m.; p value: unpaired, two-tailed Student t-test. Scale bars, 10μm.
Extended Data Figure 5 |. sAC/PKA pathway is necessary for oncogenic Ras-induced macropinocytosis.
a-g, Effect of sAC (KH7) or PKA (H89) inhibition on membrane cholesterol, Rac1 activation and Rac1 localization. a, Fluorescence micrographs of HeLa HV12 cells in indicated treatments with filipin labeling (top), membrane labeling with R-pre (middle), and merge of Filipin and R-pre fluorescence micrographs with boxed areas enlarged beneath the image to show PM localization (bottom). b, Quantification of the ratio of filipin to R-pre membrane localization with the indicated treatments in HeLa HV12 cells. c, Immunoblot of endogenous Rac1 activity (GST-PBD, pulldown of Rac1-GTP; WCL, whole cell lysate; tubulin loading control) in HeLa Ctl and HV12 cells treated as indicated. d, Immunoblot of endogenous Rac1 in the plasma membrane (PM) fraction and whole cell lysate (WCL) in HeLa Ctl and HV12 cells treated as indicated. e, Fluorescence micrographs of cholesterol (filipin) distribution in HeLa Ctl cells with indicated treatments. f, Quantification of PM cholesterol in HeLa Ctl cells with the indicated treatments. g, Fluorescence micrographs of cholesterol (filipin) distribution in BxPC-3 cells in the absence or presence of ectopically expressed KRasV12 treated as indicated. For g, the mean percentages ±s.e.m shown represent the fraction of cells that display cholesterol PM localization. Images (a,e,g) and immunoblots (c,d) are representative of three biological replicates. Scale bars, 10μm. ≥20 (b), ≥50 (f), and ≥500 (g) cells were quantified in each biological replicate (n=3) with error bars indicating mean ±s.e.m. where shown; p value: unpaired, two-tailed Student t-test. For c,d, gel source data located in Supplementary Figure 1.
Extended Data Figure 6 |. PKA activation rescues Ras-induced macropinocytosis from sAC inhibition.
a,b, Effect of sAC inhibition (KH7) and rescue (KH7 + CA-PKA) on macropinocytosis, v-ATPase localization, and cholesterol distribution in HeLa HV12 cells. a, Quantification of TMR-dextran uptake following indicated treatments. b, Fluorescence micrographs of V1A immunostaining and filipin labeling following indicated treatments. c,d, Effect of sAC inhibition (KH7), PM v-ATPase inhibition (siV0a3), and rescue (KH7 + CA-PKA + siV0a3) on macropinocytosis, v-ATPase localization, and cholesterol distribution in HeLa HV12 cells. c, Quantification of TMR-dextran uptake following indicated treatments. d, Fluorescence micrographs of V1A immunostaining and filipin labeling following indicated treatments. e, Effect of KRas inhibition (siKRas) and rescue (siKRas + CA-PKA) on macropinocytosis by quantification of TMR-dextran uptake in mutant Ras cell lines. Images (b,d) are representative of three biological replicates. For b,d, dashed lines delineate the cell and nucleus, and the mean percentages ±s.e.m shown represent the fraction of cells that display V1A PM localization. Scale bars, 10μm. ≥500 cells (a,c,e) were quantified in each biological replicate (n=3) with error bars indicating mean ±s.e.m.; p value: unpaired, two-tailed Student t-test.
Extended Data Figure 7 |. The SLC4 family is required for PKA-dependent, Ras-induced macropinocytosis.
a, Quantification of TMR-dextran uptake in the absence (bicarbonate-free) or presence (bicarbonate) of extracellular bicarbonate in mutant Ras cells. b, Fluorescence micrographs of V1A immunostaining following treatment of mutant Ras cells with vehicle or pan-SLC4 inhibitor (S0859). c, Fluorescence micrographs of HeLa HV12 cells in indicated treatments with V1A immunostaining (top), membrane labeling with R-pre (middle), and merge of V1A and R-pre fluorescence micrographs with boxed areas enlarged beneath the image to show PM localization (bottom). d, Quantification of the ratio of V1A to R-pre membrane localization with the indicated treatments in HeLa HV12 cells from (c). e,f, Effect of SLC4 inhibition (S0859) and rescue (S0859 + CA-PKA) in HeLa HV12 cells. e, Fluorescence micrographs of V1A immunostaining and filipin labeling following indicated treatments. Dashed lines delineate the cell and nucleus. f, Quantification of TMR-dextran uptake. g, Fluorescence micrographs of cholesterol (filipin) distribution in BxPC-3 cells in the absence or presence of ectopically expressed KRasV12 treated with SLC4 family inhibitor (S0859). h, mRNA levels of SLC4A7 expression in HeLa Ctl, HV12, or KV12 cells. i, mRNA levels of SLC4A7 expression following KRas knockdown in MIA-PaCa-2 cells. j, Effect of PI3K (LY294002, left) or MEK (U0126, right) inhibition on SLC4A7 expression in HeLa Ctl and HV12 cells. Immunoblots of SLC4A7 expression from whole cell lysate (vinculin loading control). pAKT (left) and pERK (right) immunoblots show inhibition of pathways by the indicated treatments. k, Effect of PKA (H89), NHE (EIPA), SLC4A7 (siSLC4A7) and V1A (siV1A) inhibition on submembranous pH (pHsm) in HeLa HV12 cells transfected with SEpHluorin/mCherry construct (genetically encoded ratiometric pH probe that is targeted to the inner leaflet of the PM). Calibration curve of SEpHluorin/mCherry (line graph) was performed with K+/nigericin buffer. Quantification of submembranous pH with H89 and EIPA treatment (bar graph, middle) or with knockdown of SLC4A7 and V1A (bar graph, right). l, Immunoblot of SLC4A7 (vinculin, loading control) in MIA-PaCa2 cells with dox-inducible SLC4A7 depletion. m,n, Effect of dox-inducible SLC4A7 depletion in BxPC-3 cells on tumor growth. m, Immunoblot of SLC4A7 expression from whole cell lysate (WCL) (vinculin, loading control) and (n) waterfall plots of xenografts treated as shown relative to baseline. Each bar represents a tumor. Images (b,c,e,g), immunoblots (j,l,m), and mRNA levels (h,i) are representative of three biological replicates. For b,e,g, the mean percentages ±s.e.m shown represent the fraction of cells that display (b,e) V1A or (g) cholesterol PM localization. Scale bars, 10μm. ≥20 (d) cells and ≥500 (a,b,e-g) cells were quantified in each biological replicate (n=3) with error bars indicating mean ±s.e.m. where shown; p value: unpaired, two-tailed Student t-test. For j,l,m, gel source data located in Supplementary Figure 1.
Supplementary Material
Acknowledgements
We thank Ralph Garippa and Myles Fennell (Memorial Sloan Kettering Cancer Center) for their help with RNAi screen data analysis. We are grateful to members of the Bar-Sagi laboratory for their comments and discussions, and M. Philips for sharing cDNA constructs. This work was supported by a grant from The Lustgarten Foundation and National Institutes of Health (NIH)/National Cancer Institute (NCI) (CA210263/CA055360) to D.B.-S. C.R. was supported by a grant from NIH (5 T32 GM007238), A.D.H. was supported by a grant from NIH/NCI (T32CA009161), and E.A.V. was supported by a Canadian Institutes of Health Research Fellowship (146792).
Footnotes
Extended Data is available in the online version of the paper
Data Availability
The full genome siRNA screen datasets have been deposited at NCBI PubChem under the accession code AID 1347130. Uncropped immunoblot images are available in Supplementary Fig. 1. Datasets that support the findings of this study are available in Source Data. Full list of siRNA and shRNA used in this study are in Supplementary Table 1. Full list of primary antibodies used in this study are in Supplementary Table 2.
Competing Interests
The authors declare no competing financial interests.
References
- 1.Commisso C et al. Macropinocytosis of protein is an amino acid supply route in Ras-transformed cells. Nature 497, 633–637 (2013). [DOI] [PMC free article] [PubMed] [Google Scholar]
- 2.Kamphorst JJ et al. Human pancreatic cancer tumors are nutrient poor and tumor cells actively scavenge extracellular protein. Cancer Res 75, 544–553 (2015). [DOI] [PMC free article] [PubMed] [Google Scholar]
- 3.Fennell M, Commisso C, Ramirez C, Garippa R & Bar-Sagi D High-content, full genome siRNA screen for regulators of oncogenic HRAS-driven macropinocytosis. Assay and Drug Dev. Tech 13, 347–355 (2015). [DOI] [PMC free article] [PubMed] [Google Scholar]
- 4.Stransky L, Cotter K & Forgac M The function of v-ATPases in cancer. Physiol. Rev 96, 1071–1091 (2016). [DOI] [PMC free article] [PubMed] [Google Scholar]
- 5.Furuchi T, Aikawa K, Arai H & Inoue K Bafilomycin A1, a specific inhibitor of vacuolar-type H+-ATPase, blocks lysosomal cholesterol trafficking in macrophages. J. Biol. Chem 268, 27345–27348 (1993). [PubMed] [Google Scholar]
- 6.Iliev AI, Djannatian JR, Nau R, Mitchell TJ & Wouters FS Cholesterol-dependent actin remodeling via RhoA and Rac1 activation by the Streptococcus pneumonia toxin pneumolysin. Proc. Natl Acad. Sci. USA 104, 2897–2902 (2007). [DOI] [PMC free article] [PubMed] [Google Scholar]
- 7.Del Pozo MA et al. Integrins regulate Rac targeting by internalization of membrane domains. Science 303, 839–842 (2004). [DOI] [PubMed] [Google Scholar]
- 8.Kozik P et al. A human genome-wide screen for regulators of clathrin-coated vesicle formation reveals an unexpected role for the v-ATPase. Na.t Cell Biol. 15, 50–60 (2013). [DOI] [PMC free article] [PubMed] [Google Scholar]
- 9.Plowman SJ, Muncke C, Parton RG & Hancock JF H-ras, K-ras, and inner plasma membrane raft proteins operate in nanoclusters with differential dependence on the actin cytoskeleton. Proc. Natl Acad. Sci. USA 102, 15500–15505 (2005). [DOI] [PMC free article] [PubMed] [Google Scholar]
- 10.Tiangang L & Chiang JYL Regulation of bile acid and cholesterol metabolism by PPARs. PPAR Res 2009, 501739 (2009). [DOI] [PMC free article] [PubMed] [Google Scholar]
- 11.Garbarino J et al. STARD4 knockdown in HepG2 cells disrupts cholesterol trafficking associated with the plasma membrane, ER, and ERC. J. Lipid Res 53, 2716–2725 (2012). [DOI] [PMC free article] [PubMed] [Google Scholar]
- 12.Capecci J & Forgac M The Function of Vacuolar ATPase (V-ATPase) a Subunit Isoforms in Invasiveness of MCF10a and MCF10CA1a Human Breast Cancer Cells. J. Biol. Chem 288, 32731–32741 (2013). [DOI] [PMC free article] [PubMed] [Google Scholar]
- 13.Nishisho T et al. The a3 isoform vacuolar type H+-ATPase promotes distant metastasis in the mouse B16 melanoma cells. Mol. Cancer Res 9, 845–855 (2011). [DOI] [PubMed] [Google Scholar]
- 14.Chung C et al. The vacuolar-ATPase modulates matrix metalloproteinase isoforms in human pancreatic cancer. Lab Invest 91, 732–743 (2011). [DOI] [PMC free article] [PubMed] [Google Scholar]
- 15.Deffieu MS & Pfeffer SR Niemann-Pick type C 1 function requires luminal domain residues that mediate cholesterol-dependent NPC2 binding. PNAS 108, 18932–18936 (2011). [DOI] [PMC free article] [PubMed] [Google Scholar]
- 16.Breton S, Lisanti MP, Tyszkowski R, McLaughlin M, & Brown D Basolateral distribution of caveolin-1 in the kidney. Absence from H+-atpase-coated endocytic vesicles in intercalated cells. J Histochem Cytochem 46, 205–214 (1998). [DOI] [PubMed] [Google Scholar]
- 17.Breton S & Brown D Regulation of luminal acidification by the v-ATPase. Physiology 28, 318–329 (2013). [DOI] [PMC free article] [PubMed] [Google Scholar]
- 18.Chen Y et al. Soluble adenylyl cyclase as an evolutionarily conserved bicarbonate sensor. Science 289, 625–628 (2000). [DOI] [PubMed] [Google Scholar]
- 19.Gorbatenko A, Olesen CW, Boedtkjer E & Pedersen SF Regulation and roles of bicarbonate transporters in cancer. Front Physiol 5, 130 (2014). [DOI] [PMC free article] [PubMed] [Google Scholar]
- 20.Romero MF, Chen A-P, Parker MD & Boron WF The SLC4 family of bicarbonate (HCO3−) transporters. Mol. Aspects Med 34, 159–182 (2013). [DOI] [PMC free article] [PubMed] [Google Scholar]
- 21.Gorbatenko A et al. ErbB2 upregulates the Na+,HCO3- cotransporter NBCn1/SLC4A7 in human breast cancer cells via Akt, ERK, Src, and Krüppel-like factor 4. The FASEB J 28, 350–363 (2014). [DOI] [PubMed] [Google Scholar]
- 22.Haigler HT, McKanna JA & Cohen S Rapid stimulation of pinocytosis in human carcinoma cells A-431 by epidermal growth factor. J. Cell Biol 83, 82–90 (1979). [DOI] [PMC free article] [PubMed] [Google Scholar]
- 23.Amyere M et al. Constitutive macropinocytosis in oncogene-transformed fibroblasts depends on sequential permanent activation of phosphoinositide 3-kinase and phospholipase C. Mol. Biol. Cell 11, 3453–3467 (2000). [DOI] [PMC free article] [PubMed] [Google Scholar]
- 24.Koivusalo M, et al. Amiloride inhibits macropinocytosis by lowering submembranous pH and preventing Rac1 and Cdc42 signaling. J Cell Biol 188, 547–563 (2010). [DOI] [PMC free article] [PubMed] [Google Scholar]
- 25.Nimnual AS, Taylor LJ, Nyako M, Jeng HH & Bar-Sagi D Perturbation of cytoskeleton dynamics by the opposing effects of Rac1 and Rac1b. Small Gtpases 1, 89–97 (2010). [DOI] [PMC free article] [PubMed] [Google Scholar]
- 26.Yeung T et al. Receptor activation alters inner surface potential during phagocytosis. Science 313, 347–351 (2006). [DOI] [PubMed] [Google Scholar]
- 27.Orellana SA & McKnight GS Mutations in the catalytic subunit of cAMP-dependent protein kinase result in unregulated biological activity. Proc. Natl Acad. Sci. USA 89, 4726–4730 (1992). [DOI] [PMC free article] [PubMed] [Google Scholar]
- 28.Franceschini A et al. STRING v9.1: protein-protein interaction networks, with increased coverage and integration. Nucleic Acids Res 41, D808–15 (2013). [DOI] [PMC free article] [PubMed] [Google Scholar]
- 29.Commisso C, Flinn RJ & Bar-Sagi D Determining the macropinocytic index of cells through a quantitative image-based assay. Nat. Protoc 9,182–192 (2014). [DOI] [PMC free article] [PubMed] [Google Scholar]
- 30.Bolte S & Cordeliéres FP A guided tour into subcellular colocalization analysis in light microscopy. J of Microscopy 224, 213–232 (2006). [DOI] [PubMed] [Google Scholar]
- 31.Pike JA, Styles IB, Rappoport JZ, & Heath JK Quantifying receptor trafficking and colocalization with confocal microscopy. Methods 115: 42–54 (2017). [DOI] [PubMed] [Google Scholar]
- 32.Kamiyama D et al. Versatile protein tagging in cells with split fluorescent protein. Nat Comm 7: 11046 (2016). [DOI] [PMC free article] [PubMed] [Google Scholar]
- 33.Sato I, et al. Differential trafficking of Src, Lyn, Yes and Fyn is specified by the state of palmitoylation in the SH4 domain. J of Cell Sci 122, 965–975 (2009). [DOI] [PubMed] [Google Scholar]
- 34.Walsh AB & Bar-Sagi D Differential activation of the Rac pathway by Ha-Ras and K-Ras. J. Biol. Chem 276, 15609–15615 (2001). [DOI] [PubMed] [Google Scholar]
- 35.Pylayeva-Gupta Y, Lee KE, Hajdu CH, Miller G & Bar-Sagi D Oncogenic Kras-induced GM-CSF production promotes the development of pancreatic neoplasia. Cancer Cell 21, 836–847 (2012). [DOI] [PMC free article] [PubMed] [Google Scholar]
- 36.Badea L, Herlea V, Dima SO, Dumitrascu T & Popescu I Combined gene expression analysis of whole-tissue and microdissected pancreatic ductal adenocarcinoma identifies genes specifically overexpressed in tumor epithelia. Hepatogastroenterology 55, 2016–2027 (2008). [PubMed] [Google Scholar]
- 37.Pei H et al. FKBP51 affects cancer cell response to chemotherapy by negatively regulating Akt. Cancer Cell 16, 259–266 (2009). [DOI] [PMC free article] [PubMed] [Google Scholar]
Associated Data
This section collects any data citations, data availability statements, or supplementary materials included in this article.


