Summary
The microbiota has been shown to promote intestinal tumorigenesis, but a possible anti-tumorigenic effect has also been postulated. Here, we demonstrate that changes in microbiota and mucus composition are concomitant with tumorigenesis. We identified two anti-tumorigenic strains of the microbiota, Faecalibaculum rodentium and its human homolog Holdemanella biformis, which are strongly underrepresented during tumorigenesis. Reconstitution of ApcMin/+ or AOM/DSS-treated mice with an isolate of F. rodentium (F. PB1) or its metabolic products reduced tumor growth. F. PB1 and H. biformis produced short-chain fatty acids (SCFAs) that contributed to control protein acetylation and tumor cell proliferation by inhibiting calcineurin/NFATc3 activation both in mouse and human settings. Thus, we have identified endogenous anti-tumorigenic bacterial strains with strong diagnostic, therapeutic and translational potential.
Introduction
Colorectal cancer (CRC) is a multifactorial disorder influenced by genetic, environmental and lifestyle factors, including the deregulation of the microbiota1. A decrease in Clostridium and Bacteroides and an increase in Fusobacterium2,3 has been reported in CRC, also in association with recurrence4. The role of bacteria in tumorigenesis has been extensively demonstrated in spontaneous mouse models of tumorigenesis such as the ApcMin/+ mice, carrying a mutation in the APC gene which is mutated in more than 80% of sporadic CRC5. Microbiota-derived signals drive ERK phosphorylation and increased stability of the oncogene Myc, or trigger the c-Jun/JNK and STAT3 signaling pathways driving cell proliferation and accumulation of suppressive immune cells within the tumor6 or the exacerbation of the inflammatory response7. Enterotoxigenic Bacteroides fragilis (ETBF)8 and colibactin-producing Escherichia coli9 exert their protumorigenic effect through bacterial toxins. On the other hand, in an inflammation-induced model of colitis associated CRC, after treatment with azoxymethane (AOM) and dextran sulfate sodium (DSS), germ-free (GF) mice develop significantly more and larger tumors compared with SPF mice9,10. After fecal microbiota transplantation, GF AOM/DSS treated mice develop more tumors if transplanted with fecal microbiota from CRC patients than healthy subjects, but it is not clear whether this is due to an increase in tumor promoting-, a decrease of antitumorigenic-bacteria, or both11. Further, a diet rich in fibers can protect against tumor development in a microbiota-dependent manner12. Thus, although most studies have concentrated on identifying tumor-promoting bacteria the role and identification of endogenous anti-tumorigenic microbiota remains elusive.
Here, we identified an endogenous strain of the mouse microbiota (Faecalibaculum rodentium PB1, F. PB1) and its human counterpart Holdemanella biformis belonging to the Erysipelotrichaceae family, which are lost during the early phases of tumorigenesis and that block tumor cell proliferation via reducing NFATc3 and calcineurin activation.
Results
Faecalibaculum rodentium is underrepresented during the early phases of tumorigenesis
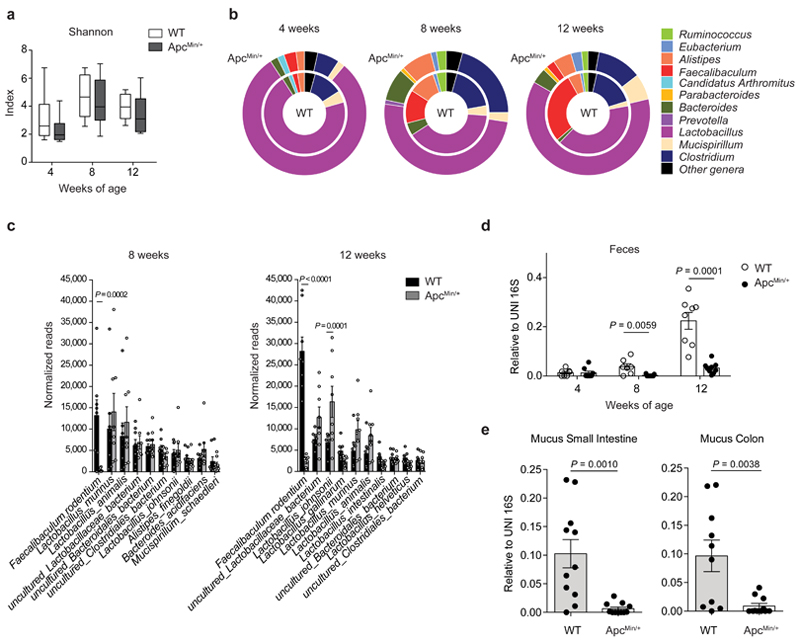
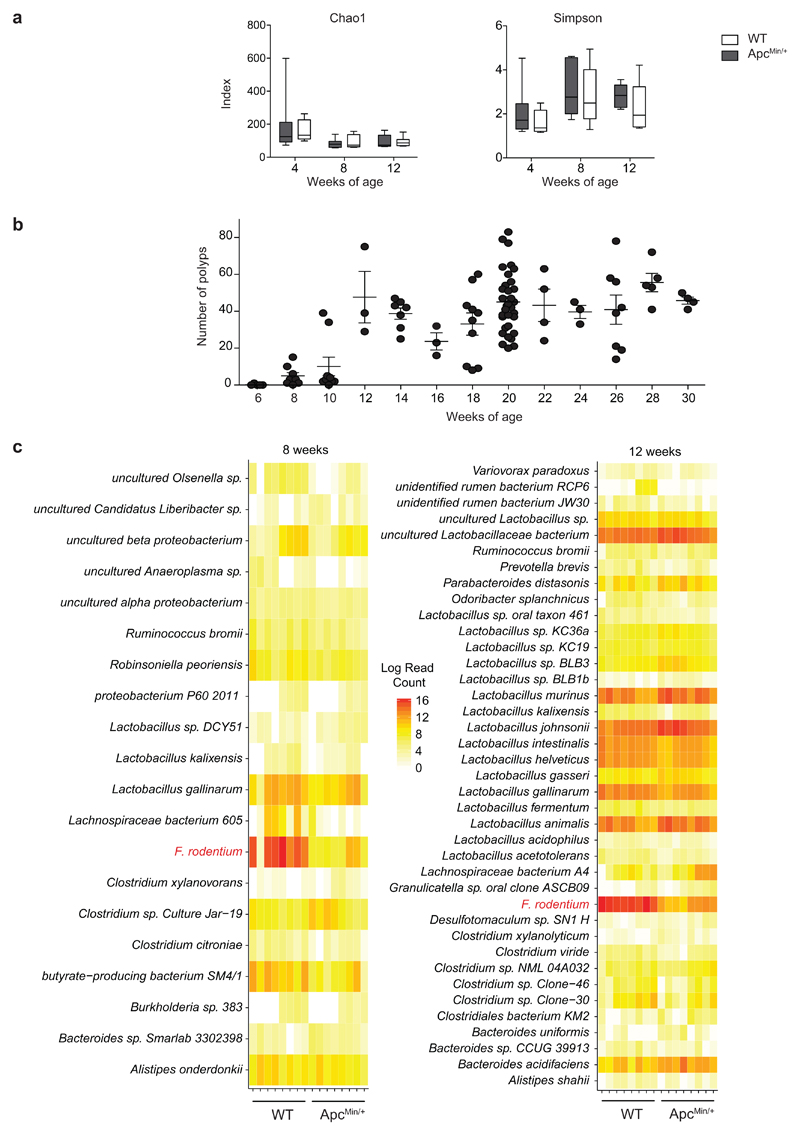
We followed changes in microbiota composition in a longitudinal study in cohorts of ApcMin/+ mice and age- and sex-matched C57BL/6 wild-type (WT) littermates born from the same mothers. Bacterial DNA was extracted at 4, 8 and 12 weeks from feces. As shown in Fig. 1a and Extended Data Fig. 1a, we did not observe any change in the Shannon, Chao1 and Simpson diversity indexes among the two groups at any age, while we observed differences in genus abundance at 8 and 12 weeks (Fig. 1b). Already at 8 weeks, when tumors start developing (Extended Data Fig. 1b), and even more so at 12 weeks, we observed a quantitative contraction of the paired end reads (PE) ascribed to the genus Faecalibaculum (8 weeks P<0.01; 12 weeks P<0.0005) in ApcMin/+ mice compared to WT littermates. Moreover, we detected an expansion of PE-associated to Lactobacillus (P=0.04), Parabacteroides (P=0.03) and Bacteroides (P=0.016) in ApcMin/+ mice compared to WT mice, but only at 12 weeks (Fig. 1b).
Fig. 1. Faecalibaculum rodentium is underrepresented during the early phases of tumor development.
a-c,16S rRNA gene profiling of the fecal microbiota of WT and ApcMin/+ mice at 4, 8 and 12 weeks of age (n = 8 mice/group). a, Shannon diversity index. Box plots show the interquartile range, median value and whiskers min to max. b, Genus abundance (inner pie: WT, outer pie: ApcMin/+). Genera with a relative abundance higher than 1% in at least one of the tested condition, were shown, otherwise are collapsed into the “Other genera” section. P values were assessed by two-tailed unpaired Mann-Whitney test. c, Relative abundance of the 10 most abundant species in fecal bacterial DNA isolated from WT and ApcMin/+ mice at 8 and 12 weeks of age. Abundance shown as the normalized number of assigned sequences in the 16S rRNA sequencing. P values were determined by two-way ANOVA with Bonferroni post-test. d,e, qPCR of F. PB1 abundance normalized to panbacterial primers targeting the 16S rRNA gene (UNI 16S) in bacterial DNA extracted from feces (d, n = 8 mice/group) and mucus from the small intestine and colon (e, n = 11 mice/group) from WT and ApcMin/+ mice. P values were determined by multiple t-tests corrected for multiple comparisons using the Holm-Sidak method to compare F. PB1 abundance between groups at each time point (d) or by two-tailed unpaired t-test (e). a-e, Data from two independent experiments and represented as means ± s.e.m.
Among the 10 most abundantly represented taxonomic units of WT mice, we found that only the reads ascribed to Faecalibaculum rodentium13 were strongly and significantly underrepresented in ApcMin/+ mice compared to WT mice (P<0.001). This taxon was not expanded at 8 weeks in ApcMin/+ mice, coincident with the initiation of tumor development (Fig. 1c and Extended Data Fig. 1c). These data were confirmed by qPCR (Fig. 1d). We then isolated and entirely sequenced a strain belonging to this taxon from WT mice and found that it is the only representative of F. rodentium in our mouse WT colony (Fig. 1c, not shown). The previously uncharacterized isolate named PB1 (hereafter called F. rodentium PB1, F. PB1), was associated to the mucus of the small and large intestines, but was drastically reduced in mucus from ApcMin/+ mice (Fig. 1e). Hence, we have identified a strain of F. rodentium which is normally highly abundant in WT mice and is strongly under-represented in ApcMin/+ mice early in tumorigenesis.
F. PB1 loss coincides with mucus changes and protects from tumor development
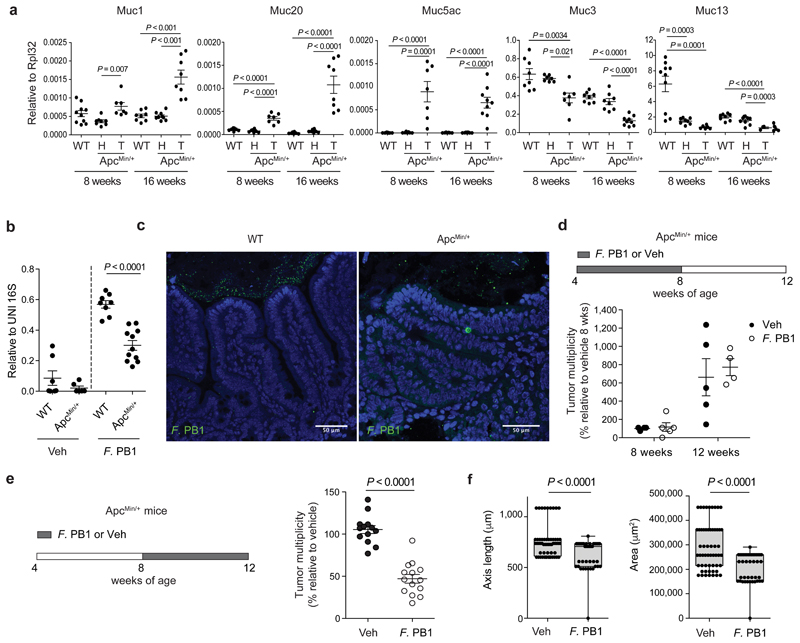
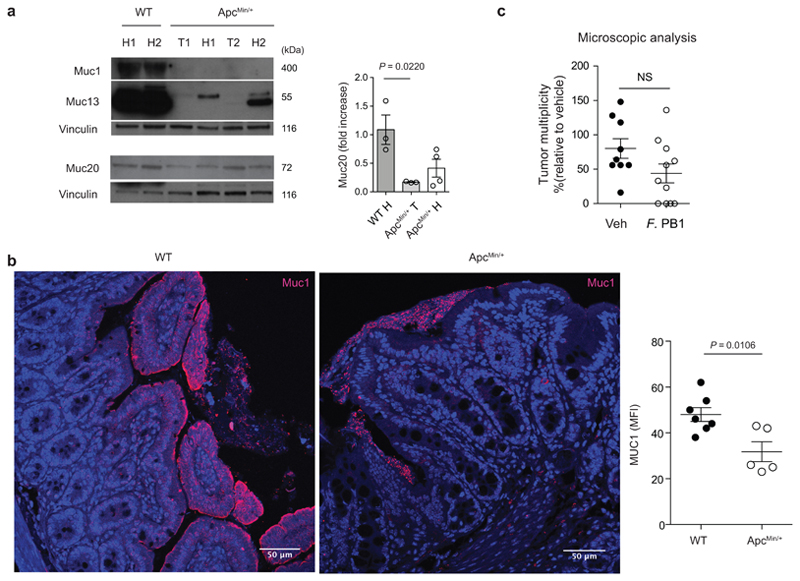
The mucus layer serves as a niche for the intestinal microbiota14, and changes in its composition may influence the microbiota profile. During tumorigenesis, epithelial cell transformation could lead to modification in the production of mucins, the major components of mucus, resulting in a non-permissive environment for F. PB1. As shown in Fig. 2a, we observed that, similarly to human CRC (hCRC), mucin Muc1 and Muc2015 were overexpressed, while Muc5ac was aberrantly expressed in tumors, as it is not normally expressed in the lower GI tract16. We found a downregulation of Muc3 and Muc13; the latter also in the non-tumoral region of ApcMin/+ mice at 8 weeks of age, suggesting that this may be an early event in tumorigenesis. We confirmed at protein level the downregulation of Muc13 both in tumor and non-tumor regions in ApcMin/+ mice compared to WT mice, while differently from RNA data, Muc1 and 20 were downregulated in gut tissues (Extended Data Fig. 2a). This may be due to increased secretion as Muc1 was higher in the mucus of ApcMin/+ tumors (Extended Data Fig. 2b).
Fig. 2. F. PB1 loss coincides with mucus changes and when reintroduced reduces tumor growth.
a, qPCR of mucin expression in the ileal tissue of WT mice and healthy (H) and tumor (T) tissue of ApcMin/+ mice at 8 and 16 weeks of age. Expression levels normalized to the reference gene Rpl32. Data from two independent experiments (8wks: WT n = 10, ApcMin/+ H n = 8, ApcMin/+ T n = 7; 16 wks: WT n = 8, ApcMin/+ H n = 9, ApcMin/+ T n = 9 mice/group). P values were determined by one-way ANOVA with Bonferroni post-test to compare expression levels within the same time point. b,c, F. PB1 administration experiments in WT and ApcMin/+ mice pre-treated with antibiotic cocktail. b, qPCR of F. PB1 abundance normalized to panbacterial primers targeting the 16S rRNA gene (UNI 16S) in bacterial DNA extracted from ileal mucus. Data from two independent experiments (WT Veh n = 7; WT F. PB1 n = 10; ApcMin/+ Veh n = 6; ApcMin/+ F. PB1 n = 11 mice/group). P values were determined by two-tailed unpaired Mann-Whitney test. c, Representative FISH images of F. PB1 (green) on the mucosal surface of ApcMin/+ ileum polyp and WT normal ileum. DAPI nuclear stain in blue. Images obtained at 40X magnification, scale bars 50 μm; n = 3 mice/group. d, Tumor multiplicity in the small intestine of ApcMin/+ mice treated with vehicle (Veh) or F. PB1 from week 4 to 8 (n = 5 mice/group). Significance determined by multiple t-tests corrected for multiple comparisons using the Holm-Sidak method to compare tumor multiplicity between groups at each time point. e,f, ApcMin/+ mice received vehicle (Veh) or F. PB1 from week 8 to 12. Two independent experiments were performed with consistent results. e, Tumor multiplicity in the small intestine normalized to vehicle treated ApcMin/+ mice at 12 weeks of age. Data from two independent experiments (n = 14 mice/group). f, Area and maximum diameter (axis length) of ileal dysplastic lesions normalized to the total number of lesions per mouse. Data from one representative experiment (n = 7 mice/group). Box plots show the interquartile range, median value and whiskers min to max. P values were determined by two-tailed unpaired t-test (e) and two-tailed unpaired Mann-Whitney test (f). a,b,d-f, Data are represented as means ± s.e.m.
Next, we tested whether F. PB1 was capable of colonizing ApcMin/+ mice. We treated WT or ApcMin/+ mice with antibiotics to eliminate competing microorganisms and administered F. PB1 by gavage. As shown in Fig. 2b, at 48h F. PB1 was lower in ileal mucus of ApcMin/+ than WT mice suggesting that the ApcMin/+ gut is unfavorable for F. PB1 colonization. This was confirmed by FISH analysis (Fig. 2c). Thus, to evaluate a possible role of F. PB1 in tumor protection, we administered it by gavage every other day to ensure an appreciable level throughout the experiment. We treated ApcMin/+ and WT littermates with F. PB1 before or during tumor development. We observed that administration of F. PB1 from 4 to 8 weeks did not affect tumor development (Fig. 2d). However, administration of F. PB1 from week 8 to 12 (i.e. when the bacterium was not enriched in ApcMin/+ mice) resulted in a clear reduction in tumor numbers and dimension (Fig. 2e,f). The reduction in tumor multiplicity observed macroscopically was no longer statistically significant when analyzing the number of lesions microscopically (Extended Data Fig. 2c), indicating that some small lesions could not be detected by eye and that F. PB1 likely affects tumor growth rather than initiation.
These results suggest that the modification in mucus composition creates an unfavorable environment for F. PB1 colonization. Administration of F. PB1 has an antitumor effect only when tumors have already started developing.
F. PB1 affects tumor cell proliferation without major impact on adaptive immune cells
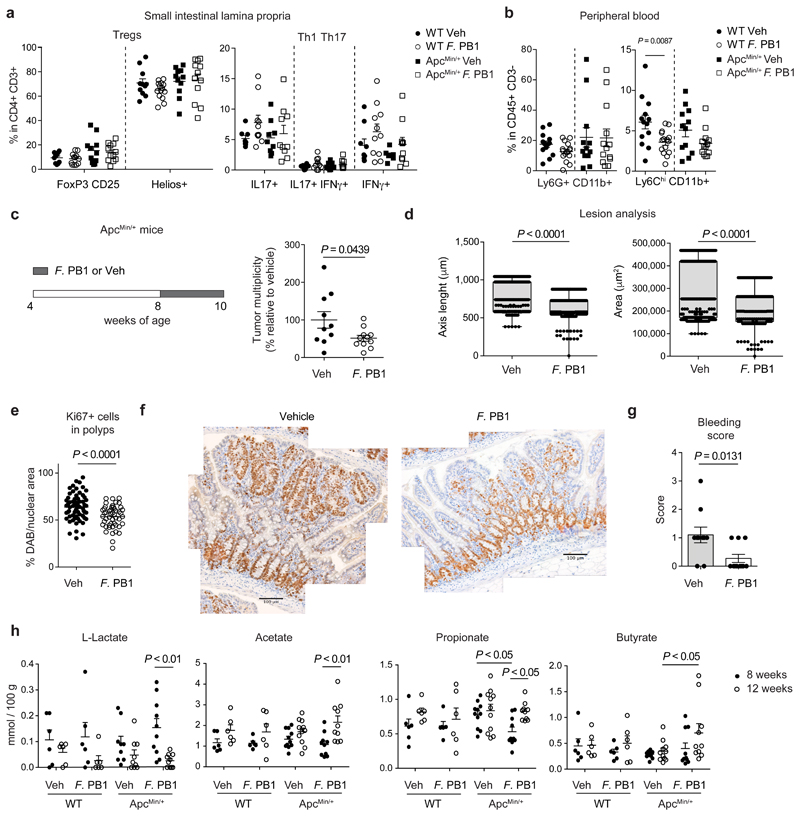
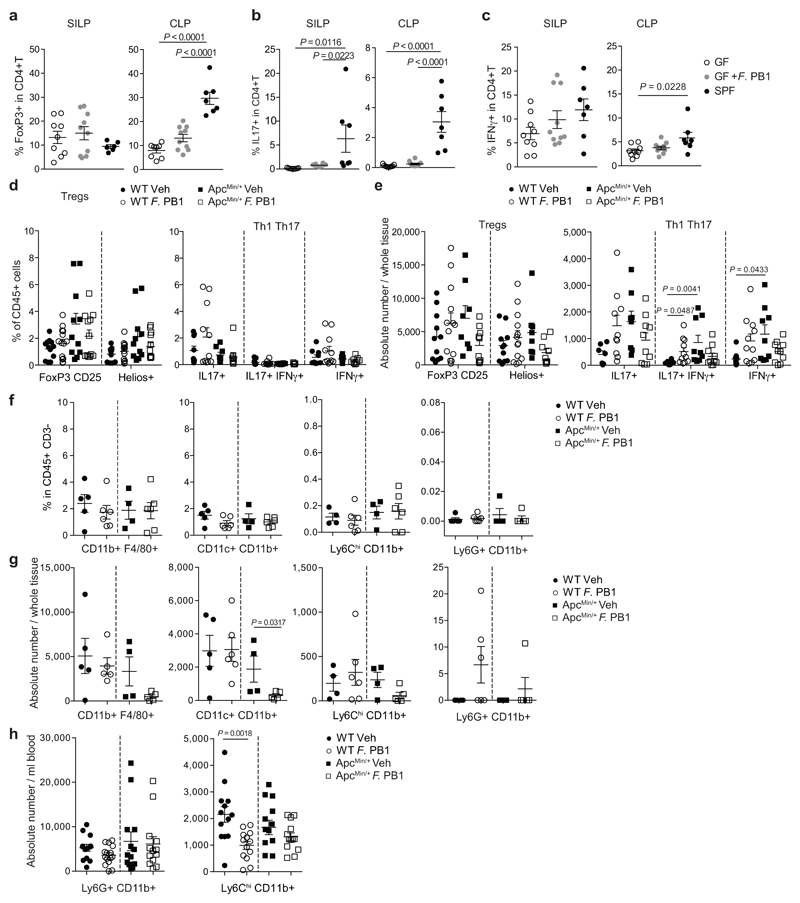
The anti-tumor activity of F. PB1 may depend on the immune system. Thus, we assessed the capacity of F. PB1 to activate an immune response in the absence of a confounding microbiota, through monocolonization of germ-free (GF) mice. As shown in Extended Data Fig. 3, F. PB1 did not significantly impact on immune cell development. It did not modify the amount of FoxP3+ T regulatory cells in the small intestine lamina propria and only slightly in the large intestine (Extended Data Fig. 3a) and had no effect on IL-17 or IFNγ producing CD4+ T cells at both locations (Extended Data Fig. 3b,c). We then analyzed the effect of F. PB1 in ApcMin/+ mice. We could not detect any difference in the frequencies of all tested CD4+ T cell populations (FoxP3+ T regulatory cells, Th1 or Th17) in SPF ApcMin/+ mice administered with F. PB1. However, we observed a trend towards a reduction in their absolute numbers (Fig. 3a and Extended Data Fig. 3d,e). We then analyzed the innate immune cell components, and found no difference in neutrophil frequencies and counts in the small intestinal lamina propria, while we observed a reduction in all of the mononuclear phagocytes in ApcMin/+ mice administered with F. PB1 (Extended Data Fig. 3f,g).
Fig. 3. F. PB1 reduces tumor cell proliferation without major impact on immune cells.
a,b, WT and ApcMin/+ mice treated with vehicle (Veh) or F. PB1 from week 8 to 12. a, Flow cytometric analysis of T regulatory, Th1 and Th17 cell populations in the small intestinal lamina propria. FoxP3+CD25+ are gated on the live CD45+ CD3+ CD4+ cells; Helios+ is gated on the FoxP3+ CD25+ cells (WT Veh, ApcMin/+ F. PB1 n = 12; WT F. PB1 n = 14; ApcMin/+ Veh n = 11 mice/group); IL17+, IFNγ+ and IL17+ IFNγ+ cells are gated on the live CD45+ CD3+ CD4+ cells (WT Veh, ApcMin/+ Veh n = 9; WT F. PB1 n = 11; ApcMin/+ F. PB1 n = 10 mice/group). b, Flow cytometric analysis of peripheral blood cells. Percentages are relative to the CD45+ CD3- population; WT Veh, ApcMin/+ F. PB1 n = 13; WT F. PB1 n = 15; ApcMin/+ Veh n = 12 mice/group. c-g, ApcMin/+ mice received vehicle (Veh) or F. PB1 from week 8 to 10. Data from two independent experiments depicted. c, Tumor multiplicity in the small intestine normalized to vehicle treated ApcMin/+ mice (Veh n = 10; F. PB1 n = 11 mice/group). d, Area and maximum diameter (axis length) of ileal dysplastic lesions (number of lesions: Veh = 265; F. PB1 = 150) normalized to the total number of lesions per mouse. Box plots show the interquartile range, median value and whiskers min to max (Veh n = 10; F. PB1 n = 11 mice/group). e, Percentage of nuclear Ki67 positive cells in the polyps of Veh and F. PB1-treated mice; n = 4 mice/group. f, Representative images of nuclear Ki67 staining in polyps of Veh and F. PB1-treated mice. Scale bars 100 μm. n = 4 mice/group. g, Bleeding score of Veh and F. PB1-treated mice (Veh n = 10; F. PB1 n = 11 mice/group). h, Fecal concentrations of L-lactate, acetate, propionate and butyrate in WT and ApcMin/+ mice treated with Veh or F. PB1 from 8 to 12 weeks, detected by UPLC-MS; WT Veh, WT F. PB1 n = 6; ApcMin/+ Veh n = 11; ApcMin/+ F. PB1 n = 10 mice/group.
a-d,g,h, Data from two independent experiments are represented as means ± s.e.m.. P values were assessed by one-way ANOVA using Bonferroni post-test for multiple comparisons (a) or two-tailed unpaired t-test (b,c,e,g), two-tailed unpaired Mann-Whitney test (d), or two-way ANOVA with Bonferroni post-test for multiple comparisons (h).
Consistent with our previous data17, we observed a higher frequency, albeit not significant, of circulating Ly6G+ CD11b+ neutrophils at 12 weeks of age in ApcMin/+ mice compared to WT littermates17 regardless of F. PB1 treatment. By contrast, treatment with F. PB1 resulted in the reduction of circulating Ly6Chigh CD11b+ inflammatory monocytes in both WT and ApcMin/+ mice (Fig. 3b and Extended Data Fig. 3h). Hence, the reduction of gut inflammatory monocytes may be due to a reduction of circulating monocytes during F. PB1 treatment.
We then evaluated whether F. PB1 was acting directly on tumor cell growth. We administered F. PB1 to 8 weeks old mice and then analyzed tumor growth two weeks later. F. PB1 treatment induced a reduction of: tumor numbers by a macroscopic evaluation (Fig. 3c), tumor size (Fig. 3d), tumor cell proliferation (Fig. 3e,f) and rectal bleeding (Fig. 3g).
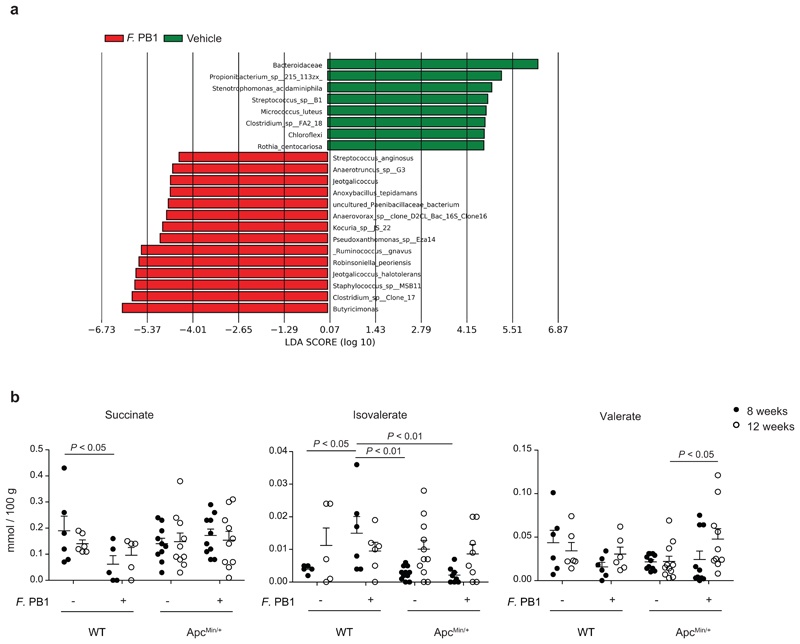
We then analyzed whether F. PB1 administration had changed the microbiota composition and its metabolic output. Bacterial DNA was extracted from feces of ApcMin/+ mice treated or not with F. PB1 and the 16S rRNA gene profiling data were analyzed. We observed an increase in SCFA-producing bacteria in mice treated with F. PB1, particularly Butyricimonas, butyric acid-producing bacteria18 (Extended Data Fig. 4a). As these and the other SCFA-producing bacteria were not reduced in the initial assessment of microbiota in untreated ApcMin/+ versus WT mice during tumor development, it is unlikely that they impact on tumorigenesis.
It has been reported that ApcMin/+ mice deleted for niacr1 (GPR109A, the receptor for butyrate) are more susceptible to tumor development via a mechanism that depends on the microbiota19. Thus, we evaluated whether F. PB1 administration may affect the fecal level of SCFAs. We detected an increase in SCFAs (propionate, butyrate and acetate) and a reduction in lactate in the fecal content of F. PB1 treated mice at 12 weeks as compared to 8 weeks of age (Fig. 3h). No significant differences were observed in succinate and isovalerate while a slight increase in valerate was observed between treated and untreated mice (Extended Data Fig. 4b).
These results suggest that F. PB1 alone or in cooperation with other bacteria affects tumor cell proliferation, probably via the release of SCFAs.
F. PB1 releases SCFAs that have anti-proliferative activity
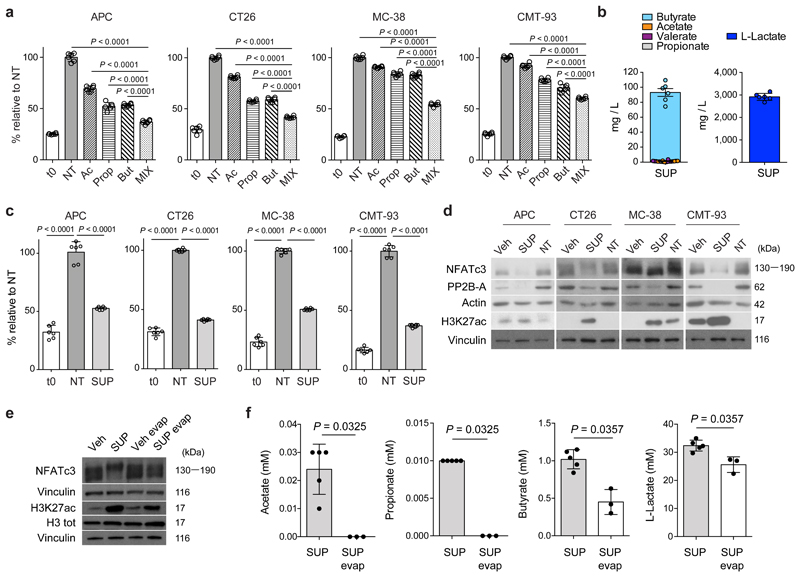
Butyrate has been described to have histone deacetylase (HDAC) inhibitory activity20 that affects cell proliferation. Differently from normal epithelial cells, colorectal cancer cells do not use butyrate for their growth and its concentration accumulates, acting as HDAC inhibitor21,22. We carried out a dose-dependent response on four different mouse intestinal tumor cell lines (APC, CT26, MC-38 and CMT-93) and found maximal cell growth inhibition, without compromising cell viability at 1-2 mM butyrate, and at a much higher doses of acetate and propionate (2,5-50 mM). We found that the combination of SCFAs additively inhibited the proliferation of all tested cell lines (Fig. 4a).
Fig. 4. F. PB1 releases SCFAs that have anti-proliferative activity.
a,c, Cell proliferation assay on mouse CRC cell lines treated or not (NT) with acetate (Ac), propionate (Prop) and butyrate (But) either alone and in combination (MIX) (a) or with culture broth fermented by F. PB1 (SUP) (c). t0 is the signal from cells at the time of stimulation. Two independent experiments were performed with consistent results. Data from one representative experiment (n = 6 biologically independent samples). P values were determined by one-way ANOVA using Bonferroni post-test. b, Quantification of L-lactate and SCFAs in broth fermented by F. PB1 (SUP) by UPLC-MS. Data from six independent experiments. d, Representative Western blots from two to three independent experiments showing the effect on H3K27 acetylation, PP2B-A and NFATc3 expression in mouse cell lines treated or not (NT) with broths fermented by F. PB1 (SUP) or not fermented (Veh). Vinculin and actin were used as loading controls. Densitometric analysis is reported in Extended Data Fig. 5b. e,f, In vitro stimulation of CT26 cells with untreated broth fermented by F. PB1 (SUP) or one depleted of SCFAs by evaporation (SUP evap). Untreated broth not fermented (Veh) or evaporated (Veh evap) used as controls. e, Representative Western blots from two independent experiments showing the effect of SUP and SUP evap on H3K27 acetylation and NFATc3 expression. Vinculin was used as loading control. Densitometric analysis is reported in Extended Data Fig. 5c. f, Quantification of SCFAs and L-lactate by UPLC-MS. n = 3 (SUP evap) or 6 (SUP) biologically independent experiments. P values were determined by two-tailed unpaired Mann-Whitney test. a,b,c,f, Data are presented as means ± s.d.
Then we assessed whether F. PB1 itself was capable of synthesizing SCFAs in vitro. F. PB1 grown in strictly anaerobic conditions was very efficient in producing both butyrate and lactate (Fig. 4b). Interestingly, the concentration of butyrate (1 mM) was very similar to the one identified on cell lines as capable of inhibiting cell proliferation, while that of acetate or propionate was extremely low (250-5000 times lower than the one effective in vitro on cell lines). We then evaluated whether also the F. PB1 spent medium (SUP), containing SCFAs, had anti-proliferative activity. As shown in Fig. 4c, the addition of SUP drastically inhibited tumor cell proliferation without affecting tumor cell viability (not shown), suggesting that F. PB1 releases metabolites that interfere with cell proliferation.
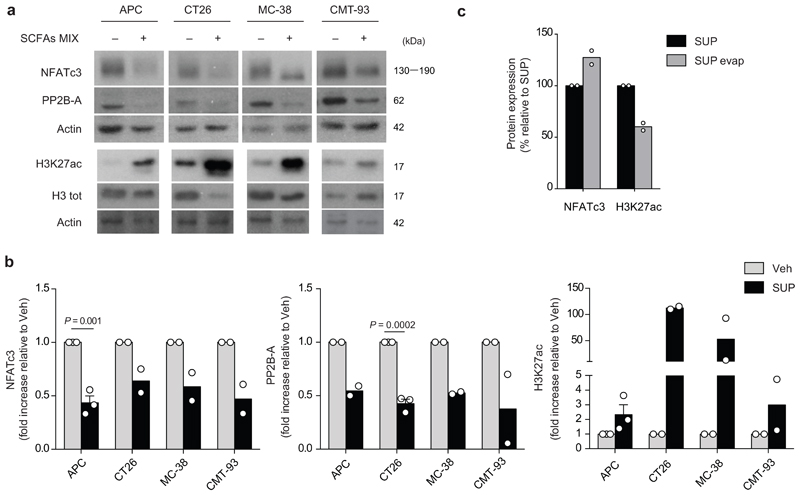
A recent report has shown that tumorigenesis in hCRC and ApcMin/+ mice is dependent on a calcineurin-mediated activation of the Nuclear factor of activated T cells (NFAT)c3 transcription factor which is important for cell proliferation23. Because the HDACi panobinostat can induce calcineurin degradation in multiple myeloma cells24, we assessed whether the SCFAs produced by F. PB1 could act as HDAC inhibitors and therefore affect calcineurin and NFATc3 activation. This would explain why administration of F. PB1 or its spent medium could inhibit tumor cell proliferation. Treatment with F. PB1 SUP (Fig. 4d) or the combination of SCFAs (Extended Data Fig. 5a) drastically increased acetylation of histone H3 (H3K27Ac) confirming its HDACi activity. This correlated with the downregulation of calcineurin (PP2B-A) and NFATc3 activation in CRC cell lines (Fig. 4d and Extended Data Fig. 5b).
SCFAs are volatile and can be extracted through evaporation. Thus, we compared the effect of the untreated F. PB1 SUP with one treated by evaporation to deplete SCFAs. There was a minor effect of SUP evaporation on the concentration of lactate, still the evaporated SUP was strongly impaired in inducing H3 acetylation and NFATc3 downregulation, suggesting that lactate was not involved in this process (Fig. 4e,f and Extended Data Fig. 5c). By contrast, there was very little acetate and propionate in the evaporated SUP while the concentration of butyrate was halved. Thus the residual effect on H3 acetylation and NFATc3 downregulation could be due to the left-over of butyrate still present in the supernatant after evaporation (Fig. 4f), or to other metabolites not affected by evaporation. Hence, F. PB1 releases metabolites, including SCFAs that can impact tumor cell proliferation by inhibiting HDACs thus blocking NFATc3 and calcineurin activation.
F. PB1 metabolic products have anti-proliferative activity in vivo and this is independent on the microbiota
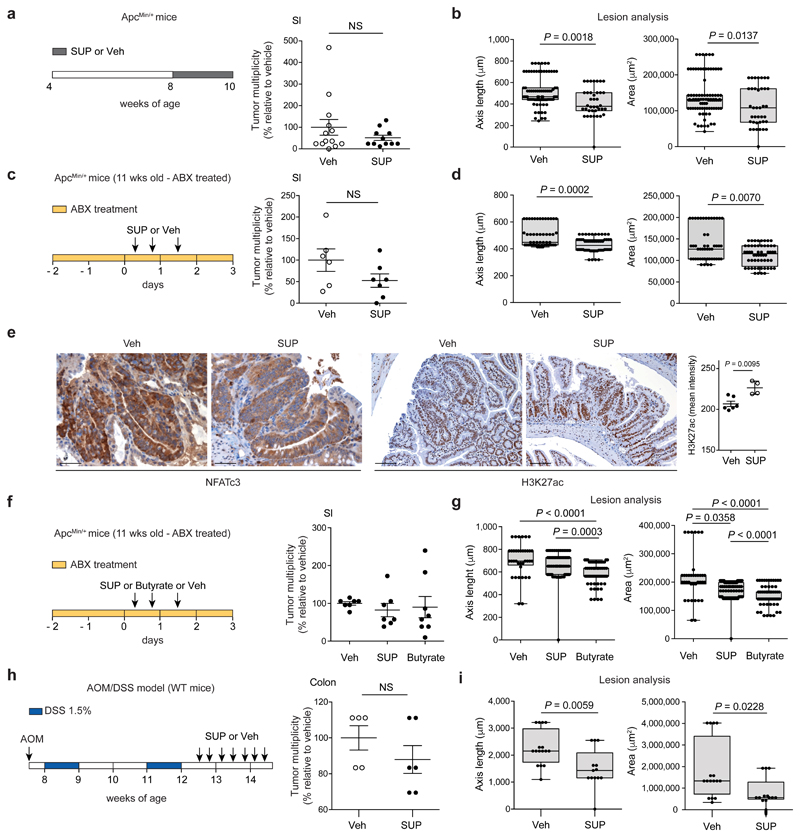
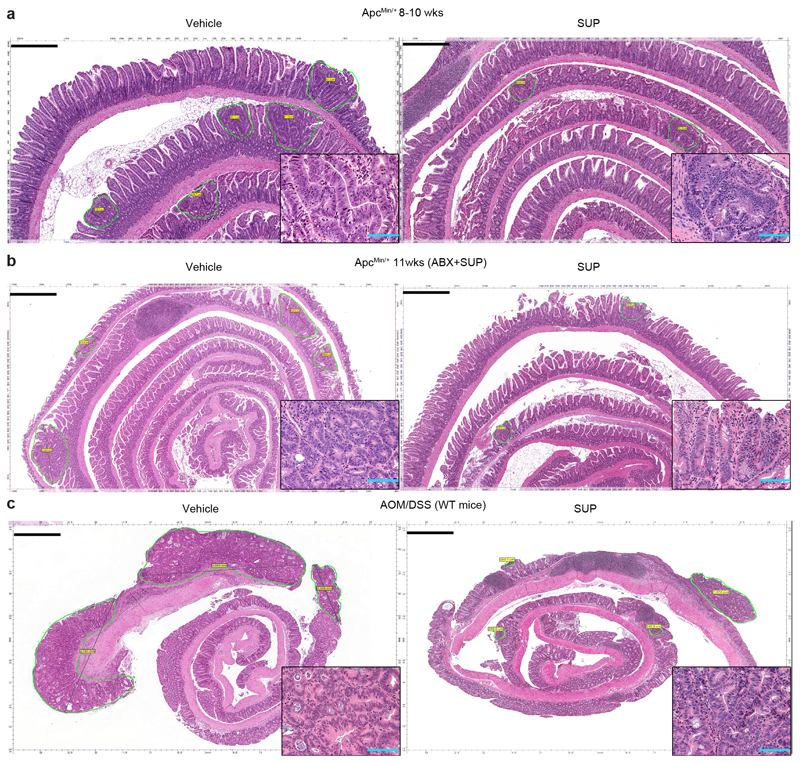
We then evaluated whether the F. PB1 SUP had anti-tumorigenic activity in vivo. F. PB1 SUP did not statistically affect tumor multiplicity, but significantly reduced the size of tumor lesions (Fig. 5a,b and Extended Data Fig. 6a). We then pretreated 11 weeks old ApcMin/+ mice (having already developed tumors) with antibiotics to affect the microbiota but not tumor growth and then the SUP was administered in the presence of antibiotics. In this case we observed an even higher reduction in the dimension of tumor lesions indicating that the spent medium had anti-proliferative activity in vivo and this was independent on the microbiota (Fig. 5c,d and Extended Data Fig. 6b). Furthermore, the SUP reduced activation of NFATc3 and induced histone H3 acetylation in dysplastic lesions, again in a microbiota-independent fashion (Fig. 5e). These data suggest that metabolic products of F. PB1 have a direct effect on tumor growth and affect NFATc3 activation.
Fig. 5. F. PB1 metabolic products, in particular butyrate, have anti-proliferative activity in vivo and this is independent on the microbiota.
a,b, ApcMin/+ mice received broths not fermented (Veh) or fermented by F. PB1 (SUP) from week 8 to 10. Data from three independent experiments (Veh n = 13; SUP n = 11 mice/group). c-e, 11 weeks old ApcMin/+ mice treated with Veh or F. PB1 SUP in the presence of an antibiotic cocktail (ABX). Data from two independent experiments (Veh n = 6; SUP n = 7 mice/group). f,g, 11 weeks old ApcMin/+ mice treated with Veh, F. PB1 SUP or butyrate 1 mM in the presence of ABX. Data from two independent experiments (Veh, n = 7; SUP and Butyrate n = 8 mice/group). a,c,f, Tumor multiplicity in the small intestine normalized to vehicle treated ApcMin/+ mice. b,d,g, Area and maximum diameter of ileal dysplastic lesions normalized to the total number lesions per mouse. e, Representative images of ileal dysplastic lesions stained with anti-NFATc3 antibody (200X magnification, scale bars 100 μm) or with anti-Histone H3 acetyl K27 antibody (100X magnification, scale bars 200 μm). Right panel: Quantitative color deconvolution analysis of Histone H3 acetylation in dysplastic lesions of ApcMin/+ mice treated or not with F. PB1 SUP (Veh, n = 6; SUP, n = 4 biologically independent samples). h,i, AOM/DSS treated C57BL/6 WT mice received Veh (n = 5 mice/group) or F. PB1 SUP (n = 6 mice/group) Data from one representative experiment depicted. h, Tumor multiplicity in the colon normalized to vehicle treated ApcMin/+ mice. i, Area and maximum diameter (axis length) of colon adenomas normalized to the total number of lesions per mouse. Two (c-i) or three (a,b) independent experiments were performed with consistent results. a-i, Data are represented as means ± s.e.m. and box plots show the interquartile range, median value and whiskers min to max in b,d,g,i. P values were evaluated using two-tailed unpaired Mann Whitney test (a-e,h), Kruskal-Wallis test with Dunn post-test (f,g) or two-tailed unpaired t-test (i).
We then evaluated whether butyrate was sufficient to mediate the anti-proliferative response. We administered sodium butyrate at 1 mM (the same concentration found in the SUP of F. PB1) to ApcMin/+ mice treated with antibiotics, so to avoid that butyrate could be used up by the indigenous microbiota. As shown in Fig. 5f,g butyrate had a very similar antiproliferative activity as F. PB1 SUP, indicating that butyrate is the main effector of F. PB1 activity.
Finally, we showed that F. PB1 SUP significantly reduced the dimension of lesions also in a model of inflammation-driven CRC (AOM/DSS), in which tumors preferentially develop in the colon, more closely mirroring the human pathology (Fig. 5h,i and Extended Data Fig. 6c).
Overall, these data show that F. PB1 metabolic products, in particular butyrate, thanks to their HDACi activity control NFATc3 activation blocking tumor cell proliferation in vivo in ApcMin/+ mice, independently on the microbiota. A similar antiproliferative activity is observed also in inflammation-driven CRC model.
The anti-proliferative activity of F. PB1 can be exerted by other SCFAs producing bacteria
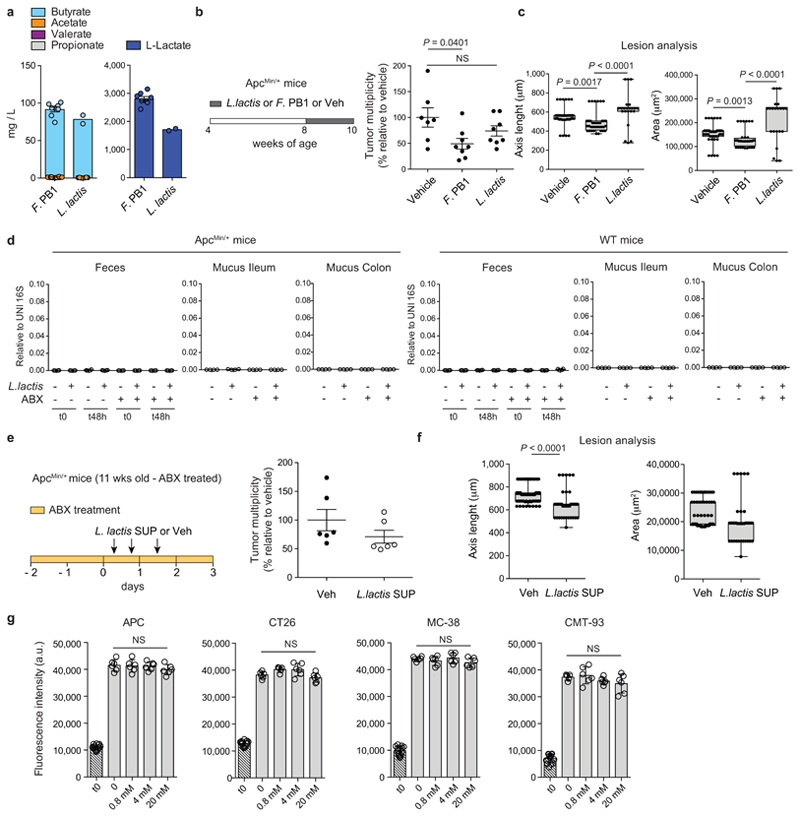
We then evaluated whether the activity of F. PB1 could be shared by other SCFAs producing bacteria. We selected Lactococcus lactis because it secreted butyrate and some lactate in culture similarly to F. PB1 (Extended Data Fig. 7a) and it has been proposed to have anti-proliferative activities in vitro by an unknown mechanism25. We administered L. lactis following a schedule similar to that of F. PB1, but we could not detect any anti-tumoral effect (Extended Data Fig. 7b,c). This is probably due to the inability of L. lactis to survive/colonize in the mouse intestine, as we could not detect L. lactis even in WT mice, independently of the microbiota (Extended Data Fig. 7d). We thus analyzed the anti-proliferative activity of SUP from L. lactis in vivo in antibiotic treated ApcMin/+ mice. We found that L. lactis SUP reduced the size of tumor lesions, even though not as well as F. PB1 SUP (Extended Data Fig. 7e,f). This difference cannot be due to a reduction in lactate production as lactate did not impact on tumor cell proliferation in vitro (Extended Data Fig. 7g). Hence, the antiproliferative activity of F. PB1 is not unique to this bacterium but can be shared by other bacteria that produce SCFAs provided that they are capable of colonizing or surviving enough time to produce butyrate.
Holdemanella biformis is the equivalent of F. PB1 in humans
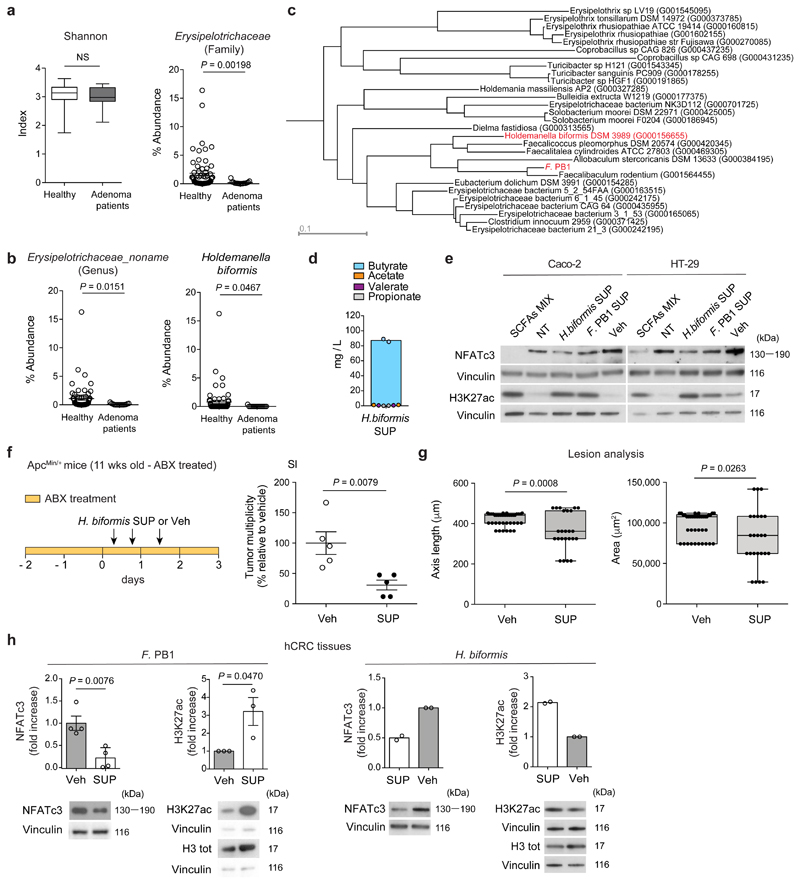
We then assessed the relevance of these findings in human CRC. We interrogated a dataset of a shot-gun microbiome analysis carried out in patients with colorectal adenomas26 and found that, similarly to the mouse, there was a reduction in the abundance of the family of Erysipelotrichaceae in patients with large adenomas as compared to healthy individuals, but there was no change in the Shannon diversity index (Fig. 6a). In this family, an undefined genus (Erysipelotrichaceae_noname) and a species, Holdemanella biformis, were strongly underrepresented in advanced colon adenomas (Fig. 6b). Interestingly, a high-quality phylogeny of the Erysipelotrichaceae family and the F. PB1 isolate showed that among the bacteria that colonize the human gut, Holdemanella biformis is the second bacterium phylogenetically closest to F. PB1 (phylogenetic distance 0.273, Fig. 6c).
Fig. 6. Holdemanella biformis is the equivalent of F. PB1 in humans.
a, Shannon diversity index in fecal DNA from healthy donors (n = 61) and large adenoma (n = 15) patients and abundance of the family Erysipelotrichaceae. Box plots show the interquartile range, median value and whiskers min to max. b, Abundance of the undefined genus Erysipelotrichaceae noname and of the species Holdemanella biformis. At each taxonomic level, a two-tailed Wilcoxon Rank-Sum test comparing relative abundances of large adenoma (n = 15) and control samples (n = 61) was applied. P-values obtained at family and genus taxonomic levels were corrected for multiple hypothesis testing using the Benjamin-Hochberg procedure. c, A high-quality phylogeny of the Erysipelotrichaceae family and the F. PB1 isolate. d, Quantification of SCFAs in the broth fermented by Holdemanella biformis (H. biformis SUP) by UPLC-MS. Data from two independent experiments (n = 2 biologically independent experiments). e, Representative WB from two to three independent experiments performed with consistent results showing the effect of SCFAs MIX, F. PB1 SUP, H. biformis SUP on H3K27 acetylation and NFATc3 expression in human CRC cell lines. Cells not treated (NT) or treated with non-fermented medium (Veh) as a control. Vinculin used as loading control. Densitometric analysis is reported in Extended Data Fig. 8b. f,g, 11 weeks old ApcMin/+ mice treated with Veh or H. biformis SUP in the presence of antibiotics (ABX) (n = 5 mice/group). f, Tumor multiplicity in the small intestine normalized to vehicle treated ApcMin/+ mice. g, Area and maximum diameter of ileal dysplastic lesions normalized to the total number lesions per mouse. Box plots show the interquartile range, median value and whiskers min to max. h, Representative WB from two (H. biformis SUP) to three (F. PB1 SUP) independent experiments performed with consistent results showing the effect of F. PB1 SUP or H. biformis SUP on H3K27 acetylation and NFATc3 expression in ex-vivo treated human colon tumor samples (hCRC). Bar plots show the densitometric quantification of NFATc3 (normalized to vinculin) and H3K27 acetylation (normalized to total H3) (H. biformis SUP, n = 2; F. PB1 SUP, n = 3 biologically independent experiments). Data are represented as means ± s.e.m. in a,b,d,f-h. P values were evaluated using two-tailed unpaired Mann Whitney test (a,f,g right panel) and two-tailed unpaired t-test (g left panel, h).
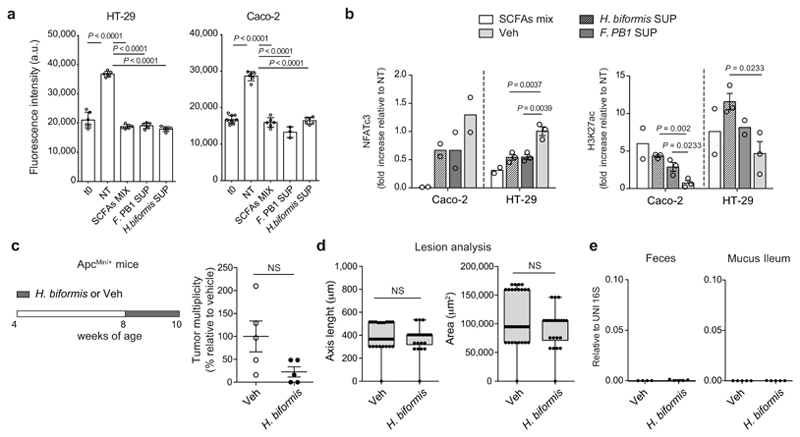
H. biformis released SCFAs (Fig. 6d), and the SUP of H. biformis inhibited human tumor cell proliferation (HT-29 and Caco-2) similarly to F. PB1 (Extended Data Fig. 8a). This activity was mediated by the HDAC inhibitory activity of the SUP as shown by increased histone acetylation and reduced NFATc3 activation (Fig. 6e and Extended Data Fig. 8b). In vivo, H. biformis was unable to survive/colonize the mouse intestine and we could not observe any anti-proliferative activity in ApcMin/+ mice (Extended Data Fig. 8c-e). However, when we tested the H. biformis SUP in ApcMin/+ mice we observed a much higher effect on tumor multiplicity (Fig. 6f,g), suggesting that H. biformis may have also some effect on tumor initiation. This remains to be evaluated.
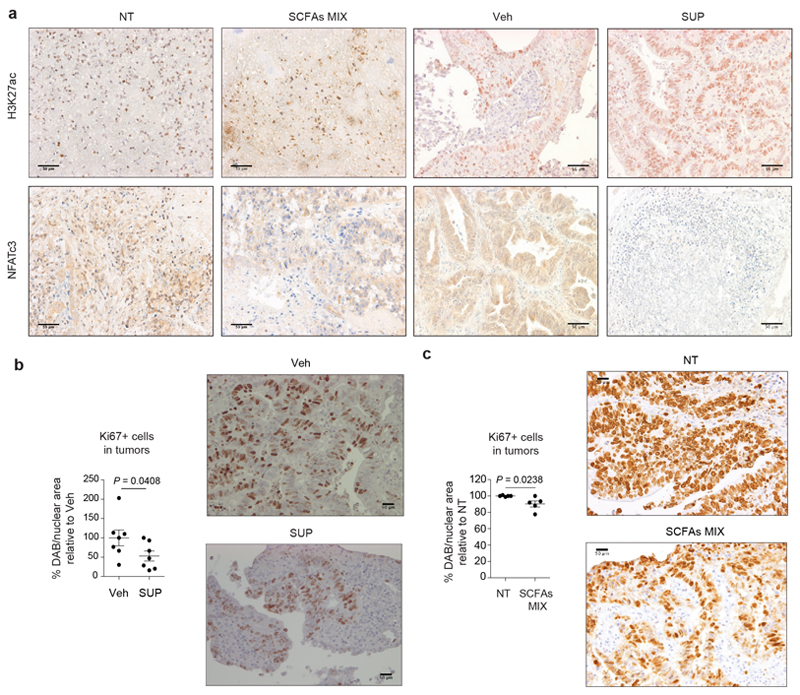
We confirmed our data on human specimens from CRC patients using a technology set up in our laboratory27. Tumor specimens from CRC patients were treated either with the SCFA mix (acetate:propionate:butyrate 2:1:1) or with the SUP of F. PB1 or H. biformis. As shown in Fig. 6h and Extended Data Fig. 9a, SUP of F. PB1 or H. biformis, as well as the mix of SCFAs induced an increase of H3K27 acetylation and a reduction of NFATc3 protein levels. This correlated with reduced tumor cell proliferation as shown by lower nuclear Ki67 immunostaining in the presence of either F. PB1 SUP (Extended Data Fig. 9b) or SCFA combination (Extended Data Fig. 9c). These results suggest that H. biformis is the human counterpart of F. PB1.
Discussion
During CRC tumorigenesis, due to epithelial cell dedifferentiation, the mucus layer has been shown to undergo profound changes, both in size and in composition28. These changes may result in two concomitant and non-mutually exclusive events that may be responsible for fostering intestinal tumorigenesis. On one side, the increased penetrance or adherence of protumorigenic bacteria which may favor immune cell recruitment and activation, drive tumor cell transformation or Th17 cell activation thus contributing to tumor development7,29–35. On the other side, tumorigenesis may be due to the contraction of anti-tumorigenic bacteria that release anti-proliferative metabolites. We focused on the latter and identified a bacterial member of the murine gut microbiota, F. rodentium PB1, belonging to the Erysipelotrichaceae family that is one of the most abundant taxa in the murine gut and is not expanded during tumorigenesis, presumably due to the different mucus composition. This may explain why its contraction affects so drastically tumor development.
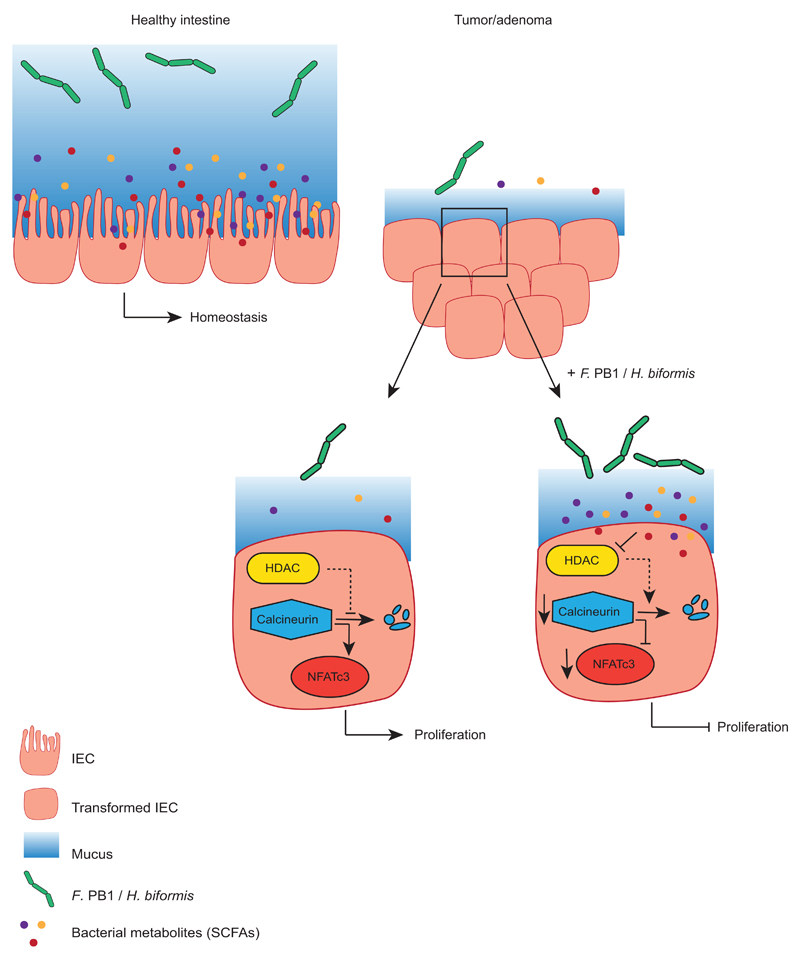
Tumorigenesis in human CRC and ApcMin/+ mice is dependent on a calcineurin-mediated activation of NFATc3 transcription factor which drives tumor cell proliferation23. NFATc3 is also involved in driving expression of MUC5ac36 and this may explain why hCRC and ApcMin/+ mice ectopically express MUC5ac. Calcineurin can be induced to degradation by the HDACi panobinostat24. Here we show that bacterial spent medium (SUP) from F. PB1 and its human counterpart Holdemanella biformis, acts as HDACi affecting calcineurin and NFATc3 activation and this results in inhibition of tumor cell growth, independently of the microbiota (Extended Data Fig. 10). In some cases we observed an effect of F. PB1 or of H. biformis SUP also on tumor multiplicity. This could be due to a technical issue due to the inability to detect also small tumors, but we cannot exclude an effect on tumor initiation.
We found a reduction of lactate in the feces of mice treated with F. PB1. This was unexpected as F. PB1 was found to produce large amounts of lactate in vitro, but we cannot anticipate whether it was produced also in vivo. In addition, as lactate is known to be produced and used by tumor cells37,38, the reduction of lactate after F. PB1 administration could be due to reduced tumor cell proliferation or to increased use of lactate by tumor cells. Alternatively, lactate could be used by other bacterial species for their own growth39.
The involvement of SCFAs in the observed anti-proliferative activity is demonstrated by the following observations: 1. evaporation to deplete SCFAs leads to a strong reduction in the activity of the SUP; 2. SUP from another butyrate producing bacterium (L. lactis) or 3. butyrate itself, at a concentration similar to that found in the SUP, can mimic the effect of F. PB1. This suggests that the anti-tumor activity of F. PB1 is not unique and could be shared with other SCFA-producing bacteria as long as they have the ability to colonize or survive in the gut and produce butyrate locally.
Why is butyrate inhibiting proliferation of only tumor cells and not normal epithelial cells? In colorectal cancer, due to the Warburg effect, tumor cells undergo increased glycolysis rather than mitochondrial oxidative metabolism21. Thus, cancer cells do not use butyrate for their growth and butyrate concentration raises and can act as HDACi22. Consistently, dietary fibers, which promote the growth of butyrate-producing bacteria, affect tumorigenesis in ApcMin/+ mice40 and ApcMin/+ mice deleted for niacr1 (GPR109A, the receptor for butyrate) are more susceptible to tumor development via a mechanism that depends on the microbiota19.
Consistent with literature data41,42, we have shown that Holdemanella biformis is able to produce SCFAs and its spent medium can inhibit tumor cell proliferation. We do not know whether H. biformis, similarly to mouse F. PB1, is the major bacterium responsible for the antitumor properties in humans, or whether other SCFA-producing bacteria are also contracted in humans and may contribute to failure of tumor growth control. Future studies should aim at addressing this point and at assessing whether this species may have a therapeutic potential. As H. biformis is reduced in the feces of patients with large adenomas, it may also be used as a potential biomarker for detecting tumors in their early phase.
Methods
Bacterial strains
Faecalibaculum rodentium PB1 was isolated in Kenya Honda laboratory (RIKEN IMS, Yokohama, Japan) from fecal pellets coming from 12 weeks old WT C57BL/6 littermates of our ApcMin/+ colony as described in43. Briefly, feces were suspended in Tryptic Soy (TS) Broth, serially diluted and plated on Eggerth Gagnon (EG) agar plates. Forty-eight colonies were picked and sequenced using panbacterial primers targeting the 16S rRNA gene. Similarity to F. rodentium was checked both on databases and with the sequence retrieved from our metagenomic analysis, resulting in 99.7% and 98% homology respectively. Faecalibaculum rodentium PB1 strain was deposited to DSMZ (Type strain No.: DSM32803). Holdemanella biformis was purchased from the German collection of microorganisms DSMZ (Type strain No.: 3989). Both bacteria were cultured in the anaerobic chamber (gas atmosphere N2/CO2/H2, 80:15:5), in pre-reduced EG broth under anaerobic conditions for 48 hours. The bacterial strain Lactococcus lactis subsp. lactis was purchased from DSMZ (Type strain No.:20481) and cultured in pre-reduced MRS broth at 30°C in static conditions. Bacterial supernatant (SUP) was derived from o/n cultures of the strains in the conditions described above. The medium fermented by bacteria (SUP) was filtered in 0,25 μm filters and immediately frozen.
Cell lines
Mouse CRC cell line CT26 and human CRC cell lines HT-29 and Caco-2 were purchased from the American Type Culture Collection (ATCC). CMT-93 mouse rectum carcinoma cell line is a kind gift of Dr. David Artis (Cornell University, NY, USA). MC-38 mouse carcinoma cell line is a kind gift of Dr. Carsten Krieg (Zurich University, Switzerland). APC cell line was derived from ApcMin/+ small intestinal adenomas by mechanical disruption. Cell lines were purchased from the American Type Culture Collection (ATCC) and no other authentication method was performed. In APC cell line the loss of heterozygosity (loss of the WT allele and presence of the Min allele) was checked by TaqMan assay. CT26 cells were cultured in RPMI 1640 supplemented with 10% FBS, 2 mM L-glutamine. CMT-93 and MC-38 cells were cultured in DMEM supplemented with 10% FBS, 2 mM L-glutamine. APC cells were cultured in complete DMEM supplemented with Insulin-Transferrin-Selenium-Ethanolamine (ITS-X, Gibco) and human EGF (10 pg/μl). HT-29 cells were cultured in DMEM supplemented with 10% FBS, 2 mM L-glutamine. Caco-2 were cultured in MEM with Earle’s Salt supplemented with 20% FBS, 2 mM L-glutamine, 1 mM sodium pyruvate (NaP), 0.1 mM nonessential amino acids (NEAA). All cell lines were tested to exclude mycoplasma contamination.
To evaluate the effect of SCFA either alone or in combination and of the bacterial spent medium (SUP), cells were seeded and after one overnight stimulated. Cells were stimulated with sodium acetate (S5636, Sigma-Aldrich), sodium propionate (P5436, Sigma Aldrich), sodium butyrate (ARK2161, Sigma-Aldrich) or a mix of the three. APC, CT26, MC-38, HT-29 and Caco-2 cells were stimulated with 50 mM sodium acetate, 10 mM sodium propionate, 2 mM sodium butyrate and a mix of sodium acetate:propionate:butyrate 50:10:2 mM. CMT-93 cells were stimulated with 10 mM sodium acetate, 2.5 mM sodium propionate, 1 mM sodium butyrate and a mix of sodium acetate:propionate:butyrate 10:2.5:1 mM. Cell were stimulated also with different concentrations (0.8, 4, 20 mM) of sodium L-lactate (71718, Sigma-Aldrich). Finally, cells were stimulated with the bacterial broth diluted 40% v/v in cell culture medium, (EG broth) fermented by F. PB1 or H. biformis (SUP) or relative control non-fermented broth (Vehicle). CT26 cells were treated also with the fermented broth (called also spent medium) evaporated to remove the SCFAs. The spent medium was evaporated to dryness at 50°C under reduced pressure (5 mbar). The residue was taken up with water, filtered and diluted 40% v/v in cell culture medium.
Cell proliferation was evaluated after 48 h of stimulation with CyQUANT Cell Proliferation assay (Molecular Probes). Each condition was tested in 6 wells of a 96-multiwell plate and 12 reads per well were recorded.
Mice
This study employed both male and female mice of the following strains as model organisms: C57BL6/J; C57BL6/J-ApcMin/J; Germ-free ICR. 6 weeks old C57BL6/J mice were purchased from Harlan Laboratories. C57BL6/J-ApcMin/J (referred to as ApcMin/+ 44) are maintained as inbred strain in our animal facility. For experiments where ApcMin/+ were employed, wild type littermates born from the same mothers of experimental mice were used as controls. All mice were maintained in microisolator cages in specific pathogen-free (SPF) animal facility. Germ-free ICR male mice were maintained in the isolators at RIKEN IMS (Yokohama, Japan). Experiments were performed in accordance with the guidelines established in the Principles of Laboratory Animal Care (directive 86/609/EEC) and approved by the Italian Ministry of Health. On the basis of our experience with animal models and according to animal-welfare policy (directive 86/609/EEC), which strongly suggests the use of a limited number of animals, we estimated that two experiments with n = 5 mice per group would allow us to reach statistical significance. Animals were allocated randomly to each treatment group. Different treatment groups were processed identically, and animals in different treatment groups were exposed to the same environment. The investigators were not blinded during experimental mice allocation and outcome assessment. For macroscopical analysis of the tumor lesions, we calculated the average of tumor numbers in vehicle group, then the number of tumors of each individual mouse is referred to this average as a percentage.
Bacterial profiling of intestinal microbiota
DNA from fecal pellets and mucus scraped from the small intestine and colon was extracted with G’NOME DNA isolation kit (MP) following a published protocol45. V5-V6 hypervariable regions of bacterial 16S rRNA gene were amplified and processed with a modified version of the Nextera protocol46. Metagenomic libraries obtained were sequenced with MiSeq Illumina platform with 2x250 paired-end (PE) approach. Metagenomic amplicons were analyzed by applying the BioMaS pipeline47: (i) the paired-end reads were merged into consensus sequences using PEAR48 and subsequently dereplicated applying Usearch49, maintaining the information about the total number of reads supporting each consensus sequence; (ii) the PE reads which remained non overlapping were considered for further analysis only if after the low-quality region trimming (Phred quality cut-off = 25) both read ends were ≥50 bp long; (iii) Both the merged sequences and the unmerged reads were matched against the RDP database (Ribosomal Database Project) (release 11.2)50 by Bowtie251. The mapping data were filtered according to two parameters: identity percentage and query coverage (≥70%). In particular, sequences obtaining an identity percentage ≥ 97% were classified to species level and those with identity ≥ 90% and < 97% were classified at higher taxonomic rank; (iv) Finally, all mapped reads fulfilling the settled filters were taxonomically annotated using the Tango tool52. Assigned genera were filtered considering as present only the ones for which at least 5 reads per samples were present. The read counts were normalized using an approach similar to the RPKM (Reads per kilo-base per million): normalized count = assigned reads / (total assigned reads at the rank level/1.000.000). Significant differences between WT and ApcMin/+ mice in fecal microbiota at the genus and species level were calculated with the DESeq2 R-package53. Taxa specifically associated to one of the analyzed conditions were identified by using the LEfSe (Linear discriminant analysis Effect Size)54.
F. PB1 abundance was validated with qPCR assay with specific primers and abundance was normalized to panbacterial primers targeting the 16S rRNA gene (UNI 16S)55. Bacterial primer sequences are listed in Supplementary information Table 1.
Normalized reads count for differentially represented species in WT and ApcMin/+ mice were log-transformed and plotted as heatmap by using the vegan56 and the ggplot257 R packages.
Histological evaluation
Formalin-fixed and paraffin embedded swiss rolls of colon and small intestine were sectioned at 3-4 mm and the sections stained with hematoxylin and eosin. For histopathological examination and scoring, H&E slides were evaluated by an expert pathologist. The extent of inflammatory changes was defined according to the score proposed by Cooper et al.58. The histological scoring system to evaluate the colitis grade is described in Supplementary Information Table 2. For each sample, also the number of ulcers and dysplastic/adenomatous lesions was reported. The proliferative lesions are classified according to mouse pathology consensus recommendations59. The tissue area of dysplastic and adenomatous lesions was measured on H&E stained slides by digital microscopy. Briefly, slides were digitalized by an Aperio ScanScope CS Slide Scanner (Aperio Technologies) at 40X magnification. The dysplastic and adenomatous lesions were identified and selected using Aperio ImageScope (Leica Biosystems Imaging). The value of every selected dysplastic/adenomatous area is expressed in μm2 and its major axis in μm.
Fluorescence In situ Hybridization (FISH)
Carnoy’s fixed, paraffin embedded tissues were sectioned 5 μm thickness. The probes used were designed to specifically target different regions of the F. BPI 16S rRNA. All the probes were manufactured by SIGMA and labelled with Cyanine 3 (5'-[Cy3]GCCAACCAACTAATGCACCG; 5'[CY3]CCGGGAATACGCTCTGGAAA). Probes were used at 5 ng/μl in pre-warmed hybridization buffer (0.9 M NaCl, 20 mM Tris pH 7.4, 0.01% SDS). Slides were incubated at 55°C in a humid chamber for 90 minutes, washed two times at 55°C in pre-warmed washing buffer (0.9 M NaCl, 20 mM Tris pH 7.4), mounted and counterstained with DAPI (contained in the VECTA SHIELD mounting medium). Confocal images were acquired with Leica DMi8 confocal microscope, through HCX PL APO 40X(NA 1.25) oil immersion objective.
Immunofluorescence
In order to maintain the mucus structure, murine intestines were fixed in Carnoy fixative (60% Ethanol, 30% Chloroform, 10% Acetic acid, glacial), manually processed, paraffin embedded and stored at RT until microtome sectioning. Microsections (6 μm thick) were cut using a microtome (Leica), mounted on ultra plus poly-L-lysine-coated glass slides (Menzel-Glaser) and left at 37° o/n. Tissue sections were deparaffinized in histolemon and hydrated through graded alchol series (100%, 95%, 70%, H2O). Antigen unmasking was performed in Tris-EDTA pH9 (10mM Tris-HCl, 1mM EDTA, Tween 0.05%) for 50 minutes at 95°. Sections were incubated with anti-Muc1 rabbit polyclonal primary antibody (1:100, clone aa 474-630, cat. LS-C343984, LifeSpan Bioscience) at +4° C o/n. After two washing steps in Tris 0.1M pH7.4, slides were incubated with donkey anti-rabbit-Cy3 secondary antibody (1:300, cat. 711165153, Jackson Immuno research) for 2 hours at RT. After washing twice in Tris 0.1M pH7.4 for 10 minutes slides were couterstained and mounted with VECTASHIELD Mounting Medium with DAPI (Vector Laboratories). Confocal images were acquired with Leica DMi8 confocal microscope through HCX PL APO 40X (NA 1.25) oil immersion objective. All images were adjusted and assembled in Fiji software.
RNA extraction, RT–PCR and qPCR
Intestinal chunks from wild type mice, normal ileal chunks and pooled small intestinal polyps from ApcMin/+ mice were sampled at 8 and 16 weeks of age. Intestinal tissue was homogenized in 500 μl of TRIzol (Invitrogen). RNA was extracted adding 100 μl of chloroform, precipitating the aqueous phase with 1 volume of 100% ethanol and purifying RNA with Quick-RNA MiniPrep Kit (Zymo Research). RNA was retro-transcribed with ImProm-II Reverse Transcriptase kit (Promega). qPCR assay was performed with Fast Sybr Green Master Mix (Life Technologies). Primers used are listed in Supplementary Information Table 1. Expression levels are normalized to the 60S ribosomal protein gene expression Rpl32.
Human metagenomics
For the analysis of the Zeller et al. 2014 CRC dataset, raw sequences were downloaded from the sequence read archive (SRA) and used as input into MetaPhlAn260. Individual sample profiles were merged and the final table was filtered to include only members of the Erysipelotrichaceae family and samples collected in France. The generated taxonomic profiles are available through the curatedMetagenomicData resource61. At each taxonomic level, we applied a Wilcoxon Rank-Sum test comparing relative abundances of large adenoma (n = 15) and control samples (n = 61). P-values obtained at each taxonomic level were corrected for multiple hypothesis testing using the Benjamin-Hochberg procedure. A high-quality phylogeny of the Erysipelotrichaceae family based on the 400 PhyloPhlAn62 markers considering 47 complete reference genomes deposited in NCBI (accession ids are reported within brackets in the node labels) and the F. PB1 isolate was performed.
Samples from human patients
Colonic human specimens were obtained from patients diagnosed with colon cancer and undergoing surgery at IEO. Inclusion criteria were newly diagnosed CRC patients (stage: I to III), aged between 35-70 years old, performance status 0-1 based on the Eastern Cooperative Oncology Group (ECOG) and signed informed consent according to ICH-GCP. Exclusion criteria were a personal history of malabsorption syndrome or any chronic inflammatory bowel disease, or subjects with hereditary syndrome (such as FAP HNPCC) and use of antibiotics in the previous four weeks. All patients given written informed consent and were enrolled in institutional protocol approved by IEO's ethical committee. Human biological samples were sourced ethically and their research use was in accord with the terms of the informed consent provided. Case selection was therefore independent and blinded to baseline characteristics, treatments received, clinical outcome and molecular characterization to reduce any potential self-selection bias.
F. PB1 administration to GF and F. PB1, H. biformis and L. lactis administration to ApcMin/+ mice
In experiments of gnotobiotic colonization, 5 germ-free ICR male mice were orally administered with 250 μl of F. PB1 culture (O.D.600nm≅0,6, corresponding to about 5×10⁷ UFC/ml) and the abundance of small intestinal and colonic cells was addressed after 4 weeks. To evaluate the effect of exogenous F. PB1 administration, WT and ApcMin/+ mice were orally administered 3 times per week with different schedules (see Figs. 2d,e and 3c) with frozen bacterial stocks equivalent to 250 μl of culture at logarithmic growth phase. At 8, 10 or 12 weeks of age mice were sacrificed and tumor multiplicity in the small intestine and colon assessed. Neutrophil and inflammatory monocyte abundances in circulating blood and Treg, Th1 and Th17 abundances in small intestinal and colonic lamina propria were assessed. Bleeding score was assigned as follows: 0 negative to Hemoccult (Beckman Coulter); 1 positive to Hemoccult; 2 gross bleeding. To evaluate the effect of exogenous H. biformis and L. lactis administration, ApcMin/+ mice were orally administered 3 times per week with frozen bacterial stocks from 8 to 10 weeks of age. In monocolonization experiments, WT and ApcMin/+ mice were treated or not with antibiotic cocktail (Ampicillin 1g/L, Neomycin 1g/L, Vancomycin 0.5g/L in drinking water and Metronidazole 2mg/mouse administered by oral gavage every 2 days) for 7 days and challenged with either vehicle or F. PB1 or L. lactis for 3 days in a row. After 48 h mice were sacrificed and bacterial abundance was validated in the feces, ileal and colon mucus with qPCR assay with specific primers (Supplementary Information Table 1).
Spent medium (SUP) administration to AOM/DSS treated C57BL6/J WT mice or ApcMin/+ mice
8 weeks old C57BL6/J mice were treated with AOM 10mg/Kg of body weight by intraperitoneal injection. After 3 days they received DSS 1.5% w/v in drinking water for 7 days. Mice were allowed for recovery for 14 days. This schedule was repeated for 2 cycles. During the second recovery (from week 12 to 14) AOM/DSS mice were treated by oral gavage (200 μl/mouse) 3 times per week for two weeks with EG broth fermented by F. PB1 (F. PB1 SUP) or relative control non-fermented broth (Vehicle) and tumor lesions were analyzed.
Culture broths fermented with F. PB1, H. biformis or L. lactis (F. PB1 SUP, H. biformis SUP, L. lactis SUP) or not (Vehicle) were administered by oral gavage 3 times per week for two weeks in 8 weeks old ApcMin/+ mice.
Vehicle (EG for F. PB1 or H. biformis; MRS for L. lactis), SUP and butyrate 1mM were also administered by oral gavage (200 μl/mouse) 3 times in a row (two times at day 1) in combination with antibiotic cocktail (Ampicillin 1g/L, Neomycin 1g/L, Vancomycin 0.5g/L in drinking water and Metronidazole 2 mg/mouse administered by oral gavage every 2 days) in 11 weeks old ApcMin/+ mice pre-treated with antibiotic cocktail for two days. In these experiments mice were sacrificed 24h after the last gavage.
Quantification of fecal and spent medium SCFAs
SCFAs were quantified in fecal and spent medium (F. PB1 SUP, H. biformis SUP and L. lactis SUP) samples as previously described63 with few modifications. In detail, 100 mg of feces or 200 μl of SUP were resuspended in 2 ml of 0.001% HCOOH and vortexed for 1 min. The suspension was centrifuged at 1000 x g for 2 min at 4 °C and the supernatant was recovered. The residue was extracted again as described above. The supernatants were combined, and the volume was adjusted to 5 ml with a solution of 0.001% HCOOH in water. All extracts were stored at -20 °C. Before UPLC-HR-MS analysis, samples were diluted 1:100 in 0.001% HCOOH and centrifuged at 3000 x g for 1 min. UPLC-HR-MS analysis was carried out on an Acquity UPLC separation module (Waters, Milford, MA, USA) coupled with an Exactive Orbitrap MS with an HESI-II probe for electrospray ionization (Thermo Scientific, San Jose, CA, USA). The ion source and interface conditions were as follows: spray voltage -3.0 kV, sheath gas flow-rate 35, auxiliary gas-flow rate 10 and temperature 120 °C, and capillary temperature 320 °C. A 1.8-mm HSS T3 column (150 x 2.1 mm, Waters) was used for separation at a flow rate of 0.2 ml/min. The eluents were 0.001% HCOOH in MilliQ-treated water (solvent A) and CH3OH:CH3CN (1:1, v/v, solvent B). A 5 μl aliquot of the sample was separated by the UPLC using the following elution gradient: 0% B for 4 min, 0-15% B in 6 min, 15–20% B in 5 min, 20% for 13 min, and then return to initial conditions in 1 min. The column and samples were maintained at 30 and 15°C, respectively. The UPLC eluate was analyzed in full-scan MS in the range 50–130 m/z. The resolution was set at 50 K, the AGC target was 1E6, and the maximum ion injection time was 100 ms. The ion with m/z 91.0038, corresponding to the formic acid dimer [2M-H]-, was used as the lock mass. The mass tolerance was 2 ppm. The MS data were processed using Xcalibur software (Thermo Scientific). Analytical grade SCFAs were used as standards (Sigma-Aldrich, Milan, Italy). Five-point external calibration curves were adopted to quantify pyruvic, lactic, succinic, acetic, propionic, butyric, isobutyric, valeric and isovaleric acid in fecal samples. SCFA concentrations were expressed in millimoles per 100 grams of wet feces.
Flow cytometry
Peripheral blood was sampled in heparin and red blood cells were lysed. Samples were stained with anti-CD45.2, CD3, Ly6C, Ly6G and CD11b antibodies. On the CD45+ CD3- population, neutrophils were defined as Ly6G+CD11b+ and inflammatory monocytes as Ly6Chi CD11b+. Small intestinal and colonic lamina propria (LP) lymphocytes were isolated incubating intestinal chunks PBS 5% FCS 1.5 mM EDTA 1mM DTT at 37°C for 15 min to remove epithelial cells. LP cells were mechanically isolated in RPMI 5% FCS with GentleMACS dissociator. The cells were permeabilized with FoxP3 intracellular staining kit (eBioscience) and stained with anti-CD45.2, CD3, CD4, CD25, FoxP3 and Helios antibodies. For Th1 and Th17 detection LP cells were incubated for 4h with PMA (50 ng/ml, Sigma Aldrich), ionomycin (500 ng/ml, Sigma Aldrich) and GolgiStop (BD Biosciences). Cells were then stained with anti-CD45.2, CD3, CD4, IL17 PE and IFNγ antibodies. For mononuclear phagocytes identification LP cells were stained with anti-CD45.2, CD11, F4/80, CD11c, Ly6G, and Ly6C antibodies. Dead cells were excluded with the Fixable Viability Stain510 (BD Biosciences). Samples were acquired at FACSCantoII and Fortessa (BD Biosciences) and analyzed with FlowJo (Treestar). See Supplementary Information Table 3 for detailed informations.
Western blotting
For western blot analysis cells and tissue samples were lysed with RIPA buffer (50mM Tris-HCl pH 8, 150 mM NaCl, 1mM EDTA, 1% Triton, 1% sodium deoxycholate, 0,1% SDS) supplemented with protease inhibitors (cOmplete Mini, EDTA-free, Roche) and tyrosine protein phosphatases, acid and alkaline-phosphatases inhibitors (Phosphatase Inhibitor Cocktail 2, Sigma-Aldrich) 48h after stimulation and lysates were sonicated. Cell lysates were freshly prepared, measured using Bradford assay (Bio-Rad) and equal amounts of proteins were run on SDS–PAGE and followed by western blotting. After 30 min at room temperature in blocking solution—5% milk or 5% bovine serum albumin (BSA) in tris-buffered saline and Tween-20 (TBST) (10 mM Tris, pH 7.5, 150 mM NaCl, 0.1% (v/v) Tween-20)—membranes were probed with primary antibodies in 5% milk (or 5% BSA) in TBST overnight at 4 °C, washed in TBST and incubated for 1 h at room temperature with secondary antibodies goat anti-rabbit-HRP (1:10,000, 170-6515, Bio-Rad), goat anti-mouse-HRP (1:10,000, 170-6516, Bio-Rad) or rabbit anti-goat-HRP (1:2000, P0449, DAKO). The following primary antibodies were used: anti-PP2B-A (1:1000, clone H-209, sc-9070, Santa Cruz Biotechnology), anti-NFATc3 (1:1000, polyclonal (M-75) sc-8321, monoclonal (F-1) sc-8405, Santa Cruz Biotechnology), anti-Histone H3 acetyl K27 (1:1000, ab4729, abcam), anti-Histone H3 (1:1000, ab1791, abcam), anti-actin (1:1000, A4700, Sigma), anti-Muc1 (1:200, clone F-19, sc-6826, Santa Cruz Biotechnology); anti-Muc13 (1:1000, ab124654, abcam); anti-Muc20 (1:1000, PA5-50238, Thermofisher). Visualization was carried out with chemiluminesence (Clarity Western ECL substrate, Bio-Rad; or ECL, Amersham). Densitometric quantification was performed using Fiji software.
Immunohistochemistry
Formalin-fixed paraffin embedded sections were deparaffinised and rehydrated through alcohol series. Antigen unmasking was performed in 1 mM EDTA pH 8 for 50 minutes at 95°C. Endogenous peroxidases were quenched with 3% H2O2 (SZBF1960V, Sigma). Human slides were incubated with anti-Ki67 antibody (1:200, ab15580, abcam) or anti-NFATc3 polyclonal (1:200, sc-8321, Santa Cruz Biotechnology), whereas mouse slides were incubated with anti-NFATc3 monoclonal (1:200, sc-8405, Santa Cruz Biotechnology, unmasking in EDTA pH8 for 40 minutes at 98 °C) for 2 hours at room temperature. For acetylation visualization antigen unmasking was performed in 10 mM sodium citrate, 0.05% Tween 20, pH 6.0 for 20 minutes at 95°C. After peroxidase quenching slides were incubated 1 hour with anti-Histone H3 acetyl K27 (1:500 for human and 1:800 for mouse tissues ab4729, abcam). After washing slides were incubated with Envision System HRP Rabbit (K4003, DAKO) and developed with DAB solution (K3468, DAKO). Slides were counterstained with hematoxylin and mounted. The DAB+ signal was quantified with Fiji software with ImmunoRatio plugin64.
Ex-vivo stimulation of human colonic mucosa
Colonic human specimens were obtained from patients diagnosed with colon cancer and undergoing surgery at IEO upon informed consent, according to ICH-GCP. The protocol was approved by the IEO’s ethical committee. Ex-vivo organ cultures were performed on colonic tumor mucosa specimens, according to Tsilingiri et al.27. Briefly tumor specimens were cut into pieces of about 0.5 cm2 and placed on sterile metal grids, in a center-well organ culture plate containing 1 ml of medium (DMEM supplemented with 2mM Glutamine, 15% FBS-Na, 1% ITS-X and 200 ng/ml EGF). Tissues were incubated in 100% O2 atmosphere in the pressure of 1 Atm, inside an airtight container at 37°C, overnight. Colonic tissues were either fixed in 4% paraformaldehyde and processed for histological and IHC analyses or snap-frozen for protein extraction.
To evaluate the effect of SCFAs on human colon tumors and controls, medium was supplemented with 200mM sodium acetate (S5636, Sigma-Aldrich), 100mM sodium propionate (P5436, Sigma Aldrich) and 100mM sodium butyrate (ARK2161, Sigma-Aldrich) at a ratio similar to that found in fecal content of F. PB1 treated mice (acetate:propionate:butyrate 2:1:1). To evaluate the effect of F. PB1 or H. biformis-produced SCFAs, fermented EG broth (SUP) was added to the medium at a concentration of 40%; as control, non-fermented EG broth (Veh) was used. Tumor tissues were either processed for immunohistochemistry, or lysed, and H3 acetylation and NFATc3 levels analyzed.
Statistical analysis
Data were analyzed for normal distribution before any statistical analyses. Data analyses were carried out using GraphPad Prism version 6.01b. Values are presented as means ± standard error mean (s.e.m.) or ± standard deviation (s.d.), individual values as scatter plots with column bar graphs or as box plots showing the interquartile range, median value and whiskers min to max. Outliers were detected with the Grubbs’ test and excluded from the analysis. The statistical significance between two groups was determined with two-tailed unpaired Student’s t test, multiple t-tests corrected for multiple comparisons using the Holm-Sidak method, Mann-Whitney test or Wilcoxon Rank-Sum test, whereas the comparison of multiple groups was carried out by Kruskal-Wallis test followed by Dunn test, by one-way or two-way ANOVA, followed by Bonferroni’s or Tukey’s post-test. The Benjamini and Hochberg procedure was used to adjust P values for multiple testing. Data display normal variance. A probability value of *P < 0.05 was considered to be significant. All statistics and reproducibility information are reported in the figure legends. Sample size was chosen taking in consideration the means of the target values between the experimental group and the control group, the standard error and the statistical analysis used. For animal studies, sample size was defined on the basis of past experience with the models. For ethical reasons the minimum number of animals necessary to achieve the scientific objectives was used. Animals were allocated randomly to each treatment group. Different treatment groups were processed identically and animals in different treatment groups were exposed to the same environment. In IHC and IF analyses, the investigators were unaware of the experimental groups.
Extended Data
Extended Data Fig. 1. Fecal microbiota diversity upon tumor progression in ApcMin/+ mice.
a, Chao1 and Simpson indexes of the fecal microbiota of WT and ApcMin/+ mice; n = 8 mice/group. Box plots show the interquartile range, median value and whiskers min to max. Data from two independent experiments. b, Tumor multiplicity in the small intestine of ApcMin/+ mice assessed at different time points; wks 6, 28 n = 5; wks 8, 26 n = 8; wks 10 n = 9; wks 12, 16, 24 n = 3; wks 14 n = 7; wks 18 n = 10; wks 20 n = 33; wks 22, 30 n = 4 mice/group. c, Normalized read counts for differentially represented species in WT and ApcMin/+ mice shown as heatmaps. The counts were log transformed and used to define the color gradient of the heatmap; n = 8 mice/group. Data from two independent experiments. a-c, Data are represented as means ± s.e.m..
Extended Data Fig. 2. Mucin production is altered in the ileum of ApcMin/+ mice.
a, Representative Western blots of two independent experiments with consistent results showing the abundance of Muc1, Muc13 and Muc20 in ileal extracts from WT (healthy tissues, H) and healthy (H) and tumor (T) tissues of ApcMin/+ mice analyzed at 11 weeks of age; Right: densitometric quantification (WT n = 3; ApcMin/+ n = 4 biologically independent samples). b, Representative confocal images of WT and ApcMin/+ mice ileum intestinal tissues stained with Muc1 (red) and DAPI (blue); scale bars, 50 μm. Mean fluorescence intensity of MUC1 was measured to quantify the expression of the protein in the intestinal of ApcMin/+ and WT mice (WT n = 7, ApcMin/+ n = 5 biologically independent samples). c, ApcMin/+ mice were treated with vehicle (n = 10 mice/group) or F. PB1 (n = 11 mice/group) from week 8 to 10. Number of microscopic lesions, shown as % relative to vehicle, was evaluated on H&E slides by an expert pathologist. a-c, Data from two independent experiments and represented as means ± s.e.m.. P values were determined by one-way ANOVA using Tukey post-test (a), two tailed unpaired Mann Whitney test (b), or two-tailed unpaired t-test (c).
Extended Data Fig. 3. F. PB1 does not have a major impact on immune cells.
a-c, Flow cytometry analyses of the small intestinal and colonic lamina propria of germ-free ICR mice monocolonized with F. PB1 (GF + F. PB1 n = 10 mice/group) for the presence of T reg (a), Th17 (b) and Th1 (c) cells. Germ-free (GF, n = 9 mice/group) and SPF (n = 7 mice/group) mice were used as controls. d-g WT and ApcMin/+ mice treated with vehicle (Veh) or F. PB1 from week 8 to 12. d,e, Flow cytometric analysis of T reg, Th1 and Th17 cell populations in the small intestinal lamina propria. FoxP3+CD25+ are gated on the live CD45+ CD3+ CD4+ cells; Helios+ is gated on the FoxP3+ CD25+ cells (WT Veh, ApcMin/+ F. PB1 n = 12; WT F. PB1 n = 14; ApcMin/+ Veh n = 11 mice/group). IL17+, IFNγ+ and IL17+ IFNγ+ cells are gated on the live CD45+ CD3+ CD4+ cells (WT Veh, ApcMin/+ Veh n = 9; WT F. PB1 n = 11; ApcMin/+ F. PB1 n = 10 mice/group). Data shown as % of CD45+ cells (d) or as absolute number / whole tissue (e). f,g, Flow cytometric analysis of mononuclear phagocytes (CD11b+F4/80+ macrophages, CD11c+CD11b+ dendritic cells and Ly6ChiCD11b+ inflammatory monocytes) and neutrophils (Ly6G+CD11b+) in the small intestinal lamina propria (WT Veh n = 5; WT F. PB1, ApcMin/+ F. PB1 n = 6; ApcMin/+ Veh n = 4). Data shown as percentages relative to the CD45+ CD3- population (f) or as absolute number / whole tissue (g). h, Flow cytometric analysis of peripheral blood cells. Data shown as absolute number / ml blood (WT Veh, ApcMin/+ F. PB1 n = 13; WT F. PB1 n = 15; ApcMin/+ Veh n = 12 mice/group) P values were determined by one-way ANOVA with Bonferroni post-test (a-d), Kruskal-Wallis with Dunn post test (e), two-tailed unpaired Mann-Whitney test (f,g,h Ly6G+CD11b+) or two-tailed unpaired t-test (h, Ly6ChiCD11b+). a-h, Data are represented as means ± s.e.m..
Extended Data Fig. 4. F. PB1 administration alters microbiota and its metabolic profile.
a, LEfSe comparison results between the microbiota of Vehicle and F. PB1 treated mice at 12 weeks with the highest linear discriminant analysis LDA score (log10 ≥ 2.0); Veh, n = 8; F. PB1 n = 14 mice/group. b, Fecal concentrations of succinate, isovalerate and valerate in WT and ApcMin/+ mice treated with vehicle (Veh) or F. PB1 as detected by UPLC-MS; WT Veh, WT F. PB1 n = 6; ApcMin/+ Veh n = 11; ApcMin/+ F. PB1 n = 10 mice/group. Data from two independent experiments and represented as means ± s.e.m.. P values were determined by two-way ANOVA with Bonferroni post-test.
Extended Data Fig. 5. SCFAs and F. PB1 spent medium (SUP) increase histone H3 acetylation and reduce NFATc3-calcineurin pathway in vitro on mouse intestinal tumor cell lines.
a, Representative WB showing H3K27 acetylation, PP2B-A and NFATc3 in cell lines treated (+) or not (-) with a mix of SCFAs. Three independent experiments were performed with consistent results. b, Densitometric quantification of WB in Fig. 4D showing NFATc3 and PP2B-A (normalized to actin) and H3K27 acetylation (normalized to vinculin). Two or three independent experiments were performed with consistent results (n = 2 or n = 3 biologically independent experiments). Data are represented as means ± s.e.m. and P values were determined by two-tailed unpaired t-test. c, Densitometric quantification of WB in Fig. 4E showing NFATc3 (normalized to vinculin) and H3K27 acetylation (normalized to H3 tot). To calculate the protein expression induced by SUP evap as a percentage, the densitometric value of SUP was assumed to be 100%. Data from two independent WB (n = 2 biologically independent experiments).
Extended Data Fig. 6. Effect of F. PB1 spent medium (SUP) in tumorigenesis.
a-c, Representative histologies from ileal and colon sections of ApcMin/+mice (a,Veh n = 13; SUP n =11 mice/group; b,Veh n = 6; SUP n =7 mice/group) and AOM/DSS treated WT mice (c,Veh n = 5; SUP n = 6 mice/group) treated with vehicle or F. PB1 SUP. Sections stained for H&E from FFPE blocks of swiss roll of small (a, 5X magnification, scale bars 500 μm; b, 3X magnification, scale bars 750 μm) and large (c, 2X magnification, scale bars 900 μm) bowel and treated as indicated by labels. Slides were scanned by Aperio Scanscope and digital images were obtained. Dysplastic lesions were selected and measured. In the lower right high power insert, a detail of dysplastic glands (200X magnification, blue scale bars 100 μm).
Extended Data Fig. 7. L. lactis does not colonize the mouse gut but its spent medium (SUP) has anti-tumorigenic effect in vivo.
a, Quantification of SCFAs in SUP of F. PB1 and L. lactis by UPLC-MS. Data from 2 or 6 independent experiments (L. lactis SUP n = 2; F. PB1 SUP n = 6 biologically independent experiments). b,c, ApcMin/+ mice received vehicle (Veh, n = 7 mice/group), F. PB1 or L. lactis (n = 8 mice/group) from week 8 to 10. b,Tumor multiplicity in the small intestine normalized to vehicle treated ApcMin/+ mice. c, Area and maximum diameter (axis length) of ileal dysplastic lesions normalized to the total number of lesions per mouse. Box plots show the interquartile range, median value and whiskers min to max. d, qPCR of L. lactis abundance normalized to panbacterial primers targeting the 16S rRNA gene (UNI 16S) in bacterial DNA extracted from feces (both at time 0 and 48h after last gavage) and mucus from the ileum and colon of WT and ApcMin/+ mice pretreated or not with antibiotics (ABX) and then monocolonized with L. lactis (n = 4 mice/group). e,f, 11 weeks old ApcMin/+ mice treated with broths not fermented (Veh) or fermented by L. lactis (SUP) in the presence of ABX (n = 6 mice/group). e, Tumor multiplicity in the small intestine normalized to vehicle treated ApcMin/+ mice. f, Area and maximum diameter of ileal dysplastic lesions normalized to the total number lesions per mouse. Box plots show the interquartile range, median value and whiskers min to max. g, Cell proliferation assay on mouse CRC cell lines treated or not with sodium lactate at different concentrations for 48h. t0 is the signal from cells at the time of stimulation. Two independent experiments were performed with consistent results. Data presented as means ± s.d. of a representative experiment (n = 6 biologically independent samples). P values were determined by two-tailed unpaired Mann-Whitney test (e,f), one-way ANOVA with Bonferroni post-test (b,g) or Kruskal-Wallis test with Dunn post-test (c,d). Data are presented as means ± s.e.m. in a-f.
Extended Data Fig. 8. H. biformis does not colonize the mouse gut but its spent medium (SUP) increases histone H3 acetylation, reduces NFATc3 activation and proliferation in vitro on human colorectal cancer cell lines.
a, Cell proliferation assay on human CRC cell lines treated or not (NT) with broth fermented by F. PB1 (F. PB1 SUP) or by H. biformis (H. biformis SUP) and with a mix of SCFAs as a control. t0 is the signal from cells at the time of stimulation. Two independent experiments were performed with consistent results. Data are presented as means ± s.d. of a representative experiment (n = 6 biologically independent samples). b, Densitometric quantification of WB in Fig. 6e showing NFATc3 and H3K27 acetylation (normalized to vinculin). Two or three independent experiments were performed with consistent results (n = 2 or n = 3 biologically independent experiments). c-e, ApcMin/+ mice received vehicle (Veh) or H. biformis from week 8 to 10 (n = 5 mice/group). c, Tumor multiplicity in the small intestine normalized to vehicle treated ApcMin/+ mice. d, Area and maximum diameter (axis length) of ileal dysplastic lesions normalized to the total number of lesions per mouse. Box plots show the interquartile range, median value and whiskers min to max. e, qPCR of H. biformis abundance normalized to panbacterial primers targeting the 16S rRNA gene (UNI 16S) in bacterial DNA extracted from feces and mucus from the ileum. P values were determined by one-way ANOVA using Bonferroni (a) or Tukey (b, NFATc3 HT29 and H3K27 Caco2) post-test, by two-tailed unpaired t-test (b, H3K27 HT29) or by two-tailed Mann-Whitney test (c-e). Data are represented as means ± s.e.m. in b-e.
Extended Data Fig. 9. Treatments with SCFAs or F. PB1 spent medium (SUP) increase histone H3 acetylation, reduce NFATc3 activation and proliferation in human CRC samples.
a-c, Human colon tumor samples (hCRC) incubated ex-vivo with broth fermented with F. PB1 (SUP) or non-fermented (Veh); with medium alone (NT) or with SCFAs MIX. a, Representative immunohistochemistry of one out of three independent experiments of H3K27 acetylation and NFATc3 expression. Scale bars, 50 μm. b,c, Representative images of ileal dysplastic lesions stained with Ki67. Scale bars, 50 μm. Three independent experiments were performed with consistent results. Dot plots show the percentage of Ki67 positive cells relative to vehicle (b) or to NT (c). Data from three independent experiments (b, n = 7; c, n = 5 biologically independent samples), are represented as means ± s.e.m. and P values were determined by two-tailed unpaired Mann-Whitney test.
Extended Data Fig. 10. Model.
Upon intestinal tumorigenesis selectively some bacterial species do not expand, due to different mucus composition or to competition with other bacteria and their corresponding metabolites. If these bacterial species are reintroduced, they induce the release of SCFAs. F. PB1 or H. biformis metabolic products act as HDAC inhibitors in the adenomas inducing an increase in acetylation and downmodulation of the calcineurin-NFATc3 pathway, which is involved in cell proliferation.
Supplementary Material
Acknowledgements
We thank Mattia Bugatti and Sara Licini (supported by Fondazione Beretta, Brescia, Italy) for technical support in histological analysis; Andrew Thomas and Edoardo Pasolli for performing bioinformatics analyses; Cristina Faccani for technical support in in vitro experiments; Erika Mileti, Claudia Burrello and Maria Rita Giuffré for technical support in in vivo experiments. Funding: this work has been supported by grants of the Italian Association for Cancer Research (AIRC IG 17628) and the European Research council (No. 615735 - homeogut ERC) to M.R.. E.Z., I.S. and A.B. were/are recipient of a FIRC fellowship. T.S. is recipient of a fellowship from Fondazione Veronesi. G.F. is recipient of a grant of the Italian Ministry of Health (GR-2013-02359806).
Footnotes
Reporting summary. Further information on experimental design is available in the Nature Research Reporting Summary linked to this paper.
Data Availability
Source Data for the figures and Extended Data figures are provided in the online version of the paper. Raw sequencing data and metadata associated to samples are available online at https://www.ncbi.nlm.nih.gov/bioproject/PRJNA564752. Accession number: PRJNA564752.
Authors Contributions
E.Z. and C.P. ideated, performed and analysed all the experiments; T.S. and F.S. helped in the execution of experiments; A.B., I.S. and Sil.G. helped in the execution of the mouse experiments; B.F., M.M. and Gr.P. performed 16s rRNA metagenomic analysis; L.M. and W.V. designed and carried out histological analyses. G.N. performed ex-vivo stimulation of human colonic mucosa experiments; A.B. performed confocal analyses; J.T. executed metabolomic analyses; B.O. helped in the execution of in vitro experiments; K.A. and K.H. isolated F.PB1 and carried out GF experiments; S.A. and S.G. set up F. PB1 growth and supernatant production; S.C. set up H. biformis and L. lactis growth and supernatant production; G.F. performed FACS analyses; F.A. and N.S. performed phylogenetic analysis and human CRC dataset interrogation; G.P. participated with ideas and results interpretation; M.R. ideated the study, coordinated the work, and wrote the manuscript.
Declaration of Interests
The authors declare no competing interests.
References
- 1.Sears CL, Garrett WS. Microbes, microbiota, and colon cancer. Cell host & microbe. 2014;15:317–328. doi: 10.1016/j.chom.2014.02.007. [DOI] [PMC free article] [PubMed] [Google Scholar]
- 2.Kostic AD, et al. Genomic analysis identifies association of Fusobacterium with colorectal carcinoma. Genome research. 2012;22:292–298. doi: 10.1101/gr.126573.111. [DOI] [PMC free article] [PubMed] [Google Scholar]
- 3.Mima K, et al. Fusobacterium nucleatum in Colorectal Carcinoma Tissue According to Tumor Location. Clin Transl Gastroenterol. 2016;7:e200. doi: 10.1038/ctg.2016.53. [DOI] [PMC free article] [PubMed] [Google Scholar]
- 4.Yu T, et al. Fusobacterium nucleatum Promotes Chemoresistance to Colorectal Cancer by Modulating Autophagy. Cell. 2017;170:548–563 e516. doi: 10.1016/j.cell.2017.07.008. [DOI] [PMC free article] [PubMed] [Google Scholar]
- 5.Kinzler KW, Vogelstein B. Lessons from hereditary colorectal cancer. Cell. 1996;87:159–170. doi: 10.1016/s0092-8674(00)81333-1. [DOI] [PubMed] [Google Scholar]
- 6.Li Y, et al. Gut microbiota accelerate tumor growth via c-jun and STAT3 phosphorylation in APCMin/+ mice. Carcinogenesis. 2012;33:1231–1238. doi: 10.1093/carcin/bgs137. bgs137 [pii] [DOI] [PubMed] [Google Scholar]
- 7.Kostic AD, et al. Fusobacterium nucleatum potentiates intestinal tumorigenesis and modulates the tumor-immune microenvironment. Cell Host Microbe. 2013;14:207–215. doi: 10.1016/j.chom.2013.07.007. [DOI] [PMC free article] [PubMed] [Google Scholar]
- 8.Wu S, et al. A human colonic commensal promotes colon tumorigenesis via activation of T helper type 17 T cell responses. Nat Med. 2009;15:1016–1022. doi: 10.1038/nm.2015. [DOI] [PMC free article] [PubMed] [Google Scholar]
- 9.Arthur JC, et al. Intestinal inflammation targets cancer-inducing activity of the microbiota. Science. 2012;338:120–123. doi: 10.1126/science.1224820. [DOI] [PMC free article] [PubMed] [Google Scholar]
- 10.Zhan Y, et al. Gut microbiota protects against gastrointestinal tumorigenesis caused by epithelial injury. Cancer Res. 2013;73:7199–7210. doi: 10.1158/0008-5472.CAN-13-0827. [DOI] [PMC free article] [PubMed] [Google Scholar]
- 11.Wong SH, et al. Gavage of Fecal Samples From Patients With Colorectal Cancer Promotes Intestinal Carcinogenesis in Germ-Free and Conventional Mice. Gastroenterology. 2017;153:1621–1633 e1626. doi: 10.1053/j.gastro.2017.08.022. [DOI] [PubMed] [Google Scholar]
- 12.Donohoe DR, et al. A gnotobiotic mouse model demonstrates that dietary fiber protects against colorectal tumorigenesis in a microbiota- and butyrate-dependent manner. Cancer Discov. 2014;4:1387–1397. doi: 10.1158/2159-8290.CD-14-0501. [DOI] [PMC free article] [PubMed] [Google Scholar]
- 13.Chang DH, et al. Faecalibaculum rodentium gen. nov., sp. nov., isolated from the faeces of a laboratory mouse. Antonie Van Leeuwenhoek. 2015;108:1309–1318. doi: 10.1007/s10482-015-0583-3. [DOI] [PubMed] [Google Scholar]
- 14.Johansson ME, et al. The inner of the two Muc2 mucin-dependent mucus layers in colon is devoid of bacteria. Proc Natl Acad Sci U S A. 2008;105:15064–15069. doi: 10.1073/pnas.0803124105. 0803124105 [pii] [DOI] [PMC free article] [PubMed] [Google Scholar]
- 15.Xiao X, et al. Role of MUC20 overexpression as a predictor of recurrence and poor outcome in colorectal cancer. Journal of translational medicine. 2013;11:151. doi: 10.1186/1479-5876-11-151. [DOI] [PMC free article] [PubMed] [Google Scholar]
- 16.Betge J, et al. MUC1, MUC2, MUC5AC, and MUC6 in colorectal cancer: expression profiles and clinical significance. Virchows Arch. 2016;469:255–265. doi: 10.1007/s00428-016-1970-5. [DOI] [PMC free article] [PubMed] [Google Scholar]
- 17.Guglietta S, et al. Coagulation induced by C3aR-dependent NETosis drives protumorigenic neutrophils during small intestinal tumorigenesis. Nat Commun. 2016;7 doi: 10.1038/ncomms11037. 11037. [DOI] [PMC free article] [PubMed] [Google Scholar]
- 18.Sakamoto M, Tanaka Y, Benno Y, Ohkuma M. Butyricimonas faecihominis sp. nov. and Butyricimonas paravirosa sp. nov., isolated from human faeces, and emended description of the genus Butyricimonas. Int J Syst Evol Microbiol. 2014;64:2992–2997. doi: 10.1099/ijs.0.065318-0. [DOI] [PubMed] [Google Scholar]
- 19.Singh N, et al. Activation of gpr109a, receptor for niacin and the commensal metabolite butyrate, suppresses colonic inflammation and carcinogenesis. Immunity. 2014;40:128–139. doi: 10.1016/j.immuni.2013.12.007. [DOI] [PMC free article] [PubMed] [Google Scholar]
- 20.Boffa LC, Vidali G, Mann RS, Allfrey VG. Suppression of histone deacetylation in vivo and in vitro by sodium butyrate. J Biol Chem. 1978;253:3364–3366. [PubMed] [Google Scholar]
- 21.Vander Heiden MG, Cantley LC, Thompson CB. Understanding the Warburg effect: the metabolic requirements of cell proliferation. Science. 2009;324:1029–1033. doi: 10.1126/science.1160809. [DOI] [PMC free article] [PubMed] [Google Scholar]
- 22.Donohoe DR, et al. The Warburg effect dictates the mechanism of butyrate-mediated histone acetylation and cell proliferation. Mol Cell. 2012;48:612–626. doi: 10.1016/j.molcel.2012.08.033. [DOI] [PMC free article] [PubMed] [Google Scholar]
- 23.Peuker K, et al. Epithelial calcineurin controls microbiota-dependent intestinal tumor development. Nat Med. 2016;22:506–515. doi: 10.1038/nm.4072. [DOI] [PMC free article] [PubMed] [Google Scholar]
- 24.Imai Y, et al. Histone deacetylase inhibitor panobinostat induces calcineurin degradation in multiple myeloma. JCI Insight. 2016;1 doi: 10.1172/jci.insight.85061. e85061. [DOI] [PMC free article] [PubMed] [Google Scholar]
- 25.Han KJ, Lee NK, Park H, Paik HD. Anticancer and Anti-Inflammatory Activity of Probiotic Lactococcus lactis NK34. J Microbiol Biotechnol. 2015;25:1697–1701. doi: 10.4014/jmb.1503.03033. [DOI] [PubMed] [Google Scholar]
- 26.Zeller G, et al. Potential of fecal microbiota for early-stage detection of colorectal cancer. Mol Syst Biol. 2014;10:766. doi: 10.15252/msb.20145645. [DOI] [PMC free article] [PubMed] [Google Scholar]
- 27.Tsilingiri K, Sonzogni A, Caprioli F, Rescigno M. A novel method for the culture and polarized stimulation of human intestinal mucosa explants. Journal of visualized experiments : JoVE. 2013 doi: 10.3791/4368. [DOI] [PMC free article] [PubMed] [Google Scholar]
- 28.Kesari MV, et al. Immunohistochemical study of MUC1, MUC2 and MUC5AC in colorectal carcinoma and review of literature. Indian J Gastroenterol. 2015;34:63–67. doi: 10.1007/s12664-015-0534-y. [DOI] [PubMed] [Google Scholar]
- 29.Yan X, Liu L, Li H, Qin H, Sun Z. Clinical significance of Fusobacterium nucleatum, epithelial-mesenchymal transition, and cancer stem cell markers in stage III/IV colorectal cancer patients. Onco Targets Ther. 2017;10:5031–5046. doi: 10.2147/OTT.S145949. [DOI] [PMC free article] [PubMed] [Google Scholar]
- 30.Bullman S, et al. Analysis of Fusobacterium persistence and antibiotic response in colorectal cancer. Science. 2017;358:1443–1448. doi: 10.1126/science.aal5240. [DOI] [PMC free article] [PubMed] [Google Scholar]
- 31.Mendes RT, et al. Endothelial Cell Response to Fusobacterium nucleatum. Infect Immun. 2016;84:2141–2148. doi: 10.1128/IAI.01305-15. [DOI] [PMC free article] [PubMed] [Google Scholar]
- 32.Gur C, et al. Binding of the Fap2 protein of Fusobacterium nucleatum to human inhibitory receptor TIGIT protects tumors from immune cell attack. Immunity. 2015;42:344–355. doi: 10.1016/j.immuni.2015.01.010. [DOI] [PMC free article] [PubMed] [Google Scholar]
- 33.Chen Y, et al. Invasive Fusobacterium nucleatum activates beta-catenin signaling in colorectal cancer via a TLR4/P-PAK1 cascade. Oncotarget. 2017;8:31802–31814. doi: 10.18632/oncotarget.15992. [DOI] [PMC free article] [PubMed] [Google Scholar]
- 34.Chung L, et al. Bacteroides fragilis Toxin Coordinates a Pro-carcinogenic Inflammatory Cascade via Targeting of Colonic Epithelial Cells. Cell Host Microbe. 2018 doi: 10.1016/j.chom.2018.01.007. [DOI] [PMC free article] [PubMed] [Google Scholar]
- 35.Dejea CM, et al. Patients with familial adenomatous polyposis harbor colonic biofilms containing tumorigenic bacteria. Science. 2018;359:592–597. doi: 10.1126/science.aah3648. [DOI] [PMC free article] [PubMed] [Google Scholar]
- 36.Yan F, et al. Interleukin-13-induced MUC5AC expression is regulated by a PI3K-NFAT3 pathway in mouse tracheal epithelial cells. Biochem Biophys Res Commun. 2014;446:49–53. doi: 10.1016/j.bbrc.2014.02.051. [DOI] [PubMed] [Google Scholar]
- 37.San-Millan I, Brooks GA. Reexamining cancer metabolism: lactate production for carcinogenesis could be the purpose and explanation of the Warburg Effect. Carcinogenesis. 2017;38:119–133. doi: 10.1093/carcin/bgw127. [DOI] [PMC free article] [PubMed] [Google Scholar]
- 38.Faubert B, et al. Lactate Metabolism in Human Lung Tumors. Cell. 2017;171:358–371 e359. doi: 10.1016/j.cell.2017.09.019. [DOI] [PMC free article] [PubMed] [Google Scholar]
- 39.Duncan SH, Louis P, Flint HJ. Lactate-utilizing bacteria, isolated from human feces, that produce butyrate as a major fermentation product. Appl Environ Microbiol. 2004;70:5810–5817. doi: 10.1128/AEM.70.10.5810-5817.2004. [DOI] [PMC free article] [PubMed] [Google Scholar]
- 40.Donohoe DR, et al. A gnotobiotic mouse model demonstrates that dietary fiber protects against colorectal tumorigenesis in a microbiota- and butyrate-dependent manner. Cancer discovery. 2014;4:1387–1397. doi: 10.1158/2159-8290.CD-14-0501. [DOI] [PMC free article] [PubMed] [Google Scholar]
- 41.Zhernakova A, et al. Population-based metagenomics analysis reveals markers for gut microbiome composition and diversity. Science. 2016;352:565–569. doi: 10.1126/science.aad3369. [DOI] [PMC free article] [PubMed] [Google Scholar]
- 42.De Maesschalck C, et al. Faecalicoccus acidiformans gen. nov., sp. nov., isolated from the chicken caecum, and reclassification of Streptococcus pleomorphus (Barnes et al. 1977), Eubacterium biforme (Eggerth 1935) and Eubacterium cylindroides (Cato et al. 1974) as Faecalicoccus pleomorphus comb. nov., Holdemanella biformis gen. nov., comb. nov. and Faecalitalea cylindroides gen. nov., comb. nov., respectively, within the family Erysipelotrichaceae. Int J Syst Evol Microbiol. 2014;64:3877–3884. doi: 10.1099/ijs.0.064626-0. [DOI] [PubMed] [Google Scholar]
- 43.Atarashi K, et al. Treg induction by a rationally selected mixture of Clostridia strains from the human microbiota. Nature. 2013;500:232–236. doi: 10.1038/nature12331. [DOI] [PubMed] [Google Scholar]
- 44.Moser AR, Pitot HC, Dove WF. A dominant mutation that predisposes to multiple intestinal neoplasia in the mouse. Science. 1990;247:322–324. doi: 10.1126/science.2296722. [DOI] [PubMed] [Google Scholar]
- 45.Furet JP, et al. Comparative assessment of human and farm animal faecal microbiota using real-time quantitative PCR. FEMS Microbiol Ecol. 2009;68:351–362. doi: 10.1111/j.1574-6941.2009.00671.x. [DOI] [PubMed] [Google Scholar]
- 46.Manzari C, et al. Draft genome sequence of Sphingobium sp. strain ba1, resistant to kanamycin and nickel ions. FEMS Microbiol Lett. 2014;361:8–9. doi: 10.1111/1574-6968.12618. [DOI] [PubMed] [Google Scholar]
- 47.Fosso B, et al. BioMaS: a modular pipeline for Bioinformatic analysis of Metagenomic AmpliconS. BMC Bioinformatics. 2015;16:203. doi: 10.1186/s12859-015-0595-z. [DOI] [PMC free article] [PubMed] [Google Scholar]
- 48.Zhang J, Kobert K, Flouri T, Stamatakis A. PEAR: a fast and accurate Illumina Paired-End reAd mergeR. Bioinformatics. 2014;30:614–620. doi: 10.1093/bioinformatics/btt593. [DOI] [PMC free article] [PubMed] [Google Scholar]
- 49.Edgar RC. Search and clustering orders of magnitude faster than BLAST. Bioinformatics. 2010;26:2460–2461. doi: 10.1093/bioinformatics/btq461. [DOI] [PubMed] [Google Scholar]
- 50.Cole JR, et al. The Ribosomal Database Project: improved alignments and new tools for rRNA analysis. Nucleic Acids Res. 2009;37:D141–145. doi: 10.1093/nar/gkn879. [DOI] [PMC free article] [PubMed] [Google Scholar]
- 51.Langmead B, Salzberg SL. Fast gapped-read alignment with Bowtie 2. Nat Methods. 2012;9:357–359. doi: 10.1038/nmeth.1923. [DOI] [PMC free article] [PubMed] [Google Scholar]
- 52.Alonso-Alemany D, et al. Further steps in TANGO: improved taxonomic assignment in metagenomics. Bioinformatics. 2014;30:17–23. doi: 10.1093/bioinformatics/btt256. [DOI] [PubMed] [Google Scholar]
- 53.Love MI, Huber W, Anders S. Moderated estimation of fold change and dispersion for RNA-seq data with DESeq2. Genome Biol. 2014;15:550. doi: 10.1186/s13059-014-0550-8. [DOI] [PMC free article] [PubMed] [Google Scholar]
- 54.Segata N, et al. Metagenomic biomarker discovery and explanation. Genome Biol. 2011;12:R60. doi: 10.1186/gb-2011-12-6-r60. [DOI] [PMC free article] [PubMed] [Google Scholar]
- 55.Salzman NH, et al. Enteric salmonella infection inhibits Paneth cell antimicrobial peptide expression. Infect Immun. 2003;71:1109–1115. doi: 10.1128/IAI.71.3.1109-1115.2003. [DOI] [PMC free article] [PubMed] [Google Scholar]
- 56.Oksanen J, et al. vegan: community ecology package. R package vegan, vers. 2.2-1. 2015 [Google Scholar]
- 57.Wickham H. Ggplot2: Elegant Graphics for Data Analysis. Springer; New York: 2009. p. 213. VIII. [Google Scholar]
- 58.Cooper HS, Murthy SN, Shah RS, Sedergran DJ. Clinicopathologic study of dextran sulfate sodium experimental murine colitis. Lab Invest. 1993;69:238–249. [PubMed] [Google Scholar]
- 59.Boivin GP, et al. Pathology of mouse models of intestinal cancer: consensus report and recommendations. Gastroenterology. 2003;124:762–777. doi: 10.1053/gast.2003.50094. [DOI] [PubMed] [Google Scholar]
- 60.Truong DT, et al. MetaPhlAn2 for enhanced metagenomic taxonomic profiling. Nat Methods. 2015;12:902–903. doi: 10.1038/nmeth.3589. [DOI] [PubMed] [Google Scholar]
- 61.Pasolli E, et al. Accessible, curated metagenomic data through ExperimentHub. Nat Methods. 2017;14:1023–1024. doi: 10.1038/nmeth.4468. [DOI] [PMC free article] [PubMed] [Google Scholar]
- 62.Segata N, Bornigen D, Morgan XC, Huttenhower C. PhyloPhlAn is a new method for improved phylogenetic and taxonomic placement of microbes. Nat Commun. 2013;4 doi: 10.1038/ncomms3304. 2304. [DOI] [PMC free article] [PubMed] [Google Scholar]
- 63.Gargari G, et al. Consumption of a Bifidobacterium bifidum Strain for 4 Weeks Modulates Dominant Intestinal Bacterial Taxa and Fecal Butyrate in Healthy Adults. Appl Environ Microbiol. 2016;82:5850–5859. doi: 10.1128/AEM.01753-16. [DOI] [PMC free article] [PubMed] [Google Scholar]
- 64.Tuominen VJ, Ruotoistenmaki S, Viitanen A, Jumppanen M, Isola J. ImmunoRatio: a publicly available web application for quantitative image analysis of estrogen receptor (ER), progesterone receptor (PR), and Ki-67. Breast Cancer Res. 2010;12:R56. doi: 10.1186/bcr2615. [DOI] [PMC free article] [PubMed] [Google Scholar]
Associated Data
This section collects any data citations, data availability statements, or supplementary materials included in this article.


