

SUMMARY
Latently infected T cells able to reinitiate viral propagation throughout the body remain a major barrier to curing HIV. Distinguishing between latently infected cells and uninfected cells will advance efforts for viral eradication. HIV decision-making between latency and active replication is stochastic, and drug cocktails that increase bursts of viral gene expression enhance reactivation from latency. Here, we show that a larger host-cell size provides a natural cellular mechanism for enhancing burst size of viral expression and is necessary to destabilize the latent state and bias viral decision-making. Latently infected Jurkat and primary CD4+ T cells reactivate exclusively in larger activated cells, while smaller cells remain silent. In addition, reactivation is cell-cycle dependent and can be modulated with cell-cycle-arresting compounds. Cell size and cell-cycle dependent decision-making of viral circuits may guide stochastic design strategies and applications in synthetic biology and may provide important determinants to advance diagnostics and therapies.
In Brief
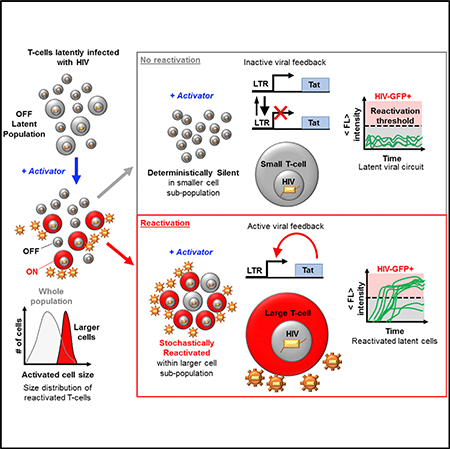
Bohn-Wippert et al. investigate reactivation of T cells latently infected with HIV. They discover that only larger cells exit latency, while smaller cells remain silent. Viral expression bursts are cell size and cell-cycle dependent, presenting dynamic cell states, capable of active control, as sources of viral fate determination.
Graphical Abstract
INTRODUCTION
One major obstacle to curing the global HIV epidemic is the reservoir of latently infected resting CD4+ T cells (Chun et al., 1997; Finzi et al., 1997; Richman et al., 2009). Under antiretroviral therapy (ART), HIV viral load is undetectable in the plasma of infected individuals. Upon removal of ART, the viral load rapidly rebounds back to pretreatment levels of viremia due to reactivation of the latent reservoir (Davey et al., 1999). Reactivation from latency involves production and spread of virions to target-rich lymph node niches unprotected by ART (Stellbrink et al., 2002).
Researchers have worked extensively on the mechanisms and regulation of latency (Richman et al., 2009; Ruelas and Greene, 2013) and on drug treatments to both reactivate and remove cells harboring latent provirus (i.e., the shock-and-kill strategy) (Dar et al., 2014; Deeks, 2012; Spina et al., 2013). Strategies to reactivate the latent reservoir are plagued by severe challenges, including (1) incomplete reactivation of non-inducible provirus (Ho et al., 2013), (2) uncertainty regarding clearance or death of cells after latent reversal (Deng et al., 2015; Shan et al., 2012), and (3) coupling of migration and reactivation of latently infected T cells, causing additional viral spread in cell niches (Bohn-Wippert et al., 2017; Murooka et al., 2012). Recent efforts have used an alternative block-and-lock strategy toward silencing latency into a chronically inactive state (Besnard et al., 2016; Dar et al., 2014; Kessing et al., 2017). Another approach, direct removal of the latent reservoir, is challenged by our inability to identify latent cells at low expression levels. To address this, researchers have pursued identification of novel biomarkers for viral persistence (Fromentin et al., 2016; Hurst et al., 2015).
Gene expression fluctuations play an important role in determining when a virus shifts between latency and activation (Weinberger et al., 2005, 2008). Studies of gene expression bursts at levels of transcription and translation in human fibroblasts, and cell-free gene expression systems reveal a correlation between gene expression bursts and cell reaction volume (Caveney et al., 2017; Padovan-Merhar et al., 2015). Here, a burst is defined as the number of mRNA produced per transcriptional activity pulse of the promoter during episodic transcription (transcriptional burst) or the number of proteins produced per mRNA lifetime (translational burst). Both transcriptional and translational bursts contribute to total gene expression bursts (Dar et al., 2015; Kepler and Elston, 2001; Ozbudak et al., 2002). The authors show that fluorescence measured by the abundance of GFP increases with the size of a cell-free gene expression reactor, similar to increases of mRNA levels of genes in larger human fibroblasts (Figure S1) (Caveney et al., 2017; Padovan-Merhar et al., 2015). Observed increases are described by increased burst size, not by increased burst frequency (the transition rate of an inactive promoter into active transcribing state kon), both of which can increase abundance levels (Dar et al., 2012; Kepler and Elston, 2001; Megaridis et al., 2018; Simpson et al., 2004; Singh et al., 2010). In addition, burst frequency (kon or F) has been shown to depend on cell cycle and decreases after DNA replication in the late G2 phase (Padovan-Merhar et al., 2015; Skinner et al., 2016). Additional studies have investigated the coupling of gene expression noise to growth rate and cell cycle of yeast (Keren et al., 2015).
Previous studies have shown that cell size influences other cell functions. A preexisting intracellular variation dependent on the volume of Escherichia coli cells has been shown to bias lambda phage developmental fate before infection (St-Pierre and Endy, 2008). Additional studies reveal that the lysis-lysogeny decision of bacteriophage λ depends on both bacterial host-cell size and MOI (Cortes et al., 2017; Zeng et al., 2010). The postinfection decision of the phage is initially made at the single-virus level with additional infections contributing to an integrated decision between lysis and lysogeny of the targeted cell (Zeng et al., 2010). The probability of entering the lysogeny state has also been shown to be inversely proportional to phage infection times (Cortes et al., 2017).
Despite the low MOI of latently infected T cells, these examples of viral-host decision-making suggest the possibility of similar determinants existing in the reactivation-latency decision of latently integrated HIV in single human T cells. Here we show that cell size and cell cycle are involved in single-cell decision-making of HIV-infected T cells. Along with consistent burst size dependence on cell size for various housekeeping promoters (Figure S1), this suggests a general role in endogenous genetic systems.
RESULTS
Model of Cell Size-Based Initiation of HIV Feedback and Reactivation from Latency
To investigate whether HIV’s shift from prolonged latency to reactivation could depend on cell size, we implemented a computational model consisting of the HIV long terminal repeat (LTR) promoter driving the expression of the HIV transactivator of transcription (Tat) (Figure 1A). Activation of LTR transcription by Tat is a potent positive feedback loop required to exit the latent state (Weinberger et al., 2005, 2008). The model consists of a 2-state episodic LTR promoter that is primarily in the inactive or non-transcribing state (koff >> kon) and underlies expression of Tat autoregulation, regardless of whether it is active (Figure 1A, bottom) or inactive (Figure 1A, top). At low Tat levels (Figure 1A, top), feedback is inactive and viral expression is described by the 2-state switching model with the active LTR state, switched at rate kon, where viral mRNA are transcribed at rate km. This occurs before decay back to an inactive transcribing state at rate koff (Kepler and Elston, 2001; Peccoud and Ycart, 1995; Simpson et al., 2004). At high Tat levels produced by lower koff, LTR bound by Tat transcribes at an elevated transcription rate, initiates feedback, and leads to reactivation from latency. For inactive feedback, the number of mRNA produced per promoter activity pulse (km/koff) in the transcribing state is defined as the transcriptional burst size (or B). Translation occurs at rate kp, and the number of proteins translated per mRNA lifetime (kp/γm) is defined as the translational burst size (or b). Total expression burst size (B × b) is assumed to increase with cell size (Figure 1A, left vertical arrow), and a range of burst sizes is assessed for evidence of increased cell-size-dependent transitions between the inactive to the active feedback state (Figure 1A). This model has been previously used to understand the role of Tat feedback in HIV autonomy from host-cell state (Razooky et al., 2015).
Figure 1. Model for Cell Size-Based Decision-Making in HIV.

(A) (Upper) Simplified 2-state LTR promoter expressing the viral transactivator Tat. The promoter switches between inactive and actively transcribing states. At very low activity levels due to large koff (large arrow), low levels of Tat result in inactive feedback. (Lower) Increases in cell size and burst size are shown as koff decreases and km increases, resulting in increased Tat expression beyond threshold levels for active positive feedback.
(B) Stochastic simulations of Tat protein levels over time for the model shown in (A), with 500 single cells simulated for small and large cell sizes. Smaller cells remain in an OFF state with inactive feedback (gray), while larger cells increase to higher Tat levels and initiate positive feedback (red).
(C) Mean diameter distribution for cells that surpass Tat protein threshold levels in (B) for a range of simulated cell sizes (red) after normalization by an experimentally determined diameter distribution of a population of Jurkat T cells (orange and average dashed line).
(D) Threshold-based model for size-dependent feedback. The noise versus mean protein model lines are described in Equation 1. Smaller cells reside on a lower model line, and after treatment with an activator that increases burst frequency into the actively transcribing state, small cells fall short of threshold levels needed for reactivation (dashed line). Conversely, activated larger cells with larger burst size are able to fully reactivate.
Simulation parameters used in this figure are displayed in Table S1.
Analysis of gene expression fluctuations, or noise, has been a valuable tool to understand the stochastic viral switch of HIV (Weinberger et al., 2005, 2008). Transcriptional bursting of the LTR promoter has been experimentally measured and modeled across the human genome, including noise modulation under diverse drug treatments (Boehm et al., 2013; Dar et al., 2012, 2014, 2016; Singh et al., 2010). Translational bursting also contributes to total gene expression noise (Dar et al., 2015; Ozbudak et al., 2002). Noise measurements from LTR expression can illustrate the dependence of total burst size (B × b) on cell size and be used for modeling size-dependent behavior (Figure 1).
Total expression burst size of the inactive feedback 2-state promoter B × b is proportional to mean Tat protein levels and noise (quantified by the coefficient of variation squared (CV2)) using the following equations:
| (Equation 1) |
| (Equation 2) |
Here Tat protein is referred to as p; mRNA and protein are produced at rates km and kp and degraded at rates γm and γp, respectively; burst frequency is indicated as F; and other rates and burst definitions have been mentioned earlier. These equations have been previously derived under slow gene activation assumptions that koff >> kon, koff >> km, koff >> γp, and km >> (γm + γp) (Dar et al., 2012; Kepler and Elston, 2001; Simpson et al., 2004; Singh et al., 2010). For latently infected cells, the assumption that koff >> kon holds more than previous estimates for an active LTR promoter (Table S1).
With an assumed increasing power function dependence of total burst size (B × b) on cell size, stochastic simulations were performed using a power function for all cell volumes. Single-cell expression trajectories of larger cells surpassed Tat threshold levels needed for reactivation, while smaller cells remained latent (Figures 1B and1C). Figure 1C shows the number of cells reactivated and sorted by diameter. The result is compared to and normalized by a size distrbution (6–20 μm) of the total T cell population obtained experimentally (Figure 1C, orange curve). Here B × b changes koff and km simultaneously (Figure 1A, upper versus lower), while additional cases of changing kp and combinations of the three increase reactivation. The effect of Tat on the 2-state promoter switching model has been shown to effectively decrease koff such that in the transition of Tat to higher levels and active feedback, transcriptional bursts and total burst size are increased (Razooky et al., 2017).
In the inactive feedback model with low Tat levels, noise is inversely related to mean abundance (Equation 1; Figure 1D). Increases in transcriptional burst size (B) lead to a higher burst model line from which transcription can be initiated with activator drug treatments known to increase burst frequency (F) or the rate of switching into the active LTR state. Larger cells would surpass the threshold between promoter only and active feedback, while smaller cells would fall short.
Recently reported noise drug cocktails effectively exploit the same noise modulation strategy by using combination drug treatments to increase both B and F and achieve synergistic reactivation in latent cell populations (Equation 1) (Dar et al., 2014). In the current study, natural heterogeneity of latent cell size varies in total burst size and a similar effect is achieved with a single-activator treatment to increase F and total <p>. Larger cell sizes are primed for stochastic reactivation before activator treatments. The model results show that cell-size-dependent total expression bursts are capable of determining between reactivated and latent states of HIV. This motivates our hypothesis that cell-size-dependent increases of burst size can determine the decision of HIV to reactivate from latency after activator drug treatment (Figure 1D). If true, cell-size-dependent decision-making of HIV in single cells will be important for understanding stochastic design and heterogeneity in other biological systems and disease (Dar and Weiss, 2018).
Gene Expression Bursts of the HIV LTR Promoter Increase with T Cell Size
To test whether larger cell sizes increase the HIV LTR burst size, we performed single-cell time-lapse fluorescence microscopy of Jurkat T cells infected with the LTR driving a short-lived 2-hr half-life GFP (d2GFP) (Dar et al., 2012). The greater the d2GFP fluorescence, the more viral protein and expression activity occurs. Imaging was performed on a clonal population of LTR-d2GFP for 14 hr (STAR Methods). 3,037 single-cell trajectories were quantified over time for total fluorescent intensity and binned into ten cell size ranges (Figure 2A, with mean bin diameter noted). For the 10 bins, the LTR-d2GFP Jurkats reveal that the larger the mean cell diameter, the greater the total fluorescence intensity (blue circles, Figure 2B). The d2GFP intensity per unit volume shows no change across all cell diameters (orange squares, Figure 2B). This is consistent with previous reports of increased transcription levels and transcriptional burst size with cell volume to maintain constant transcript concentrations (Padovan-Merhar et al., 2015). Noise was analyzed from the total fluorescent trajectories of the cells in each bin (Dar et al., 2012). Noise magnitude from finite-duration imaging (high-frequency coefficient of variation squared, or HF-CV2) (Figure 2C) (Dar et al., 2012) and total burst size (Figure 2D) increase with the mean diameter of each bin (Figure 2A). Increasing noise magnitude with fluorescence indicates an increase in total burst size (Equation 1) and was previously observed for the LTR at both mRNA and protein levels using both microscopy (HF-CV2 and CV2) and flow cytometry (CV2) (Dar et al., 2012, 2016). The d2GFP reporter showed a constant degradation rate with cell size under cycloheximide treatment (Figure S2), and previous reports show that mRNA degradation stays constant with cell size (Padovan-Merhar et al., 2015). Total burst size (B × b) determined using Equation 1 showed a non-linear increase of up to a 10-fold change across the cell diameter range (Figure 2D). To find the dependence of changes to total burst size with cell size, fold change of total burst size was fit with a power function (R2 = 0.99) (Figure 2E). This was used to simulate the size-dependent increases of expression bursts from Figure 1. All diameter measurements obtained by microscopy were verified using a Moxi Z automated cell analyzer (Orflo), which exploits the Coulter principle for cell count and size (Mattern et al., 1957) (Figure S3).
Figure 2. Burst Size of the HIV LTR Promoter Increases with T Cell Volume.

(A) 3,037 single-cell intensity trajectories from anLTR-d2GFP clonal cell line acquired using 14 hr of time-lapse fluorescence microscopy. Trajectories are binned into ten groups according to their average individual equivalent diameters over the experiment. Average equivalent diameter of each bin is noted.
(B) Analysis of binned cell trajectories reveals increased total fluorescent intensity (blue circles) and constant fluorescent concentration (orange squares) with increasing cell diameter. Mean and SD of each bin is plotted.
(C and D) Noise magnitude (C) increases with fluorescence and transcriptional burst size (D) increases to 5- to 10-fold in larger cells compared to smaller cells. Total burst size (D) is plotted as defined in Equation 2.
(E) Power function fit to total burst size. The fold change in total burst size of the LTR promoter increases with cell diameter with a power coefficient of 5.6 (R2 = 0.99).
Error bars in (B)–(D) represent the SDs within each bin.
High-frequency processing of noise (HF-CV2) (Dar et al., 2012; Weinberger et al., 2008) effectively high-pass filters total noise and focuses on modulations of intrinsic noise of the gene circuit. Low-frequency extrinsic noise from global resource fluctuations is filtered. HF-CV2 and CV2 have been shown to correlate and provide precise measurements of expected noise (Dar et al., 2012, 2016; Weinberger et al., 2008).
To test whether cell-size-dependent burst size applies to additional promoters, Jurkat cells were randomly infected with the Ubiquitin C (UbC) housekeeping promoter at a low MOI (MOI = 1) expressing d2GFP (UbC-d2GFP). Polyclonal UbC-d2GFP revealed increased burst size with cell size (Figure S1). This suggests that cell-size-dependent total burst size is independent of integration site and occurs globally across the genome (Figure S1). This is consistent with increased burst size of housekeeping promoters quantified in human fibroblasts and their increases in burst size with cell size to maintain constant concentrations (Figure S1) (Padovan-Merhar et al., 2015). Finally, two Food and Drug Administration (FDA)-approved drug screens on Jurkats, one for cell size and one for noise, were compared (Figure S4) to examine the relationship between cell size modulation and noise-modulating drug treatments on the HIV LTR promoter. The screens reveal a correlation between noise enhancement and cell size, suggesting that exogenous treatments can modulate both cell size and HIV expression bursts.
Latent HIV Reactivates Exclusively in Larger T Cells while Smaller Cells Remain Silent
To measure the size of latently infected cells at their moment of reactivation, a Jurkat latency model (JLat) consisting of full-length HIV with a frameshift mutation in env and GFP replacing the nef reading frame (Jordan et al., 2003) was imaged using single-cell time-lapse fluorescence microscopy, similar to previous studies (Figure 3A) (Dar et al., 2012; Weinberger et al., 2008). GFP is an indicator for latent cells switching to a reactivated state. Generation of JLat cell lines renders them GFP– when untreated (Jordan et al., 2003). Three clonal JLat cell populations (6.3, 9.2, and 15.4) were activated with tumor necrosis factor alpha (TNF-α) at the start of imaging (t = 0) and imaged every 10 min for 20–26 hr (Figure 3A; Video S1; STAR Methods). TNF-α is a potent activator of the LTR promoter by upregulating nuclear translocation of nuclear factor κB (NF-κB), which binds κB sites within the LTR enhancer (Duh et al., 1989) (Figure S8). JLat 9.2 has previously reactivated to ~30% after 24-hr induction with TNF-α (Bohn-Wippert et al., 2017; Jordan et al., 2003; Spina et al., 2013). After imaging, individual reactivation events were segmented by image processing and detected and quantified over time for their mean fluorescent intensity, cell area, and equivalent diameter (Figure 3A). Detected reactivation events were defined as cells having an intensity above a threshold determined by sample and substrate autofluorescence for at least 4 hr (Figure 3B). A single intensity and cell size value (or equivalent diameter) were quantified for each reactivation event by averaging its time-dependent trajectory for 4 hr after first detection (Figures 3B–3D and S5).
Figure 3. Time-Lapse Fluorescence Microscopy of Latently Infected Cells Reveals Size-Dependent Reactivation of Larger Cells.

(A) 5-hr snapshots of reactivation of latent T cells infected with full-length HIV (JLat construct, upper) and imaged at 10-min intervals over 20 hr following treatment with TNF-α. Lower row shows image segmentation used to quantify single reactivation events. Cell intensity, area, and equivalent diameter are collected over time.
(B) Mean cell intensity versus time for 500 detected reactivation events collected from a single well of JLat 9.2 after TNF-α addition. Only the first 4 hr detected for each cell trajectory is shown. Intensity durations tracked for <4 hr were excluded from the analysis.
(C) Distributions of JLat 9.2, 15.4, and 6.3 reactivation after 24 hr of imaging and a 4-hr detection window post-reactivation. Reactivated cells shift to a larger cell size regime compared to the total size distribution of the JLat population, which includes GFP– cells (solid orange curve). No reactivation is detected from smaller cells below the average population diameter (dashed line).
(D) GFP+ cell size distributions of reactivated JLat 9.2 cells treated with diverse activators for 20–24 hr show reactivation events exclusively larger than 12 μm.
(E) Design of the reactivation experiment using TNF-α+Pro and TNF-α+SAHA for 14 hr followed by measurement of nucleus size. Snapshots of reactivated JLat 9.2 after TNF-α+SAHA treatment and DAPI staining. The left image represents a raw image of DAPI-stained and reactivated GFP+- expressing T cells. The right shows image segmentation of single cells quantifying reactivation events (red, GFP pixels in green box) and the DAPI-stained DNA content in the nucleus (purple, DAPI pixels within green box).
(F) GFP– (gray) and GFP+ (red) JLat 9.2 T cells DAPI stained after 14 hr of treatment with TNF-α+Pro and TNF-α+SAHA.
(G) Reactivated GFP+ cells from (F) show a positive correlation of nucleus diameter with total cell diameter.
(H) Cytoplasm-to-nucleus volume ratio is plotted versus total cell volume for >5,500 GFP+ reactivation events from (F). Reactivated cell volume is dominated by nucleus volume of about twice the calculated cytoplasm volume (STAR Methods and inset). The inset represents >98% of collected single cells for each treatment.
See also Figures S5, S6, and S9.
The three JLats showed consistent reactivation in larger cells with a mean diameter of ~15 μm compared to a mean population diameter of ~12 μm (Figure 3C). Cells lower than the mean population diameter showed no reactivation. To further demonstrate that reactivation of large cells occurs independently of the drug treatment used, we performed additional experiments using diverse reactivation treatments of trichostatin A (TSA); TSA+TNF-α; prostratin (Pro); Pro+TNF-α; and suberoylanilide hydroxamic acid (SAHA)+TNF-α, on JLat 9.2 and 15.4 (Figures 3D and S6; STAR Methods). Consistent with TNF-α treatment, all cells reactivated in a larger cell diameter regime above the 12 mm mean population diameter. Mean cell diameters of reactivated cells ranged from 15.5 to 17.2 μm (Figure 3D). As TNF-α treatment duration increased, reactivation events increased in cell diameter, intensity, and frequency at later detection times (Figure S5). Due to long (>20 hr) cell doubling times and minimal measured changes to single-cell volumes (dV/dt) (Figure S3), this effect cannot be attributed to dynamic changes of burst size of individual cells during imaging. For example, total reactivation events of JLat 9.2 + TNF-α between 10 and 14 hr increased by 42% compared to 14 and 18 hr (Figure S5). Examining sub-populations of the total large cell range, mean intensity of cells with a diameter of 12–14 μm remains fairly constant, while diameters of 16–19 μm reactivate at later treatment durations with higher intensity (Figure S5). This suggests a size-dependent response to treatment within the large cell size regime.
To confirm that the detected reactivation events occurring in larger cells are not biased by sample preparation, imaging parameters, or cell state, we performed three control experiments. First, the diameter distribution of imaged cells from the LTR-d2GFP population from Figure 2 was quantified and yielded cell sizes as low as 6.75 μm (Figure S6), demonstrating our ability to image small cells. Second, JLat 15.4 was imaged and its reactivation diameter distribution was quantified after extended treatment to allow doubling of adult cells before preparing the imaging sample (Figure S6). For both controls, cell diameters reached similarly low levels, suggesting that the detected reactivation of larger cell sizes is not an artifact of the experimental design or processing. Finally, to rule out that larger latently infected cells are in a higher activated state than smaller cells, we investigated the dependence of the active Jurkat cell state on cell size. Immunofluorescent staining of the activation cell receptor CD69 was performed on two JLat populations treated with TNF-α for 24 hr and showed no dependence of T cell activation levels on cell size (Figure S7). TNF-α addition increases CD69 of JLat populations equally for all cell sizes. This shows that cell activation state is not correlated with cell size and cannot account for the observed latent reactivation occurring exclusively in larger cell sizes.
To investigate whether viral reactivation depends on nucleus volume (compared to cytoplasm volume), JLat 9.2 was treated with TNF-α+Pro and TNF-α+SAHA for 14 hr before staining with DAPI and imaging (Figure 3E). Synergistic two-drug treatments increased the number of GFP+ events before cell doubling occurs at the 14-hr time point (Figure 3E). Both the area-based equivalent diameter of DAPI-stained nuclei (purple-labeled pixels, Figure 3E) and the total cell diameter based on GFP (red cell outline, Figure 3E) from reactivated JLat cells were quantified (STAR Methods). A bimodal distribution of nucleus diameter was observed for more than 28,000 quantified nuclei (gray, Figure 3F). GFP+ cells reactivated in a similar range of nucleus diameters but showed an enrichment of about 2× cells with larger nuclei for both treatments (red, Figure 3F). For GFP+ cells, nucleus diameter is positively correlated with total cell diameter and comprises most of the cell. This suggests that transcriptional burst (B) contributes to total burst size (B × b) in proportion to total cell size (Figures 2D and3G).
Next, to assess the contribution of cytoplasm and translational bursts, we calculated the ratio of cytoplasm volume to nucleus volume for GFP+ cells (C:N ratio). Plotting C:N volume ratio versus total cell diameter shows values less than 1 for most reactivated cells (~80%) (Figure 3H). Along with a control showing that promoter fluctuations dominate noise measured in all cells (Figure S2), these results suggest that changes in total burst size (B × b) are dominated by changes in nucleus size and transcriptional bursts (B) are less influenced by changes in translational bursts (b).
Latently Infected Primary CD4+ T Cells Consistently Reactivate in Larger Cells
To test whether size-dependent reactivation from latency is conserved in primary human CD4+ T cells infected with the JLat vector, sorted cells were adhered and imaged for 12–15 hr under treatment with a potent transcriptional activator combination, phorbol 12-myristate 13-acetate (PMA)+ionomycin, at the start of imaging (Figure 4A). Examples of reactivating primary cells are shown (Figure 4A; Video S2; STAR Methods). A total of 805 reactivation events were detected from the infected CD4+ T cells from two donors and quantified for their 4-hr mean intensity and diameter (Figures 4B and S8). Most reactivation events had cell diameters greater than the mean diameters for the activated T cell population from each donor (red versus black distributions, Figure 4B), and vertical dashed lines for both the active and the resting primary CD4+ T cell distributions represent mean cell diameters. The increased reactivation diameters of the primary CD4+ T cells are consistent with the observed reactivation of larger Jurkat cells (Figure 3).
Figure 4. Reactivation of Latently Infected Primary CD4+ T Cells Occurs in Larger Cells.

(A) 12- to 15-hr time-lapse microscopy of OFF sorted primary cells infected with a JLatd2GFP vector (upper). Cells are treated with PMA+ionomycin at t = 0 hr, and single-cell reactivation events are quantified (Video S2). Two reactivating cells are tracked and indicated with arrows in 1-hr snapshots (scale bar, 10 μm).
(B) Distributions of reactivated primary CD4+ T cells from two donors (upper and lower) shift to a larger size regime compared to their respective total population size distribution (black curve with average dashed line). The average size of resting CD4+ T cells is also indicated (gray curve and gray dashed line). No reactivation was detected in smaller sizes of the activated CD4+ cells.
(C) Single-cell microscopy of resting and activated primary CD4+ T cells infected with JLatd2GFP and treated with either PMA+ionomycin at t = 0 or pretreated for 24 hr reveals cell-size-dependent reactivation between the start and the end of imaging. (Left) Resting primary cells do not reactivate between 4 and 18 hr. In contrast, stimulated primary CD4+ T cells show an increase of reactivation events (GFP+) over time. (Right) Cell-size dependence of CD4+ T cells in activated cells (red) and resting cells (gray).
Unlike the JLat, reactivated primary cells did not increase in intensity with cell diameter (Figure S8). Reactivation intensity increased in the JLats only after 10 hr of imaging with TNF-α (Figures 3 and S5), which is consistent with an ~10- to 12-hr time delay needed for NF-κB activation by TNF-α (Figure S8). Increased fluorescence intensity by delayed response to PMA+ionomycin treatment was not possible to capture, because imaging of primary cells was limited to 12–15 hr. However, fluorescence-activated cell sorting (FACS) of GFP+JLatd2GFP-infected CD4+ T cells treated for 48 hr with diverse activators (Figure S8) showed size-dependent intensity enhancement consistent with the assumed model (Figures 1, 2, and S8).
To establish that resting and infected primary CD4+ T cells are unable to reactivate in smaller cell sizes, we performed additional microscopy experiments using PMA+ionomycin (Figure 4C). Resting T cells infected with JLatd2GFP showed decreased cell sizes and no reactivation between 4 and 18 hr of imaging, both with and without pretreatment of PMA+ionomycin. Stimulated GFP– sorted CD4+ cells from donor 1 revealed increased cell diameter and GFP+ cell counts. Cell viability of all infected cells was between 80% and 100% and assessed using propidium iodide (PI) staining.
Reactivation of HIV Latency Depends on Cell-Cycle Phase
Despite the idea that cell size would be naturally correlated with cell cycle, reports in fibroblasts have shown that all cell-cycle phases can exist throughout the range of cell sizes in a population (Padovan-Merhar et al., 2015). We have confirmed this in Jurkat T cells using a cell-cycle stain. TNF-α-treated JLats reveal no correlation between cell size and cell cycle (Figure S7). In addition to cell size-dependent transcriptional bursting, studies in mammalian cells have shown that transcriptional burst frequency (F or kon) decreases with cell-cycle progression (i.e., FG1 > FG2) (Padovan-Merhar et al., 2015). Given the strict dependence of reactivation on larger cell size, we next investigated the dependence of reactivation of latency on cell cycle.
With reactivation occurring by combining increased transcriptional burst frequency (e.g., with TNF-α in Figure 3C) and burst size, latent cells predisposed with higher burst frequency at earlier cell-cycle phases are predicted to synergize to higher reactivation levels when treated with an activator (Equations 1 and 2; Figure 5A) (Dar et al., 2012, 2014; Singh et al., 2010). Conversely, treating cells with an activator at later cell-cycle phases is predicted to result in fewer threshold crossings due to lower burst frequency (i.e., FG1+TNF-α > FG2+TNF-α).
Figure 5. Reactivation of T Cells Latently Infected with HIV Is Cell-Cycle Dependent.

(A) Hypothesis of the effect of cell cycle on reactivation after activator treatment. With higher kon in G1 phase, cells move farther on the model line of noise versus mean viral expression after activator treatment (Equation 1). This results in an increase of reactivated cells compared to G2 phase with the same treatment.
(B) Model of the effect of cell cycle on HIV-positive feedback by accounting for differences of cell-cycle phase represented by changes in kon and copy number of the feedback circuit.
(C) Stochastic simulation results for cells with elevated Tat levels and active feedback for 500 simulated cells for each cell diameter and cell-cycle phase. The bars represent a 5-point moving average of the distribution. Both G1 and G2 phases are shifted to the right from the total population distribution, with the G1 peak ~75% higher than G2.
(D) Comparison of cell-cycle distributions of the entire cell population and reactivated cells (GFP+) for JLat 9.2 after 12 hr of treatment with TNF-α and TNF-α+SAHA. Cells reactivate at different levels for G1 and G2, suggesting cell-cycle-dependent reactivation.
(E) Ratios of reactivated to total cells in G1, S, and G2 are calculated by separately dividing the normalized frequency of the cell-cycle distributions in (D). A 9-point moving average of the TNF-α-treated trend reveals an increase in reactivation of ~4× in G1 compared to the expected reactivation events from a cell-cycle-independent assumption (ratio = 1). Except for an absent G1 peak, SAHA+TNF-α follows a trend similar to that of TNF-α alone.
To test whether reactivation increases at earlier cell-cycle stages, we modified the computational model showing active feedback from Figure 1A for the larger cell size (higher B model line) to have two burst frequencies corresponding to G1 and G2 phases (Figures 5A and5B). Here FG1 was defined to be double FG2 (Figure 5B) based on previously measured results (Padovan-Merhar et al., 2015), and G2 was simulated to have 2 copies of the gene (Table S1). Total burst size dependence on cell diameter was scanned similarly using the power function of Figure 2E. Stochastic simulations show that reactivation of cells in both cell-cycle phases increases with diameter. G1 cells reach about double the reactivation compared to G2 cells (Figure 5C).
To experimentally test the model prediction of increased reactivation at earlier cell cycles, we compared the cell-cycle distribution of reactivated JLat cells to their whole population distribution (both GFP+ and GFP– cells) (Figure 5D). JLat 9.2 and 15.4 were stimulated with TNF-α or TNF-α+SAHA for only 12 hr to exclude any measurement of GFP+ cells produced from doubling events after treatment, which could skew the cell-cycle distribution (Figure S6). DNA content using a phycoerythrin (PE)-conjugated cell-cycle stain and GFP expression was measured using flow cytometry (Figure S9). For JLat 9.2, treatment with TNF-α or TNF-α+SAHA indicates that reactivation occurs to some extent in all cell-cycle phases (red, Figure 5D). Similar results were observed for JLat 15.4.
Cell-cycle phase-dependent reactivation was calculated by the ratio between GFP+-reactivated cells and all cells in the JLat population after normalization of each distribution by its integrated cell count (Figure 5D). Ratios of normalized GFP+ to all cells were examined across the PE-Cy-5 range (Figure 5E). A cell-cycle phase ratio value of 1 would mean that the number of cells expected to reactivate at a specific cell-cycle phase is consistent with an a priori assumption that reactivation occurs with equal probability across all cell-cycle phases of the latent population and would reject the hypothesis that G1 cells with higher burst frequency have increased reactivation (Figure 5A). For TNF-α treatment, the ratio at G1 results in a ~4× increase from expected reactivation and a 2× increase for G2 (Figure 5E). S phase shows a 60% decrease in the expected amount of reactivation. Reduced reactivation in the S phase is confirmed by TNF-α+SAHA treatment (Figures 5D and5E). This is consistent with a reported role for S phase in stabilizing latency and providing a barrier for active replication of the virus (Foli et al., 2007; Wang et al., 2011). In contrast to TNF-α-treated cells (black, Figure 5E), the amplified ratio in G1 is suppressed with TNF-α+SAHA treatment while the S and G2 phases of the ratio curve follow similar trends (black and purple, Figure 5E). This is consistent with a reported G1 cell-cycle arrest by SAHA in different cell lines (Bernhart et al., 2017). It also motivates the active control and stochastic design of viral decision-making by modulating burst frequency for specific cell-cycle states (Dar et al., 2014; Dar and Weiss, 2018; Megaridis et al., 2018).
Cell-Cycle Modulators Alter Synergistic Reactivation from Latency
To assess whether cell-cycle-dependent reactivation can be actively modulated, we performed treatments for 24 hr with an array of known cell-cycle-arresting compounds on JLats 9.2 and 15.4. Treatments included rapamycin, resveratrol or cytarabine, and 17β-estradiol known to arrest cell cycle in T cells at G1, S, and G2, respectively (Figure 6A) (Ford et al., 2015; Jenkins et al., 2001; Joe et al., 2002; Sampath et al., 2006; Zhao et al., 2008). After cell-cycle arrest treatment for 12 hr, TNF-α was added to the cell-cycle arrest for an additional 12 hr. Cell-cycle states of reactivated GFP+ cells after cell-cycle arrest were compared to the distributions of JLats treated with only TNF-α (Figures 5D and6B). Drug-treated cells showed high cell viability and no reactivation when treated with cell-cycle-arresting treatments alone (Figure S10). Cell-cycle phase distributions for the reactivated cells with treatments are shown in Figures 6B–6E. Exposure to rapamycin resulted in reactivation in the G1 phase, which was calculated by the percentage of GFP+ cells detected by flow cytometry gating (Figure S9). GFP+ cells accumulated in the G1 phase compared to G2, and their distribution is plotted in red (Figure 6B). Treatment with resveratrol resulted in an increase of activated cells in S phase and a decrease of cells in G1 and G2 phases (Figure 6C). Although cytarabine also arrests T cells at S phase (Ford et al., 2015), treatment significantly blocked transition of cells from G1 to S phase and reactivation predominantly occurred in G1 (Figure 6D). Treatment with 17β-estradiol resulted in a significant increase of 2.3× and 1.5× in G2 reactivation for JLat 9.2 and 15.4, respectively, compared to TNF-α treatment alone (Figures 6B and6E). This effect was combined with a reduction of activated cells in G1 and S phases. However, these drugs alone may also change HIV expression through alternative mechanisms (Hawley et al., 2013; Martin et al., 2017; Szotek et al., 2013). These results demonstrate the possibility of active cell-cycle control for latent reactivation at specific cell-cycle phases. This presents an additional cell-state strategy to bias viral decision-making.
Figure 6. Modulation of Cell Cycle Alters Reactivation of Latent Cells.

(A) (Left) Experiment design using treatments with diverse cell-cycle-arresting drugs. Cell cycle was arrested for 24 hr for JLat 9.2 and 15.4, and reactivation was performed with 12-hr TNF-α after cell-cycle arrest. Cell cycle was determined by DNA staining using flow cytometry. (Right) Cell cycle of Jurkat cells is arrested for 24 hr using rapamycin, resveratrol, cytarabine, and 17β-estradiol.
(B–E) Alteration of cell-cycle progression and reactivation of cells after treatment with rapamycin (B), resveratrol (C), cytarabine (D), and 17β-estradiol (E) in combination with TNF-α. The table for TNF-α only is shown above. Cell-cycle arrest causes reactivation of cells at specific phases (the largest GFP+ arrest phase is highlighted with rectangles).
(F) Reactivation of JLat 9.2 and 15.4 after the treatment design shown in (A).
(G) Similar reactivation with simultaneous combination of cell-cycle arrester with TNF-α for 24-hr treatments.
(H) Dependence of synergistic reactivation on cell cycle with TNF-α treatment is confirmed by previously characterized noise enhancers known to affect cell cycle (Dar et al., 2014). In the previous study, measurements of 24-hr treatment of JLat 8.6 with noise enhancers and TNF-α show highest reactivation in G1 phase, followed by G1/S and G2/M cell populations (mean reactivation in parentheses).
Calculated p values (*p < 0.05 and **p < 0.005) indicate significance between reactivation of treatment groupings by cell-cycle phase. Bar plots represent a mean and SE of two experiments.
To test the possibility of reactivation with cell-cycle arrest, treatments combined with TNF-α were performed (Figures 6F and6G). Cell cycle of JLat 9.2 and 15.4 was arrested with 24 hr of treatment, and TNF-α stimulation of cells was carried out either in combination with cell-cycle-arresting treatment for 24 hr or 12 hr after arrest was initiated. The percentage of reactivated GFP+cells with combined treatment was analyzed and compared to the percentage of cells reactivated with TNF-α alone (Figures 6F and6G). 24-hr cell-cycle arrest and treatment with 12-hr activator showed synergy and increased reactivation in G1 compared to TNF-α treatment (red dashed line, Figure 6F). G2 phase showed reduced synergy with reactivation comparable to TNF-α. For 24 hr of combined treatment, G1 displayed synergy, while G2 and S phases showed decreased reactivation levels, or antagonism to TNF-α. This is consistent with an expected decrease in burst frequency with cell-cycle progression compared to the increased frequency by TNF-α treatment alone (Figure 6G).
Cell-cycle-dependent synergies for enhanced latent reactivation were further investigated using a previously reported FDA-approved noise enhancing compound library (Dar et al., 2014). A portion of the reported library is known to arrest cell cycle (Figure 6H; Table S2). Previous measurements show that JLat 8.6 treated with TNF-α in combination with 18 cell-cycle-arresting noise enhancers results in cell-cycle-dependent synergy, consistent with the results observed here (Figure 6H) (Dar et al., 2014). The results demonstrate that synergistic reactivation of latent cells is minimal in S and G2 but significantly increases for G1 and G1/S phases (p < 0.05). This trend is consistent with FG1+TNF-α > FG2+TNF-α, as seen in Figures 6F and6G.
DISCUSSION
Studies of stochastic gene expression have investigated the role of noise in diverse gene circuits, networks, and phenotypes (Balázsi et al., 2011; Raj and van Oudenaarden, 2008). Extending the dependence of lambda phage developmental fate on host-cell volume before infection (St-Pierre and Endy, 2008), we show that similar host-cell-dominating effects apply to infected human cells and demonstrate cell size-dependent decision-making of latently integrated HIV. Increases of expression bursts depend on cell size, and intracellular global resources couple into known intrinsic noise mechanisms of the HIV viral circuit (Dar et al., 2012; Weinberger et al., 2005, 2008). A combination of cell size and hardwired deterministic and stochastic Tat circuitry determines stability of the latent state (Dar et al., 2014; Razooky et al., 2015; Weinberger et al., 2005, 2008). We show that smaller latently infected host cells are deterministically silent, while larger host-cell sizes exhibit larger expression bursts. Larger bursts lead to threshold crossings of viral products, feedback activation, and stochastic decision-making. While the dependence of burst size on cell size may eventually reach an upper limit before the power function reaches infinity, this did not occur within the range of cell sizes observed.
From an integrated gene circuit and stochastic decision-making perspective, this study presents an example of a cell size-based fate decision, consistent with reports of increasing gene expression burst size with cell reaction volume (Caveney et al., 2017; Padovan-Merhar et al., 2015). These observations may guide strategies for viral therapies by influencing both cell size and cell cycle. Redistributing latent cells toward smaller sizes and later cell-cycle phases (for smaller B and F) (Figures 1D and5A) would provide a potential strategy for therapies aiming to stabilize latency (e.g., block-and-lock strategy) (Kessing et al., 2017). Conversely, modulating latent cell populations toward larger cell size and earlier G1 phase (for larger B and F) would benefit strategies aiming to reactivate cells from latency (e.g., shock and kill) (Archin et al., 2012).
The existence of cell size-based decision-making of an integrated viral circuit may contribute to current biomarker and therapeutic efforts in disease. It may also advance efforts to engineer noise by elucidating how cell state influences gene expression fluctuation intrinsic to gene circuits and networks for cellular decisions. Engineering noise toward forward stochastic design would benefit synthetic biology and bioengineering applications (Dar and Weiss, 2018). The a priori knowledge relating cell size and viral decision-making provides insight into the mechanisms of viral-host control and a basis for sorting and characterizing cell sub-populations likely to harbor latent HIV.
Collectively, these findings present HIV as a viral gene circuit with stochastic decision-making based on mammalian host-cell size. Large cells with increased burst size are required for reactivation of latent cells. Furthermore, cell growth presents a naturally timed noise generator capable of providing asynchronous stochastic decisions in a defined cell size window for each cell. In a study, Wang and colleagues report the importance of cell growth, size, and division state memory in quiescence-exit heterogeneity (Wang et al., 2017). This study of tissue repair and tissue engineering presents an additional example of growth-dependent stochastic switching. Cell size-based gene expression programs may be of interest for multicellular systems and synthetic biology applications.
Quiescence exit and reactivation from latency suggest the existence of a broader class of cell size-based decisions in diverse cell types and biological contexts (Balázsi et al., 2011). These may include development and patterning in tissue growth (Meyer and Roeder, 2014), pluripotent gene expression and stem cell differentiation (Singer et al., 2014; Skinner et al., 2016), intratumor heterogeneity (Brock et al., 2009; Gupta et al., 2011), and circadian clock-based stochastic gene expression programs (Chabot et al., 2007). Furthermore, the consistent relationship measured for housekeeping promoters in Jurkats (Figure S1) and fibroblasts (Padovan-Merhar et al., 2015) suggests that size-dependent gene regulation and decision-making may be fairly common and exploited throughout the genome in diverse pathways, viral-host interactions, and organisms. Evidence of cell size-dependent increases of global genome-wide bursts suggests that in addition to Tat feedback of HIV, signaling mechanisms are likely involved in the decision observed, which are not accounted for in the current model.
Strategies using host-cell size and cell cycle for monitoring and controlling latency may support drug treatments for HIV-infected individuals. The combined modulation of cell size and cell cycle provides a space for stochastic design of drug therapies (Dar et al., 2014; Dar and Weiss, 2018). Reports demonstrate difficulty in eradicating the latent reservoir using drug treatments in HIV-infected individuals on ART due to the proliferation and expression of reactivated latent cells (Wiegand et al., 2017). Cell-cycle states display a large range of overlapping cell sizes and mRNA levels, allowing the independent modulation of cell size and cell-cycle phase (Dolatabadi et al., 2017; Padovan-Merhar et al., 2015). Checkpoint regulators may provide novel targets for controlling latent stability in larger cells. HIV is already known to stall the cell from entering mitosis by controlling G2 arrest with its viral protein vpr (Andersen et al., 2008), when viral promoter activity is highest (Goh et al., 1998). The a priori knowledge that reactivation events occur with higher probability in larger cell sizes, while remaining silent in smaller cells, provides a paradigm for diagnostics for HIV-infected individuals, latency-reversal treatments, and therapeutic strategies toward a cure.
STAR⋆METHODS
CONTACT FOR REAGENT AND RESOURCE SHARING
Further information and requests for resources and reagents should be directed to and will be fulfilled by the Lead Contact, Roy Dar (roydar@illinois.edu).
EXPERIMENTAL MODEL AND SUBJECT DETAILS
Cell Culture and Cell Lines
Jurkat cells and primary CD4+ T cells were grown in RPMI 1640 media supplemented with L-glutamine, 10% fetal bovine serum (FBS), and 1% Penicillin/Streptomycin (Corning Cellgro). Primary CD4+ T cells were also supplemented with 25 mM HEPES (Thermo Scientific). Cells were incubated with 5% CO2 at 37°C. Naive Jurkats and JLat isoclones 6.3, 9.2, and 15.4 were obtained from ATCC and the NIH AIDS Reagent Program. LTR-d2GFP isoclone 20 in Figure 2 was previously published in a noise drug screen (Dar et al., 2014) and kindly provided by the Weinberger Laboratory at the Gladstone Institute at UCSF. Infection of naive Jurkats for the production of LTR-d2GFP isoclones has been previously described (Dar et al., 2012; Singh et al., 2010). For HIV latency studies, JLat isoclones 6.3, 9.2, and 15.4 consisting of full-length HIV with GFP replacing the nef reading frame and a deletion of env were selected from a previously generated library (Jordan et al., 2003). Studies with primary CD4+ T cells included the production of JLatd2GFP lentivirus containing a replication incompetent full-length HIV-1 genome with a deletion of the viral env protein and replacement of the nef reading frame by a destabilized d2GFP (Weinberger Laboratory at the Gladstone Institute at UCSF). Furthermore, T cell lines created for Figure S1 consisting of the Ubc promoter with a d2GFP (UbC-d2GFP) and a LTR promoter with a d2GFP-IRES-Tat cassette (LTR-d2GFP-IRES-Tat or Ld2GIT) (Dar et al., 2012). The The JLat-d2GFP, Ld2GIT, and UbC-d2GFP plasmids were obtained from the Weinberger Laboratory at the Gladstone Institutes at UCSF.
Isolation of Primary CD4+ cells
Peripheral blood mononuclear cells (PBMC) were isolated by Ficoll-Hypaque density gradient centrifugation of buffy coats from HIV-seronegative donors (Innovative Research, MI, USA and BioreclamationIVT, NY, USA). PBMCs were immediately processed to isolate CD4+ T cells using RosetteSep Human CD4+ T Cell Enrichment Kit (Stem Cell Technologies) and negative selection. Cultivation and stimulation of isolated CD4+ T cells was performed as previously described using a modified version of the Greene model of latency without the use of saquinavir (Bohn-Wippert et al., 2017; Lassen et al., 2012). Subpopulations of resting and dividing CD4+ T cells were used after infection for experiments in Figure 4. For activation of resting CD4+ T cells, CD3/CD28 activation beads (ThermoFisher Scientific) were used for 72h.
Transfection of Primary Cells
For creating primary CD4+ T cells containing the JLat-d2GFP vector, HEK293T cells, were obtained from ATCC, were tranfected with viral supernatant containing JLatd2GFP, and the viral supernatant was harvested 48h post-transfection. Infection of stimulated primary CD4+ T cells with lentiviral supernatant was performed using spinoculation and sorting was carried out as previously described (Bohn-Wippert et al., 2017; Lassen et al., 2012). Transfection of resting primary CD4+ T cells, used a slightly modified Greene model (Bohn-Wippert et al., 2017) by isolating the cells using the RosetteSep human CD4+ T cell enrichment cocktail (Stemcell Technology Inc., Vancouver, Canada). Cells were then cultured in RPMI 1640 containing 10% FCS and 1% Penicillin/Streptomycin. 1 day after isolation, 2.5 × 10⁶ resting primary CD4+ T cells were spinoculated with 1:70 concentrated viral supernatant containing JLatd2GFP at 1200 x g for 2h at room temperature. Infected cells were plated at 1×10⁶ cells/ml using RPMI 1640 supplemented with 10% FCS, 1% Pencillin/Streptomycin, 25 mM HEPES, and cultured without saquinavir treatment. Single-cell fluorescence microscopy experiments of resting primary CD4+ T cells were performed either 1d after infection for samples treated with PMA+ionomycin at t = 0 of imaging or 2 days after infection for samples pretreated for 24 hour with PMA+ionomycin.
METHODS DETAILS
Stochastic simulations and modeling
Stochastic simulations of the model in Figures 1 and 5 are implemented using the Gillespie algorithm (Gillespie, 1977). Parameters used are recorded in Table S1. A total of 1,200 units of time are simulated for each single cell and the recording interval of Tat copy number is once every 1 time unit. For modulation of fold change in B × b (Figures 1 and 5), 2/3 of the change is attributed to decrease of koff, and 1/3 is attributed to increase of km. To model G2 phase in cell cycle (Figure 5), the number of molecule representing the gene is increased from 1 to 2 in the simulation; for G1 phase, the rate parameter kon is doubled.
Quantification of cell size versus expression burst size
To calculate mean fluorescence < FL >, high-frequency noise magnitude (HF-CV2), and transcriptional burst size for the integrated LTR promoter as a function of cell size (or diameter), imaged cells in Figure 2A were binned by their individual mean size. Next, their corresponding intensity trajectories were used for each bin size to calculate mean single-cell fluorescence, population general trends (time-dependent average of each size cluster), noise magnitude, and burst sizes using previously described noise analysis (Dar et al., 2012; Kepler and Elston, 2001; Simpson et al., 2004; Singh et al., 2010) (Equation 1 of main text).
Sorting of infected primary CD4+ T cells using flow cytometry
Three days after infection with JLatd2GFP virus and T cell stimulation, infected primary CD4+ T cells were sorted using a primary antihuman CD4 monoclonal (SIM.4) antibody (NIH AIDS Reagent Program, MD, USA) and a secondary goat anti-mouse IgG-PE antibody (Santa Cruz Biotechnology, TX, USA). Live cell staining of cells was carried out for 30 min at 4°C for the primary antibody followed by an additional step of 20 min at 4°C for the secondary antibody. Washed cells were sorted for GFP+ and GFP- populations.
Reagents for reactivation and cell-cycle assays
Populations of Jurkat LTR-d2GFP isoclone and JLat clones 6.3, 9.2, and 15.4 were stimulated with TNF at a final concentration of 10 ng/ml or with TNF in combination with 3 μM prostratin. Histone deacetylase inhibitor TSA (Sigma-Aldrich) was applied at a final concentration of 400nM. GFP- sorted primary CD4+ T cells were stimulated with a combination of 200 ng/ml PMA and 1 μM ionomycin. suberoylanilide hydroxamic acid (SAHA) was used at a final concentration of 2.5 μM (Dar et al., 2014; Kumar et al., 2016). For cell-cycle arrest studies, JLat 15.4 and 9.2 were treated with 400 nM Rapamycin, 20 μM Resveratrol, 0.7 μM Cytarabine, and 10 μM 17β-Estradiol. For investigation of GFP-degradation rates, LTR-d2GFP isoclone 20 was treated with 10 μg/ml Cycloheximide. 3 μM Flavopiridol was used for the investigation of transcriptional bursts using LTR-d2GFP isoclone 20 (Figure S2). All chemicals were obtained from Cayman Chemicals except for TNF (R&D Systems).
Staining of nuclei using DAPI
JLat 9.2 was treated for 14h with 10ng/ml TNF in combination with either 2.5μM SAHA or 3μM Prostratin. Cells were washed once with 200μl PBS and fixed with 3.9% Formaldehyde (Miltenyi Biotec Inc., CA, USA) for 10 min at room temperature (RT). Afterward, cells were centrifugated at 500 x g for 5 min and 4°C and permeabilized for 30 min on ice using ice cold permeabilization buffer A (Miltenyi Biotec Inc., CA, USA). Two additional washing steps with PBS were performed after cell permeabilization, and cell nuclei were then stained with 0.1mg/ml DAPI (Sigma-Aldrich, St. Louis, USA) for 5 min in the dark at RT. After two washes with PBS, 1.5 × 10⁵ cells were seeded into each experimental well of a half-area glass bottom 96-well plate (Corning) and imaged by taking 36 images per well using a 40x objective.
Ratio of cytoplasm volume to nucleus volume for GFP+ cells
Equivalent whole cell and nucleus diameters were used with the following equations under the assumption of a spherical cell:
Here dDAPI and dGFP are the equivalent diameter calculated from their respective segmented cell areas. It is worth noting that DAPI staining involves fixation and measurements have shown that changes in the total cell area of unfixed populations are correlated with their fixed counterparts (Padovan-Merhar et al., 2015).
Automated Fluorescence Imaging
Fluorescent imaging experiments using JLats and primary CD4+ T cells were perfomed using Cell-Tak adhesive (Corning Life Science) and half-area glass-bottom 96-well plates (Corning #4580). For imaging experiments, 1.5 × 10⁵ cells of JLat 9.2, 15.4, and 6.3 were adhered to half-area glass bottom 96-well plates using Cell-Tak adhesive (BD) and imaged for at least 20h. Long duration imaging of single primary CD4+ T cells has been proven to be challenging, and devices tailored for this purpose have been designed (Razooky et al., 2012). We used a modified sample preparation with increased amounts of Cell-Tak in the glass coating layer and a decreased amount of CD4+ T cells per well (7.5 × 10⁴) to achieve 12–15h imaging experiments of stimulated CD4+ T cells from the two donors before the cells started to disengage from the glass-bottom well. Single-cell imaging of resting CD4+ T cells appeared more stable with imaging lasting 22h using increased amounts of Cell-Tak. All cell lines were imaged with a fully automated and environmentally controlled inverted Nikon Ti-Eclipse Microscope with Perfect Focus System (PFS), 20x or 40x objective, 100ms exposure, 16-bit ORCA-FLASH 4.0 CMOS camera (Hamamatsu) using 2×2 binning for 12–28h durations. Cell media with activator treatment was added at the start of imaging. Imaging utilized a stage top environmental control at 37°C and 5% CO2 (Tokai Hit). Periodic and automated image acquisition of multiple points within multiple wells at 10 min imaging intervals was executed using a high-speed linear motorized stage controlled by Nikon Elements software (Nikon Instruments Inc.). To reduce background fluorescence and increase imaging sensitivity, phenol-red-free RPMI 1640 medium (GIBCO) was substituted for the culturing RPMI 1640 media at the final step of imaging in all experiments.
Data processing
Image processing and tracking of identified single-cells was performed using Nikon Elements software with high content imaging module (Nikon Instruments Inc.). Exported data files including tracked single-cell intensity trajectories and equivalent cell diameters calculated from the processed image binary areas were processed and quantified for reactivation event detection using custom MATLAB codes (Mathworks) (Dar et al., 2012). The total number of GFP+ cells within multiple wells at various time points of imaging were calculated using segmented binary cell areas. Quality controls were performed for cells that were both DAPI and GFP positive to ensure the overlapping area is at least 95% of the total DAPI area. Although similar, autofluorescence and detection thresholds were defined for each day of imaging.
Cell-cycle analysis of reactivated latent T cells
For cell-cycle analysis, drug treated JLat cells were harvested, counted, and washed twice in PBS. Cells were resuspended in flow cytometry staining buffer (R&D Systems, MN, USA) at a concentration of % ≤5 × 10⁵ cells/ml and fixed with 3.9% Formaldehyde (Miltenyi Biotec Inc., CA, USA) for 10 min at RT. Cells were centrifugated at 500 x g for 5 min at 4°C, permeabilized by adding ice cold permeabilization buffer A (Miltenyi Biotec Inc., CA, USA) and incubated on ice for 30 min. After two washing steps with PBS, cells were stained with NUCLEAR-ID® Red DNA Stain (ENZO Life Sciences Inc., NY, USA) using a 1:1,000-fold dilution. Stained cells were incubated at RT for 30 min. At least 3k reactivated stained cells were collected and analyzed with a BD LSR Fortessa flow cytometer. Cell-cycle distributions are shown as the percentage of cells containing G1, S, and G2 DNA by PE-Cy5-A staining analyzed by FCS Express cell-cycle analysis software (De Novo Software, CA, USA).
In silico quantification of infected primary CD4+ T cells
In silico gating of small and large cells was carried out for HIV infected ON-sorted primary CD4+ T cells treated with different drugs for 24 to 48h. Live cell populations containing 10k cells were defined as small and large cells by gating ~3k cells for each region of interest using low and high forward-scatter (FSC) from flow cytometry. For ON-sorted primary CD4+ T cells, mean fluorescence intensity was calculated by creating an ON-gate for the live cell population. The small and large FSC gated subpopulations were part of the ON-gate. Using an ON-gate allows the exclusion of cells with dim fluorescence intensities which could be sorted into the ON-sorted population. The mean GFP intensity versus FSC for each subpopulation was plotted.
CD69 receptor staining of T cell activation
JLat 9.2 and 15.4 were incubated 24h with 10 ng/ml TNF and washed twice with flow cytometry staining buffer (R&D Systems, MN, USA). Cells were pre-incubated with human AB serum to block nonspecific binding of the monoclonal antibody, followed by CD69 receptor staining (CD69 PE clone FN50, Thermo Fisher Scientific, MA, USA) for 30 min at 4°C using 1×10⁶ cells/100μl. The cells were washed twice in PBS and centrifugated at 500 x g for 5 min. Samples were then analyzed using a BD LSR Fortessa flow cytometry analyzer (BD Biosciences). 10k cells were collected and defined as LIVE cells. This population was used to determine small and large cells by gating ~1k cells for each region of interest using low and high forward-scatter (FSC) from flow cytometry. The mean fluorescence intensity of GFP+ cells was calculated by creating an ON-gate for the LIVE cell population. Both activated cell populations were examined for their CD69 expression and mean FCS versus PE was plotted. Previous studies using CD25 and CD69 activation markers of CD4+ T cells have also shown a lack of correlation between cell activation and cell size (Waysbort et al., 2013).
QUANTIFICATION AND STATISTICAL ANALYSIS
Mean and standard deviation were used for all cells collected in a cell size bin in Figure 2. Bar plots of subsequent figures contain mean calculation of measurements with standard error based on the replicates noted in the figure caption.
For Figure 1C, a two-sample Student’s t test with unequal variance between the simulated cell diameter results (red bar graph) and the measured MOXI measurement (orange curve) was carried out. The p value of the test is 2:16 × 10–124, which shows that the difference in mean diameters between the whole population and the simulated on population is highly significant.
For Figure 2E, an ANOVA test was performed after taking natural log on both x- and y axis values on our fitted model. The resulting statistical tests showed that the slope (corresponds to the power in the original non-log formula) has a p value of 7:85×10–10 using MATLAB built-in function anova() on our model.
Calculation of p values
A two-sample t test was used to check for significance of cell-cycle-dependent differences in synergistic reactivation with TNF treatment. The first result for the significance of cell-cycle phases G1, G1/S (n = 11, SD = 2.97) and S (n = 2, SD = 0.25) shows a p value of 0.003. The second result of p = 0.03 for the same hypothesis is based on the same samples for G1, G1/S and G2, G2/M (n = 5, SD = 2.77). Differences were considered statistically significant if the p value was less than 0.05. Significance was indicated as * for p < 0.05 and ** for p < 0.01.
Supplementary Material
KEY RESOURCES TABLE.
| REAGENT or RESOURCE | SOURCE | IDENTIFIER |
|---|---|---|
| Antibodies | ||
| DAPI Nuclear Stain | Sigma-Aldrich | D9542 |
| NUCLEAR-ID® Red DNA Stain | ENZO Life Science Inc. | Cat# EWZ-51008–100 |
| Anti-human CD69 monoclonal antibody (PE), clone FN50 | Thermo Fisher Scientific | Cat# 12–0699-73; RRID: AB_465735 |
| Anti-human CD4 monoclonal antibody (SIM.4) | NIH AIDS Reagent Program | Cat# 724 |
| Goat anti-mouse IgG-PE | Santa Cruz Biotechnology | Cat# sc-3738 |
| Biological Samples | ||
| Single Donor Human Whole Blood | Innovative Research | Cat# IPLA-WB1 |
| Single Donor Human Whole Blood | BioreclamationIVT | Biofluids (Blood-derived), Human whole blood |
| Chemicals, Peptides, and Recombinant Proteins | ||
| Tumor Necrosis Factor alpha (TNF) | R&D Systems | Cat# 210-TA-005 |
| Propidium iodide (PI) | Thermo Fisher Scientific | Cat# P3566 |
| Phorbol 12-myristate 13-acetate (PMA) | Cayman Chemical | Cat# 10008014 |
| Human Interleukin 2 (IL-2) | Miltenyo Biotec Inc | Cat# 130–097-742 |
| Flavopiridol | Cayman Chemical | Cat# 10009197 |
| Prostratin (Pro) | Cayman Chemical | Cat# 10272 |
| Cycloheximide | Cayman Chemical | Cat# 14126 |
| Trichostatin A (TSA) | Cayman Chemical | Cat# 89730 |
| Suberoylanilide hydroxamic acid (SAHA) | Cayman Chemical | Cat# 10574 |
| Ionomycin | Cayman Chemical | Cat# 10004974 |
| Rapamycin | Cayman Chemical | Cat# 53128–88-9 |
| trans-Resveratrol | Cayman Chemical | Cat# 70675 |
| Cytarabine (S-phase arrest) | Cayman Chemical | Cat# 16069 |
| Critical Commercial Assays | ||
| Permeabilization Buffer (Cell Signaling Buffer Set A) | Miltenyi Biotec Inc. | Cat# 130–100-827 |
| 3.9% Fixation Buffer Inside Fix (Cell Signaling Buffer Set A) | Miltenyi Biotec Inc. | Cat# 130–100-827 |
| Cell-Tak Cell and Tissue Adhesive | Corning Life Science | Cat# 354241 |
| Dynabeads Human T-Activator CD3/CD28 | Thermo Fisher Scientific | Cat# 11161D |
| RosetteSep Human CD4+ T cell Enrichment Cocktail | StemCell Technologies, Inc. | Cat# 15022 |
| FuGENE6 Transfection Reagent | Promega | Cat# E2691 |
| Experimental Models: Cell Lines | ||
| JLat 6.3 | NIH AIDS Reagents Program, (Jordan et al., 2003) | Cat# 9846 |
| JLat 9.2 | NIH AIDS Reagents Program, (Jordan et al., 2003) | Cat# 9848 |
| JLat 15.4 | NIH AIDS Reagents Program, (Jordan et al., 2003) | Cat# 9850 |
| HEK293T | ATCC | ATCC CRL-3216 |
| Naive Jurkats, clone E6–1 | ATCC | ATCC TIB-152 |
| Recombinant DNA | ||
| JLat-d2GFP (NL4.3. DeltaEnv-d2GFP) | Weinberger Lab (Gladstone Institutes),(Hansen et al., 2018; Razooky et al., 2015) | N/A |
| UbC-d2GFP | Weinberger Lab (Gladstone Institutes),(Dar et al., 2012) | N/A |
| LTR-d2GFP isoclone 20 | Weinberger Lab (Gladstone Institutes), (Dar et al., 2014) |
N/A |
| LTR-d2GFP polyclonal | Weinberger Lab (Gladstone Institutes), (Dar et al., 2012, 2014) |
N/A |
| LTR-d2GFP-IRES-Tat | Weinberger Lab (Gladstone Institutes), This paper |
N/A |
| Software and Algorithms | ||
| Nikon Elements Software | Nikon Instruments Inc. | https://www.nikoninstruments.com/Products/Software/NIS-Elements-Advanced-Research |
| MATLAB | MathWorks | https://www.mathworks.com/ |
Highlights.
Gene expression bursts from the HIV LTR promoter increase with T cell size
Larger T cells latently infected with HIV exclusively reactivate from latency
Reactivation from HIV latency is cell-cycle dependent, with enhancement in G1
Checkpoint arrestors actively modulate cell cycle to bias viral decision-making
ACKNOWLEDGMENTS
We are grateful to M. Simpson, M. Ott, A. Singh, A. Raj, C. Brooke, G. Underhill, A. Brougham-Cook, and members of the Dar lab for fruitful discussions on the manuscript. We thank B. Pilas and A. Kouris for FACS support at the UIUC Flow Cytometry Facility. E.N.T. and M.R.M. acknowledge support provided by the Cancer Scholars Program at the UIUC. Y.L. and R.D.D. acknowledge support by NIH NIAID (AI120746). JLat full-length clones (6.3, 9.2, and 15.4) were obtained through the NIH AIDS Reagent Program from E. Verdin. We thank L. Weinberger for the kind gift of plasmids.
Footnotes
DECLARATION OF INTERESTS
The authors declare no competing interests.
SUPPLEMENTAL INFORMATION
Supplemental Information includes 10 figures, two tables, and two videos and can be found with this article online at https://doi.org/10.1016/j.celrep.2018.12.009.
SUPPORTING CITATIONS
The following references appear in the Supplemental Information: Chaigne-Delalande et al. (2008); Chen et al. (2017); Cloos et al. (2002); Cruet-Hennequart et al. (2009); Ehsan et al. (1999); Guichard et al. (2015); Johnson et al. (2005); Kanemitsu et al. (2009); Koroxenidou et al. (2005); Lee et al. (2013); Miettinen and Björklund (2015); Mukhopadhyay et al. (2002); Nehmé et al. (2001); Ramirez et al. (2007); Scatena et al. (1999); Schmidt et al. (2009); Shao and Feng (2013); Shi et al. (2015); Singh et al (2012); Willoughby et al. (2009).
REFERENCES
- Andersen JL, Le Rouzic E, and Planelles V (2008). HIV-1 Vpr: mechanisms of G2 arrest and apoptosis. Exp. Mol. Pathol 85, 2–10. [DOI] [PMC free article] [PubMed] [Google Scholar]
- Archin NM, Liberty AL, Kashuba AD, Choudhary SK, Kuruc JD, Crooks AM, Parker DC, Anderson EM, Kearney MF, Strain MC, et al. (2012). Administration of vorinostat disrupts HIV-1 latency in patients on antiretroviral therapy. Nature 487, 482–485. [DOI] [PMC free article] [PubMed] [Google Scholar]
- Balázsi G, van Oudenaarden A, and Collins JJ (2011). Cellular decision making and biological noise: from microbes to mammals. Cell 144, 910–925. [DOI] [PMC free article] [PubMed] [Google Scholar]
- Bernhart E, Stuendl N, Kaltenegger H, Windpassinger C, Donohue N, Leithner A, and Lohberger B (2017). Histone deacetylase inhibitors vorinostat and panobinostat induce G1 cell cycle arrest and apoptosis in multidrug resistant sarcoma cell lines. Oncotarget 8, 77254–77267. [DOI] [PMC free article] [PubMed] [Google Scholar]
- Besnard E, Hakre S, Kampmann M, Lim HW, Hosmane NN, Martin A, Bassik MC, Verschueren E, Battivelli E, Chan J, et al. (2016). The mTOR complex controls HIV latency. Cell Host Microbe 20, 785–797. [DOI] [PMC free article] [PubMed] [Google Scholar]
- Boehm D, Calvanese V, Dar RD, Xing S, Schroeder S, Martins L, Aull K, Li PC, Planelles V, Bradner JE, et al. (2013). BET bromodomain-targeting compounds reactivate HIV from latency via a Tat-independent mechanism. Cell Cycle 12, 452–462. [DOI] [PMC free article] [PubMed] [Google Scholar]
- Bohn-Wippert K, Tevonian EN, Megaridis MR, and Dar RD (2017). Similarity in viral and host promoters couples viral reactivation with host cell migration. Nat. Commun 8, 15006. [DOI] [PMC free article] [PubMed] [Google Scholar]
- Brock A, Chang H, and Huang S (2009). Non-genetic heterogeneity—a mutation-independent driving force for the somatic evolution of tumours. Nat. Rev. Genet 10, 336–342. [DOI] [PubMed] [Google Scholar]
- Caveney PM, Norred SE, Chin CW, Boreyko JB, Razooky BS, Retterer ST, Collier CP, and Simpson ML (2017). Resource Sharing Controls Gene Expression Bursting. ACS Synth. Biol 6, 334–343. [DOI] [PubMed] [Google Scholar]
- Chabot JR, Pedraza JM, Luitel P, and van Oudenaarden A (2007). Stochastic gene expression out-of-steady-state in the cyanobacterial circadian clock. Nature 450, 1249–1252. [DOI] [PubMed] [Google Scholar]
- Chaigne-Delalande B, Guidicelli G, Couzi L, Merville P, Mahfouf W, Bouchet S, Molimard M, Pinson B, Moreau JF, and Legembre P (2008). The immunosuppressor mycophenolic acid kills activated lymphocytes by inducing a nonclassical actin-dependent necrotic signal. J. Immunol 181, 7630–7638. [DOI] [PubMed] [Google Scholar]
- Chen S, Dong S, Li Z, Guo X, Zhang N, Yu B, and Sun Y (2017). Atorvastatin calcium inhibits PDGF-bb-induced proliferation and migration of VSMCs through the G0/G1 cell cycle arrest and suppression of activated PDGFRβ-PI3K-Akt signaling cascade. Cell. Physiol. Biochem 44, 215–228. [DOI] [PubMed] [Google Scholar]
- Chun TW, Stuyver L, Mizell SB, Ehler LA, Mican JA, Baseler M, Lloyd AL, Nowak MA, and Fauci AS (1997). Presence of an inducible HIV-1 latent reservoir during highly active antiretroviral therapy. Proc. Natl. Acad. Sci. USA 94, 13193–13197. [DOI] [PMC free article] [PubMed] [Google Scholar]
- Cloos J, Temmink O, Ceelen M, Snel MH, Leemans CR, and Braakhuis BJ (2002). Involvement of cell cycle control in bleomycin-induced mutagen sensitivity. Environ. Mol. Mutagen 40, 79–84. [DOI] [PubMed] [Google Scholar]
- Cortes MG, Trinh JT, Zeng L, and Balázsi G (2017). Late-arriving signals contribute less to cell-fate decisions. Biophys. J 113, 2110–2120. [DOI] [PMC free article] [PubMed] [Google Scholar]
- Cruet-Hennequart S, Villalan S, Kaczmarczyk A, O’Meara E, Sokol AM, and Carty MP (2009). Characterization of the effects of cisplatin and carboplatin on cell cycle progression and DNA damage response activation in DNA polymerase eta-deficient human cells. Cell Cycle 8, 3039–3050. [PubMed] [Google Scholar]
- Dar RD, and Weiss R (2018). Perspective: engineering noise in biological systems towards predictive stochastic design. APL Bioengineering 2, 020901. [DOI] [PMC free article] [PubMed] [Google Scholar]
- Dar RD, Razooky BS, Singh A, Trimeloni TV, McCollum JM, Cox CD, Simpson ML, and Weinberger LS (2012). Transcriptional burst frequency and burst size are equally modulated across the human genome. Proc. Natl. Acad. Sci. USA 109, 17454–17459. [DOI] [PMC free article] [PubMed] [Google Scholar]
- Dar RD, Hosmane NN, Arkin MR, Siliciano RF, and Weinberger LS (2014). Screening for noise in gene expression identifies drug synergies. Science 344, 1392–1396. [DOI] [PMC free article] [PubMed] [Google Scholar]
- Dar RD, Razooky BS, Weinberger LS, Cox CD, and Simpson ML (2015). The low noise limit in gene expression. PLoS ONE 10, e0140969. [DOI] [PMC free article] [PubMed] [Google Scholar]
- Dar RD, Shaffer SM, Singh A, Razooky BS, Simpson ML, Raj A, and Weinberger LS (2016). Transcriptional bursting explains the noise-versus-mean relationship in mRNA and protein levels. PLoS ONE 11, e0158298. [DOI] [PMC free article] [PubMed] [Google Scholar]
- Davey RT Jr., Bhat N, Yoder C, Chun TW, Metcalf JA, Dewar R, Natarajan V, Lempicki RA, Adelsberger JW, Miller KD, et al. (1999). HIV-1 and T cell dynamics after interruption of highly active antiretroviral therapy (HAART) in patients with a history of sustained viral suppression. Proc. Natl. Acad. Sci. USA 96, 15109–15114. [DOI] [PMC free article] [PubMed] [Google Scholar]
- Deeks SG (2012). HIV: shock and kill. Nature 487, 439–440. [DOI] [PubMed] [Google Scholar]
- Deng K, Pertea M, Rongvaux A, Wang L, Durand CM, Ghiaur G, Lai J, McHugh HL, Hao H, Zhang H, et al. (2015). Broad CTL response is required to clear latent HIV-1 due to dominance of escape mutations. Nature 517, 381–385. [DOI] [PMC free article] [PubMed] [Google Scholar]
- Dolatabadi S, Candia J, Akrap N, Vannas C, Tesan Tomic T, Losert W, Landberg G, Åman P, and Ståhlberg A (2017). Cell cycle and cell size dependent gene expression reveals distinct subpopulations at single-cell level. Front. Genet 8, 1. [DOI] [PMC free article] [PubMed] [Google Scholar]
- Duh EJ, Maury WJ, Folks TM, Fauci AS, and Rabson AB (1989). Tumor necrosis factor alpha activates human immunodeficiency virus type 1 through induction of nuclear factor binding to the NF-kappa B sites in the long terminal repeat. Proc. Natl. Acad. Sci. USA 86, 5974–5978. [DOI] [PMC free article] [PubMed] [Google Scholar]
- Ehsan H, Roef L, Witters E, Reichheld JP, Van Bockstaele D, Inzé D, and Van Onckelen H (1999). Indomethacin-induced G1/S phase arrest of the plant cell cycle. FEBS Lett. 458, 349–353. [DOI] [PubMed] [Google Scholar]
- Finzi D, Hermankova M, Pierson T, Carruth LM, Buck C, Chaisson RE, Quinn TC, Chadwick K, Margolick J, Brookmeyer R, et al. (1997). Identification of a reservoir for HIV-1 in patients on highly active antiretroviral therapy. Science 278, 1295–1300. [DOI] [PubMed] [Google Scholar]
- Foli A, Maiocchi MA, Lisziewicz J, and Lori F (2007). A checkpoint in the cell cycle progression as a therapeutic target to inhibit HIV replication. J. Infect. Dis 196, 1409–1415. [DOI] [PubMed] [Google Scholar]
- Ford JB, Baturin D, Burleson TM, Van Linden AA, Kim YM, and Porter CC (2015). AZD1775 sensitizes T cell acute lymphoblastic leukemia cells to cytarabine by promoting apoptosis over DNA repair. Oncotarget 6, 28001–28010. [DOI] [PMC free article] [PubMed] [Google Scholar]
- Fromentin R, Bakeman W, Lawani MB, Khoury G, Hartogensis W, DaFonseca S, Killian M, Epling L, Hoh R, Sinclair E, et al. (2016). CD4+ T cells expressing PD-1, TIGIT and LAG-3 contribute to HIV persistence during ART. PLoS Pathog. 12, e1005761. [DOI] [PMC free article] [PubMed] [Google Scholar]
- Gillespie DT (1977). Exact stochastic simulation of coupled chemical-reactions. J. Phys. Chem 81, 2340–2361. [Google Scholar]
- Goh WC, Rogel ME, Kinsey CM, Michael SF, Fultz PN, Nowak MA, Hahn BH, and Emerman M (1998). HIV-1 Vpr increases viral expression by manipulation of the cell cycle: a mechanism for selection of Vpr in vivo. Nat. Med 4, 65–71. [DOI] [PubMed] [Google Scholar]
- Guichard A, Humbert P, Tissot M, Muret P, Courderot-Masuyer C, and Viennet C (2015). Effects of topical corticosteroids on cell proliferation, cell cycle progression and apoptosis: in vitro comparison on HaCaT. Int. J. Pharm 479, 422–429. [DOI] [PubMed] [Google Scholar]
- Gupta PB, Fillmore CM, Jiang G, Shapira SD, Tao K, Kuperwasser C, and Lander ES (2011). Stochastic state transitions give rise to phenotypic equilibrium in populations of cancer cells. Cell 146, 633–644. [DOI] [PubMed] [Google Scholar]
- Hansen MMK, Wen WY, Ingerman E, Razooky BS, Thompson CE, Dar RD, Chin CW, Simpson ML, and Weinberger LS (2018). A posttranscriptional feedback mechanism for noise suppression and fate stabilization. Cell 173, 1609–1621. [DOI] [PMC free article] [PubMed] [Google Scholar]
- Hawley T, Spear M, Guo J, and Wu Y (2013). Inhibition of HIV replication in vitro by clinical immunosuppressants and chemotherapeutic agents. Cell Biosci. 3, 22. [DOI] [PMC free article] [PubMed] [Google Scholar]
- Ho YC, Shan L, Hosmane NN, Wang J, Laskey SB, Rosenbloom DI, Lai J, Blankson JN, Siliciano JD, and Siliciano RF (2013). Replicationcompetent noninduced proviruses in the latent reservoir increase barrier to HIV-1 cure. Cell 155, 540–551. [DOI] [PMC free article] [PubMed] [Google Scholar]
- Hurst J, Hoffmann M, Pace M, Williams JP, Thornhill J, Hamlyn E, Meyerowitz J, Willberg C, Koelsch KK, Robinson N, et al. (2015). Immunological biomarkers predict HIV-1 viral rebound after treatment interruption. Nat. Commun 6, 8495. [DOI] [PMC free article] [PubMed] [Google Scholar]
- Jenkins JK, Suwannaroj S, Elbourne KB, Ndebele K, and McMurray RW (2001). 17-beta-estradiol alters Jurkat lymphocyte cell cycling and induces apoptosis through suppression of Bcl-2 and cyclin A. Int. Immunopharmacol 1, 1897–1911. [DOI] [PubMed] [Google Scholar]
- Joe AK, Liu H, Suzui M, Vural ME, Xiao D, and Weinstein IB (2002). Resveratrol induces growth inhibition, S-phase arrest, apoptosis, and changes in biomarker expression in several human cancer cell lines. Clin. Cancer Res 8, 893–903. [PubMed] [Google Scholar]
- Johnson FM, Saigal B, Talpaz M, and Donato NJ (2005). Dasatinib (BMS-354825) tyrosine kinase inhibitor suppresses invasion and induces cell cycle arrest and apoptosis of head and neck squamous cell carcinoma and non-small cell lung cancer cells. Clin. Cancer Res 11, 6924–6932. [DOI] [PubMed] [Google Scholar]
- Jordan A, Bisgrove D, and Verdin E (2003). HIV reproducibly establishes a latent infection after acute infection of T cells in vitro. EMBO J. 22, 1868–1877. [DOI] [PMC free article] [PubMed] [Google Scholar]
- Kanemitsu H, Yamauchi H, Komatsu M, Yamamoto S, Okazaki S, Uchida K, and Nakayama H (2009). 6-Mercaptopurine (6-MP) induces cell cycle arrest and apoptosis of neural progenitor cells in the developing fetal rat brain. Neurotoxicol. Teratol 31, 104–109. [DOI] [PubMed] [Google Scholar]
- Kepler TB, and Elston TC (2001). Stochasticity in transcriptional regulation: origins, consequences, and mathematical representations. Biophys. J 81, 3116–3136. [DOI] [PMC free article] [PubMed] [Google Scholar]
- Keren L, van Dijk D, Weingarten-Gabbay S, Davidi D, Jona G, Weinberger A, Milo R, and Segal E (2015). Noise in gene expression is coupled to growth rate. Genome Res. 25, 1893–1902. [DOI] [PMC free article] [PubMed] [Google Scholar]
- Kessing CF, Nixon CC, Li C, Tsai P, Takata H, Mousseau G, Ho PT, Honeycutt JB, Fallahi M, Trautmann L, et al. (2017). In vivo suppression of HIV rebound by didehydro-cortistatin A, a “block-and-lock” strategy for HIV-1 treatment. Cell Rep. 21, 600–611. [DOI] [PMC free article] [PubMed] [Google Scholar]
- Koroxenidou L, Ohlson LC, and Porsch Hällström I (2005). Long-term 17alpha-ethinyl estradiol treatment decreases cyclin E and cdk2 expression, reduces cdk2 kinase activity and inhibits S phase entry in regenerating rat liver. J. Hepatol 43, 478–484. [DOI] [PubMed] [Google Scholar]
- Kumar A, Abbas W, Colin L, Khan KA, Bouchat S, Varin A, Larbi A, Gatot JS, Kabeya K, Vanhulle C, et al. (2016). Tuning of AKT-pathway by Nef and its blockade by protease inhibitors results in limited recovery in latently HIV infected T-cell line. Sci. Rep 6, 24090. [DOI] [PMC free article] [PubMed] [Google Scholar]
- Lassen KG, Hebbeler AM, Bhattacharyya D, Lobritz MA, and Greene WC (2012). A flexible model of HIV-1 latency permitting evaluation of many primary CD4 T-cell reservoirs. PLoS ONE 7, e30176. [DOI] [PMC free article] [PubMed] [Google Scholar]
- Lee HT, Choi MR, Doh MS, Jung KH, and Chai YG (2013). Effects of the monoamine oxidase inhibitors pargyline and tranylcypromine on cellular proliferation in human prostate cancer cells. Oncol. Rep 30, 1587–1592. [DOI] [PMC free article] [PubMed] [Google Scholar]
- Martin AR, Pollack RA, Capoferri A, Ambinder RF, Durand CM, and Siliciano RF (2017). Rapamycin-mediated mTOR inhibition uncouples HIV-1 latency reversal from cytokine-associated toxicity. J. Clin. Invest 127, 651–656. [DOI] [PMC free article] [PubMed] [Google Scholar]
- Mattern CF, Brackett FS, and Olson BJ (1957). Determination of number and size of particles by electrical gating: blood cells. J. Appl. Physiol 10, 56–70. [DOI] [PubMed] [Google Scholar]
- Megaridis MR, Lu Y, Tevonian EN, Junger KM, Moy JM, Bohn-Wippert K, and Dar RD (2018). Fine-tuning of noise in gene expression with nucleosome remodeling. APL Bioengineering 2, 026106. [DOI] [PMC free article] [PubMed] [Google Scholar]
- Meyer HM, and Roeder AH (2014). Stochasticity in plant cellular growth and patterning. Front. Plant Sci 5, 420. [DOI] [PMC free article] [PubMed] [Google Scholar]
- Miettinen TP, and Björklund M (2015). Mevalonate pathway regulates cell size homeostasis and proteostasis through autophagy. Cell Rep. 13, 2610–2620. [DOI] [PMC free article] [PubMed] [Google Scholar]
- Mukhopadhyay T, Sasaki J, Ramesh R, and Roth JA (2002). Mebendazole elicits a potent antitumor effect on human cancer cell lines both in vitro and in vivo. Clin. Cancer Res 8, 2963–2969. [PubMed] [Google Scholar]
- Murooka TT, Deruaz M, Marangoni F, Vrbanac VD, Seung E, von Andrian UH, Tager AM, Luster AD, and Mempel TR (2012). HIV-infected T cells are migratory vehicles for viral dissemination. Nature 490, 283–287. [DOI] [PMC free article] [PubMed] [Google Scholar]
- Nehmé A, Varadarajan P, Sellakumar G, Gerhold M, Niedner H, Zhang Q, Lin X, and Christen RD (2001). Modulation of docetaxel-induced apoptosis and cell cycle arrest by all-trans retinoic acid in prostate cancer cells. Br. J. Cancer 84, 1571–1576. [DOI] [PMC free article] [PubMed] [Google Scholar]
- Ozbudak EM, Thattai M, Kurtser I, Grossman AD, and van Oudenaarden A (2002). Regulation of noise in the expression of a single gene. Nat. Genet 31, 69–73. [DOI] [PubMed] [Google Scholar]
- Padovan-Merhar O, Nair GP, Biaesch AG, Mayer A, Scarfone S, Foley SW, Wu AR, Churchman LS, Singh A, and Raj A (2015). Single mammalian cells compensate for differences in cellular volume and DNA copy number through independent global transcriptional mechanisms. Mol. Cell 58, 339–352. [DOI] [PMC free article] [PubMed] [Google Scholar]
- Peccoud J, and Ycart B (1995). Markovian modeling of gene-product synthesis. Theor. Popul. Biol 48, 222–234. [Google Scholar]
- Raj A, and van Oudenaarden A (2008). Nature, nurture, or chance: stochastic gene expression and its consequences. Cell 135, 216–226. [DOI] [PMC free article] [PubMed] [Google Scholar]
- Ramirez JM, Ocio EM, San Miguel JF, and Pandiella A (2007). Pemetrexed acts as an antimyeloma agent by provoking cell cycle blockade and apoptosis. Leukemia 21, 797–804. [DOI] [PubMed] [Google Scholar]
- Razooky BS, Gutierrez E, Terry VH, Spina CA, Groisman A, and Weinberger LS (2012). Microwell devices with finger-like channels for long-term imaging of HIV-1 expression kinetics in primary human lymphocytes. Lab Chip 12, 4305–4312. [DOI] [PMC free article] [PubMed] [Google Scholar]
- Razooky BS, Pai A, Aull K, Rouzine IM, and Weinberger LS (2015). A hardwired HIV latency program. Cell 160, 990–1001. [DOI] [PMC free article] [PubMed] [Google Scholar]
- Razooky BS, Cao Y, Hansen MMK, Perelson AS, Simpson ML, and Weinberger LS (2017). Nonlatching positive feedback enables robust bimodality by decoupling expression noise from the mean. PLoS Biol. 15, e2000841. [DOI] [PMC free article] [PubMed] [Google Scholar]
- Richman DD, Margolis DM, Delaney M, Greene WC, Hazuda D, and Pomerantz RJ (2009). The challenge of finding a cure for HIV infection. Science 323, 1304–1307. [DOI] [PubMed] [Google Scholar]
- Ruelas DS, and Greene WC (2013). An integrated overview of HIV-1 latency. Cell 155, 519–529. [DOI] [PMC free article] [PubMed] [Google Scholar]
- Sampath D, Cortes J, Estrov Z, Du M, Shi Z, Andreeff M, Gandhi V, and Plunkett W (2006). Pharmacodynamics of cytarabine alone and in combination with 7-hydroxystaurosporine (UCN-01) in AML blasts in vitro and during a clinical trial. Blood 107, 2517–2524. [DOI] [PMC free article] [PubMed] [Google Scholar]
- Scatena R, Nocca G, Sole PD, Rumi C, Puggioni P, Remiddi F, Bottoni P, Ficarra S, and Giardina B (1999). Bezafibrate as differentiating factor of human myeloid leukemia cells. Cell Death Differ. 6, 781–787. [DOI] [PubMed] [Google Scholar]
- Schmidt LJ, Regan KM, Anderson SK, Sun Z, Ballman KV, and Tindall DJ (2009). Effects of the 5 alpha-reductase inhibitor dutasteride on gene expression in prostate cancer xenografts. Prostate 69, 1730–1743. [DOI] [PMC free article] [PubMed] [Google Scholar]
- Shan L, Deng K, Shroff NS, Durand CM, Rabi SA, Yang HC, Zhang H, Margolick JB, Blankson JN, and Siliciano RF (2012). Stimulation of HIV-1-specific cytolytic T lymphocytes facilitates elimination of latent viral reservoir after virus reactivation. Immunity 36, 491–501. [DOI] [PMC free article] [PubMed] [Google Scholar]
- Shao J, and Feng G (2013). Selective killing effect of oxytetracycline, propafenone and metamizole on A549 or Hela cells. Chin. J. Cancer Res 25, 662–670. [DOI] [PMC free article] [PubMed] [Google Scholar]
- Shi XN, Li H, Yao H, Liu X, Li L, Leung KS, Kung HF, and Lin MC (2015). Adapalene inhibits the activity of cyclin-dependent kinase 2 in colorectal carcinoma. Mol. Med. Rep 12, 6501–6508. [DOI] [PMC free article] [PubMed] [Google Scholar]
- Simpson ML, Cox CD, and Sayler GS (2004). Frequency domain chemical Langevin analysis of stochasticity in gene transcriptional regulation. J. Theor. Biol 229, 383–394. [DOI] [PubMed] [Google Scholar]
- Singer ZS, Yong J, Tischler J, Hackett JA, Altinok A, Surani MA, Cai L, and Elowitz MB (2014). Dynamic heterogeneity and DNA methylation in embryonic stem cells. Mol. Cell 55, 319–331. [DOI] [PMC free article] [PubMed] [Google Scholar]
- Singh A, Razooky B, Cox CD, Simpson ML, and Weinberger LS (2010). Transcriptional bursting from the HIV-1 promoter is a significant source of stochastic noise in HIV-1 gene expression. Biophys. J 98, L32–L34. [DOI] [PMC free article] [PubMed] [Google Scholar]
- Singh A, Razooky BS, Dar RD, and Weinberger LS (2012). Dynamics of protein noise can distinguish between alternate sources of gene-expression variability. Mol. Syst. Biol 8, 607. [DOI] [PMC free article] [PubMed] [Google Scholar]
- Skinner SO, Xu H, Nagarkar-Jaiswal S, Freire PR, Zwaka TP, and Golding I (2016). Single-cell analysis of transcription kinetics across the cell cycle. eLife 5, e12175. [DOI] [PMC free article] [PubMed] [Google Scholar]
- Spina CA, Anderson J, Archin NM, Bosque A, Chan J, Famiglietti M, Greene WC, Kashuba A, Lewin SR, Margolis DM, et al. (2013). An in-depth comparison of latent HIV-1 reactivation in multiple cell model systems and resting CD4+ T cells from aviremic patients. PLoS Pathog. 9, e1003834. [DOI] [PMC free article] [PubMed] [Google Scholar]
- St-Pierre F, and Endy D (2008). Determination of cell fate selection during phage lambda infection. Proc. Natl. Acad. Sci. USA 105, 20705–20710. [DOI] [PMC free article] [PubMed] [Google Scholar]
- Stellbrink HJ, van Lunzen J, Westby M, O’Sullivan E, Schneider C, Adam A, Weitner L, Kuhlmann B, Hoffmann C, Fenske S, et al. (2002). Effects of interleukin-2 plus highly active antiretroviral therapy on HIV-1 replication and proviral DNA (COSMIC trial). AIDS 16, 1479–1487. [DOI] [PubMed] [Google Scholar]
- Szotek EL, Narasipura SD, and Al-Harthi L (2013). 17β-Estradiol inhibits HIV-1 by inducing a complex formation between β-catenin and estrogen receptor α on the HIV promoter to suppress HIV transcription. Virology 443, 375–383. [DOI] [PMC free article] [PubMed] [Google Scholar]
- Wang J, Reuschel EL, Shackelford JM, Jeang L, Shivers DK, Diehl JA, Yu XF, and Finkel TH (2011). HIV-1 Vif promotes the G1-to S-phase cell-cycle transition. Blood 117, 1260–1269. [DOI] [PMC free article] [PubMed] [Google Scholar]
- Wang X, Fujimaki K, Mitchell GC, Kwon JS, Della Croce K, Langsdorf C, Zhang HH, and Yao G (2017). Exit from quiescence displays a memory of cell growth and division. Nat. Commun 8, 321. [DOI] [PMC free article] [PubMed] [Google Scholar]
- Waysbort N, Russ D, Chain BM, and Friedman N (2013). Coupled IL-2-dependent extracellular feedbacks govern two distinct consecutive phases of CD4 T cell activation. J. Immunol 191, 5822–5830. [DOI] [PubMed] [Google Scholar]
- Weinberger LS, Burnett JC, Toettcher JE, Arkin AP, and Schaffer DV (2005). Stochastic gene expression in a lentiviral positive-feedback loop: HIV-1 Tat fluctuations drive phenotypic diversity. Cell 122, 169–182. [DOI] [PubMed] [Google Scholar]
- Weinberger LS, Dar RD, and Simpson ML (2008). Transient-mediated fate determination in a transcriptional circuit of HIV. Nat. Genet 40, 466–470. [DOI] [PubMed] [Google Scholar]
- Wiegand A, Spindler J, Hong FF, Shao W, Cyktor JC, Cillo AR, Halvas EK, Coffin JM, Mellors JW, and Kearney MF (2017). Single-cell analysis of HIV-1 transcriptional activity reveals expression of proviruses in expanded clones during ART. Proc. Natl. Acad. Sci. USA 114, E3659–E3668. [DOI] [PMC free article] [PubMed] [Google Scholar]
- Willoughby JA Sr., Sundar SN, Cheung M, Tin AS, Modiano J, and Firestone GL (2009). Artemisinin blocks prostate cancer growth and cell cycle progression by disrupting Sp1 interactions with the cyclin-dependent kinase-4 (CDK4) promoter and inhibiting CDK4 gene expression. J. Biol. Chem 284, 2203–2213. [DOI] [PMC free article] [PubMed] [Google Scholar]
- Zeng L, Skinner SO, Zong C, Sippy J, Feiss M, and Golding I (2010). Decision making at a subcellular level determines the outcome of bacteriophage infection. Cell 141, 682–691. [DOI] [PMC free article] [PubMed] [Google Scholar]
- Zhao YM, Zhou Q, Xu Y, Lai XY, and Huang H (2008). Antiproliferative effect of rapamycin on human T-cell leukemia cell line Jurkat by cell cycle arrest and telomerase inhibition. Acta Pharmacol. Sin 29, 481–488. [DOI] [PubMed] [Google Scholar]
Associated Data
This section collects any data citations, data availability statements, or supplementary materials included in this article.