

Abstract
The spread of Zika virus (ZIKV) infection across the USA and various countries in the last three years will not only have a direct impact on the U.S. health care system but has caused international concerns as well. The ultimate impact of ZIKV infection remains to be understood. Currently, there are no therapeutic or vaccine options available to protect those infected by ZIKV. The drug ivermectin (IVM) was found to be a viable agent for the prevention of transmission of ZIKV. Ivermectin is unstable in the presence of water and does not remain in adequate concentration in the human bloodstream to be effective in treatment for ZIKV. Biodegradable nanoparticles would aid in the delivery of ivermectin by providing a high enough concentration of drug and ensuring the drug is gradually released to maintain an appropriate level in the body. The overall goal of this study was to develop and optimize an orally administrable nanoformulation of IVM which can circulate in the blood for a long period for efficient delivery. To achieve the goal, we synthesized and optimized a synthetic nanoformulation of IVM for oral use which can cross the intestinal epithelial barrier to enter the bloodstream. Our studies documented that when delivered with the synthetic nanoparticle (NP), IVM can be accumulated in the blood at a higher concentration and preliminary studies highlighted that NP delivered IVM has the ability to target nonstructural 1 protein of ZIKV. For potential clinical relevance, long-term storable formulation of IVM-nanoparticle in dry powder state for inclusion in a capsule form and cryoprotectant containing frozen forms revealed promising findings. Further, our preliminary in vitro studies documented that ivermectin crosses the placental barrier, thus making it unsafe for the pregnant ZIKV population, whereas the ivermectin-loaded nanoparticle did not show any significant placental barrier crossing, thus indicating its potential suitability for such population. We envision that this work will fill a great unmet need by developing safer and more effective therapies for the treatment of viral infections, including ZIKV.
Keywords: oral delivery, viral disease, dry formulation, placental barrier, epithelial crossing, Fc receptor
Graphical Abstract

The rapid spread of ZIKV across the USA is anticipated to have a direct impact on the U.S. health care system as it is known to cause microcephaly as well as a spectrum of neurologic problems including seizures in newborn babies and Guillain–Barre syndrome in adults. The ultimate scale and impact of ZIKV remain to be determined. It is likely that these severe abnormalities recognized at birth only represent the tip of the iceberg. There is a great unmet need to develop strategies to detect ZIKV early, but more critically, new treatment strategies are urgently needed to prevent the further spread of ZIKV to protect newborn babies exposed to the infection.1–9 The vaccine candidates of ZIKV are known to have adverse effects in pregnant women, infants, and immunocompromised individuals.10 To address the immediate need for therapy against ZIKV, a collection of Food and Drug Administration (FDA)-approved antiviral drugs were tested for their ability to inhibit ZIKV.9 This work identified more than 20 agents that decreased ZIKV infection in HuH-7 cells. Among these drug candidates, the most potent were ivermectin (IVM), mycophenolic acid (MPA), and daptomycin. The EC50 values for IVM were between 1 and 10 mM. Ivermectin, “the wonder drug”, is a highly potent inhibitor of the Yellow Fever Virus.7 We anticipated that development and optimization of a new formulation of IVM, rather than MPA, which is quite toxic, and daptomycin, due to its high cost and inconvenient IV formulation, can be highly attractive for ZIKV infection. The concentration of IVM at which inhibitory effects on ZIKV infection can be achieved might cause toxic effects when applied to human population. Further, the maximum plasma concentrations of IVM in human after an injected dose (ID) of 150 μg/kg is typically in the range of 9–75 ng/mL.11 The use of IVM in nanodevices has been investigated by a few groups. Most of these technologies make use of hybrid lipid and polyanhydride-based materials. These nanodevices were employed to study the effect of ivermectin as an antiparasitic agent or against microfilaria and scabies.12–20 However, most of these nanomaterials lack detailed characterization, targeted delivery to a specific site, or antiviral activity (Table S1). Additionally, there is low IVM loading in these NPs which typically are large in size, limiting their translation to therapeutic use. We anticipated that to control transmission of ZIKV, even higher doses of this drug are required. Targeted nanoparticles (NPs) can differentially deliver drugs to the site of interest in the body to improve the therapeutic index of drugs. Polymeric NPs of poly(lactide-co-glycolide)-b-poly-ethylene glycol (PLGA-b-PEG) block copolymers are especially promising as drug delivery vehicles.21–24 The core–shell structure of polymeric NPs allows them to encapsulate and carry poorly water-soluble drugs such as IVM, resulting in long circulation half-life for the drug, release drugs at a sustained rate, and functionalization with targeting ligands to modulate the delivery method to target specific regions. Here, we report a controlled released targeted NP with the ability to supply slow therapeutic dose of IVM over a prolonged period when administered via an oral route. Simplicity and patient compliance make the oral route the preferred mode for delivery of most drugs. This is one of the major reasons oral drug delivery will continue to dominate the pharmaceutical market and will be a target for drug delivery research.
RESULTS AND DISCUSSION
Development of Orally Administrable Nanoparticle for Ivermectin Delivery.
We focused on biocompatible targeting strategies, FDA-approved polymer components, and the use of an FDA-approved drug IVM to provide an efficient and safer therapeutic platform for ZIKV. A number of factors need to be considered to design and optimize a nanoformulation of ivermectin, which can be administered orally for Zika-infected patients: (i) the efficacy will depend on the stability of the NP under acidic pH of the stomach, NP capacity to show intestinal absorption, and ability of the NP to cross the intestinal epithelium to reach the circulatory system and (ii) an NP needs to have an appropriate pharmacokinetic (PK) profile that can result in a concentration of IVM in the circulation that is safe to the individual while resulting in an effective therapeutic dose. Ideally, there should be a sustained concentration of the drug for a prolonged period of time since repeated drug administration over short time-windows to keep the plasma drug level at a therapeutic level poses considerable challenges and is not practical in terms of patient compliance and comfort. An NP for IVM delivery should thus have the ability to release this drug in a controlled fashion to fit the window of effectiveness over a prolonged period of time, thus eliminating the need of repeated dosing, and for oral formulation, stability of the NP under acidic pH requires that these NPs are engineered with acid-resistant chemical linkages. Considering the above-mentioned criteria, an ideal NP system for oral delivery of IVM needs to have pH stability, intestinal absorption, and epithelium crossing ability and should also demonstrate high IVM loading capacity and controlled release of the drug. It is also critical that orally delivered NP transports the payload efficiently from the intestine to the bloodstream.25–27 The neonatal Fc receptor (FcRn) mediates immunoglobulin G (IgG) transport across the polarized epithelial barriers.28,29 FcRn is expressed at a level that is closely similar to fetal expression in the apical region of epithelial cells in the small intestine and diffuse throughout the colon in adulthood.30 FcRn binds to the Fc portion of IgG following a pH-driven pathway; acidic pH of <6.5 promotes binding of Fc to FcRn, and physiological pH of ~7.4 releases the Fc from the FcRn binding pocket (Figure 1A).31 A few recent studies demonstrated that Fc-decorated nanovehicles show enhanced crossing of the intestinal barrier into the bloodstream when administered orally.32 We hypothesized that development of a biodegradable yet acidic pH-resistant NP can be constructed by encapsulating IVM inside the core of NPs and decorating the surface with the Fc fragment for oral administration. Thus, we devised a biodegradable PLGA polymer based platform (Figure 1B). The linkers on the polymer are comparatively acid resistant to provide stability to the NPs under acidic conditions in the stomach when administered via an oral route (Figure 1B). All monomers and polymers were characterized by spectroscopic and mass spectrometry based techniques (Figures S1–S4). The polymers were also analyzed by gel permeation chromatography (GPC), demonstrating purity and monodisperse distribution (Figure 1C). First, we carried out encapsulation of IVM in the PLGA-b-PEG-Mal polymer. For this study, we used 10, 20, 30, 40, and 50% feed of IVM with respect to the polymer. The NPs were synthesized by a nanoprecipitation method (Figure 1D). The drug-loaded NPs were characterized by dynamic light scattering (DLS) for size and surface charge (Figure 2A, Figures S5 and S6). The morphology of IVM-loaded NPs was determined by transmission electron microscopy (TEM) confirming spherical, homogeneous particle population (Figure S7). Concentrations of IVM in the NPs were quantified using high-performance liquid chromatography (HPLC). We observed an increase in the size of NT-Mal-IVM-NP as the percent feed of IVM was increased (Figure 2A). As the IVM feed was increased from 10% to 50%, the NP size increased from ~60 to 140 nm. The NPs gave a very stable surface charge of nearly around −25.0 mV. The NPs with feed of 10% to 30% showed PDI ~ 0.21, which suggested the formation of monodisperse particles. The 40% and 50% showed higher PDI of ~0.45 indicating formation of higher aggregates. These studies established that the most well-defined and stable NPs can be achieved by IVM feed up to 30%.
Figure 1.
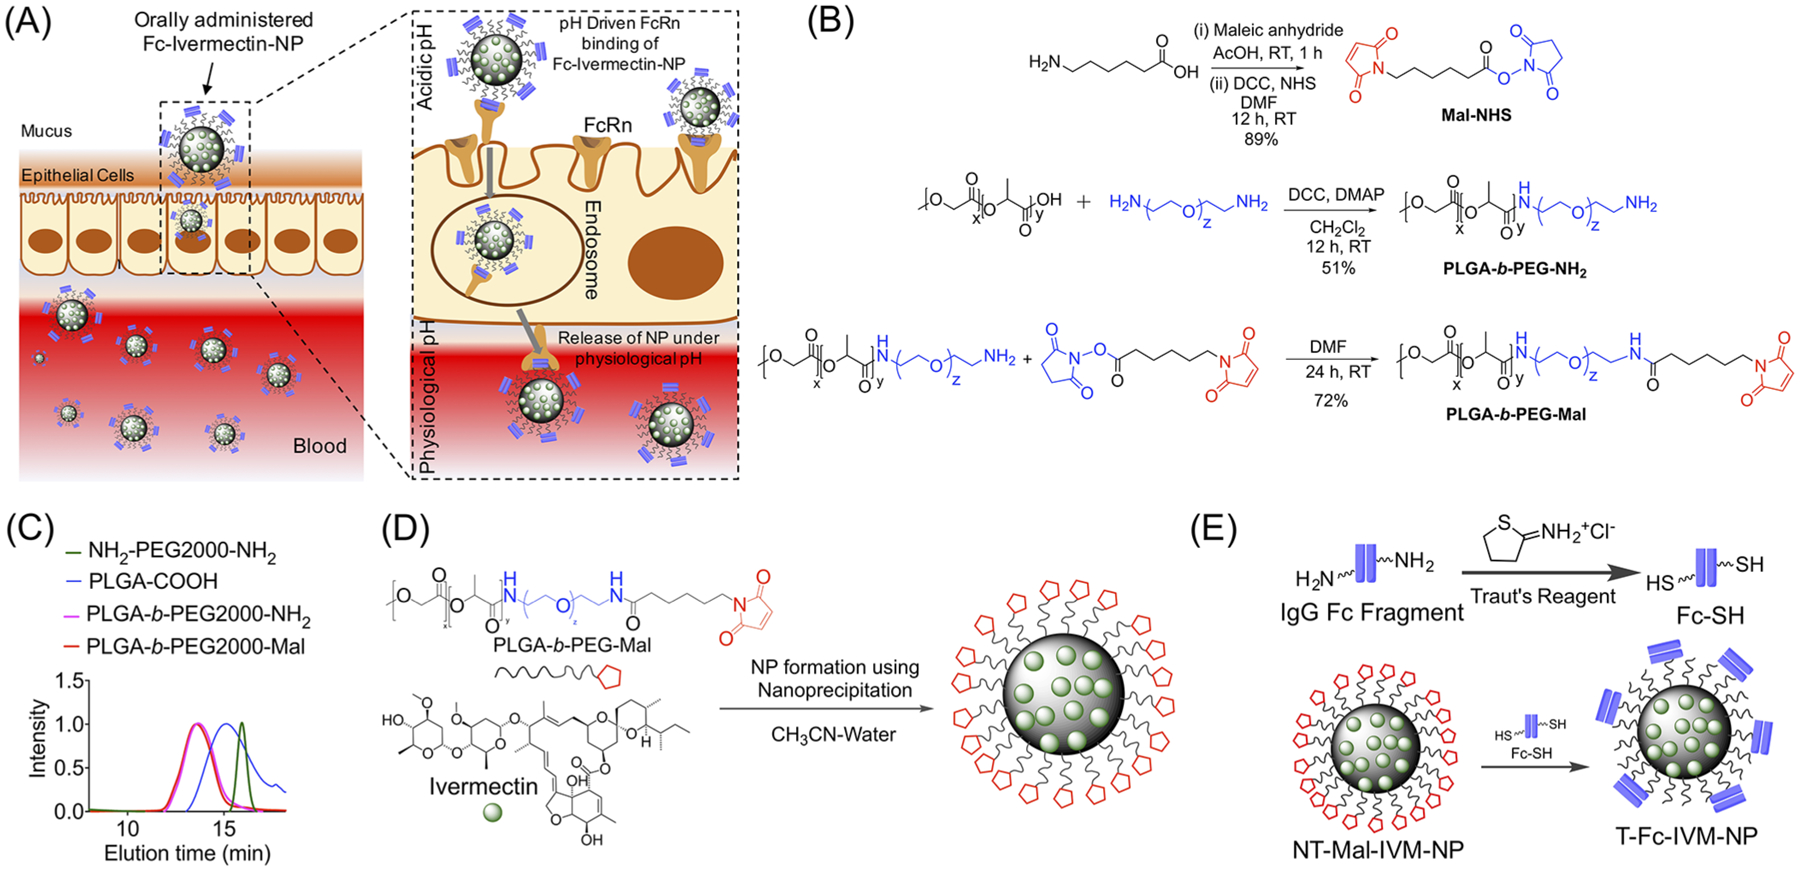
(A) FcRn binds to Fc-Ivermectin-NPs in an acidic environment, NPs transcytose across the epithelial-cell barrier and get release at physiological pH of blood. (B) Synthetic strategy of PLGA-b-PEG-Mal. (C) GPC traces of the polymers. (D) Synthesis of IVM loaded NPs using nanoprecipitation. (E) Incorporation of targeting antibody Fc on the NPs.
Figure 2.
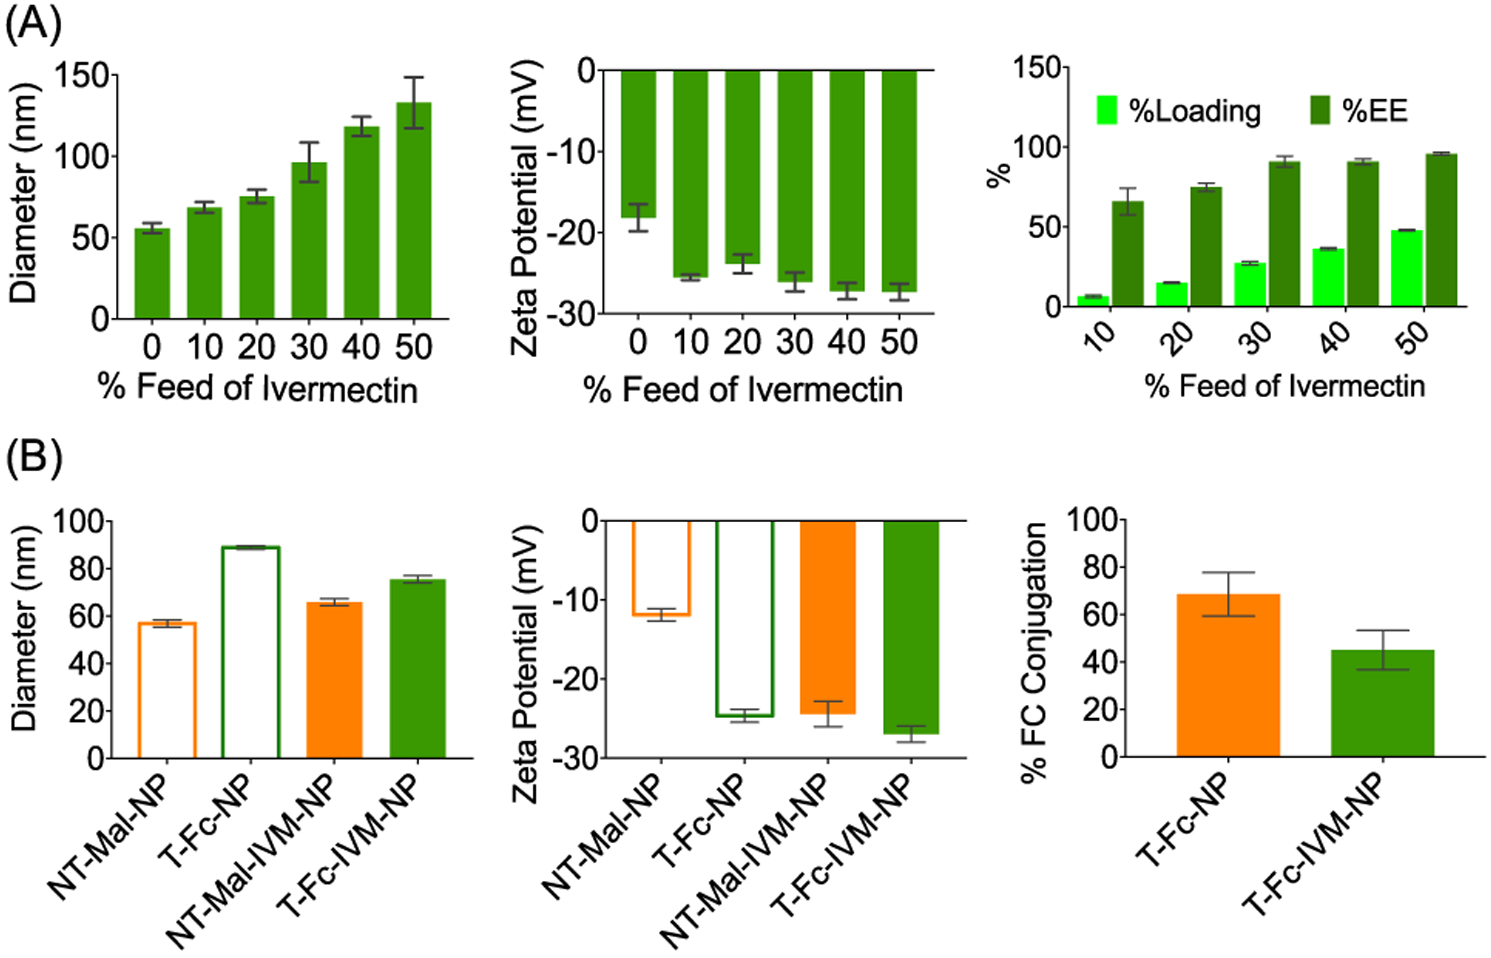
(A) Characterization of IVM-loaded NPs by DLS and percent loading and encapsulation efficiency by HPLC. (B) Characterization of targeted Fc-conjugated NPs by DLS and determination of Fc conjugation efficiency by the bicinchoninic acid assay (BCA).
Polyclonal IgG Fc fragments were covalently conjugated on top of the NT-Mal-NPs using thiol–ene chemistry. 2-Iminothiolane (Traut’s reagent) was used to modify the NH2 groups of Fc fragments (FcNH2) to thiol groups (Fc-SH). Fc-SH was incubated with NPs for conjugation overnight at 4 °C (Figure 1E). As a control, the NPs were allowed to react with the precursor FcNH2 fragment. The resultant NPs from this treatment showed similar size (~60 nm) and zeta potential (~−12 mV) as NT-Mal-NPs, indicating no attachment of Fc on the NP surface. T-Fc-NPs were purified via centrifugation and characterized by DLS (Figure 2B and Figures S8 and S9). The Fc-SH-attached NPs showed increased diameter (~88 nm) and more negative zeta potential (~−22 mV). This increase is due to the covalent attachment of the Fc-SH on the NT-Mal-NPs. Determination of Fc conjugation efficiency by the bicinchoninic acid assay (BCA assay) indicated high conjugation efficiency of ~60% for empty NPs and ~40% for 20% IVM feed loaded NPs (Figure 2B).
Transport of T-Fc-IVM-NPs across an in Vitro Intestinal Epithelial Barrier Model.
Caco-2 cells express human FcRn and human b2-microglobulin. We carried out NP transport ability across the Caco-2 monolayer by quantifying IVM in the apical (AP) and basolateral (BL) side media using HPLC (Figure 3A). Caco-2 cells were plated in a trans-well plate on the apical side. On the basolateral side, 1 mL of media was added and the cells were grown up to 9 days. Before the addition of NPs, the monolayer integrity was checked by measuring the trans-epithelial resistance (TEER) indicating TEER values of >1000 Ω/cm2 on day 9 (Figure 3B, top). Media was replenished once every 2 days. On the ninth day, T-Fc-IVM-NP or NT-OH-IVM-NP was added to the apical side of the barrier and incubated for 12 h. In this study, NT-OH-NP constructed using PLGA-b-PEG-OH polymer was used as a nontargeted control since -Mal containing NPs can interact with biological thiols or other reactive groups. Addition of NPs did not change the tight junction function of the epithelial barrier as evident from intact TEER (Figure 3B, bottom) and the expression of tight junction protein zonula occludens-1 (ZO-1) (Figure 3C). The media from apical and basolateral sites were collected and stored at room temperature. The cells on the apical side were washed with PBS, trypsinized, and centrifuged to have a pellet for NP quantification. The targeted T-Fc-IVM-NPs were found at a much higher concentration in the basolateral side compared to the nontargeted NT-OH-IVM-NPs (Figure 3D). To make sure that the we are quantifying the NP but not the released IVM, we repeated this experiment by incorporating PLGA-coated quantum dots into the T-Fc and NT-Mal NP by generating T-Fc-QD-NP and NT-Mal-QD-NPs (Figure S10). Incorporation of QD allowed us to determine NP concentration in the apical medium and basolateral media by more sensitive and quantitative inductively coupled plasma mass spectrometry (ICP-MS) by analyzing cadmium. These data further confirmed transport of the targeted NPs across the epithelial barrier (Figure S11). We also carried out experiments where free IgG Fc was added to block the FcRn receptors before adding the NPs. Blocking of the receptors resulted reduced transcytosis of the T-Fc-IVM-NPs across the barrier (Figure 3E).
Figure 3.
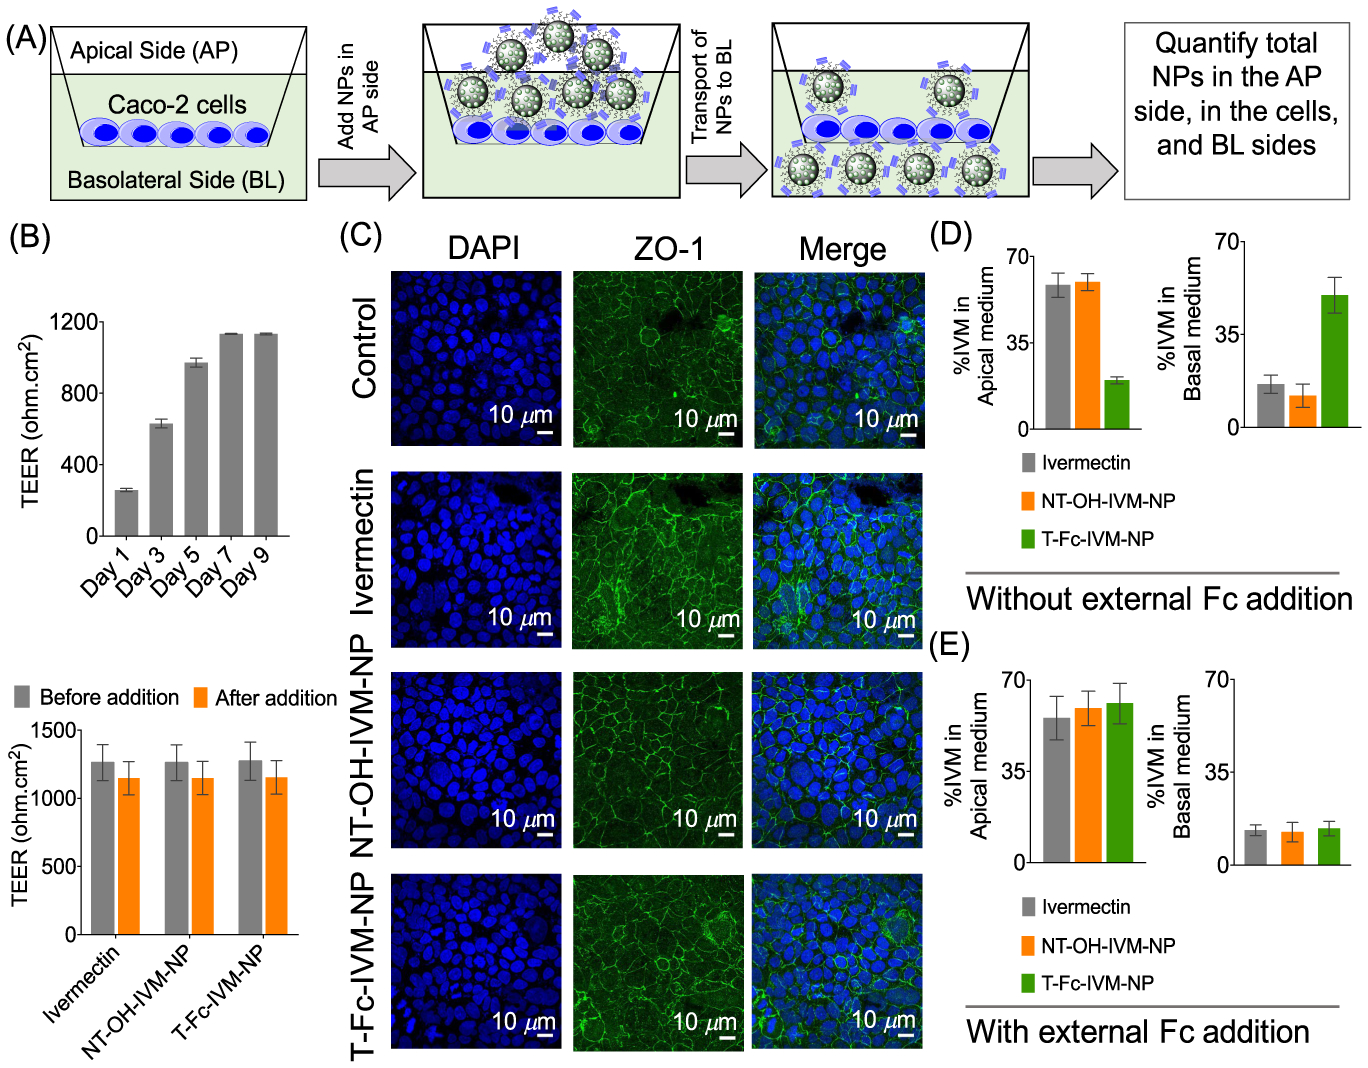
(A) Cartoon of transcytosis of Fc-NP across the trans-epithelial barrier derived from Caco-2 cells. (B) Formation of tight junction was confirmed by measuring the TEER values and intact TEER after addition of NPs. (C) Expression of tight junction protein zonula occludens-1 (ZO-1). Quantification of NPs in the apical and basolateral sides of the barrier (D) in the absence and (E) in the presence of external Fc.
In Vivo Distribution of T-Fc-NP after Oral Administration.
We used Balb/c Albino mice to understand the distribution properties of T-Fc-NP after oral administration. NT-OH-NP was used as a nontargeted control. Animals were divided in three groups, each group containing three animals. Group assignments were: group 1, saline; group 2, NT-OH-QD-NP; and group 3, T-Fc-QD-NP. The animals in each group received saline, targeted, or nontargeted NPs via oral gavage. The dose of NP was 50 mg/kg with respect to total polymer. After 24 h, biodistribution was followed by performing ICP-MS on digested organs and plasma. This study indicated that the targeted NPs were able to cross the intestine barrier effectively and reach the bloodstream. After 24 h, ~65% of injected NP was distributed in the blood and ~24% was still distributed in different parts of intestine (Figure 4A). We observed some important differences in the biodistribution and absorption efficiency of T-Fc-NP and NT-OH-NP. As demonstrated in Figure 4A, for the NT-OH-NPs, a significantly small amount of NP was measured in the organs. By contrast, a large amount of T-Fc-NP was measured in the major organs, indicating that these NPs entered the systemic circulation after oral administration and reached several organs known to express FcRn. These results indicated that the targeted NPs when administered orally would be able to cross the intestinal barrier effectively and distribute in the blood to deliver ivermectin in the blood to fight against ZIKA virus. Analyses of duodenum by immunostaining for FcRn and QD from the NPs indicated that the presence of targeted-NPs in the duodenum at a much higher concentration when compared to the nontargeted NPs (Figure 4C).
Figure 4.
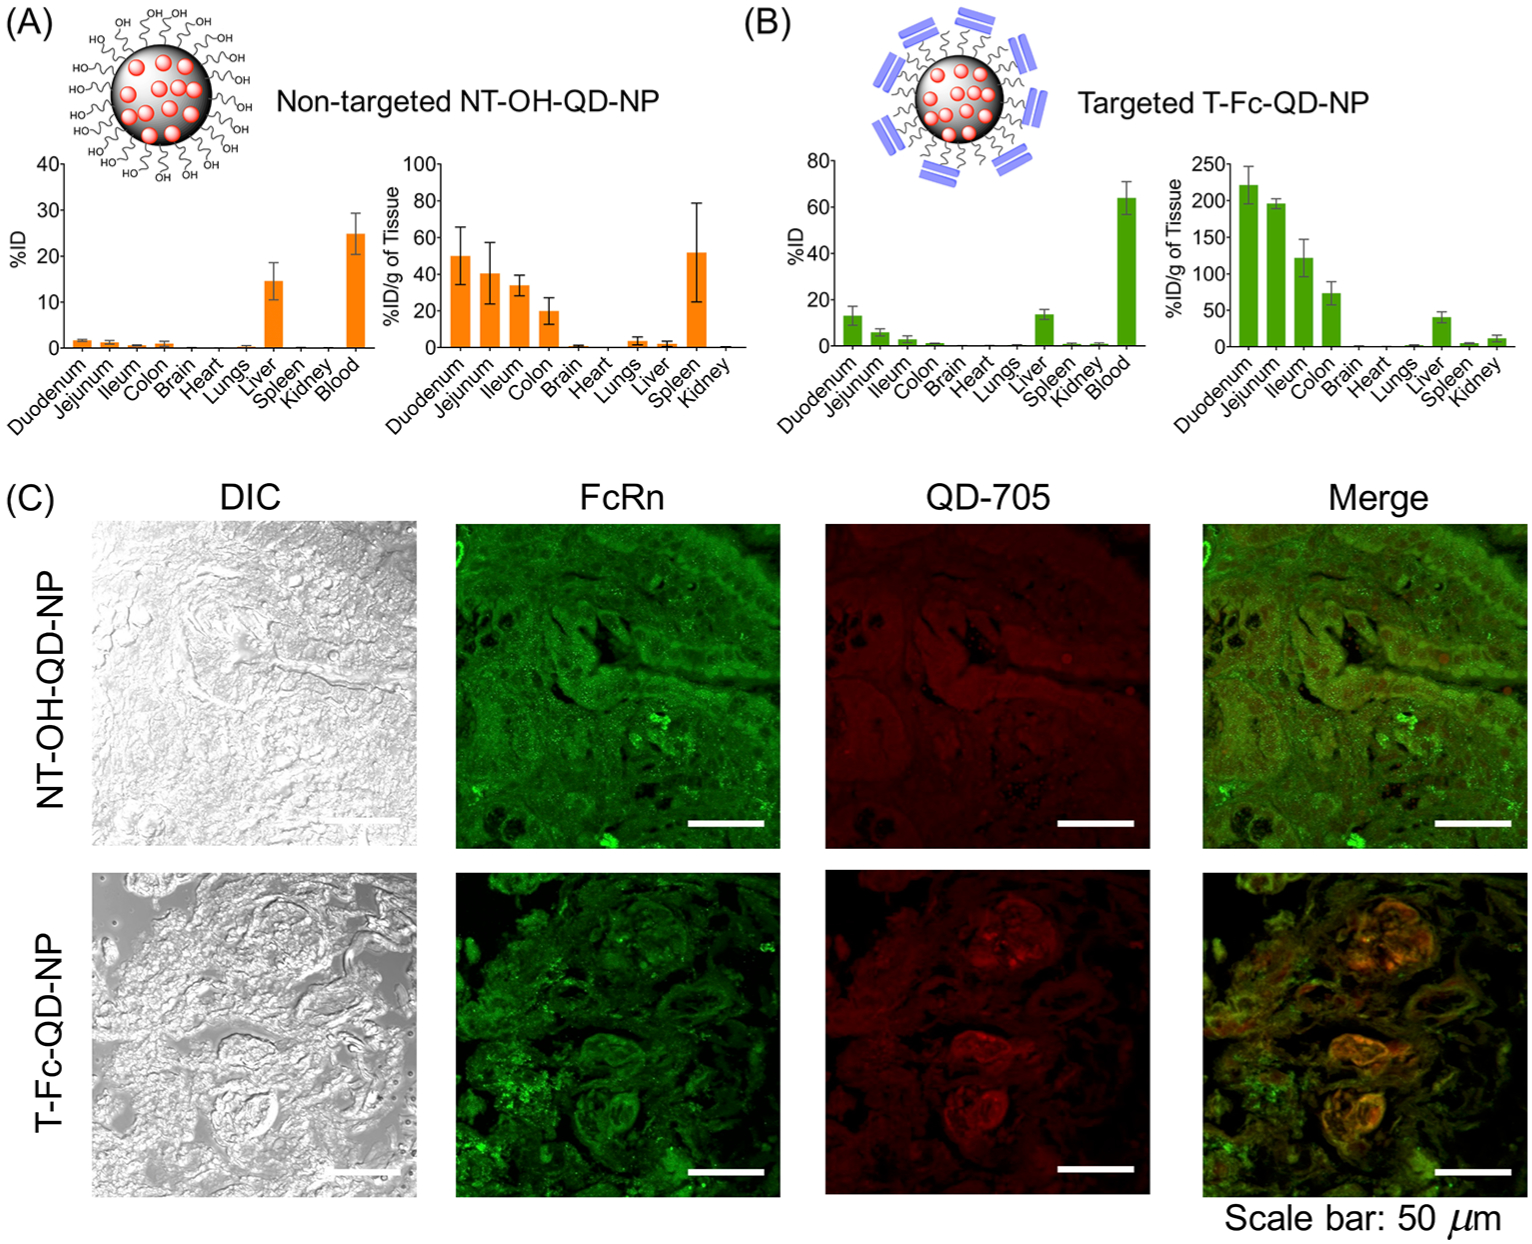
NP absorption and biodistribution in mice. Biodistribution of QD-labeled nontargeted NT-OH-NP (A) and targeted T-Fc-NP (B) after oral administration to Balb/c Albino mice. Data are mean percent injected dose (% ID) and % ID per gram of tissue ± SD (n = 3 mice per group). (C) Localization of the NPs in the duodenum after oral administration.
Comparison of Biodistribution of Ivermectin and T-IVM-NP when Delivered Orally.
A comparison of biodistribution pattern of IVM with its nontargeted and targeted NP constructs indicated that accumulation of IVM or NT-IVM-NP was not very significant in duodenum, jejunum, ileum, colon, and blood after oral administration in normal female mice (Figure 5A). When IVM was delivered using T-Fc-IVM-NP, a significant amount of this drug was found in the intestinal tissue as well as in the blood, thus indicating that IVM is able to cross the intestinal barrier into the blood when delivered with a targeted nanoparticle via oral route (Figure 5A). The percentage IVM accumulation for T-Fc-IVM-NP was found to be around 12%, 9%, 5%, 5%, and 60% in duodenum, jejunum, ileum, colon, and blood, respectively (Figures 5A and S12) 24 h post administration via oral gavage. Analyses of the intestinal tissue samples by Western Blot indicated significant expression of FcRn, thus confirming that the targeted NPs utilize these receptors to get associated with the intestinal tissue (Figure 5B). T-Fc-IVM-NPs did not have any effect on plasma proinflammatory markers IL1-β, IL-6, and TNF-α, suggesting that these NPs do not induce immunogenicity (Figure 5C). Further, no evident pathological changes such as inflammation, necrosis, or cellular abnormalities were observed in H&E sections of the major organs such as brain, heart, lung, liver, spleen, and kidney after treatment with T-Fc-IVM-NPs (Figure 5D). Analyses of alanine aminotransferase (ALT) and aspartate aminotransferase (AST) levels from blood plasma from the NP-treated animals revealed that these targeted NPs do not induce any liver toxicity (Figure S13).
Figure 5.
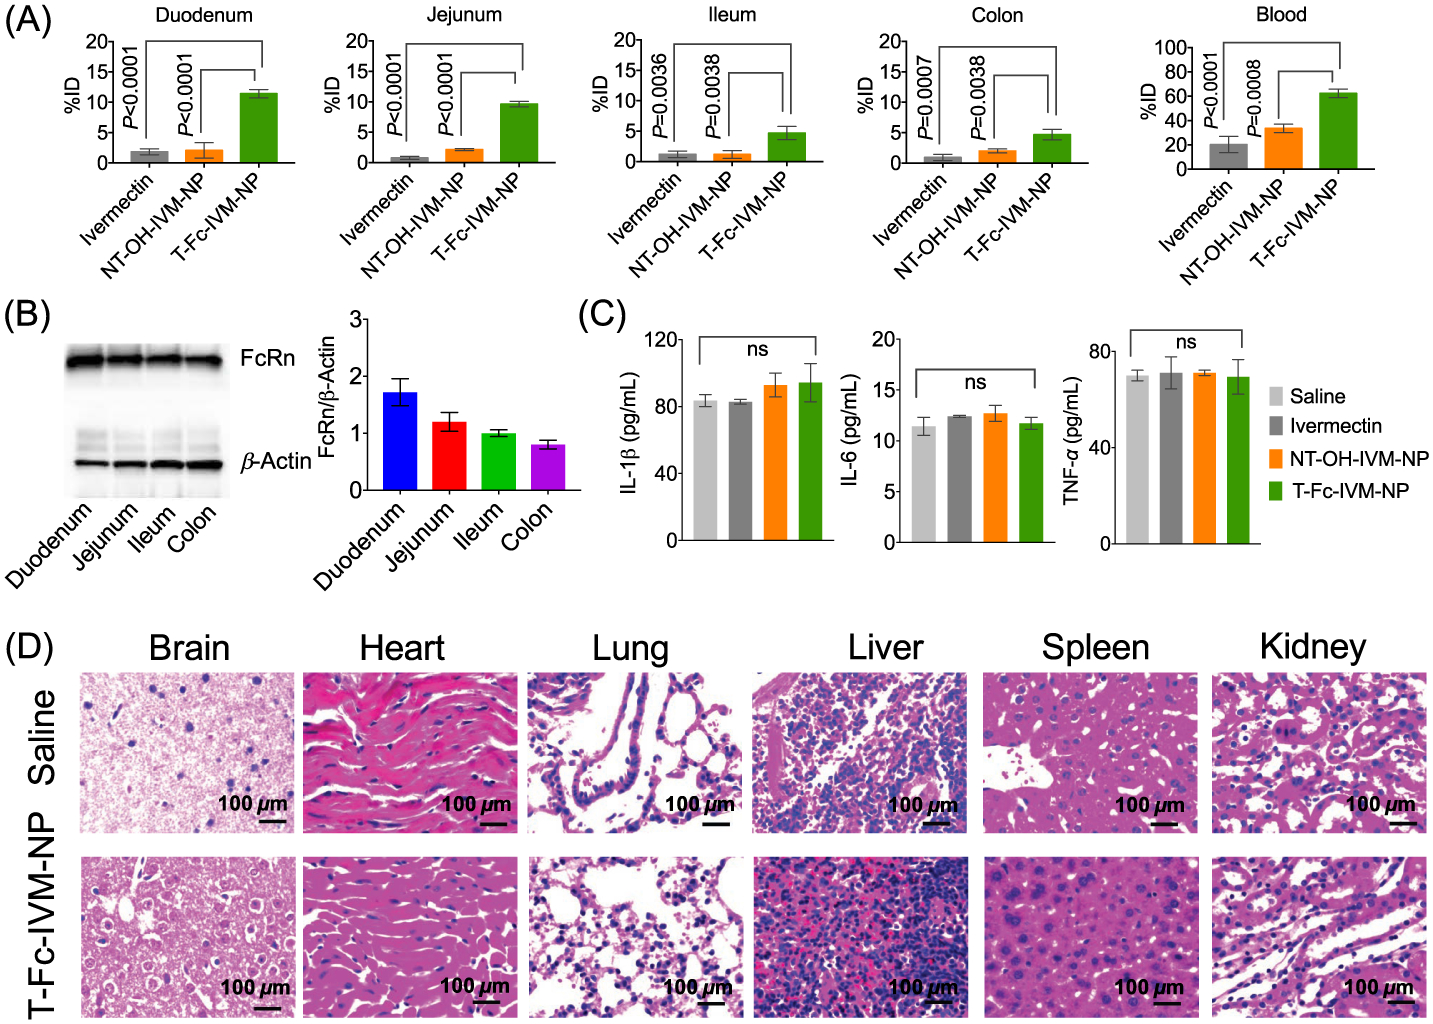
(A) Biodistribution of IVM, NT-OH-IVM-NP, and T-Fc-IVM-NP in intestine and blood of Balb/c female mice after 24 h of post administration by oral gavage at a dose of 40 mg/kg with respect to IVM. (B) FcRn expression level in mice intestinal tissue by Western blotting. (C) Cytokine expression in the blood plasma of the IVM or its NP-treated mice. (D) H & E staining of major tissue after treatment with saline or T-Fc-IVM-NP.
In Vitro Properties of Nanoparticle-Delivered IVM.
We observed controlled release of IVM from the NPs for an extended period of time at pH of 3, 5, 6.5, and 7.4 (Figures 6A and S14). At pH 6.5, the release of the drug followed slightly faster kinetics. At pH 7.4, even after 24 h, only ~60% of IVM was released (Figure 6A). The IVM release was found to be faster at pH 3 and 5 (Figure S14). In order to mimic the gastric conditions, the stability of T-Fc-IVM-NP was checked in simulated gastric fluid (SGF). These data showed that the size, charge, and Fc levels did not show significant change up to 7 days at room temperature and at 37 °C (Figure S15). We also studied the effect of omeprazole, an acid pump inhibitor on size and charge of the NPs. Incubation with this acid pump inhibitor did not bring any change in the size and charge of the NP (Figure S16). These data indicated that the NPs are controlled release delivery vehicles and these particles will be able to release IVM in the blood after oral administration crossing various pH environments, making this system suitable for ZIKA infection treatment. Cellular toxicity of IVM was compared with ivermectin-loaded T-Fc-IVM-NP in Caco-2 cells by studying several parameters of respiration, which included overall oxygen consumption rate (OCR) by the cells, basal respiration, maximal respiration, and ATP production. We have also used empty T-Fc-NP, NT-Mal-NP, and ivermectin-loaded nontargeted NT-Mal-IVM-NP as controls. These studies indicated that at the same concentration, IVM completely disrupts cellular respiration, while ivermectin-loaded T-Fc-NPs do not show such toxicity (Figure 6B). These studies indicated that T-Fc-IVM-NP has the potential to cross the intestine epithelial barrier to reach the blood to attack Zika virus, whereas free ivermectin might be disrupting the barrier due to its toxicity on the epithelial cells at the barrier. The toxicity data was further confirmed by performing conventional MTT assay. Comparison of IC50 value of T-Fc-IVM-NPs with that of ivermectin in Caco-2 cells indicated that nanoparticle-delivered ivermectin has much less toxicity compared to free ivermectin (Figure S17).
Figure 6.
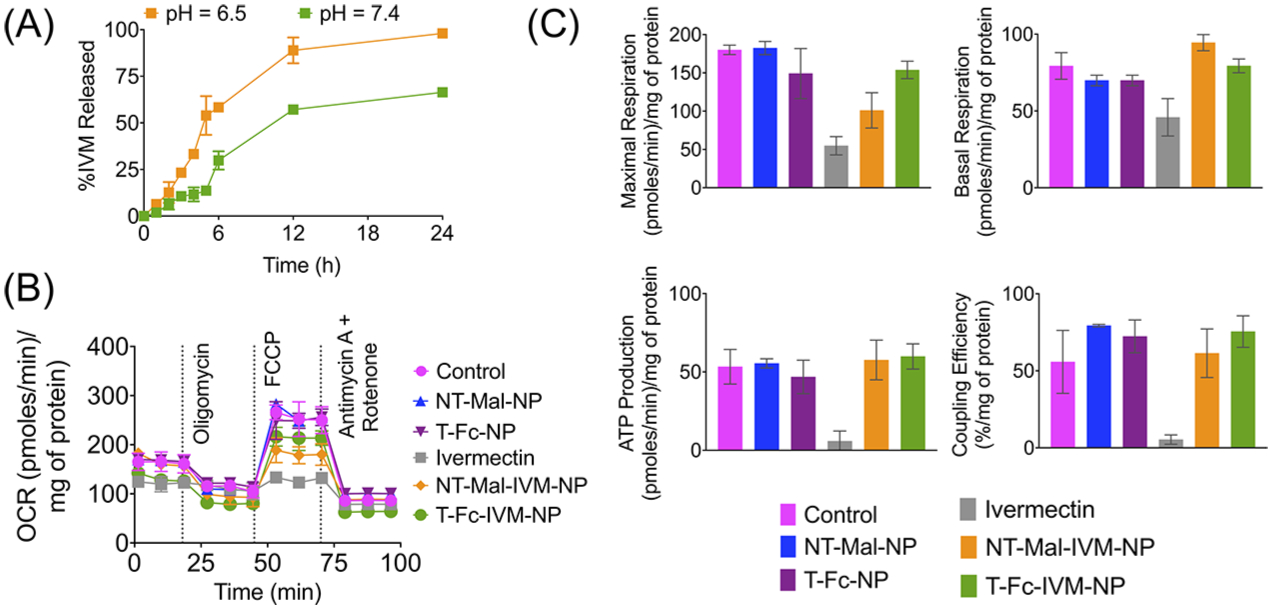
(A) Release of IVM from NT-Mal-IVM-NPs at pH 7.4 and 6.5 at 37 °C. (B) Cellular toxicity of ivermectin and ivermectin-loaded NPs by performing mitochondrial respiration profiles of Caco-2 cells in the presence of targeted and nontargeted NPs using Seahorse analyzer and MitoStress assay: oligomycin, ATP synthase inhibitor; FCCP-carbonyl cyanide-p-trifluoromethoxyphenylhydrazone, an ionophore; rotenone, an inhibitor of mitochondrial complex I; and antimycin A, an inhibitor of mitochondrial complex III. (C) Comparison of maximal respiration, basal respiration, ATP production, and coupling efficiency from the Mitostress assay described in (B).
T-Fc-IVM-NP Inhibits NS1 Expression.
ZIKV is a single-stranded RNA virus which encodes for three structural proteins (C, PrM or M, and E) and seven nonstructural (NS) proteins NS1, NS2A, NS2B, NS3, NS4A, NS4B, and NS5).33 The NS1 protein is involved in viral replication, immune evasion, and pathogenesis of the host cells.33 NS1 is also a major antigenic marker for viral infection and is regarded as a potential therapeutic target for antiviral drug discovery.34 Earlier studies have suggested that IVM inhibits ZIKV infection.9 We evaluated whether T-Fc-IVM-NP inhibits the expression of NS1 protein. We expressed NS1 protein in HEK293T cells and demonstrated that T-Fc-IVM-NP effectively inhibited NS1 expression, 0.08 relative to 1.05 for NS1 plasmid alone (Figure 7A). These results were further confirmed using immunofluorescence (Figure 7B). Under the in vitro settings using HEK293T cells, we did not observe any significant differences between free ivermectin and when delivered with targeted NP due the fact that HEK293T cells do not have significant FcRn expression (Figure S18).
Figure 7.
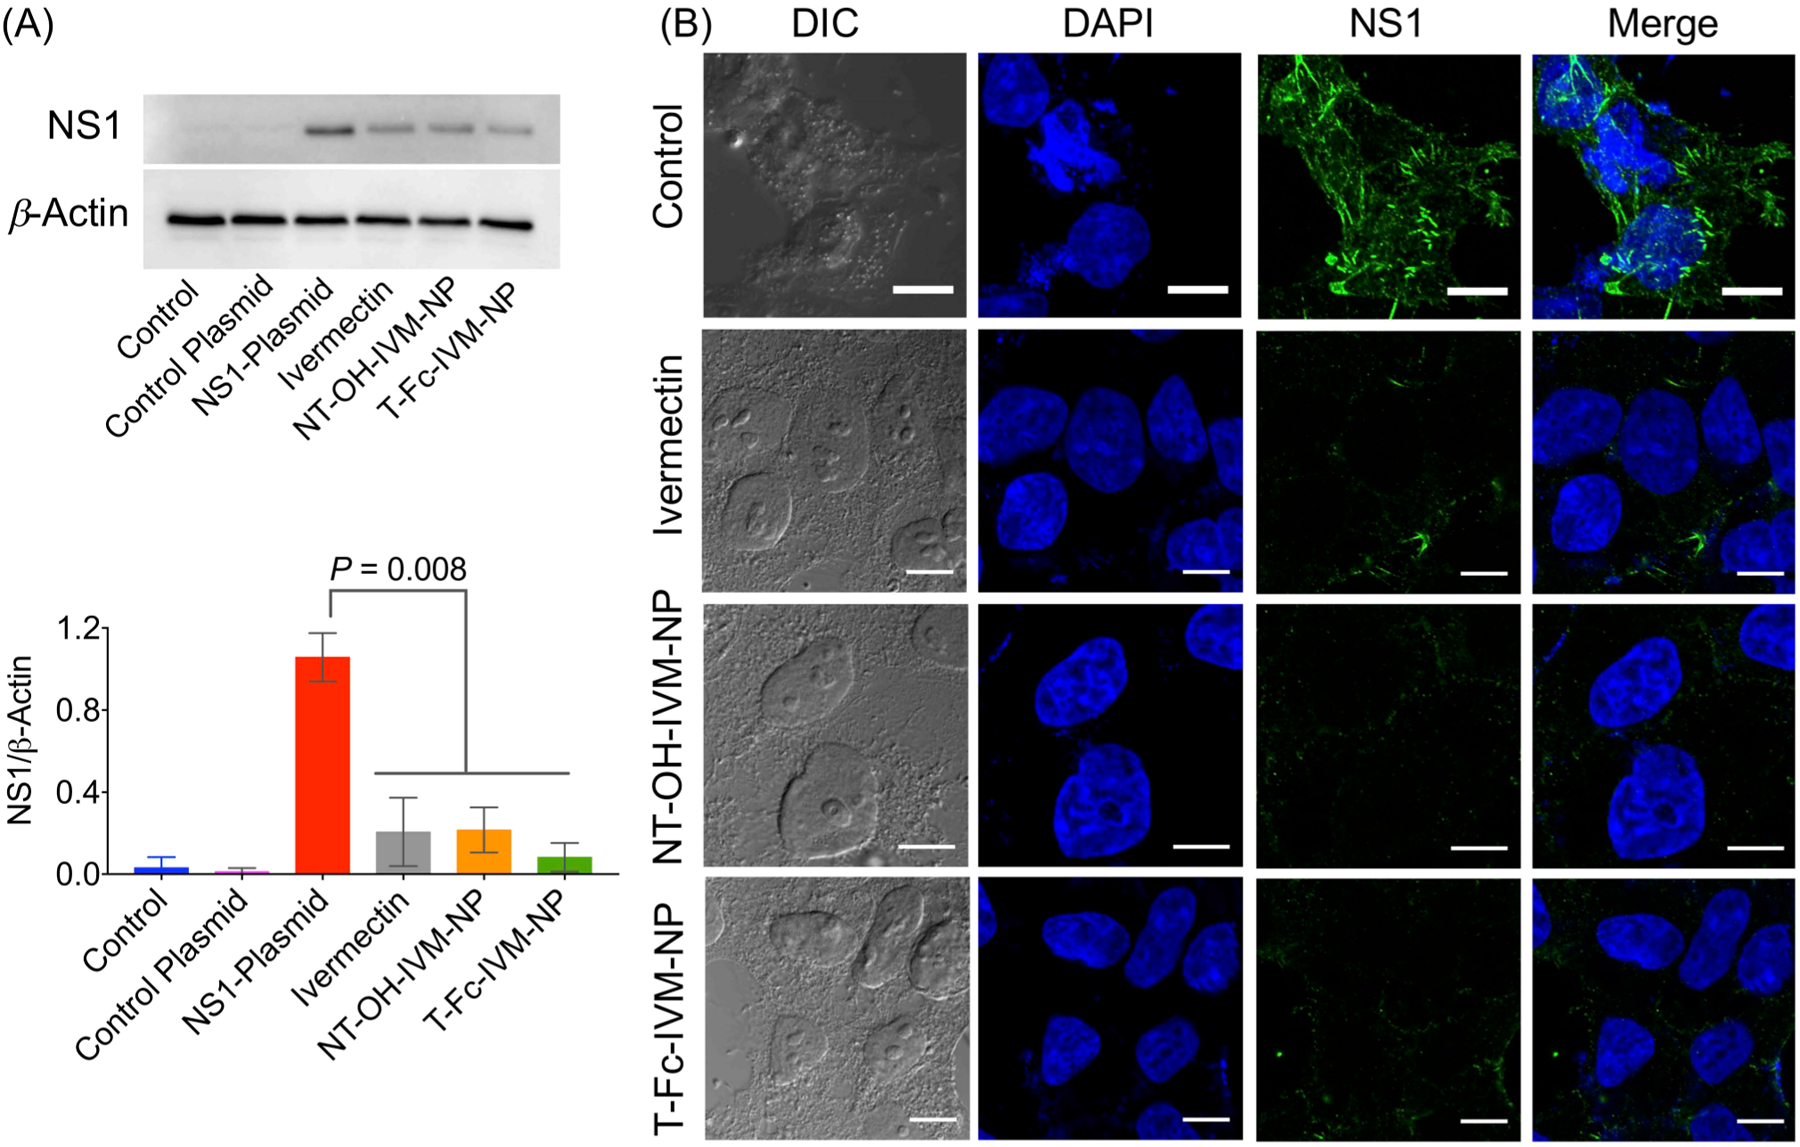
NS1 expression level in HEK293T cells after treatment with NPs by (A) Western blotting and (B) immunofluorescence. Cells were treated with IVM, NT-OH-IVM-NP, or T-Fc-IVM-NP at a concentration of 10 μM with respect to IVM for 6 h. Scale bar: 10 μm. Statistical analyses were performed by two-way ANOVA analysis with multiple comparisons.
Temperature Dependent Stability of IVM-Loaded NPs.
Stability studies for a month showed that both NT-Mal-NP and NT-Mal-IVM-NP maintained their size and zeta potential best when stored at 4 °C (Figure 8A,B). When stored at room temperature, NT-Mal-NP became unstable (Figure 8A) after 20 days, NT-Mal-IVM-NP remained stable at this temperature for a month (Figure 8B). The nanoparticles became unstable within a few days when stored at 37 °C as evident from increase in size and decrease in zeta potential (Figure 8A and B); however, the NPs containing IVM stayed in well-defined form for a longer period compared to the NPs without IVM even at this temperature.
Figure 8.

Temperature-dependent stability of (A) NT-Mal-NP and (B) NT-Mal-IVM-NP by analyzing the diameter and zeta potential over the course of 1 month. (C) Stability of NT-Mal-IVM-NP alone and with cryoprotectants over the course of three 1 h freeze–thaw cycles (freezing at −80 °C). (D) Stability of NT-Mal-IVM-NP stored at −80 °C both alone and with cryoprotectants, measured at 15 time points over the course of 180 days. (E) Stability of NT-Mal-IVM-NP after freeze-drying at −50 °C and 2 Pa and reconstitution in nanopure water. (F) Comparison of inhibition of NS1 expression in HEK293T cells after treatment with freshly prepared NPs, dried powder, and the NPs stored at −80 °C for 180 days.
Dry Formulation of IVM-Loaded NPs.
The IVM-loaded T-Fc-IVM-NPs must be made into powder form to be able to be packed into a capsule and to serve as a viable oral delivery treatment option for ZIKV and for clinical translation. Since study of dry formulation of T-Fc-IVM-NP can be extremely expensive, we carried our formulation optimization studies using NT-Mal-IVM-NP. Our studies involved freeze-drying the NPs in the presence of cryoprotectants to ensure their size and stability are maintained in powder form. Sucrose and trehalose were identified as potential cryoprotectants. These optimization studies were carried out under different conditions as discussed below.
Multiple Freeze–Thaw Cycle Testing.
The NP:cryoprotectant ratios were set as 1:0.1, 1:0.5, 1:1, and 1:2 as well as control samples with only NP (1:0). The size and zeta potential of mixtures of NP and cryoprotectant were tested both after initial mixture and after one, two, and three freeze–thaw cycles from −80 °C to room temperature. Each cycle lasted approximately 1 h. The tests revealed that both sucrose and trehalose in ratios of 1:1 or 2:1 offered the best protection to NP size and zeta potential (Figure 8C), and so these two concentrations of both cryoprotectants were chosen for the long-term storage of NPs at −80 °C.
Long-Term Storage of NPs at −80 °C.
Testing was conducted to identify the amount of time for which the IVM-loaded NPs, with and without the presence of cryoprotectants, could maintain size and zeta potential while being stored at −80 °C. Since the 1:1 and 1:2 ratios offered the best protection to NPs in previous testing, cryoprotectants and NPs were mixed in 1:1 and 1:2 ratios (as well as control samples of NP alone) and stored at −80 °C. The size and zeta potential values were recorded ranging from 1 to 180 days. It was found that the NPs with cryoprotectants maintain size better, and overall, the cryoprotectants in higher concentrations (1:2 NP/cryoprotectant ratio) were chosen for testing of the drying process (Figure 8D). The IVM levels in the NPs were assessed using HPLC; it was found the levels did not show significant change after 180 days of long-term storage.
Drying of NPs.
IVM-loaded NPs alone, as well as the NPs with cryoprotectants in the 1:2 ratios were freeze-dried at approximately −50 °C and 2 Pa and then reconstituted in nanopure water and tested to see if size and zeta potential were maintained. After mixing and gentle vortexing, size and zeta potential measurements were taken, and the NPs showed signs of aggregation. After further attempts, the reconstitution of the nanoparticles freeze-dried in presence of sucrose (1:2 ratio) resulted the best nanoparticles with slightly increased size (Figure 8E). The HPLC data showed that the amount of loaded cargo exhibited slight decrease after drying the NPs with cryoprotectants. Thus, these results indicated that NP/cryoprotectant ratio of 1:1 and 1:2 ratios are the best for dry formulation. These NPs maintained the size ~65 nm and a negative zeta potential. The long-term storage of NPs at −80 °C revealed that the size and stability was initially maintained both for the NPs alone as well as the NP with cryoprotectant. After around 45–75 days, the NPs without the cryoprotectants deviate from the other samples. The NPs with cryoprotectants continued to stay stable, maintaining the diameter around 65–75 nm, and the NP without cryoprotectant continued to aggregate and destabilize (Figure 8D). Morphological analyses by TEM of NT-Mal-IVM-NPs with and without sucrose (1:2) after storage at −80 °C for 180 days indicated that the NPs without cryoprotectant do not maintain their integrity, and the NPs which were stored with sucrose demonstrated spherical well-defined NPs (Figure S19). During the drying process at −50 °C and 2 Pa, some NP aggregation occurred. The powdered form of the NP alone or mixed with cryoprotectant was difficult to reconstitute in nanopure water. The NPs mixed with sucrose in 1:2 ratio showed the closest size compared to the normal size of NT-Mal-IVM-NP (Figure 8E). The freeze-dried NT-MAL-IVM-NPs and the NP which were stored at −80 °C for 180 days with trehalose demonstrated NS1 inhibition (Figure 8F). Thus, it can be concluded that the IVM encapsulated in the NP platform is able to retained its property after 6 months of freeze storage and freeze-dried (Figure 8F). We believe that for creation of capsule form, these NPs need to be used in presence of trehalose.
Transport of IVM Loaded NPs across an in Vitro Placental Barrier.
In pregnant women, the mother and fetus are separated by the placental barrier. This barrier is built from various types of cell layers which allow for diffusion of different substances between the maternal and fetal circulatory systems. For this reason, the placental barrier is known as the leakiest barrier allowing small molecules to pass through between the mother and the fetus. This leaky nature of the placental barrier is a major reason for doctors’ reluctance towards prescribing medicines for diseases such as ZIKV infection to pregnant patients. The placental barrier consists of three distinct layers of cells: syncytiotrophoblast, placental fibroblast and Hofbauer cells, and fetal endothelial cells. Fc-Rn receptors are only present on the syncytiotrophoblast cell layer. By building an in vitro placental barrier, we envisioned studying the fate of IVM and IVM-loaded NPs. We carried out NP transport ability across the placental carcinoma JEG-3 monolayer by quantifying IVM in the apical and basolateral side media using HPLC. The JEG-3 cells were plated in a trans-well plate on the apical side. On the basolateral side, media was added, and the cells were grown up to 9 days. Before the addition of IVM or NPs, the monolayer integrity was checked by measuring the TEER indicating a value of >900 Ω/cm2 on day 9 (Figure 9A). Media was replenished once every 2 days. On the ninth day, IVM, NT-OH-IVM-NP, or T-Fc-IVM-NP was added to the apical side of the barrier and incubated for 12 h. The TEER values and tight junction protein ZO-1 expression confirmed that the addition of the articles did not damage the placental barrier (Figure 9A and 9C). It was found that IVM alone was able to cross the membrane significantly compared to the T-Fc-IVM-NPs and the NT–OH-IVM-NPs (Figure 9B). Cellular toxicity of IVM was compared with T-Fc-IVM-NP in JEG-3 cells by studying basal respiration, maximal respiration, ATP production, extra cellular acidification. These studies indicated that at the same concentration, IVM completely disrupts cellular respiration of the cells which form the placental barrier while when ivermectin is loaded into T-Fc-NPs, it does not show such toxicity (Figure 9D).
Figure 9.

(A) Formation of placental barrier-like junction in JEG-3 cells as confirmed by measuring the TEER and intact TEER after addition of NPs. (B) Quantification of NPs in the apical side, inside the cells, and the basolateral sides of the barrier. (C) Expression of ZO-1 by immunofluorescence. (D) Cellular toxicity of ivermectin and the NPs by performing mitochondrial respiration profiles of JEG-3 cells using MitoStress assay. The cells were treated with the test articles for 24 h at a concentration of 10 μM with respect to ivermectin.
CONCLUSIONS
We demonstrated that a synthetic nanoparticle can cross the intestinal epithelial barrier when administered via oral route and distribute in the blood at a considerable concentration. As a proof of concept, we used ivermectin as a payload for potential application in ZIKV therapy. We further showed that the plasma concentration of ivermectin can be increased significantly when delivered with this synthetic nanoparticle. Our preliminary studies suggested that toxicity of IVM on epithelial cells can be lowered by entrapment inside the polymeric NPs. Our data also highlighted that T-Fc-IVM-NP has the ability to reduce the expression of NS1 protein and could be developed as a safe therapeutic against ZIKV or other viral infections. Ivermectin-loaded NPs demonstrated stability over time, particularly at 4 °C and even at room temperature. The NT-Mal-IVM-NP, when combined with cryoprotectant such as sucrose or trehalose in higher concentrations, showed maintenance of both size and zeta potential across multiple freeze–thaw cycles and over several months at −80 °C. The inability of T-Fc-NP to cross in vitro placental barrier indicated that this delivery vehicle can potentially be optimized further for pregnant population. We envision that this work will fill a great-unmet need of a synthetic NP that can be administered orally for viral diseases.
EXPERIMENTAL METHODS
Cell Culture Methods.
Human epithelial colorectal adenocarcinoma cells (Caco-2) cells were procured from ATCC. These cells were grown in Dulbecco’s Modified Eagle’s medium (DMEM) along with 20% fetal bovine serum (FBS). Transfectable derivative of human embryonic kidney 293 (HEK293T) cells were procured from ATCC. These cells were grown in DMEM along with 10% FBS. Human placental choriocarcinoma (JEG-3) cells were procured from ATCC. These cells were grown in DMEM along with 10% FBS. All cell cultures were maintained in a humidified cell culture incubator at 37 °C and with 5% CO2.
Animals.
Balb/c Albino female mice (4–8 weeks old) were purchased from Jackson Laboratory. All animals were handled in accordance with “The Guide for the Care and Use of Laboratory Animals” of the American Association for Accreditation of Laboratory Animal Care (AAALAC), Animal Welfare Act (AWA), and other applicable federal and state guidelines. All animal work presented here was approved by Institutional Animal Care and Use Committee (IACUC) of University of Miami (UM) Miller School of Medicine. All housing, surgical procedures, and experimental protocols were approved by the IACUC Committee of UM. Animals had free access to chow diet and water during all experiments.
Synthesis of Mal-NHS.
6-Aminohexanoic acid (1 g, 7.62 mmol) and maleic anhydride (0.78 g, 80 mmol) were dissolved in 7.5 mL of acetic acid. The reaction mixture was stirred for 1 h at room temperature. The white color product was precipitated. The product was dispersed in toluene and evaporated under high vacuum in order to remove the remaining acetic acid. Yield = 89%. The formed Mal-acid (0.8 g, 3.8 mmol) and N-hydroxysuccinimide (0.48 g, 4.1 mmol) were dissolved in 5 mL of dry DMF. This reaction mixture was cooled to 0 °C along with stirring. DCC (0.87 g, 4.1 mmol) was dissolved in DMF (2 mL) and added to the reaction vessel. The mixture was then warmed to room temperature and stirred for 12 h. Afterward, the precipitated DCU was filtered out and DMF was removed under high vacuum. The crude product, Mal-NHS, was purified using column chromatography (3% methanol in CH2Cl2). Yield = 76%. Melting point = 63–68 °C. 1H NMR (CDCl3, 400 MHz): δ 6.69 [s, 2 H (CH = CH)], 3.55 [t, 2 H (NCH2)], 2.83 [m, 2 H (CH2CH2)], 2.60 [t, 2 H (CH2CO)], 1.79 [m, 2H (CH2CH2)], 1.61 [m, 2H (CH2CH2)] ppm. 13C NMR (CDCl3, 100 MHz): δ 173.2, 170.7, 168.8, 133.2, 132.3, 30.4, and 30.2 pm.
Synthesis of PLGA-b-PEG-NH2.
NH2-PEG-NH2 (1.0 g, 0.5 mmol), PLGA-COOH (0.825 g, 0.16 mmol), and DMAP (0.022 g, 0.2 mmol) were dissolved in dry CH2Cl2 (12 mL). This reaction mixture was cooled to 0 °C along with stirring. DCC (0.036 g, 0.17 mmol) was dissolved in CH2Cl2 (1 mL) and added dropwise to the reaction vessel. The mixture was then warmed to room temperature and stirred overnight. Later on, precipitated DCU was filtered out and the resulting mixture was poured in a 1:1 mixture of cold diethyl ether/methanol (50 mL) to isolate the block copolymer. This precipitation step was repeated five times. The resulting solid was centrifuged at 3034g for 5 min, and the remaining solvent was removed. The resulting solid was dried under high vacuum and stored. Yield = 51%. 1H NMR (CDCl3, 400 MHz): δ 5.21 [m, 1 H (OCHCH3C(O)], 4.82 [m, 2 H (OCH2C(O)], 3.64 [s, 1.7 H (OCH2)], 1.58 [m, 3.2 H (CH3CH)] ppm. 13C NMR (CDCl3, 100 MHz): δ 164.5, 161.6, 65.7, 64.2, 56.0, and 11.9 ppm. GPC Molecular weight: Mn = 17,500 g/mol, PDI = 1.12 in DMF.
Synthesis of PLGA-b-PEG-Mal.
PLGA-b-PEG-NH2 (0.5 g, 0.06 mmol) and MAL-NHS (0.04 g, 0.13 mmol) were dissolved in 10 mL of dry CH2Cl2 with stirring. Diisopropylethylamine (0.06 g, 0.13 mmol) was added to the reaction mixture and the reaction mixture was stirred for 20 h. Afterward, CH2Cl2 was evaporated to 2 mL under vacuum and precipitated using 1:1 mixture of cold diethyl ether and methanol three times. The precipitated solid product was dried and stored. Yield: 72%. 1H NMR (CDCl3, 400 MHz): δ 6.45 [s, 2 H (CH = CH)], 5.23 [m, 1 H (OCHCH3C(O)], 4.83 [m, 2 H (OCH2C(O)], 3.67 [s, 1.77 H (OCH2)], 1.58 [m, 3.1 H (CH3CH)] ppm. 13C NMR (CDCl3, 100 MHz): δ 183.8, 169.2, 166.4, 70.5, 60.8, and 16.6 ppm. GPC Molecular weight: Mn = 17,600 g/mol, PDI = 1.12 in DMF.
Nanoparticle Formation.
A solution of PLGA-b-PEG-Mal or PLGA-b-PEG-OH35 at a concentration of 5 mg mL−1 and ivermectin at a concentration of 1 mg mL−1 were made in DMF. This solution was added dropwise to 10 mL of nanopure water with constant stirring (900 rpm) at room temperature and stirred for 2 h. The NPs were washed 3 times with nanopure water with amicon ultra-centrifugation filtration membranes with a molecular weight cutoff of 100 kDa (1825g, 4 °C). The formed NPs were suspended in water and stored at 4 °C. The NP size (diameter, nm), PDI, and surface charge (zeta potential, mV) were obtained from three independent measurements using dynamic light scattering technique. IVM levels in NPs were measured using HPLC and morphology of the NPs was assessed using TEM. NPs at a concentration of 5 mg/mL with respect to the total polymer were diluted 100 times using nanopure water. This NP solution (1 mL) was mixed with a 4% solution of uranyl acetate solution (5 μL) and vortexed. This solution was filtered with a 0.45-μm filter and ~20 μL was dropped on the dark side of a copper grid and allowed to dry for 24 h in a desiccator at room temperature. TEM images were recorded using JEOL JEM-1400 instrument. Polyclonal IgG Fc fragments were covalently conjugated to the MAL-NPs using thiol-ene chemistry. 2-Iminothiolane (4.5 μL from a 5 mg mL−1 solution in 5 mM EDTA) was mixed with 35 μL of Fc fragment (2.48 mg mL−1) at 37 °C for 1 h. This mixture was added to the NP solution (3 mg mL−1) and allowed to react at 4 °C for 1 h. The NPs were purified in a similar fashion as mentioned before and the change in diameter and zeta potential of the nanoparticles was studied using DLS. The amount of Fc was quantified using BCA assay.
Release Kinetics of Ivermectin from NPs.
The release of ivermectin from the nanoparticles was evaluated using PBS of pH 7.4, 6.5, 5.0, and 3.0. Here, pH values were chosen to mimic the physiological conditions of colon, which varies between 5.5 and 7.0, and blood (pH = 7.4). The nanoparticle solutions were prepared by diluting four times with nanopure water. Then, 200 μL of the diluted solution was added to dialysis tubes (Thermo Scientific, MWCO = 10000). These dialysis tubes were then submerged in respective buffer solutions and kept in the shaking incubator at 37 °C up to 24 h. For the first 6 h, buffer was replenished with fresh buffer every hour and later on changed every 12 h. The samples were collected at predetermined time points and dissolved in acetonitrile and analyzed by HPLC for remaining IVM concentrations. HPLC studies were carried out using an Agilent 1200 series instrument to quantify the amount of ivermectin. The solution from each dialysis tube (20 μL) was taken in acetonitrile containing 0.1% trifluoroacetic acid and was injected into HPLC. A Zorbax C18 column was used as a solid phase and a 10:70:20 water:acetonitrile:methanol solution served as the mobile phase. The wavelength of detection used for these experiments was 268 nm. The ivermectin concentration remaining in the samples was quantified by using ivermectin standards, and these values were subtracted from the concentration of IVM that was initially added to the dialysis tubes.
T-Fc-IVM-NP Stability in Simulated Gastric Fluid (SGF).
The NP solutions were prepared by diluting 10 times from original stock (5 mg/mL) with SGF in centrifuge tubes. These tubes were then kept at room temperature or at 37 °C up to 7 days. The samples were collected at predetermined time points, and size and charge were analyzed by DLS. Fc conjugation was analyzed by BCA assay.
NT-Mal-IVM-NP Stability in SGF with and without Omeprazole.
The nanoparticle solutions were prepared by diluting 10 times from original stock (5 mg/mL) with SGF in centrifuge tubes with or without omeprazole (100 μg/mL), an acid pump inhibitor. These tubes were then kept at room temperature for 24 h. Size and charge of the NPs were analyzed by DLS every 6 h.
Cell Viability Assays.
The cytotoxicity of ivermectin, NT-OH-IVM-NP, or T-Fc-IVM-NP was tested in Caco-2 cells using the MTT assay. The cells were plated (3000 cells/well) in a 96-well plate and allowed to grow overnight. The media was changed and increasing concentrations of each test article was added. After 24 h, the media was aspirated and fresh media was added and further incubated for an additional 48 h. After the given incubation time, 20 μL/well MTT was added (5 mg/mL stock in PBS) and incubated for 5 h in order for MTT to be reduced to purple formazan. The media was removed, and the cells were lysed with 100 μL of DMSO. In order to homogenize the formazan solution, the plates were subjected to 10 min of gentle shaking and the absorbance was read at 550 nm with a background reading at 800 nm with a plate reader. Control values were set to 100% of cell viability. Cytotoxicity data (where appropriate) was fitted to a sigmoidal curve and a three parameters logistic model used to calculate the IC50, which is the concentration of ivermectin causing 50% inhibition in comparison to untreated controls. The mean IC50 is the concentration of agent that reduces cell growth by 50% under the experimental conditions and is the average from at least three independent measurements that were reproducible and statistically significant. These analyses were performed with GraphPad Prism.
Mitostress Assay.
Different parameters of mitochondrial respiration such as basal respiration, maximal respiration, coupling efficiency, and spare respiratory capacity were investigated using seahorse XFe96 Analyzer. One day prior to the assay, XF sensor cartridges were hydrated using 200 μL of XF calibrant buffer and kept at 37 °C incubator without CO2 overnight. Caco-2 cells were plated at a density of 20000 cells per well in 80 μL of DMEM media (with 20% FBS) and the plate was kept 1 h at room temperature followed by incubation at 37 °C with 5% CO2 for 3 h. Finally, 100 μL of fresh media was added to have total 180 μL per well and incubated for 16 h. Later on, media was aspirated and various compounds (10 μM with respect to ivermectin) were added so that the final volume in each well was 180 μL. These samples were incubated for additional 24 h. Before conducting the Mitostress assay, Seahorse media (XF Assay Medium Modified DMEM) was reconstituted with glucose (1.8 mg/mL), sodium pyruvate (1%), and l-glutamine (1%) and adjusted for pH 7.4 by using 0.1 N HCl. The cells were washed thrice with freshly prepared seahorse medium and incubated at 37 °C in a non-CO2 incubator for 1 h. Meanwhile, cartridge ports were loaded with various inhibitors. The stocks of oligomycin (10 μM), FCCP (10 μM), and antimycin-A/rotenone mixture (10 μM each) were made in seahorse media. The port A was filled with 20 μL of oligomycin, port B with 22 μL of FCCP, and port C with 25 μL of antimycin A/rotenone to have a final concentration of 1.0 μM in each well. The cartridge was calibrated for pH and O2. After calibration, the plate under investigation was run where 3 measurements were recorded for basal OCR and after addition of each reagent. The media was aspirated and 20 μL of RIPA buffer was added to each well and incubated for 10 min at 37 °C. Further BCA assay was performed to obtain protein normalized OCR values.
In Vitro Epithelial Barrier Experiment.
Caco-2 cells were plated in a 12-well trans-well plate with a density of 50000 cells/well on the apical side in 500 μL of DMEM (with 20% FBS) media. On the basal side, 1 mL of fresh media was added and the cells were grown up to 9 days. Before the addition of compounds, the integrity of the monolayer was monitored by TEER (transepithelial electrical resistance) using Epithelial Volt-ohmmeter. Media was replenished every 2 days. On the ninth day, 2 μg/mL of IgG-Fc (Fc) fragment was added in order to find out the targeting ability of the Fc-targeting nanoparticles. After 2 h, ivermectin, NT–OH-IVM-NP, and T-Fc-IVM-NP were added to the cells with a concentration of 20 μg/mL, with respect to ivermectin, and were incubated for 12 h. Apical and basal media were collected in Eppendorf tubes and dissolved in 2 mL of acetonitrile. To spike the peak for ivermectin, 10 μg/mL of ivermectin was added to the collected media. This mixture was sonicated for 20 min followed by centrifugation at 5,000 rpm for 10 min. From the precipitated debris, supernatant was gently collected. Meanwhile, Strata C18-T columns were activated by passing 1 mL of methanol and water through the filter in sequence. The collected supernatant was passed through the activated column in order to remove remaining debris and impurities. The column was washed with 1–2 mL of 5% methanol in order to remove remaining impurities. The ivermectin from the column was collected in 2 mL of methanol and quantified using HPLC (wavelength = 268 nm at 21.01 min). In order to confirm the formation of the epithelial barrier by Caco-2 cells, immunostaining of tight junction protein (ZO-1) was performed. On the ninth day, 2 μg/mL of IgG-Fc (Fc) fragment was added in order to find the targeting ability of the Fc targeting nanoparticles. After 2 h, NT–OH-IVM-NP and T-Fc-IVM-NP were added in concentrations of 20 μg/mL with respect to ivermectin and incubated for 12 h. The cells were washed with PBS (1X) 3 times and fixed with 4% paraformaldehyde for 1 h at 37 °C. After performing 3 washings, the cells were permeabilized using 0.1% Triton-X100 for 10 min at 37 °C. The cells were washed with 1X PBS 3 times and blocked with 1% goat serum in 1X PBS for 12 h. Cells were treated with the respective primary antibody (ZO-1 antibody, 40–2200) in 1% goat serum containing 1X PBS for 12 h at 4 °C in a humidified chamber. After washing the cells for three times with 1% goat serum containing 1X PBS, the secondary antibody (Alexa 488 conjugated antichicken antibody, ab150169, 1:2000 dilution) solution in 1% goat serum containing 1X PBS was added and incubated for 1 h at room temperature in a humidified chamber. The cells were washed with 1X PBS for 3 times and pearmeabilized using 0.1% Triton-X100 for 10 min at 37 °C. Next, DAPI (1 mg/mL in 1X PBS) was added to the cells and incubated for 10 min at room temperature. Cells were finally washed three more times with 1% goat serum containing 1X PBS. The membrane was gently removed and kept on glass slides and covered with coverslips using mounting solution (n-propyl gallate, Tris and glycerol in nanopure water, pH = 8.0). Confocal images were recorded using an Olympus FluoView FV3000 confocal microscope using 405/460 nm for DAPI and 488/510 nm for Alexa488.
Biodistribution of QD-Loaded NPs.
Biodistribution properties of NT-OH-QD-NP and T-Fc-QD-NP along with a saline treatment were determined in balb/c female mice weighing around ~22 g. Three mice per group (n = 3) were used in these studies. Before oral dosage, animals were kept for fasting for 8 h. The dose of injection was 50 mg/kg with respect to NP via oral gavage. 100 μL of saline was injected via oral gavage as control. After 24 h, around 300 μL of blood was collected in heparinized tubes via cardiac puncture under anesthesia. After 24 h, animals were perfused under anesthesia using 1X PBS for 10 min with a flow rate of 7 mL/min and the organs were harvested. The collected blood samples were centrifuged to collect blood plasma. The biodistribution was followed by performing ICP-MS on digested organs and plasma. Before digestion, some portions of the intestine, including the duodenum, jejunum, ilium, and colon, were stored at −80 °C to use for further studies. The organs were weighed and digested in aquaregia (all organs were dissolved in 3 mL except the liver; the liver was dissolved in 10 mL) and the amount of the QD was determined using ICP-MS. The percentage of NP in the blood was calculated by taking into consideration that blood constitutes 7% of body weight and plasma constitutes 55% of blood volume.
To study T-Fc-QD-NP colocalization in the duodenum, the FcRn antibody was used. Slides with tissue sections (5 μm) were deparaffinized in xylenes followed by rehydration in graded ethanol (100% to 10%). The duodenum sections were baked in 10 mM sodium citrate buffer (Target Retrieval Solution, Citrate pH 6, Dako, USA) for 15 min for antigen retrieval using Biocare decloaking chamber (# DC2012; Biocare Medicals, USA) and then maintained at a sub-boiling temperature for 10 min. Blocking was done in 5% goat serum in phosphate buffered saline-Tween 100 (PBST) for 1 h at room temperature. The primary antibody (Fc-Rn, SC-393064) was applied at 4 °C in a humidified chamber for overnight incubation, with final concentrations of 1:1000 in 1% PBST. After 5 washes of PBST, the secondary antibody (Goat Antimouse; #ab ab6785) was applied for 1 h with a final concentration of 1:2000 in 1% goat serum in PBST. The coverslips were mounted on glass slides and covered with nail polish. Confocal images were recorded using an Olympus FluoView FV3000 confocal microscope using 405/705 nm for QD and 488/510 nm for Alexa488.
Biodistribution of IVM-Loaded NPs.
We used female balb/c albino mice to understand the ivermectin and T-Fc-IVM-NPs distribution and the toxicity after oral administration in vivo. The NT-OH-IVM-NP was used as a nontargeted control. The animals were divided into four groups, each group containing three animals. The group assignments were as follows: group 1, saline; group 2, ivermectin; group 3, NT-OH-IVM-NP; and group 4, T-Fc-IVM-NP. Before oral dosage, animals were kept for fasting for 8 h. The animals in each group received saline treatment, ivermectin, targeted NPs, or nontargeted NPs via oral gavage. The dose of nanoparticle was kept as 40 mg/kg with respect to ivermectin. After 24 h, ~300 μL of blood was collected in heparinized tubes via cardiac puncture under anesthesia. Then, the animals were perfused under anesthesia.The perfusion was carried out with 1X PBS for 10 min with a flow rate of 7 mL/min. The collected blood was centrifuged to collect blood plasma. The collected organs were weighed and homogenized using a dounce homogenizer and collected in 2 mL of acetonitrile. To spike the ivermectin peak, 20 μg/mL of ivermectin was added to the crushed tissues and to the blood plasma. This mixture was sonicated for 20 min followed by centrifugation at 5000 rpm for 10 min. From the precipitated debris, supernatant was gently collected. Meanwhile, Strata C18-T columns were activated by passing 1 mL of methanol and water through the filter in sequence. The collected supernatant was passed through the activated column in order to get rid of remaining debris and impurities. The column was washed with 1–2 mL of 5% methanol in order to remove the impurities. The ivermectin from the column was collected in 2 mL of methanol and quantified using HPLC (wavelength = 268 nm at 21.01 min). The percentage of ivermectin in the blood was calculated by taking into consideration that blood constitutes 7% of body weight and plasma constitutes 55% of blood volume.
Western Blot of Intestine Tissue.
The stored intestinal tissues from the above study were homogenized using dounce homogenization and collected in RIPA buffer. The tissue suspension was kept in RIPA for 30 min on ice. The protein fractions were collected from these digested tissues by centrifugation at 9000g for 20 min at 4 °C. The protein amounts in the tissues were quantified using bicinchoninic acid (BCA) assay. A 60 μg portion of protein was used in each well along with 1X Laemmli sample buffer and the gel was run at 100 mV for 2 h at room temperature. The resolved proteins were transferred onto a PVDF membrane at 50 mV at 4 °C for 2 h. The membrane was blocked for 1 h at room temperature in blocking buffer made with 5% skim milk powder in tris buffer saline–TWEEN (TBST, TRIS = 2.42 g and NaCl= 8.0 g in 1 L of DI water at pH of 7.6; TWEEN20 = 1:1000 dilution). The membrane was kept at 4 °C overnight for primary antibody solution in 5% skim milk solution (FcRn at a concentration of 10 microgram/mL and β-actin, 1:1000 dilution) incubation. The next day, the membrane was washed 5 times with TBST buffer and then incubated with respective HRP-conjugated secondary antibodies (1:2000 dilution in 5% skim milk in TBST) at room temperature for 1 h. The membrane was again washed 5 times with TBST buffer before developing with ECL. The images were taken using a BioRad ChemiDoc imaging system. The bands in the membrane were quantified using the ImageJ software.
Enzyme-Linked Immunosorbent Assay (ELISA) To Determine Immunogenic Effect.
The levels of pro-inflammatory cytokines IL-1β, IL-6, and TNF-α in the obtained plasma was determined using ELISA kits for the respective cytokines following the manufacturer’s protocol. Briefly, 100 μL/well of coating buffer with capture antibody was added to the 96-well ELISA plate. After that, the plate was sealed and kept overnight at 4 °C. The buffer was aspirated from the wells and each well was washed 3 times with 300 μL/well of wash buffer. After the last wash, the plate was inverted and blotted on absorbent paper to remove any residual buffer. Wells were blocked using 200 μL/well of assay diluent and incubated at room temperature for 1 h. The diluent was aspirated from the wells and the wells were washed as mentioned above. Then, 100 μL of each standard in assay diluent, as well as the samples (50 μL of plasma sample +50 μL of assay diluent), were added to the appropriate wells. The plate was then sealed and incubated for 2 h at room temperature. The solutions were then aspirated from the wells and they were washed five times as mentioned above. 100 μL of detection antibody (IL-1β, IL-6, and TNF-α) diluted in assay diluent was added to each well, then the plate was sealed and incubated for 1 h at room temperature. Similar washing steps were carried out five times. Then, 100 μL of enzyme reagent diluted in assay diluent was added to each well. The plate was sealed and incubated at room temperature for 30 min. After the reagent was aspirated from wells, similar washing steps were carried out seven times. Substrate solution (100 μL) was added to each well, and the plate was sealed and incubated for 30 min at room temperature in the dark. After this, 50 μL of stop solution was added to each well, and the absorbance was recorded at 450 nm.
Aspartate Aminotransferase (AST) Activity Assay.
The collected plasma was used to determine AST activity. All samples and standards were studied in duplicates. AST levels in blood are commonly used as a marker for liver function. The collected plasma samples were directly used to determine the AST levels. From each sample, 50 μL of plasma was added to a 96-well plate. Along with this, 50 μL glutamate standards were also added, with concentrations of 0, 2, 4, 6, 8, and 10 nmol/well prepared in AST assay buffer. To each well, 100 μL of master reaction mix (80 μL of AST Assay Buffer, 2 μL of AST Enzyme Mix, 8 μL of AST Developer and 10 μL of AST substrate) was added and incubated for 5 min at 37 °C in the dark. Meanwhile, the plate reader was set for 37 °C and kept ready to read the kinetics, with 5 min intervals, for 20 min. Absorbance at initial time, TInitial, was (A450)initial, and at the end the final time point, Tfinal, was (A450)final. The final absorbance should not exceed the highest standard (10 nmol/well) absorbance value. It is essential that (A450)final is in the linear range of the standard curve. The absorbance was measured at 450 nm at the initial time.
Calculated the change in absorbance from Tinitial to Tfinal for the samples.
The amount of generated glutamate using standard curve determined for above obtained ΔA450(B). The AST activity of a sample was determined by the following equation
where B = amount (nmol) of glutamate generated between Tinitial and Tfinal
where V = sample volume (mL) added to the well.
Alanine Aminotransferase Colorimetric Activity (ALT) Assay.
The collected plasma was used to determine ALT activity. Cayman’s ALT Assay Kit was used to detect ALT activity in plasma. Measurement of the ALT activity is carried out by monitoring the rate of NADH oxidation in a coupled reaction system employing lactate dehydrogenase (LDH). The oxidation of NADH to NAD+ is accompanied by a decrease in absorbance at 340 nm. Under circumstances in which the ALT activity is rate limiting, the rate decrease is directly proportional to the ALT activity in the sample. This experiment was carried out in 96-well plate provided by Cayman. First, 150 μL of substrate, 20 μL of Cofactor, and 20 μL of sample were added to each well and incubated for at 37 °C for 15 min. The reaction was initiated by the addition of 20 μL of ALT initiator to all of the wells with minimal time difference between addition to the wells. Absorbance was recorded immediately at 340 nm once every minute for a period of 5 min.
The change in absorbance (ΔA340) per minute was determined by selecting two linear points on the linear portion of the curve and calculated the change in absorbance using the following equation.
ALT activity was determined using following formula = (ΔA340/min × 0.21 mL) × 4.11 mM−1 × 0.02 mL. The reaction rate at 340 nm can be determined using the NADH extinction coefficient of 4.11 mM−1. The hepatotoxicity was monitored by measuring the levels of alanine aminotransferase (ALT) and (H) aspartate aminotransferase (AST) in the blood plasma. Elevation in the levels of AST and ALT is an indication of the hepatotoxicity. As seen from the data, the AST and ALT levels were not affected by treatment.
H&E Staining.
Harvested organs (brain, liver, lungs, kidney, and spleen) were snap frozen. All organ tissues were postfixed in 4% PFA for 48 h. Five μm sections were obtained and stained with hematoxylin (H) and eosin (E). The H&E stained sections were scanned and the images were captured using the Olympus VS120 image analysis system (Olympus America Inc., Philadelphia, PA).
Bacterial Culture for Zika NS1 and Control Plasmid.
Bacterial agar plates (1.5%) containing 100 μg/mL ampicillin were prepared and streaked with Flag-tagged Zika NS1 and control plasmid. Plates with NS1 and control plasmid were incubated at 37 and 30 °C, respectively, for 16 h. A single colony from each plate was inoculated in 5 mL of LB broth media containing 100 μg/mL ampicillin for primary culture. The culture was incubated at 37 °C in an incubator shaker for 16 h. A 1:100 dilution of primary culture was used for secondary culture.
Plasmid Isolation Using Midiprep Kit.
NS1 and control plasmids were isolated using Qiagen Midiprep plasmid isolation kit. Bacterial culture grown overnight was harvested by centrifuging at 1900g for 20 min at 4 °C. The supernatant was discarded and the bacterial pellet was dissolved in 4 mL of buffer P1 and mixed properly. To this, 4 mL of buffer P2 was mixed thoroughly by vigorously inverting the tube four to six times and incubated at room temperature for 5 min. Finally, 4 mL of buffer P3 was mixed thoroughly by vigorously inverting the tube four to six times and incubated on ice for 15 min. The tube was centrifuged at 1900g for 30 min at 4 °C. The Qiagen midi column was equilibrated with 4 mL of buffer QBT and bacterial supernatant was loaded onto the column, and the column was allowed to empty by gravity flow. The plasmid was eluted from the column by using QF buffer. Isopropanol was used to precipitate the plasmid. Finally, plasmid was dissolved in autoclaved water. Purity and quantification of plasmid was checked using Nanodrop by measuring the absorbance ratio at 260/280 nm.
NS1 Protein Expression in HEK293T Cells.
HEK293T cells (0.3 × 10⁶) were seeded in six-well plate in 10% FBS-containing DMEM medium and were incubated overnight. Cells were transfected with 2 μg of Flag-tagged Zika NS1 plasmid (addgene no. 79641) and an empty vector using the transfection reagent turbofectin (turbofectin: DNA-3:1) in Opti-MEM medium. After 6 h post-transfection, medium was removed and replaced with fresh medium and incubated for additional 6 h. Cells were treated with 10 μM concentration of ivermectin, T-Fc-IVM-NP, and NT-OH-IVM-NP for 6 h. Cells were lysed with RIPA buffer and the total cell lysate (60 μg) was resolved on a 4–20% gradient gel. Proteins were transferred to PVDF membrane and probed with Antiflag (1:1000) and β-actin (1:1000) antibody overnight at 4 °C. After 3 TBST washings, the membrane was probed with HRP-conjugated antimouse secondary antibody (1:2000) for 1 h at room temperature. The membrane was washed 5 times with TBST and developed using SuperSignal west pico chemiluminescence substrate (Thermo Scientific).
NS1 Protein Expression by Immunofluorescence.
HEK293T cells were plated on coverslip in 12-well plate with density of 20,000 cells/well in 1 mL of DMEM (with 10% FBS) media. Cells were transfected with 2 μg of Flag-tagged Zika NS1 plasmid (addgene no. 79641) and an empty vector using transfection reagent turbofectin (turbofectin: DNA-3:1) in 250 μL of Opti-MEM medium. After 6 h post-transfection, medium was removed and replaced with fresh medium and incubated for additional 6 h. Cells were treated with ivermectin, T-Fc-IVM-NP, or NT-OH-IVM-NP at a concentration of 10 μM with respect to IVM for 6 h. The cells were washed with PBS (1×) three times and fixed using 4% paraformaldehyde for 1 h at 37 °C. After performing three washings, the cells were permeabilized using 0.1% Triton-X100 for 10 min at 37 °C. The cells were washed with 1X PBS 3 times and blocked with 1% goat serum in 1X PBS at 4 °C for 12 h at 4 °C. Cells were treated with the primary antibody (Antiflag (1:1000) in 1X PBS containing 1% goat serum for 12 h at 4 °C in humidified chamber. After the cells were washed three more times with 1% goat serum containing 1X PBS, the respective secondary antibody (Alexa 488 conjugated antimouse antibody at 1:2000 dilution) solution in 1% goat serum containing 1X PBS was added and incubated for 1 h at room temperature in a humidified chamber. The cells were washed 3 times with 1X PBS and permeabilized using 0.1% Triton-X-100 for 10 min at 37 °C. Then, DAPI at a concentration of 1 mg/mL in 1X PBS was added to the cells and incubated for 10 min at room temperature. Cells were finally washed three more times with 1% goat serum containing 1X PBS. The membrane was gently removed and kept on glass slides and covered with coverslips using mounting solution (n-propyl gallate, Tris, and glycerol in nanopure water, pH = 8.0). Confocal images were recorded using an Olympus FluoView FV3000 confocal microscope using 405/460 nm for DAPI and 488/510 nm for Alexa488.
Temperature-Dependent Stability.
NPs were prepared for the temperature-dependent stability testing using 5 mg/mL PLGA-PEG-Mal alone (for Mal-NP) or using 5 mg/mL PLGA-PEG-Mal polymer and 1 mg/mL ivermectin (for Mal-IVM-NP). The solutions were mixed and made with a total volume of 1 mL and added slowly and dropwise to water being stirred at 900 rpm. The solution was stirred for 2 h and then filtered using Amicon filtration (100 MWCO) at 1825g. Three 1 mL solutions of both Mal-NP and Mal-IVM-NP were prepared, and after initial DLS measurements of size and zeta potential were taken, the solutions were stored at 4 °C, room temperature, or 37 °C. Then, every 3 days, the solutions were removed from their respective locations, allowed to equilibrate for approximately 15 min, and then the size and zeta potential measurements were taken. This was repeated up to 36 days, but measurements were discontinued early for the 37 °C samples because they showed obvious signs of deviating from the normal size and zeta potential of the nanoparticles.
Creation of NP Dry Formulation.
Multiple Freeze–Thaw Cycle Testing.
Mal-IVM-NPs were prepared in a similar fashion as described above, but with starting concentrations of 10 mg/mL of PLGA-PEG-Mal polymer and 2 mg/mL ivermectin. Then samples were created in which the nanoparticles were mixed with the cryoprotectants in various concentrations. In addition to the control sample (NP alone), NPs were mixed with the cryoprotectants sucrose and trehalose in NP:cryoprotectant ratios of 1:0.1, 1:0.5, 1:1, and 1:2. This resulted in a total of nine samples. The final volume of each sample was 400 μL, and each contained the same amounts of nanoparticles. DLS measurements (size and zeta potential) of the samples were taken prior to placing them at −80 °C. The samples were then placed at −80 °C, and the same measurements of size and zeta potential were taken every hour. This was done by removing the samples from the −80 °C storage, letting them thaw for approximately 15 min, and taking the DLS measurements. This was repeated for three cycles, each of which had the NPs at −80 °C for 1 h.
Long-Term Storage of NPs.
Long-term storage of the Mal-IVM-NPs at −80 °C with and without cryoprotectants was done to gauge the ability of the cryoprotectants to maintain the NPs’ stability (based on size and zeta potential) over an extended period of time. Mal-IVM-NPs were produced as described above, with 10 mg/mL PLGA-PEG-Mal polymer and 2 mg/mL of ivermectin. Because the previous testing revealed that the higher concentrations of cryoprotectants maintained size and zeta potential of the NPs best, only these concentrations were used in the long term testing. Therefore, the five samples consisted of the NPs alone and in the presence of sucrose and trehalose, in ratios of 1:1 and 1:2 (NP:cryoprotectant ratio). The total volume of each sample was 50 μL. Sixteen total vials of each sample were produced because the testing was expected to run for up to 6 months. Size and zeta potential measurements were to be taken after 1, 2, 3, 4, 5, 6, 7, 15, 30, 45, 60, 75, 90, 120, 150, and 180 days.
From previous testing, it was observed that nanoparticles often gave more consistent size and zeta potential measurements when allowed to thaw for a slightly longer period of time. This allowed the NPs in solution, regardless of whether cryoprotectants were present or absent, to stabilize at room temperature and properly equilibrate. In previous testing, though the NPs had thawed and were no longer frozen, there temperature still may have been below room temperature. Thus, during the long-term storage testing, NPs were allowed to thaw for between 30 and 45 min to ensure the temperature of the solution reached close to room temperature.
Drying Process.
Mal-IVM-NPs were produced as described above, with 10 mg/mL PLGA–PEG-Mal polymer and 2 mg/mL ivermectin. Then, NPs were dried, with and without the cryoprotectants, using low pressure and temperature. Sucrose and trehalose were added in 1:2 NP/cryoprotectant ratios, and a third sample contained NPs alone. NPs were dried at approximately −50 °C and 2 Pa using a VirTis Benchtop K Freeze-Dryer. These powdered forms of the NPs were reconstituted in 1 mL nanopure water. High amounts of mixing were needed to ensure proper reconstitution, as some aggregation had resulted from the drying process. Size and zeta potential measurements were then taken.
Placental Barrier Formation.
JEG-3 cells were plated in trans-well plate at a density of 50,000 cells/well on the apical side in 500 μL of DMEM (with 10% FBS) media. On the basal side, 1 mL of fresh media was added and cells were grown up to 9 days. Before the addition of compounds, the integrity of the monolayer was monitored by TEER using Epithelial Volt-ohmmeter. Media was replenished every 2 days. On the ninth day, ivermectin, NT-OH-IVM-NP, or T-Fc-IVM-NP were added to the cells at a concentration of 20 μg/mL with respect to ivermectin, and were incubated for 12 h. Apical and basal media were collected in eppendorf tubes and dissolved in 2 mL of acetonitrile. As an internal standard, 10 μg/mL of ivermectin was added to the collected media. This mixture was sonicated for 20 min followed by centrifugation at 2100g for 10 min. From the precipitated debris, the supernatant was gently collected. Meanwhile, Strata C18-T columns were activated by passing 1 mL of methanol and water through the filter in sequence. The collected supernatant was passed through the activated column in order to get rid of remaining debris and impurities. The column was washed with 1–2 mL of 5% methanol in order to remove the impurities. The ivermectin from the column was collected in 2 mL of methanol and quantified using HPLC (wavelength = 268 nm at 21.01 min). In order to confirm the formation of the epithelial barrier, immunostaining of ZO-1 was performed.
Statistics.
All data were expressed as mean ± SD (standard deviation). Statistical analyses were performed using GraphPad Prism software v. 5.00. Comparisons between two values were performed using an unpaired Student t test. A one-way ANOVA with a posthoc Tukey test was used to identify significant differences among the groups.
Supplementary Material
ACKNOWLEDGMENTS
This work was supported by the Florida Department of Health Zika Research Grant Initiative Award No. 7ZK28 and by the Sylvester Comprehensive Cancer Center, University of Miami Miller School of Medicine. S. Deo and S. Daunert thank NIGMS (R01GM114321, R01GM127706) and the National Science Foundation (CHE-1506740, CBET-1841419) for funding support. S. Daunert is grateful to the Miller School of Medicine of the University of Miami for the Lucille P. Markey Chair in Biochemistry and Molecular Biology. We thank Kathryn S. Smith for her initial involvement in these studies. We also thank Patricio Pichling for his help in synthesizing Mal-NHS.
Footnotes
Supporting Information
The Supporting Information is available free of charge on the ACS Publications website at DOI: 10.1021/acsnano.9b02807.
Detailed materials and instruments, other experimental methods, complete characterization of polymers and nanoparticles, and other relevant data (PDF)
The authors declare no competing financial interest.
All animal studies were approved by the Institutional Animal Care and Use Committee of University of Miami Miller School of Medicine.
REFERENCES
- (1).Ritter JM; Martines RB; Zaki SR Zika Virus: Pathology from the Pandemic. Arch. Pathol. Lab. Med 2017, 49–59. [DOI] [PubMed] [Google Scholar]
- (2).Falcao MB; Cimerman S; Luz KG; Chebabo A; Brigido HA; Lobo IM; Timerman A; Angerami RN; da Cunha CA; Bacha HA; Alves JR; Barbosa AN; Teixeira RF; Weissmann L; Oliveira PR; Cyrillo MA; Bandeira AC Management of Infection by the Zika Virus. Ann. Clin. Microbiol. Antimicrob 2016, 15, 57. [DOI] [PMC free article] [PubMed] [Google Scholar]
- (3).Ekins S; Mietchen D; Coffee M; Stratton TP; Freundlich JS; Freitas-Junior L; Muratov E; Siqueira-Neto J; Williams AJ; Andrade C Open Drug Discovery for the Zika Virus. F1000Res. F1000Research 2016, 5, 150. [DOI] [PMC free article] [PubMed] [Google Scholar]
- (4).Hajra A; Bandyopadhyay D; Hajra SK Zika virus: A Global Threat to Humanity: A Comprehensive Review and Current Developments. N Am. J. Med. Sci 2016, 8, 123–128. [DOI] [PMC free article] [PubMed] [Google Scholar]
- (5).Barreiro P Evolving RNA Virus Pandemics: HIV, HCV, Ebola, Dengue, Chikunguya, and now Zika! AIDS Rev. 2016, 18, 54–55. [PubMed] [Google Scholar]
- (6).Xu M; Lee EM; Wen Z; Cheng Y; Huang WK; Qian X; Tcw J; Kouznetsova J; Ogden SC; Hammack C; Jacob F; Nguyen HN; Itkin M; Hanna C; Shinn P; Allen C; Michael SG; Simeonov A; Huang W; et al. Identification of Small-molecule Inhibitors of Zika Virus Infection and Induced Neural Cell Death via A Drug Repurposing Screen. Nat. Med 2016, 22, 1101–1107. [DOI] [PMC free article] [PubMed] [Google Scholar]
- (7).Mastrangelo E; Pezzullo M; De Burghgraeve T; Kaptein S; Pastorino B; Dallmeier K; de Lamballerie X; Neyts J; Hanson AM; Frick DN; Bolognesi M; Milani M Ivermectin is A Potent Inhibitor of Flavivirus Replication Specifically Targeting NS3 Helicase Activity: New Prospects for An Old Drug. J. Antimicrob. Chemother 2012, 67, 1884–1894. [DOI] [PMC free article] [PubMed] [Google Scholar]
- (8).Dallmeier K; Neyts J Zika and Other Emerging Viruses: Aiming at the Right Target. Cell Host Microbe 2016, 20, 420–422. [DOI] [PMC free article] [PubMed] [Google Scholar]
- (9).Barrows NJ; Campos RK; Powell ST; Prasanth KR; Schott-Lerner G; Soto-Acosta R; Galarza-Munoz G; McGrath EL; Urrabaz-Garza R; Gao J; Wu P; Menon R; Saade G; Fernandez-Salas I; Rossi SL; Vasilakis N; Routh A; Bradrick SS; Garcia-Blanco MA A Screen of FDA-Approved Drugs for Inhibitors of Zika Virus Infection. Cell Host Microbe 2016, 20, 259–270. [DOI] [PMC free article] [PubMed] [Google Scholar]
- (10).Poland GA; Kennedy RB; Ovsyannikova IG; Palacios R; Ho PL; Kalil J Development of Vaccines Against Zika Virus. Lancet Infect. Dis 2018, 18, E211–E219. [DOI] [PubMed] [Google Scholar]
- (11).Elkassaby MH Ivermectin Uptake and Distribution in the Plasma and Tissue of Sudanese and Mexican Patients Infected with Onchocerca Volvulus. Trop Med. Parasitol 1991, 42, 79–81. [PubMed] [Google Scholar]
- (12).Ali M; Afzal M; Verma M; Bhattacharya SM; Ahmad FJ; Samim M; Abidin MZ; Dinda AK Therapeutic Efficacy of Poly (Lactic-Co-Glycolic Acid) Nanoparticles Encapsulated Ivermectin (Nano-Ivermectin) against Brugian Filariasis in Experimental Rodent Model. Parasitol. Res 2014, 113, 681–691. [DOI] [PubMed] [Google Scholar]
- (13).Binnebose AM; Haughney SL; Martin R; Imerman PM; Narasimhan B; Bellaire BH Polyanhydride Nanoparticle Delivery Platform Dramatically Enhances Killing of Filarial Worms. PLoS Neglected Trop. Dis 2015, 9, No. e0004173. [DOI] [PMC free article] [PubMed] [Google Scholar]
- (14).Cola DF; Pasquoto T; Guilger M; de Lima R; da Silva CMG; Fraceto LF Lipid Nanostructured Carriers Systems for Ivermectin and Methoprene Aiming Parasite Control. Quim. Nova 2016, 39, 1034–1043. [Google Scholar]
- (15).Croci R; Bottaro E; Chan KWK; Watanabe S; Pezzullo M; Mastrangelo E; Nastruzzi C Liposomal Systems as Nanocarriers for the Antiviral Agent Ivermectin. Int. J. Biomater 2016, 1. [DOI] [PMC free article] [PubMed] [Google Scholar]
- (16).Gamboa GVU; Palma SD; Lifschitz A; Ballent M; Lanusse C; Passirani C; Benoit JP; Allemandi DA Ivermectin-Loaded Lipid Nanocapsules: Toward the Development of A New Antiparasitic Delivery System for Veterinary Applications. Parasitol. Res 2016, 115, 1945–1953. [DOI] [PubMed] [Google Scholar]
- (17).Guo D; Dou D; Li X; Zhang Q; Bhutto ZA; Wang L Ivermection-Loaded Solid Lipid Nanoparticles: Preparation, Characterisation, Stability and Transdermal Behaviour. Artif. Cells, Nanomed., Biotechnol 2018, 46, 255–262. [DOI] [PubMed] [Google Scholar]
- (18).Starkloff WJ; Bucala V; Palma SD; Vidal NL G. Design and In Vitro Characterization of Ivermectin Nanocrystals Liquid Formulation Based on A Top-Down Approach. Pharm. Dev. Technol 2017, 22, 809–817. [DOI] [PubMed] [Google Scholar]
- (19).Tavares EJM; de Araujo DR; Fraceto LF Ivermectin-Loaded Polymeric Nanoparticles: Screening the Effects of Polymers, Methods, and the Usefulness of Mathematical Models. J. Nanosci. Nanotechnol 2017, 17, 4218–4234. [Google Scholar]
- (20).Ullio-Gamboa G; Palma S; Benoit J; Allemandi D; Picollo MI; Toloza AC Ivermectin Lipid-Based Nanocarriers as Novel Formulations Against Head Lice. Parasitol. Res 2017, 116, 2111–2117. [DOI] [PubMed] [Google Scholar]
- (21).Soppimath KS; Aminabhavi TM; Kulkarni AR; Rudzinski WE Biodegradable Polymeric Nanoparticles as Drug Delivery Devices. J. Controlled Release 2001, 70, 1–20. [DOI] [PubMed] [Google Scholar]
- (22).Farokhzad OC; Jon SY; Khadelmhosseini A; Tran TNT; LaVan DA; Langer R Nanopartide-Aptamer Bioconjugates: A New Approach for Targeting Prostate Cancer Cells. Cancer Res. 2004, 64, 7668–7672. [DOI] [PubMed] [Google Scholar]
- (23).Langer R Drug delivery. Drugs on Target. Science 2001, 293, 58–59. [DOI] [PubMed] [Google Scholar]
- (24).Dhar S; Kolishetti N; Lippard SJ; Farokhzad OC Targeted Delivery of A Cisplatin Prodrug for Safer and More Effective Prostate Cancer Therapy In Vivo. Proc. Natl. Acad. Sci. U. S. A 2011, 108, 1850–1855. [DOI] [PMC free article] [PubMed] [Google Scholar]
- (25).Zhu X; Wu J; Shan W; Tao W; Zhao L; Lim JM; D’Ortenzio M; Karnik R; Huang Y; Shi J; Farokhzad OC Polymeric Nanoparticles Amenable to Simultaneous Installation of Exterior Targeting and Interior Therapeutic Proteins. Angew. Chem., Int. Ed 2016, 55, 3309–3312. [DOI] [PMC free article] [PubMed] [Google Scholar]
- (26).Chopra S; Bertrand N; Lim JM; Wang A; Farokhzad OC; Karnik R Design of Insulin-Loaded Nanoparticles Enabled by Multistep Control of Nanoprecipitation and Zinc Chelation. ACS Appl. Mater. Interfaces 2017, 9, 11440–11450. [DOI] [PMC free article] [PubMed] [Google Scholar]
- (27).Shi S; Kong N; Feng C; Shajii A; Bejgrowicz C; Tao W; Farokhzad OC Drug Delivery Strategies for the Treatment of Metabolic Diseases. Adv. Healthcare Mater 2019, 8, No. e1801655. [DOI] [PMC free article] [PubMed] [Google Scholar]
- (28).Dickinson BL; Badizadegan K; Wu Z; Ahouse JC; Zhu X; Simister NE; Blumberg RS; Lencer WI Bidirectional Fcrn-Dependent IgG Transport in A Polarized Human Intestinal Epithelial Cell Line. J. Clin. Invest 1999, 104, 903–911. [DOI] [PMC free article] [PubMed] [Google Scholar]
- (29).Yoshida M; Claypool SM; Wagner JS; Mizoguchi E; Mizoguchi A; Roopenian DC; Lencer WI; Blumberg RS Human Neonatal Fc Receptor Mediates Transport of IgG into Luminal Secretions for Delivery of Antigens to Mucosal Dendritic Cells. Immunity 2004, 20, 769–783. [DOI] [PubMed] [Google Scholar]
- (30).Israel EJ; Taylor S; Wu Z; Mizoguchi E; Blumberg RS; Bhan A; Simister NE Expression of the Neonatal Fc Receptor, FcRn, on Human Intestinal Epithelial Cells. Immunology 1997, 92, 69–74. [DOI] [PMC free article] [PubMed] [Google Scholar]
- (31).Raghavan M; Gastinel LN; Bjorkman PJ The Class I Major Histocompatibility Complex Related Fc-Receptor Shows pH-Dependent Stability Differences Correlating with Immunoglobulin Binding and Release. Biochemistry 1993, 32, 8654–8660. [DOI] [PubMed] [Google Scholar]
- (32).Pridgen EM; Alexis F; Kuo TT; Levy-Nissenbaum E; Karnik R; Blumberg RS; Langer R; Farokhzad OC Transepithelial Transport of Fc-Targeted Nanoparticles by the Neonatal Fc Receptor for Oral Delivery. Sci. Transl. Med 2013, 5, 213ra167. [DOI] [PMC free article] [PubMed] [Google Scholar]
- (33).Song H; Qi J; Haywood J; Shi Y; Gao GF Zika Virus NS1 Structure Reveals Diversity of Electrostatic Surfaces Among Flaviviruses. Nat. Struct. Mol. Biol 2016, 23, 456–458. [DOI] [PubMed] [Google Scholar]
- (34).Watterson D; Modhiran N; Young PR The Many Faces of the Flavivirus NS1 Protein offer A Multitude of Options for Inhibitor Design. Antiviral Res. 2016, 130, 7–18. [DOI] [PubMed] [Google Scholar]
- (35).Surnar B; Basu U; Banik B; Ahmad A; Marples B; Kolishetti N; Dhar S Nanotechnology-mediated crossing of two impermeable membranes to modulate the stars of the neurovascular. Proc. Natl. Acad. Sci. U. S. A 2018, 115, E12333–E12342. [DOI] [PMC free article] [PubMed] [Google Scholar]
Associated Data
This section collects any data citations, data availability statements, or supplementary materials included in this article.