Abstract
Background
Isocitrate dehydrogenase (IDH) mutations are highly frequent in glioma, producing high levels of the oncometabolite D-2-hydroxyglutarate (D-2HG). Hence, D-2HG represents a valuable imaging marker for IDH-mutated human glioma.
Purpose
To develop and evaluate a super-resolution three-dimensional (3D) MR spectroscopic imaging strategy to map D-2HG and tumor metabolism in IDH-mutated human glioma.
Materials and Methods
Between March and September 2018, participants with IDH1-mutated gliomas and healthy participants were prospectively scanned with a 3-T whole-brain 3D MR spectroscopic imaging protocol optimized for D-2HG. The acquired D-2HG maps with a voxel size of 5.2 × 5.2 × 12 mm were upsampled to a voxel size of 1.7 × 1.7 × 3 mm using a super-resolution method that combined weighted total variation, feature-based nonlocal means, and high-spatial-resolution anatomic imaging priors. Validation with simulated healthy and patient data and phantom measurements was also performed. The Mann-Whitney U test was used to check that the proposed super-resolution technique yields the highest peak signal-to-noise ratio and structural similarity index.
Results
Three participants with IDH1-mutated gliomas (mean age, 50 years ± 21 [standard deviation]; two men) and three healthy participants (mean age, 32 years ± 3; two men) were scanned. Twenty healthy participants (mean age, 33 years ± 5; 16 men) underwent a simulation of upsampled MR spectroscopic imaging. Super-resolution upsampling improved peak signal-to-noise ratio and structural similarity index by 62% (P < .05) and 7.3% (P < .05), respectively, for simulated data when compared with spline interpolation. Correspondingly, the proposed method significantly improved tissue contrast and structural information for the acquired 3D MR spectroscopic imaging data.
Conclusion
High-spatial-resolution whole-brain D-2-hydroxyglutarate imaging is possible in isocitrate dehydrogenase 1-mutated human glioma by using a super-resolution framework to upsample three-dimensional MR spectroscopic images acquired at lower resolution.
© RSNA, 2020
Online supplemental material is available for this article.
See also the editorial by Huang and Lin in this issue.
Summary
Metabolic mapping of D-2-hydroxyglutarate and tumor metabolism in isocitrate dehydrogenase 1–mutated human gliomas was performed with a resolution of 1.7 × 1.7 × 3 mm by using super-resolution upsampling and whole-brain three-dimensional MR spectroscopic imaging.
Key Results
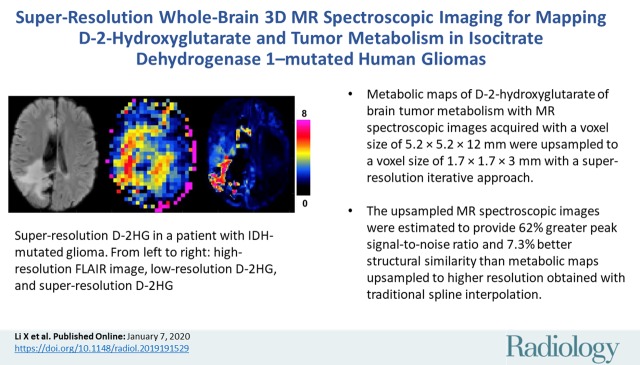
■ Metabolic maps of D-2-hydroxyglutarate of brain tumor metabolism with MR spectroscopic images acquired with a voxel size of 5.2 × 5.2 × 12 mm were upsampled to a voxel size of 1.7 × 1.7 × 3 mm with a super-resolution iterative approach.
■ The upsampled MR spectroscopic images were estimated to provide 62% greater peak signal-to-noise ratio and 7.3% better structural similarity than metabolic maps upsampled to higher resolution obtained with traditional spline interpolation.
Introduction
MR spectroscopy is a highly versatile metabolic imaging technique that can be used to perform noninvasive measurements for approximately 20 metabolites in the human brain (1). Metabolite levels in disease vary and have a different time course compared with anatomic changes, providing molecular information about disease mechanisms that is not available with structural imaging (2). The spatial extent of metabolic alterations and anatomic lesions is often different, which is important to assess disease burden (3). Unfortunately, the spatial resolution obtained with MR spectroscopic imaging is limited by low metabolite concentrations. Typical spatial resolution in clinical MR spectroscopic imaging is 10 mm (1), and even with very advanced research protocols (4,5), the MR spectroscopic imaging spatial resolution is still coarser than the spatial resolution of other MRI modalities. Low-spatial-resolution MR spectroscopic imaging may miss small lesions or blur the boundaries and heterogeneity of large lesions. While the acquisition of MR spectroscopic images with the same resolution used to acquire anatomic images is not possible, upsampling MR spectroscopic imaging can bridge the resolution gap. Super-resolution patch-based methods (6) can produce realistic anatomiclike MR spectroscopic images with enhanced spatial information and quality over simpler linear or spline interpolation methods, which oversmooth images without improving anatomic detail.
Advanced upsampling, such as patch-based nonlocal means (6), total variation (TV) (7,8), and deep learning methods (9), can achieve higher resolution and can simultaneously increase structural information. Deep learning demands a large amount of training data, which is scarce for MR spectroscopic imaging. However, patch-based nonlocal means have a mathematical formulation that does not require large data sets and takes advantage of anatomic priors from high-spatial-resolution MRI (10,11) to guide the upsampling of lower-resolution MR spectroscopic imaging.
Super-resolution MR spectroscopic imaging has been used previously for two-dimensional single-slice MR spectroscopic imaging (12,13); however, to our knowledge, it has not yet been used for three-dimensional (3D) MR spectroscopic imaging. Simply scaling the previously proposed approach would be suboptimal for 3D data. A method for super-resolution 3D MR spectroscopic imaging would be useful to evaluate oncogenic isocitrate dehydrogenase (IDH) 1 and 2 mutations, which are highly frequent in adult gliomas (14), leading to a highly distinctive molecular and clinical phenotype (15) that prompted the inclusion of IDH status as a major marker in the 2016 World Health Organization classification of brain tumors (16). The hallmark metabolic alteration of cancer IDH1 and IDH2 mutations is the neomorphic production of D-2-hydroxyglutarate (D-2HG) (17), which is an oncometabolite that further drives the epigenome, metabolome, and microenvironment toward tumor formation (18). Because of its tumor specificity, D-2HG is a valuable imaging marker in diagnosis (19), monitoring (20), and assessment of tumor burden (21), treatment response, and pharmacodynamics of targeted therapy in IDH1-mutated gliomas (22).
Current D-2HG imaging methods have technical limitations, such as partial brain coverage and low resolution that may miss parts of the tumor or important features, making the interoperability with other imaging modalities cumbersome. Whole-brain coverage and high resolution are necessary to provide D-2HG image quality comparable to that of other imaging modalities used by radiologists in brain tumor protocols. We aim to report a method for super-resolution 3D MR spectroscopic imaging that can be used in human glioma to map the oncometabolite D-2HG and other metabolic alterations associated with IDH1 mutations.
Materials and Methods
Our proposed strategy consists of three main steps: (a) denoise the low-resolution MR spectroscopic imaging metabolite maps, (b) initialize super-resolution MR spectroscopic imaging by weighted TV upsampling, and (c) calculate the interpolation weights by using initialized MR spectroscopic imaging and high-spatial-resolution MRI jointly to update the metabolite maps iteratively until they converge to form the final super-resolution metabolite image. A schematic overview of the proposed strategy is presented in Figure E1 (online).
Three-dimensional MR Spectroscopic Image Acquisition
Details of the acquisition and processing of whole-brain 3D MR spectroscopic imaging data are fully presented in Appendix E1 (online). Briefly, a robust 3D MR spectroscopic imaging sequence (23) using adiabatic excitation, stack-of-spirals encoding, and real-time motion correction shim update was used, as shown in Figure E2 (online). All measurements were performed between March and September 2018 by using a 3-T MR imager (Tim Trio; Siemens, Malvern, Pa) equipped with a 32-channel head coil. All 3D MR spectroscopic sequences were performed by two authors (O.C.A., B.S.; 11 and 6 years of experience, respectively).
Three-dimensional MR Spectroscopic Imaging Upsampling
The low-resolution metabolic maps acquired with a 5.2 × 5.2 × 12 mm nominal voxel size (matrix, 46 × 46 × 10) were upsampled by factors of three and four along in-plane and slice dimensions, respectively, to obtain high-resolution metabolic maps at a 1.7 × 1.7 × 3 mm nominal voxel size (matrix, 138 × 138 × 40), according to the following steps.
Spectral quality and fitting.—In the first step (O.C.A, B.S.; 11 and 6 years of experience, respectively), voxels that do not fulfill spectral quality criteria (Cramer-Rao lower bound < 20%, line width < 0.15 ppm, signal-to-noise ratio > 3) and that have unreliable metabolite concentration fitting above the upper limit of acceptable confidence interval (metabolite concentration < mean + 5 × standard deviation) were rejected from the low-resolution maps. For voxels at the boundary of the brain, the threshold for rejecting outliers was set lower (metabolite concentration < mean + 1 × standard deviation) because residual lipid signal not removed by the L1 penalty strongly overestimated metabolite levels.
Nonlocal means denoising.—Because of low metabolite concentration, MR spectroscopic imaging has low signal-to-noise ratio, and metabolic maps often show large variation between neighboring voxels. Nonlocal means denoising (24) can be used to reduce excessive and spurious variability in images. We designed a featured-based nonlocal means denoising method for metabolic maps (X.L., 5 years of experience), which is achieved by a weighted average of selected voxels similar to the targeted voxels. The weights corresponding to the selected voxels are estimated from low-resolution anatomic MRI by feature-based nonlocal means (11). In addition, this recovers lost information during voxel removal by the previous spectral quality step.
Mathematical formulation of super resolution.—Two authors (X.L., K.J.; 5 and 8 years of experience, respectively) were responsible for this aspect of the study. Given a low-resolution metabolite map (y), the unknown high-resolution metabolite map (x) can be mathematically modeled as follows:
,
|
where H is a blurring and downsampling operator and n denotes the noise term. To estimate x from y, the corresponding optimization problem can be formulated as follows:
,
|
where R(x) is the regularization term and λ is the regularization parameter (or vector), which balances the data consistency and the regularization term. Since the formulated optimization problem in Equation (2) is nonconvex, good initialization plays a substantial role in improving the final output. Thereafter, we propose a two-phase optimization procedure. The aim of the first phase is to provide initialization at its best. The aim of the second phase is to further improve the initial upsampling.
Phase I: weighted TV-based super-resolution initialization.—TV (7) is well suited for MR spectroscopic imaging initialization because of its ability to preserve edges, reduce the noise level, preserve small features, and even correct the partial volume effect to some extent. However, the TV method essentially belongs to the smoothing method category, which may penalize some high-frequency information. To overcome this obstacle as much as possible, we propose a weighted TV method for initial upsampling of low-resolution metabolite maps, where the regularization term in Equation (3) is chosen as:
 |
and , where
,
|
where 0 < θ < 1,
xa(vl) denotes the
intensity value of anatomic image at voxel vl and
 is a gradient
operator. With this formulation, edge priors from the high-resolution anatomic
MRI xa are incorporated in the regularization
parameter to initialize metabolite maps. An alternating direction method of
multipliers–type method (25)
(Appendix E2
[online]) is proposed to solve the optimization problem in Equation (2).
Phase II: feature-based nonlocal means upsampling.—To perform an accurate interpolation on the super-resolution initialization from phase I, it is critically important to estimate the correct compartment type similarity given the target voxels. As shown elsewhere (11), incorporating unique and hierarchical features into the patch-based nonlocal means method is helpful to find similar voxels and estimate the corresponding interpolation weights.
Mathematically, the feature-based nonlocal means can be formulated as the following optimization problem:
,
|
where
 is a small
positive number, and the regularization term is defined as follows:
,
|
where Ω(v) is the patch neighborhood of voxel v, and the voxel weights are calculated as follows:
,
|
based on the
feature vector components  , which is the image itself,
 , which represents
the gradient information of the images,
  ,
,  ,
, ,
,  , …,
, …,
 ,
,  ,
,  where * is a
convolutional operator,
 ,
,  , are Gaussian
kernels with different standard deviation, φ is the wavelet transform
operator (26), and e is
the Canny edge detector (27). Moreover,
the constraint in Equation (5),
when HHT=I, is equivalent to
, 
|
which represents the subsampling consistency.
In practice, voxel information from both MRI and MR spectroscopic imaging is combined to calculate the weights:
,
|
to account for the fact that lesions in MR spectroscopic imaging and MRI may look different. For instance, when the lesion is visible with MR spectroscopic imaging but not MRI, the weights estimated with Equation (9) will be dominated by MR spectroscopic imaging (α = 1). However, in the first iteration, only weights from structural MRI are used (α = 0) to avoid suboptimal solutions since initialized MR spectroscopic imaging may not be accurate. The upsampled MR spectroscopic imaging then becomes more like the correct result and thus can better contribute to upsampling in the next iterations when a nonzero α is used. The weights updated in this manner basically involve a self-similarity searching procedure. Computation was sped up by following reasonable assumptions: First, only the N highest values of w(v,u) are kept by assuming that there are N voxels with similar properties to the voxel of interest and that the rest of the voxels are irrelevant. Second, there were few Gaussian kernel filters. Third, the weights need to be calculated only twice, for zero and nonzero α. Specifically, the 10 highest voxels and two Gaussian kernels were used as previously proposed for a neighborhood patch size of 5 × 5 × 3 and ε of 10−3. With this implementation, the total computation time, including preprocessing and phase I and II steps, was 5 minutes with Matlab 9.3 (Mathworks, Natick, Mass) on a PowerEdge R730 workstation (Dell, Round Rock, Tex) with 24 CPU cores (Intel Xeon E5–2687 W v4 3.0GHz; Intel, Santa Clara, Calif) and 128-GB RAM (RDIMM, 2400MT/s) running Linux Centos 7.6 (https://www.centos.org/). An overview of the proposed algorithm is given in Appendix E2 (online) as algorithm 2, and the Matlab code is available on Github (https://github.com/Chrisxql/3D-Superresolution-MRSI).
Simulations.—To verify the performance of our super-resolution approach, we used simulated data where the ground truth was known. Simulated metabolic maps were obtained by using structural brain MRI scans from 20 healthy participants (mean age, 33 years ± 5; 16 men) acquired at our institution. The 1-mm isotropic T1-weighted multiecho magnetization-prepared rapid gradient-echo images were segmented with FSL software (FMRIB Software Library, Oxford, England) (28), and metabolic maps for N-acetylaspartate (NAA) were obtained by assuming physiologic concentrations in the gray matter (10 mmol/L), white matter (11 mmol/L) and corticospinal fluid (0 mmol/L). The 1-mm NAA maps were downsampled in the k-space to the acquired MR spectroscopic imaging low resolution (voxel, 5.2 × 5.2 × 12 mm; matrix, 46 × 46 × 10) and ground-truth MR spectroscopic imaging high resolution (voxel, 1.7 × 1.7 × 3 mm; matrix, 138 × 138 × 40). We also investigated the performance for simulated tumors. A tumor region of interest was defined on the high-resolution MRI scan, and the voxel values inside the region of interest were modified assuming tumor metabolite levels. The super-resolution method was used to upsample the low-resolution maps, and results were quantitatively verified against the ground-truth maps using peak signal-to-noise ratio (PSNR) and structural similarity index (SSIM), as defined in Appendix E2 (online). Metabolite maps were also upsampled by simpler interpolation methods, such as nearest neighbor, spline, or weighted TV without the feature nonlocal means anatomic priors, and their results were compared with results obtained with the super-resolution method.
Human participants.—The proposed method was tested on MR spectroscopic imaging data acquired in human participants. All recruited participants gave written informed consent for this institutional review board–approved protocol. Participants were recruited and divided equally into a group of three healthy participants and three participants with IDH1-mutated gliomas confirmed with biopsy (29,30).
Phantom.—A structural calibration phantom with six metabolic compartments was built to test the accuracy of mapping different D-2HG concentrations in the presence of other brain metabolites, as described in Appendix E1 (online).
Statistical Analysis
The Mann-Whitney U test was used to verify that super-resolution by weighted TV with feature-based nonlocal means (FNLM) provided the highest PSNR and SSIM compared with simpler upsampling methods. The Matlab statistical toolbox (Mathworks, Natick, Mass) was used to run the test.
Results
Simulations
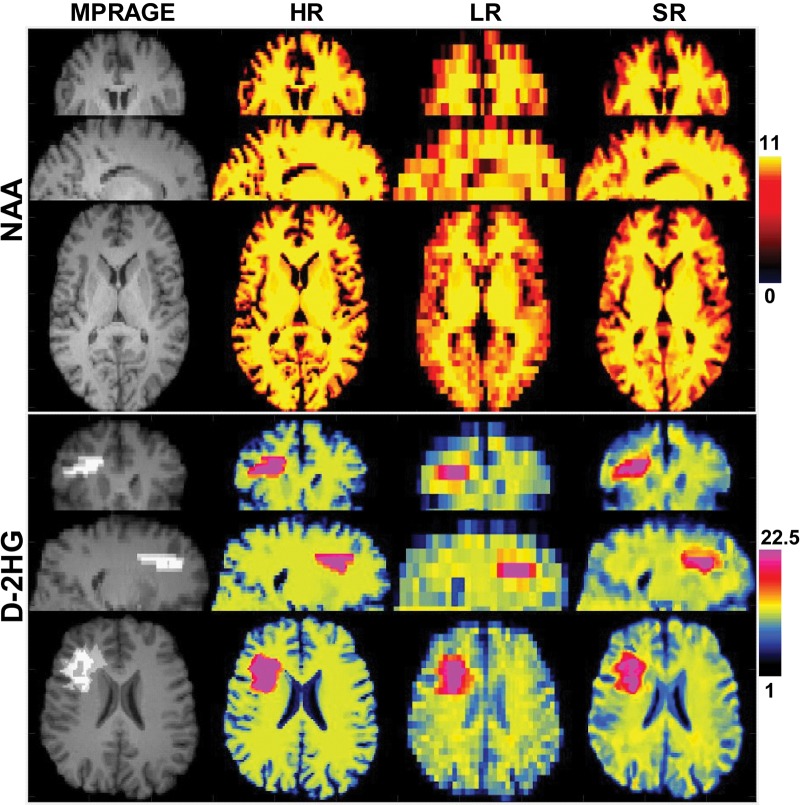
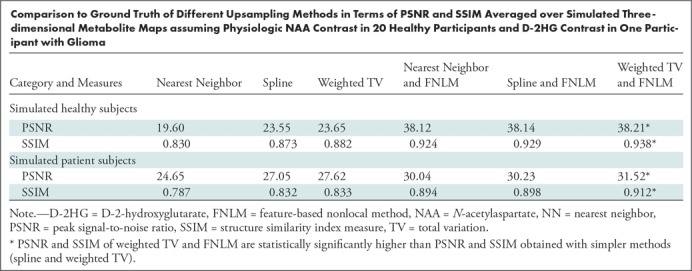
Simulated metabolic maps were obtained by using structural brain MRI scans from 20 healthy participants (mean age, 33 years ± 5; 16 men). The performance of the proposed super-resolution framework and a comparison with ground-truth high-resolution simulated data are shown in Figure 1, in which an NAA map in a healthy participant and a D-2HG map in a participant with IDH-mutated glioma are presented. Upsampling of low-resolution MR spectroscopic imaging can be initialized by using the nearest neighbor, spline, or weighted TV and FNLM techniques. The highest agreement to ground truth is obtained for weighted TV initialization with FNLM upsampling. The other cases are shown in Figure E3 (online). Quantitative estimates of the performance are listed in the Table and are averaged over all 20 data sets, which indicate improvements of 62% (P < .05) for PSNR and 7.3% (P < .05) for SSIM between simpler upsampling (spline) and the weighted TV and FNLM super-resolution techniques. Since the combination of weighted TV and FNLM yields the highest PSNR and SSIM, we selected this as the method of choice for in vivo MR spectroscopic imaging. The role of the upsampling factor and different lesions was further explored in Figures E4 and E5 (online), respectively.
Figure 1:
Upsampled simulated healthy N-acetylaspartate (NAA) and D-2-hydroxyglutarate (D-2HG) metabolite maps. From left to right, images were obtained with high-resolution T1-weighted MRI (matrix, 138 × 138 × 40) magnetization-prepared rapid gradient-echo (MPRAGE) and high-resolution (HR) (matrix, 138 × 138 × 40; ground truth), low-resolution (LR) (matrix, 46 × 46 × 10), and super-resolution (SR) (matrix, 138 × 138 × 40) MR spectroscopy.
Comparison to Ground Truth of Different Upsampling Methods in Terms of PSNR and SSIM Averaged over Simulated Three-dimensional Metabolite Maps assuming Physiologic NAA Contrast in 20 Healthy Participants and D-2HG Contrast in One Participant with Glioma
Phantom Studies
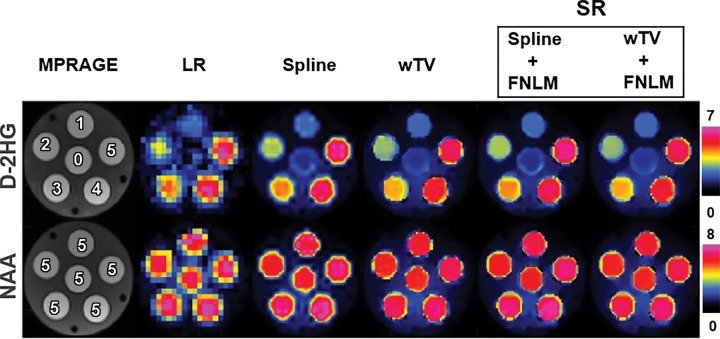
Figure 2 shows the results of upsampled metabolic maps acquired in the structural phantom. D-2HG mapping shows linear contrast across all six concentrations in the range of 0–5 mmol/L. It is important that there is clear distinction in the lower range of concentrations (0–2 mmol/L), which is more challenging for detection. The NAA map shows uniform contrast across all tubes for constant 6 mmol/L concentration. Figure E6 (online) shows the results of all the intermediate steps for comparison.
Figure 2:
Upsampled D-2-hydroxyglutarate (D-2HG) and total N-acetylaspartate (NAA) maps of the phantom. From left to right, images were obtained with high-spatial-resolution T1-weighted MRI magnetization-prepared rapid gradient-echo (MPRAGE) (matrix, 138 × 138), low-resolution (LR) total MR spectroscopy (matrix, 46 × 46), upsampled MR spectroscopy with spline interpolation (Spline), upsampled MR spectroscopy with weighted total variation (wTV), super-resolution (SR) MR spectroscopy with spline interpolation and the feature-based nonlocal means method (Spline + FNLM) or SR MR spectroscopy with weighted total variation and FNLM (wTV + FNLM). The numbers on MPRAGE images indicate D-2HG and NAA concentrations in each compartment.
In Vivo Human Studies
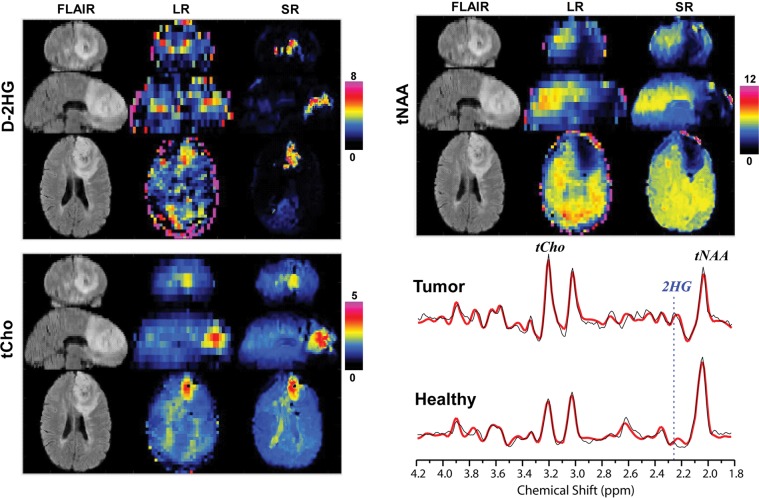
Three study participants with IDH1-mutated gliomas (mean age, 50 years ± 21; two men) and three healthy participants (32 years ± 3; two men) were evaluated with the super-resolution framework. Figure 3 shows the super-resolution D-2HG, total choline, and total NAA maps from a participant with IDH-mutated glioma. The super-resolution maps have substantially more structural information for both bright (D-2HG, total choline) and dark (total NAA) tumor contrast when compared with the low-resolution input maps. Importantly, lesions on super-resolution metabolic maps have different spatial extent when compared with lesions on fluid-attenuated inversion-recovery (FLAIR) images. An example of spectra from tumor and healthy voxels shows clear differences in the metabolic profile, with a distinctive spectral pattern around 2.25 ppm enhanced by the presence of D-2HG peaks. The case of a healthy participant is presented in Figure 4, where the super-resolution D-2HG map shows only very low background levels without brain structure features, while the total NAA and total choline maps, especially the former one, show clear anatomic details with delineation of ventricles and the white matter–gray matter border. Spectral quality removes outliers at the edge of the brain, while nonlocal denoising reduces spurious voxel variability inside the brain. Figure 5 shows low- and super-resolution D-2HG maps from all three participants with IDH-mutated glioma. There is clear improvement in delineation of tumor margins on the super-resolution maps. However, tumor margins and heterogeneity show differences between D-2HG maps and anatomic FLAIR images.
Figure 3:
Examples of upsampled D-2-hydroxyglutarate (D-2HG), total choline (tCho), and total N-acetylaspartate (tNAA) metabolic maps in a participant with isocitrate dehydrogenase–mutated glioma. Images are high-resolution anatomic T2-fluid-attenuated inversion-recovery (FLAIR) MRI scans and low-resolution (LR) (matrix, 46 × 46 × 10) and super-resolution (SR) (matrix, 138 × 138 × 40) maps. In each group, top, middle, and bottom images are coronal, sagittal, and axial views. The bottom right image shows spectra from tumor voxels, with the position of the 2.25-ppm peak of D-2HG indicated by the dotted line.
Figure 4:
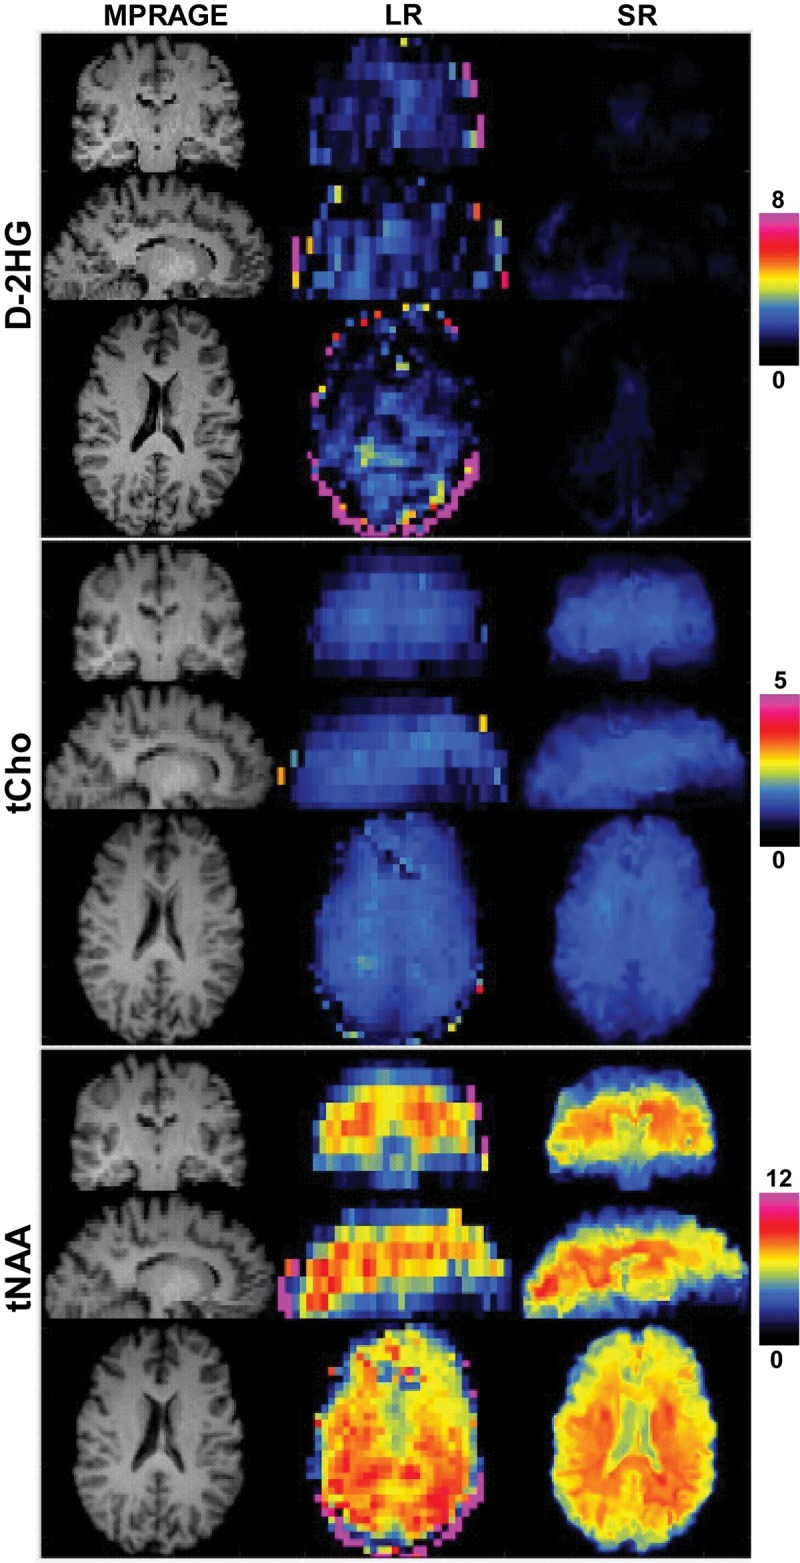
Examples of upsampled D-2-hydroxyglutarate (D-2HG), total choline (tCho), and total N-acetylaspartate (tNAA) metabolid in a healthy participant. High-resolution anatomic T1-weighted multiecho magnetization-prepared rapid gradient-echo (MPRAGE) image (matrix, 138 × 138 × 40) and low-resolution (LR) (matrix, 46 × 46 × 10) and super-resolution (SR) (matrix, 138 × 138 × 40) maps. For D-2HG, tCho, and tNAA, top, middle, and bottom rows correspond to coronal, sagittal, and axial views.
Figure 5:
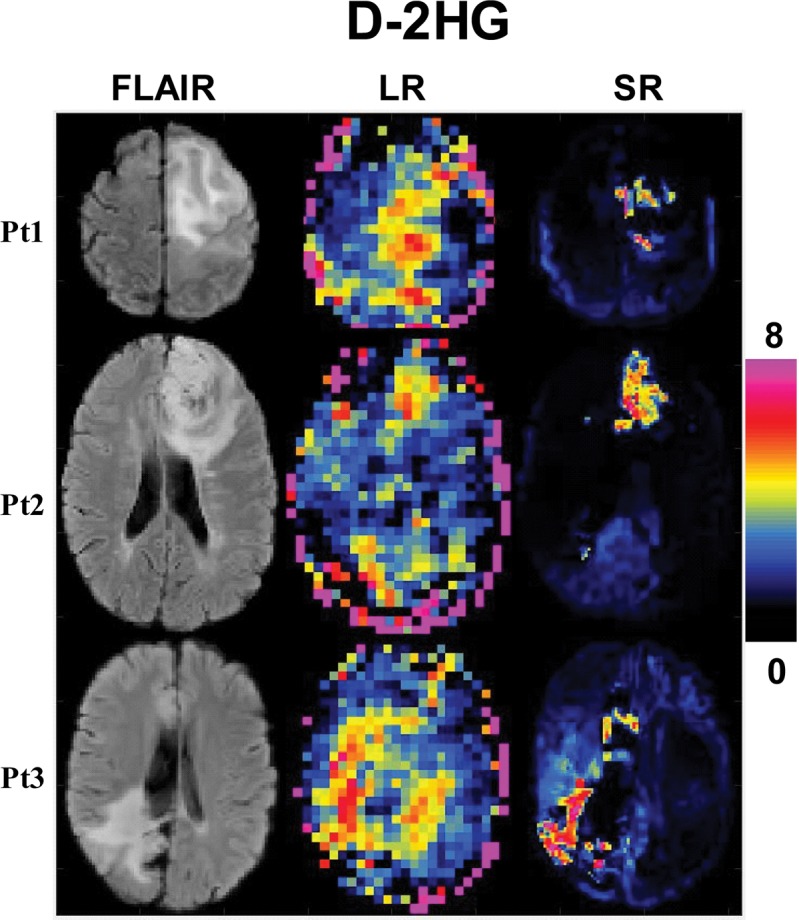
Super-resolution (SR) D-2-hydroxyglutarate (D-2HG) in three participants (Pt1, Pt2, Pt3) with isocitrate dehydrogenase–mutated glioma. High-resolution fluid-attenuated inversion-recovery image (FLAIR) (matrix, 138 × 138 × 40) and low-resolution (LR) (matrix, 46 × 46 × 10), and super-resolution (SR) (matrix, 138 × 138 × 40) D-2HG map.
Additional results are presented in Figure E7 (online) using metabolic ratios of total choline to total NAA and total NAA to total choline, which are often used in clinical MR spectroscopy studies of brain tumors (2). In addition, the ratio of D-2HG and glutamine to glutamate is calculated as a potential composite metabolic index for mutant IDH metabolism because the biochemical pathways of glutamine, glutamate, and D-2HG are interdependent. Figure E8 (online) shows the results of all the intermediate steps of the super-resolution pipeline in a participant with IDH-mutated glioma. Quantitative analysis for tumor region of interest comparing FLAIR and metabolic ratio maps is presented in Figure E9 (online).
Discussion
D-2-hydroxyglutarate (D-2HG) is a valuable biomarker for isocitrate dehydrogenase (IDH) glioma, and D-2HG imaging based on MR spectroscopic imaging was previously shown to have partial brain coverage and low spatial resolution. However, whole-brain high-spatial-resolution D-2HG imaging would be necessary to better map the active regions and margins of the tumor for neurosurgery, radiation, and chemotherapy. A super-resolution iterative approach based on feature-based nonlocal means and joint anatomic priors can improve spatial resolution of D-2HG imaging with higher peak signal-to-noise ration (PSNR) (67%, P < .05) and structural similarity index (SSIM) (7.3%, P < .05) over simpler spline interpolation.
The spatial resolution of previous in vivo D-2HG spectroscopy studies ranged from single voxel measurements of 2–27 cm3 (19,31–33) to multivoxel acquisition with voxels of 0.25–8 cm3 (34–36), with the smallest voxel size achieved in a single-slice measurement (35). Our 3D MR spectroscopic imaging technique can yield whole-brain D-2HG images with 0.32-cm3 voxels (5.2 × 5.2 × 12 mm voxel). The proposed super-resolution approach further improves the voxel size to 0.08 cm3 (1.7 × 1.7 × 3 mm voxel). The super-resolution technique has been shown only for single-slice MR spectroscopic imaging (37); however, the slice direction in 3D MR spectroscopic imaging has the lowest resolution, and improving resolution in this direction is the most challenging. Our upsampling framework is endowed with high computational efficiency and does not require brain segmentation, making it easier to implement and more advantageous in patients with glioma since segmentation software (38) is designed to work for typical brain contrast without deformation. Because of image quality, the 3D super-resolution metabolic maps can be integrated in the radiologic workflow.
Our results suggest that the proposed method has great clinical potential. The extent of abnormal tumor metabolism on the D-2HG maps is different than edema on the FLAIR image, with areas of high D-2HG possibly pointing toward the relevant tumor parts. Visually, both individual and ratio metabolic maps show tumor contrast that is higher than that on FLAIR images. These aspects could be important for refining target volumes for surgery or radiation therapy, since IDH-mutated gliomas also have low T1 contrast material uptake (39). The calibration phantom shows that our method can be used to titrate D-2HG levels, with good performance in the low-concentration range (0–2 mmol/L), which is important for challenging cases with early tumors, small tumors, or after treatment. Thus, this method may be helpful in early diagnosis, in longitudinal monitoring for early signs of objective treatment response, or to rule out pseudoresponse and pseudoprogression.
However, the performance of the proposed approach may be limited by several factors. When the data quality of the low-resolution metabolite maps is poor, such as on noisy metabolic maps or when there are artifacts and distortions, the super-resolution reconstruction quality can be crucially impacted, even when a preprocessing step is applied. Further, the potential error due to co-registration of prior anatomic images and the initialized super resolution might affect the final upsampled results, since the similar voxels and their corresponding estimated weights for the interpolated targeted voxels are inaccurate. Additionally, if some features were not captured at all by the low-resolution metabolite maps, they cannot be reconstructed in the upsampled results. On a positive note, this can be safe, meaning that no false tumors will be created in the metabolic maps if they do not exist. Another limitation is the absence of ground-truth metabolic MR spectroscopic images acquired with high spatial resolution, which makes it hard to validate the proposed method. Our study was also limited by the small number of subjects with mutant IDH gliomas, and our results need to be confirmed in a larger study.
To our knowledge, there are currently no other molecular probes that can specifically image isocitrate dehydrogenase mutations (40). D-2-hydroxyglutarate imaging is a powerful tool that may enable precision oncology in the setting of human glioma, can be performed by using clinical MRI scanners without expensive molecular probes or additional hardware, and may be repeated as needed without safety constraints. Hence, such a method is easy to perform and distribute in a fast and cost-effective way to triage patients with glioma for treatment or to accelerate translation of clinical trials. Although we demonstrated super-resolution MR spectroscopic imaging in participants with human glioma, our framework has more general applicability and could be used to image brain metabolism in individuals with any neurologic or psychiatric disease.
APPENDIX
SUPPLEMENTAL FIGURES
Funded by the National Cancer Institute (R01CA211080), MGH-Heidelberg Alliance and Seeman Family Foundation, and National Cancer Institute Specialized Programs of Research Excellence Brain Cancer (P50 CA165962).
Disclosures of Conflicts of Interest: X.L. disclosed no relevant relationships. B.S. disclosed no relevant relationships. K.J. disclosed no relevant relationships. B.T. disclosed no relevant relationships. J.S. disclosed no relevant relationships. D.P.C. Activities related to the present article: disclosed no relevant relationships. Activities not related to the present article: is a consultant for Lilly; is on the Merck speakers bureau. Other relationships: disclosed no relevant relationships. J.D. Activities related to the present article: disclosed no relevant relationships. Activities not related to the present article: is a consultant for Blue Earth Diagnostics and Unum Therapeutics; received royalties from Kluwer Wolters. Other relationships: disclosed no relevant relationships. T.T.B. Activities related to the present article: disclosed no relevant relationships. Activities not related to the present article: is on the Genomicare scientific advisory board. Other relationships: disclosed no relevant relationships. O.C.A. disclosed no relevant relationships.
Abbreviations:
- D-2HG
- D-2-hydroxyglutarate
- FLAIR
- fluid-attenuated inversion recovery
- FNLM
- feature-based nonlocal means
- IDH
- isocitrate dehydrogenase
- NAA
- N-acetylaspartate
- PSNR
- peak signal-to-noise ratio
- SSIM
- structural similarity index
- 3D
- three-dimensional
- TV
- total variation
References
- 1. Wilson M, Andronesi O, Barker PB, et al . Methodological consensus on clinical proton MRS of the brain: Review and recommendations . Magn Reson Med 2019. ; 82 ( 2 ): 527 – 550 . [DOI] [PMC free article] [PubMed] [Google Scholar]
- 2. Oz G, Alger JR, Barker PB, et al . Clinical proton MR spectroscopy in central nervous system disorders . Radiology 2014. ; 270 ( 3 ): 658 – 679 . [DOI] [PMC free article] [PubMed] [Google Scholar]
- 3. Parra NA, Maudsley AA, Gupta RK, et al . Volumetric spectroscopic imaging of glioblastoma multiforme radiation treatment volumes . Int J Radiat Oncol Biol Phys 2014. ; 90 ( 2 ): 376 – 384 . [DOI] [PMC free article] [PubMed] [Google Scholar]
- 4. Maudsley AA, Domenig C, Govind V, et al . Mapping of brain metabolite distributions by volumetric proton MR spectroscopic imaging (MRSI) . Magn Reson Med 2009. ; 61 ( 3 ): 548 – 559 . [DOI] [PMC free article] [PubMed] [Google Scholar]
- 5. Lam F, Ma C, Clifford B, Johnson CL, Liang ZP. . High-resolution (1) H-MRSI of the brain using SPICE: Data acquisition and image reconstruction . Magn Reson Med 2016. ; 76 ( 4 ): 1059 – 1070 . [DOI] [PMC free article] [PubMed] [Google Scholar]
- 6. Manjón JV, Coupé P, Buades A, Fonov V, Louis Collins D, Robles M. . Non-local MRI upsampling . Med Image Anal 2010. ; 14 ( 6 ): 784 – 792 . [DOI] [PubMed] [Google Scholar]
- 7. Marquina A, Osher S. . Image Super-Resolution by TV-Regularization and Bregman Iteration . J Sci Comput 2008. ; 37 ( 3 ): 367 – 382 . [Google Scholar]
- 8. Shi F, Cheng J, Wang L, Yap PT, Shen D. . LRTV: MR Image Super-Resolution With Low-Rank and Total Variation Regularizations . IEEE Trans Med Imaging 2015. ; 34 ( 12 ): 2459 – 2466 . [DOI] [PMC free article] [PubMed] [Google Scholar]
- 9. Iqbal Z, Nguyen D, Hangel G, Motyka S, Bogner W, Jiang S. . Super-Resolution 1H Magnetic Resonance Spectroscopic Imaging utilizing Deep Learning . ArXiv 180207909v2. https://arxiv.org/abs/1802.07909v2. Posted May 14, 2018. Accessed September 6, 2018 . [DOI] [PMC free article] [PubMed]
- 10. Manjón JV, Coupé P, Buades A, Collins DL, Robles M. . MRI superresolution using self-similarity and image priors . Int J Biomed Imaging 2010. ; 2010 : 425891 . [DOI] [PMC free article] [PubMed] [Google Scholar]
- 11. Jafari-Khouzani K. MRI upsampling using feature-based nonlocal means approach . IEEE Trans Med Imaging 2014. ; 33 ( 10 ): 1969 – 1985 . [DOI] [PMC free article] [PubMed] [Google Scholar]
- 12. Jain S, Sima DM, Nezhad FS, et al . Patch based super-resolution of MR spectroscopic images. 2016 IEEE 13th International Symposium on Biomedical Imaging (ISBI), Prague, April 13–16, 2016 . Piscataway, NJ: : IEEE; , 2016. ; 452 – 456 . [Google Scholar]
- 13. Hangel G, Jain S, Springer E, et al . High-resolution metabolic mapping of gliomas via patch-based super-resolution magnetic resonance spectroscopic imaging at 7T . Neuroimage 2019. ; 191 : 587 – 595 . [DOI] [PMC free article] [PubMed] [Google Scholar]
- 14. Parsons DW, Jones S, Zhang X, et al . An integrated genomic analysis of human glioblastoma multiforme . Science 2008. ; 321 ( 5897 ): 1807 – 1812 . [DOI] [PMC free article] [PubMed] [Google Scholar]
- 15. Waitkus MS, Diplas BH, Yan H. . Isocitrate dehydrogenase mutations in gliomas . Neuro Oncol 2016. ; 18 ( 1 ): 16 – 26 . [DOI] [PMC free article] [PubMed] [Google Scholar]
- 16. Louis DN, Perry A, Reifenberger G, et al . The 2016 World Health Organization Classification of Tumors of the Central Nervous System: a summary . Acta Neuropathol (Berl) 2016. ; 131 ( 6 ): 803 – 820 . [DOI] [PubMed] [Google Scholar]
- 17. Dang L, White DW, Gross S, et al . Cancer-associated IDH1 mutations produce 2-hydroxyglutarate . Nature 2009. ; 462 ( 7274 ): 739 – 744 . [DOI] [PMC free article] [PubMed] [Google Scholar]
- 18. Clark O, Yen K, Mellinghoff IK. . Molecular Pathways: Isocitrate Dehydrogenase Mutations in Cancer . Clin Cancer Res 2016. ; 22 ( 8 ): 1837 – 1842 . [DOI] [PMC free article] [PubMed] [Google Scholar]
- 19. Choi C, Ganji SK, DeBerardinis RJ, et al . 2-hydroxyglutarate detection by magnetic resonance spectroscopy in IDH-mutated patients with gliomas . Nat Med 2012. ; 18 ( 4 ): 624 – 629 . [DOI] [PMC free article] [PubMed] [Google Scholar]
- 20. Choi C, Raisanen JM, Ganji SK, et al . Prospective Longitudinal Analysis of 2-Hydroxyglutarate Magnetic Resonance Spectroscopy Identifies Broad Clinical Utility for the Management of Patients With IDH-Mutant Glioma . J Clin Oncol 2016. ; 34 ( 33 ): 4030 – 4039 . [DOI] [PMC free article] [PubMed] [Google Scholar]
- 21. Jafari-Khouzani K, Loebel F, Bogner W, et al . Volumetric relationship between 2-hydroxyglutarate and FLAIR hyperintensity has potential implications for radiotherapy planning of mutant IDH glioma patients . Neuro Oncol 2016. ; 18 ( 11 ): 1569 – 1578 . [DOI] [PMC free article] [PubMed] [Google Scholar]
- 22. Andronesi OC, Arrillaga-Romany IC, Ly KI, et al . Pharmacodynamics of mutant-IDH1 inhibitors in glioma patients probed by in vivo 3D MRS imaging of 2-hydroxyglutarate . Nat Commun 2018. ; 9 ( 1 ): 1474 . [DOI] [PMC free article] [PubMed] [Google Scholar]
- 23. Esmaeili M, Bathen TF, Rosen BR, Andronesi OC. . Three-dimensional MR spectroscopic imaging using adiabatic spin echo and hypergeometric dual-band suppression for metabolic mapping over the entire brain . Magn Reson Med 2017. ; 77 ( 2 ): 490 – 497 . [DOI] [PMC free article] [PubMed] [Google Scholar]
- 24. Buades A, Coll B, Morel J. . A non-local algorithm for image denoising. 2005 IEEE Computer Society Conference on Computer Vision and Pattern Recognition (CVPR’05), San Diego, June 20–25, 2005 . Piscataway, NJ: : IEEE; , 2005. ; 60 – 65 . [Google Scholar]
- 25. Chen Y, Li X, Ouyang Y, Pasiliao E. . Accelerated bregman operator splitting with backtracking . Inverse Probl Imaging (Springfield) 2017. ; 11 ( 6 ): 1047 – 1070 . [Google Scholar]
- 26. Griffel DH, Daubechies I. . Ten Lectures on Wavelets . Math Gaz 1995. ; 79 ( 484 ): 224 . [Google Scholar]
- 27. Canny J. . A computational approach to edge detection . IEEE Trans Pattern Anal Mach Intell 1986. ; 8 ( 6 ): 679 – 698 . [PubMed] [Google Scholar]
- 28. Smith SM, Jenkinson M, Woolrich MW, et al . Advances in functional and structural MR image analysis and implementation as FSL . Neuroimage 2004. ; 23 ( Suppl 1 ): S208 – S219 . [DOI] [PubMed] [Google Scholar]
- 29. Capper D, Zentgraf H, Balss J, Hartmann C, von Deimling A. . Monoclonal antibody specific for IDH1 R132H mutation . Acta Neuropathol (Berl) 2009. ; 118 ( 5 ): 599 – 601 . [DOI] [PubMed] [Google Scholar]
- 30. Chi AS, Batchelor TT, Dias-Santagata D, et al . Prospective, high-throughput molecular profiling of human gliomas . J Neurooncol 2012. ; 110 ( 1 ): 89 – 98 . [DOI] [PMC free article] [PubMed] [Google Scholar]
- 31. Andronesi OC, Kim GS, Gerstner E, et al . Detection of 2-hydroxyglutarate in IDH-mutated glioma patients by in vivo spectral-editing and 2D correlation magnetic resonance spectroscopy . Sci Transl Med 2012. ; 4 ( 116 ): 116ra4 . [DOI] [PMC free article] [PubMed] [Google Scholar]
- 32. de la Fuente MI, Young RJ, Rubel J, et al . Integration of 2-hydroxyglutarate-proton magnetic resonance spectroscopy into clinical practice for disease monitoring in isocitrate dehydrogenase-mutant glioma . Neuro Oncol 2016. ; 18 ( 2 ): 283 – 290 . [DOI] [PMC free article] [PubMed] [Google Scholar]
- 33. Branzoli F, Di Stefano AL, Capelle L, et al . Highly specific determination of IDH status using edited in vivo magnetic resonance spectroscopy . Neuro Oncol 2018. ; 20 ( 7 ): 907 – 916 . [DOI] [PMC free article] [PubMed] [Google Scholar]
- 34. Andronesi OC, Loebel F, Bogner W, et al . Treatment Response Assessment in IDH-Mutant Glioma Patients by Noninvasive 3D Functional Spectroscopic Mapping of 2-Hydroxyglutarate . Clin Cancer Res 2016. ; 22 ( 7 ): 1632 – 1641 . [DOI] [PMC free article] [PubMed] [Google Scholar]
- 35. Steel A, Chiew M, Jezzard P, et al . Metabolite-cycled density-weighted concentric rings k-space trajectory (DW-CRT) enables high-resolution 1 H magnetic resonance spectroscopic imaging at 3-Tesla . Sci Rep 2018. ; 8 ( 1 ): 7792 . [DOI] [PMC free article] [PubMed] [Google Scholar]
- 36. An Z, Tiwari V, Baxter J, et al . 3D high-resolution imaging of 2-hydroxyglutarate in glioma patients using DRAG-EPSI at 3T in vivo . Magn Reson Med 2019. ; 81 ( 2 ): 795 – 802 . [DOI] [PMC free article] [PubMed] [Google Scholar]
- 37. Jain S, Sima DM, Sanaei Nezhad F, et al . Patch-Based Super-Resolution of MR Spectroscopic Images: Application to Multiple Sclerosis . Front Neurosci 2017. ; 11 : 13 . [DOI] [PMC free article] [PubMed] [Google Scholar]
- 38. Fischl B, Salat DH, Busa E, et al . Whole brain segmentation: automated labeling of neuroanatomical structures in the human brain . Neuron 2002. ; 33 ( 3 ): 341 – 355 . [DOI] [PubMed] [Google Scholar]
- 39. Carrillo JA, Lai A, Nghiemphu PL, et al . Relationship between tumor enhancement, edema, IDH1 mutational status, MGMT promoter methylation, and survival in glioblastoma . AJNR Am J Neuroradiol 2012. ; 33 ( 7 ): 1349 – 1355 . [DOI] [PMC free article] [PubMed] [Google Scholar]
- 40. Chitneni SK, Reitman ZJ, Spicehandler R, Gooden DM, Yan H, Zalutsky MR. . Synthesis and evaluation of radiolabeled AGI-5198 analogues as candidate radiotracers for imaging mutant IDH1 expression in tumors . Bioorg Med Chem Lett 2018. ; 28 ( 4 ): 694 – 699 . [DOI] [PMC free article] [PubMed] [Google Scholar]
Associated Data
This section collects any data citations, data availability statements, or supplementary materials included in this article.


