

SUMMARY
Growing evidence supports the importance of gut microbiota in the control of tumor growth and response to therapy. Here, we select prebiotics that can enrich bacterial taxa that promote anti-tumor immunity. Addition of the prebiotics inulin or mucin to the diet of C57BL/6 mice induces anti-tumor immune responses and inhibition of BRAF mutant melanoma growth in a subcutaneously implanted syngeneic mouse model. Mucin fails to inhibit tumor growth in germ-free mice, indicating that the gut microbiota is required for the activation of the anti-tumor immune response. Inulin and mucin drive distinct changes in the microbiota, as inulin, but not mucin, limits tumor growth in syngeneic mouse models of colon cancer and NRAS mutant melanoma and enhances the efficacy of a MEK inhibitor against melanoma while delaying the emergence of drug resistance. We highlight the importance of gut microbiota in anti-tumor immunity and the potential therapeutic role for prebiotics in this process.
Graphical Abstract

In Brief
Li et al. show that the gut microbiota effect on anti-tumor immunity is affected by inulin or mucin, prebiotics that inhibit melanoma and colon cancer growth in syngeneic models and attenuate melanoma resistance to MEKi. These studies highlight a potential therapeutic role for prebiotics in shaping the microbiota composition to promote anti-tumor immunity.
INTRODUCTION
Melanoma remains one of the most aggressive tumor types, mainly because of its propensity to metastasize and resist therapy. Aberrant activation of the mitogen-activated protein kinase (MAPK) pathway has been reported in human BRAF and NRAS mutant tumors, including melanomas, in which they account for more than 70% of genetic changes. Although selective inhibitors to BRAF mutant proteins have been developed, their effectiveness is limited by the frequent emergence of resistance (Brighton et al., 2018; Fedele et al., 2018; Martz et al., 2014). Inhibitors of the MAPK pathway, including MEK, have also been developed and are commonly used for the treatment of NRAS mutant melanomas (Johnson and Puzanov, 2015). The emergence of immune checkpoint therapy has resulted in unprecedented clinical success and offered new therapeutic modalities (Colli et al., 2017; Eggermont et al., 2018; Ribas et al., 2019). At present, BRAF inhibitors (BRAFi) and MEK inhibitors (MEKi) are being tested in several clinical trials, in combination with other therapies, including immune checkpoint inhibitors and gut microbiota modulators (Humphries and Daud, 2018; Matson et al., 2018; York, 2018).
The gastrointestinal (GI) tract harbors a complex and dynamic population of bacteria, called gut microbiota, that are implicated in the maintenance of health and the onset and progression of disease (Sommer and Bäckhed, 2013). In these roles, gut microbiota affect key components of host physiology and homeostasis, including the development and function of the immune system (Bäckhed et al., 2005; Ley et al., 2008). Changes in gut microbiota composition are linked to local and systemic alterations that affect tumor growth, in part through modulation of tissue remodeling, mucosal immunity, and anti-tumor immunity (Rutkowski et al., 2015). Gut microbiota also influence the incidence and progression of colorectal carcinoma (Arthur et al., 2012; Bonnet et al., 2014) and breast and hepatocellular carcinoma (Arthur et al., 2012; Dapito et al., 2012). The importance of gut microbiota composition in cancer (Adolph et al., 2013) has been further demonstrated in studies showing the ability of the microbiota to enhance responses to checkpoint inhibitors such as anti-PD-(L)1 antibodies (Gopalakrishnan et al., 2018b; Haapanen et al., 1997; Matson et al., 2018; Sivan et al., 2015) and anti-CTLA-4 antibodies (Chaput et al., 2017; Vétizou et al., 2015). Furthermore, bacterial commensals that were found to be more abundant in the gut of melanoma patients responding to anti-PD-1 therapy (Gopalakrishnan et al., 2018b; Haapanen et al., 1997; Matson et al., 2018; Sivan et al., 2015), provided a rationale for performing fecal microbiota transplantation to non-responding patients.
Despite their clinical efficacy, checkpoint inhibitors are effective in only a fraction of treated patients. Human fecal microbiota derived from therapy-responsive patients confer treatment responsiveness when transplanted into germ-free (GF) mice (Matson et al., 2018; Routy et al., 2018), while a small set of phylogenetically unrelated gut microbiota species was suggested to promote anti-tumor phenotypes. For example, introduction of Bacteroides thetaiotaomicron or Bacteroides fragili to GF mice was sufficient to restore anti-tumor responses via induction of a skewed Th1 response (Vétizou et al., 2015). Our recent study demonstrated that Bacteroides rodentium induced anti-tumor immunity in melanoma and colon cancer models that were subcutaneously implanted in syngeneic C57BL/6 mice (Li et al., 2019b). In another study, the abundance of Akkermansia muciniphila was associated with anti-PD-1 responsiveness in humans and restored an anti-tumor phenotype when co-administered with anti-PD-1 therapy to melanoma patients (Routy et al., 2018). Administration of Bifidobacterium spp. in combination with anti-PD-L1 agents, attenuated tumor growth and promoted anti-tumor immunity in a syngeneic mouse model (Sivan et al., 2015). Moreover, human melanoma patients who responded to anti-CTLA-4 (ipilimumab) were found to have gut microbiota enriched in three butyrate-producing bacterial species (Chaput et al., 2017), and administration of Enterococcus hirae and Barnesiella intestinihominis improved their response to cyclophosphamide chemotherapy (Daillère et al., 2016). An assessment of mice treated with various antibiotics revealed that ampicillin-treated mice retained a simplified microbiota with a potent anti-tumor phenotype (Tanoue et al., 2019). Isolates from these mice identified 11 strains, enriched in Bacteroides, Parabacteroides, Alistipes, and an uncharacterized Ruminococcaceae, that increased the abundance of CD8+ interferon-γ (IFN-γ)-producing cells in the gut and potentiated anti-PD-1- and anti-CTLA-4-mediated control of tumor growth. Collectively, these findings point to the importance of gut microbiota in controlling cancer growth and reveal the complex variety of species that can promote anti-tumor immunity.
Previous reports indicated that the prebiotic inulin increases the relative abundance of Bifidobacteria, Bacteroides, and Akkermansia muciniphila in mice (Everard et al., 2013; Fehlbaum et al., 2018; Li et al., 2019a; Singh et al., 2018). Among these, Akkermansia muciniphila is known to reside in the mucin layer of the GI tract, in which it consumes glycan substrates decorating mucin proteins (muc2). Our earlier studies identified microbiota-dependent anti-melanoma immunity in syngeneic Rnf5−/− mice, which was conferred by select bacterial strains that induced tumor infiltration by T cells and dendritic cells (DCs) and inhibited melanoma growth upon their inoculation in GF mice (Li et al., 2019b).
The prebiotics inulin and mucin have been reported to induce Bifidobacterium spp. and Akkermansia muciniphila (Everard et al., 2013; Fehlbaum et al., 2018; Li et al., 2019a; Singh et al., 2018). Cultivation of fecal samples with inulin and mucin increased the relative abundance of several species implicated in tumor growth control in the Rnf5−/− mice (Li et al., 2019b). Therefore, in this study, we investigated the effects of inulin and porcine gastric mucin on growth of a subcutaneously implanted tumor and its propensity to resist targeted therapy in syngeneic mouse models. We demonstrate the ability of these prebiotics to elicit changes in gut microbiota composition that play a pivotal role in eliciting effective anti-tumor immunity.
RESULTS
Prebiotic Treatment of Fecal Microbiota In Vitro Enriches for Taxa that Promote Anti-tumor Immunity
Inulin and mucin have been shown to alter the relative abundance of bacterial species that were identified as anti-tumor immunity-promoting bacteria in Rnf5−/−mice, including Parasutterella excrementihominis, Bacteroides rodentium, and Clostridium viride (Figures S1A and S1B). We thus tested the effect of inulin and mucin on anaerobic cultivation of 12 fecal samples derived from healthy human subjects. Both prebiotics increased the relative abundance of Bacteroides spp., whereas only mucin increased the relative abundance of Akkermansia muciniphila in most cultures (Figure S1C). Surprisingly, inulin, but not mucin, promoted the growth of Bifidobacteria spp. in only two of the cultures.
Feeding of Mucin or Inulin to Wild-Type Mice Reduces Tumor Growth and Induces Anti-tumor Immunity
Inulin is a naturally occurring fructosyl polymer with chain-terminating glucosyl residues. Mucins are highly decorated with polysaccharides composed of various core structures similar to those found in Lewis blood type antigens, including the sugars galactose, fucose, sialic acid, galactosamine, glucosamine, and mannose. To determine whether prebiotics inhibit tumor growth, mucin (3% in drinking water) or inulin (15% w/w in chow) were administered to wild-type (WT) C57BL/6 mice starting 2 weeks before subcutaneous injection of syngeneic melanoma tumor cells (YUMM1.5 cells, 1 × 10⁶ cells/mouse) through the remainder of the experiment. Administration of mucin or inulin led to attenuated melanoma tumor growth (Figure 1A). To determine whether these changes could be attributed to anti-tumor immunity, we analyzed tumor-infiltrating lymphocytes (TILs) 20 days following tumor inoculation. Compared with control mice, tumors from mucin- or inulin-treated mice were enriched in CD45+ cells, including effector (CD44hi) CD4+ and CD8+ T cells (e.g., IFN-γ-producing CD4+ T cells), plasmacytoid DCs, and conventional CD8α+ DCs (Figures 1B–1D). Tumor-resident DCs isolated from inulin- or mucin-treated C57BL/6 mice expressed higher levels of major histocompatibility complex (MHC) class I and MHC class II (Figure 1E), implying greater stimulatory capacity, compared with the tumor-associated cells from control mice. These data indicate that prebiotic supplementation induced a shift to a proinflammatory tumor microenvironment associated with a more potent anti-tumor response. The immunomodulatory effects of the two prebiotics were largely overlapping, but not identical, yet had similar effects on tumor control. Antibody-mediated depletion of CD4+ and CD8+ T cells in inulin-treated mice (Figure 1F) reduced the suppression of tumor growth, pointing to an essential role for CD4+ and CD8+ T cells in the inulin-promoted anti-tumor phenotype.
Figure 1. Administration of Mucin or Inulin Reduces Tumor Growth and Induces Anti-tumor Immunity.
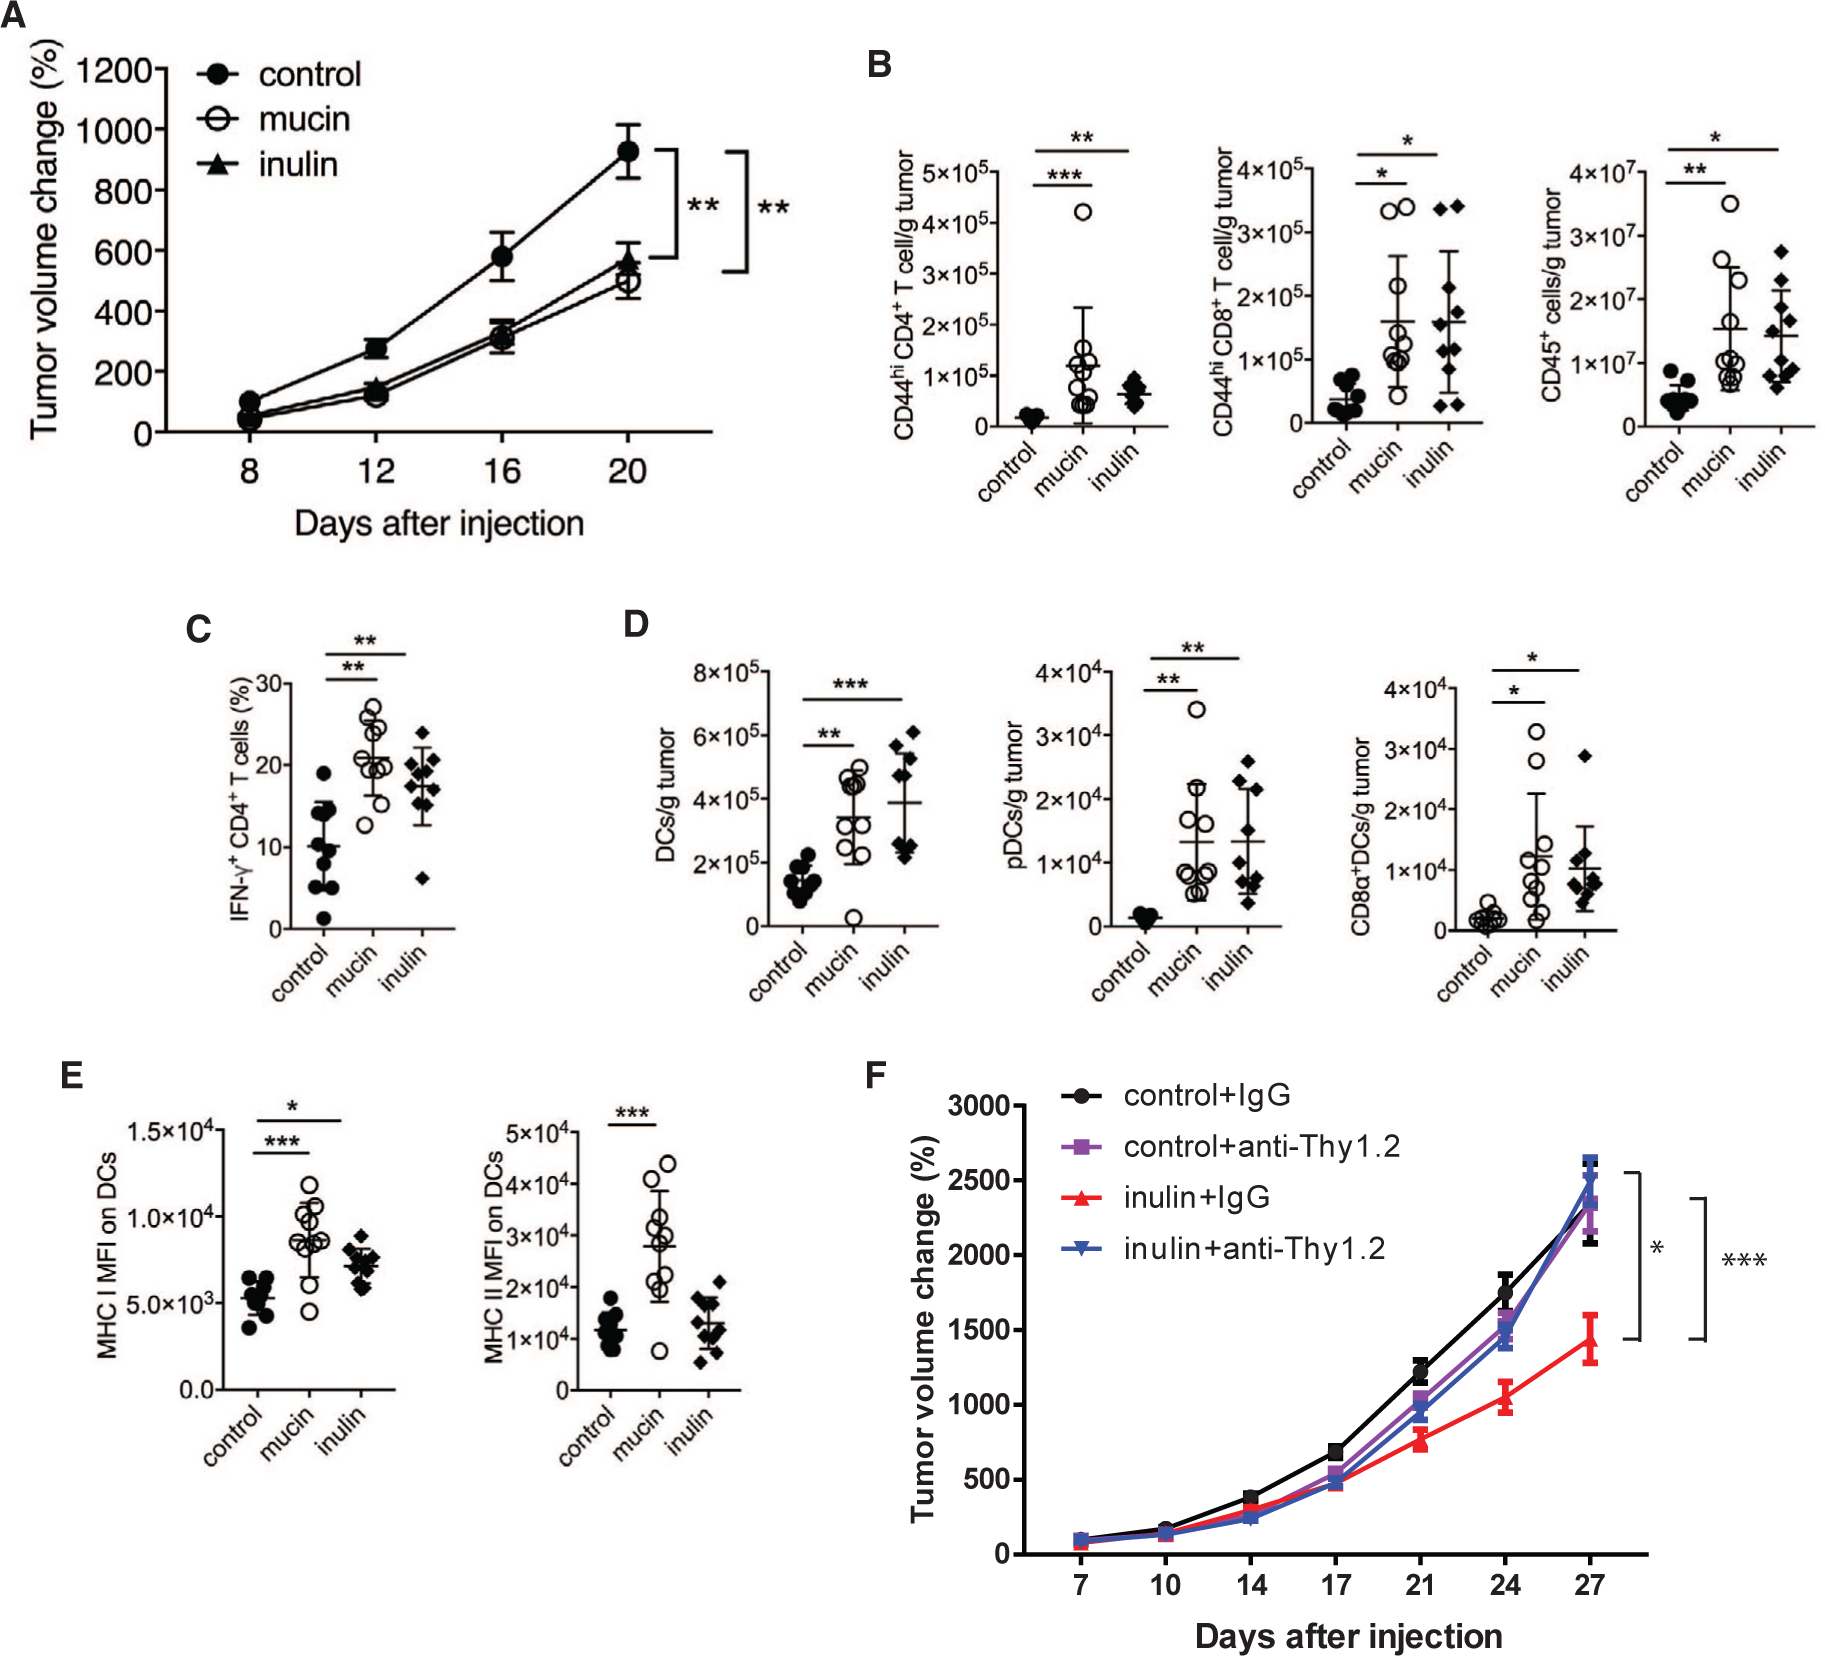
(A) Growth of YUMM1.5 tumors that were subcutaneously transplanted in syngeneic C57BL/6 mice. Mice were provided with a control diet, 3% mucin in drinking water, or 15% inulin-supplemented chow starting 14 days before tumor inoculation (control, n = 12; mucin, n = 15; inulin, n = 15).
(B) Quantification of tumor-infiltrating total CD45+ cells and effector (CD44hi) CD4+ or CD8+ T cells from mice treated as in (A) (control, n = 9; mucin, n = 10; inulin, n = 10).
(C) Quantification of tumor-infiltrating, IFN-γ-producing CD4+ T cells from mice treated as in (A) (n = 10).
(D) Quantification of tumor-infiltrating total DCs and DC subsets in mice treated as in (A) (control, n = 9; mucin, n = 10; inulin, n = 10).
(E) MFI of MHC class I and MHC class II on tumor-infiltrating DCs in mice treated as in (A) (control, n = 9; mucin, n = 10; inulin, n = 10).
(F) Wild-type C57BL/6 mice (n = 12) were fed control or 15% inulin-supplemented chow starting 14 days before subcutaneous (s.c.) injection of YUMM1.5 melanoma cells (1 × 10⁶). Anti-mouse Thy1.2 or control immunoglobulin G (IgG, 400 μg) were injected two times a week starting 3 days after tumor inoculation (n = 12). Tumor volume was assessed two times a week. FACS analysis revealed >90% depletion of blood CD4+ and CD8+ T cells on day 8 after tumor inoculation. Data are representative of three independent experiments (A–E) or one experiment (F). Graphs show the mean ± SEM. *p < 0.05, **p < 0.005, ***p < 0.001, ****p < 0.0001 by two-way ANOVA with Bonferroni’s correction (A and F) or by one-way ANOVA with Bonferroni’s correction (B–E).
Mucin and Inulin Feeding Enhances Expression of Anti-tumor Immunoregulatory Genes in Tumors
To identify possible mechanisms for the elevated immune cell infiltration and anti-tumor immunity in prebiotic-treated mice, we examined tumor-xenograft samples grown in syngeneic mouse models for changes in the transcription of immune-associated genes (including chemokines), inflammasome activity, and antigen presentation. Both prebiotics increased the expression of chemokines (CCL4 and CCL8), inflamma-some-related genes (TLR3 and TLR7), and antigen presentation-related genes (CD40, Stat1, and ICOS) (Figure 2A), suggesting a mechanism by which prebiotic supplementation enhanced the recruitment and activation of immune cells in the tumor microenvironment.
Figure 2. Mucin and Inulin Induce Enhanced Expression of Immunoregulatory Genes in Tumors.
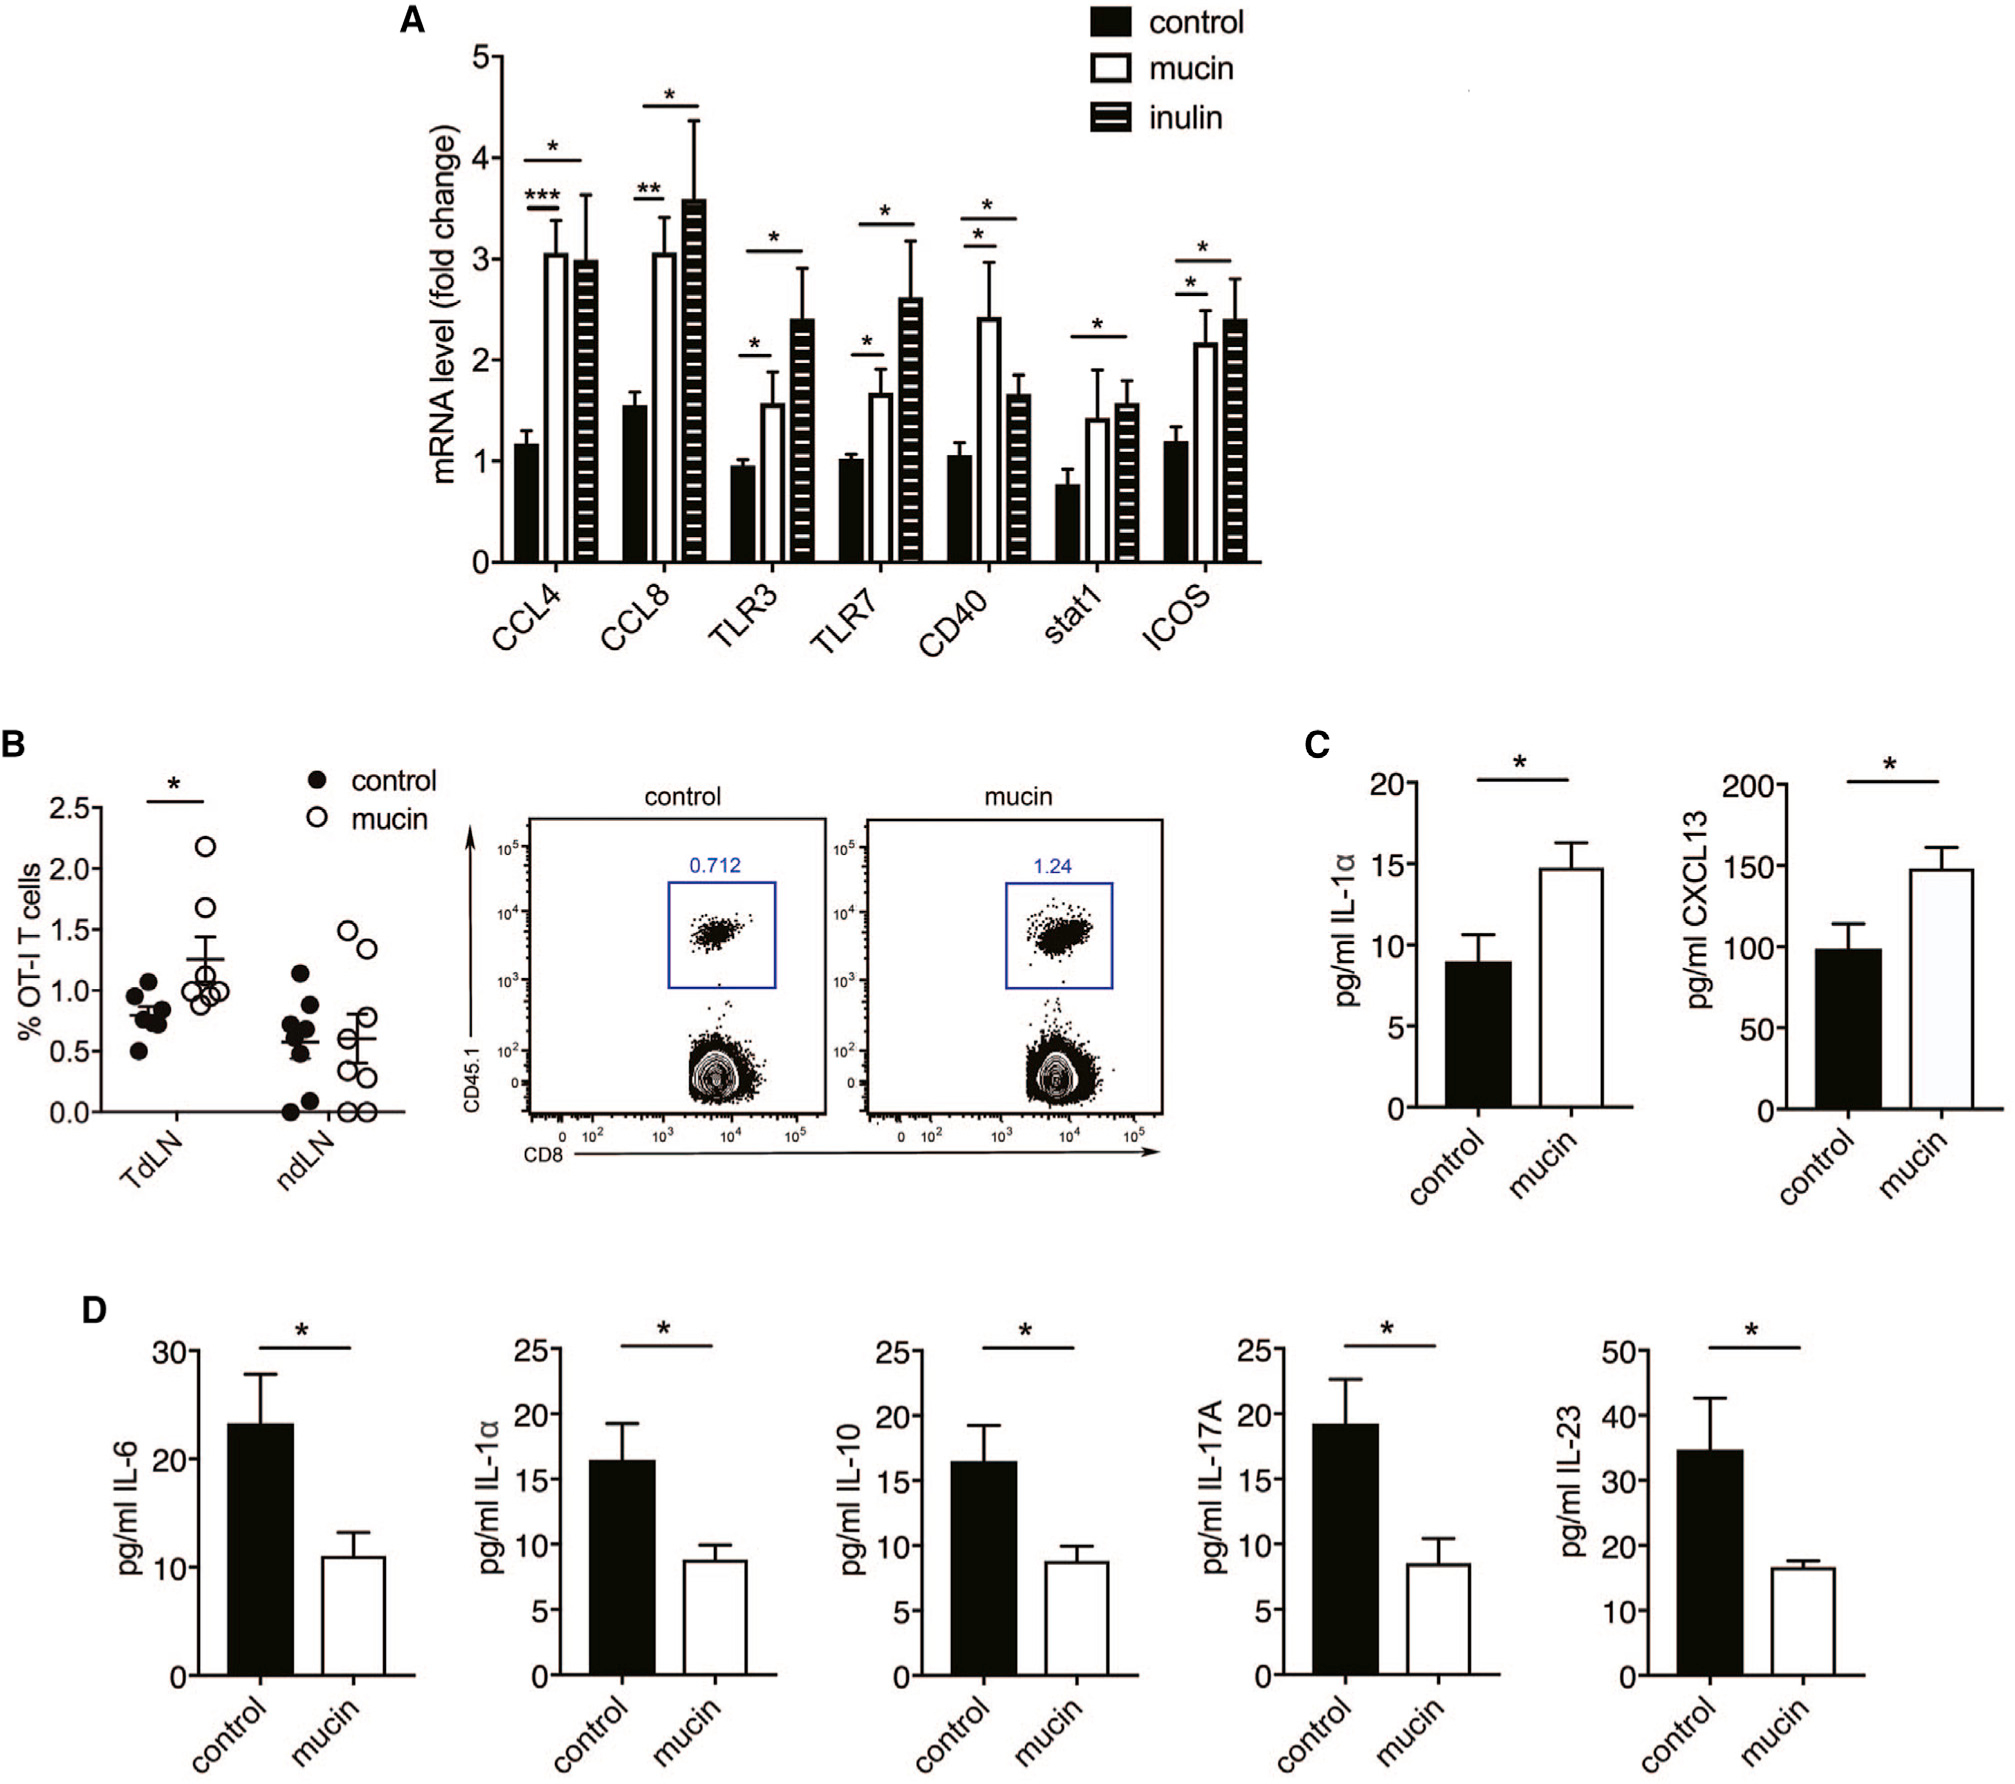
(A) qPCR analysis of immune-related genes in subcutaneously transplanted melanoma grown in syngeneic C57BL/6 mice that received a control diet, 3% mucin in drinking water, or 15% inulin-supplemented chow starting 14 days before tumor inoculation (n = 6).
(B) Quantification of CD45.1+ OT-I CD8+ T cells in the tumor-draining lymph nodes (TdLN) and non-draining lymph nodes (ndLN) of C57BL/6 mice (CD45.2+) treated with or without mucin and injected with B16-OVA melanoma cells (TdLN, n = 7; ndLN, n = 8). Right dot plots show gating of CD45.1+ CD8+ cells.
(C) Serum cytokine and chemokine levels in naive WT mice treated with or without mucin (n = 10).
(D) Serum cytokines in WT mice treated with or without mucin on day 10 after tumor inoculation (n = 10).
Data are representative of three independent experiments (A and B) or one experiment (C and D). Graphs show the mean ± SEM. *p < 0.05, **p < 0.005, ***p < 0.001, ****p < 0.0001 by one-way ANOVA with Tukey’s correction (A) or by two-tailed t test or Mann-Whitney U test (B–D).
Independent support for the activation of T cells in prebiotic-treated mice was obtained using the OVA-specific OT-I transgenic mouse model. WT OT-I CD8+ CD45.1+ T cells were transferred to untreated or mucin-treated WT mice harboring B16F10-OVA melanoma tumors, and their frequency in tumor-draining and non-draining lymph nodes was monitored. OT-I CD8+ T cells were more abundant in the draining lymph nodes of mucin-treated mice compared with control mice (Figures 2B and S2A), pointing to either increased recruitment or increased survival of OT-1 cells in the prebiotic-treated mice. Altogether, these results confirm that prebiotic treatment promotes anti-tumor immunity via effects on both innate and adaptive immune cells.
Consistent with the elevated abundance of TILs in mucin-treated compared with control C57BL/6 mice, levels of the cytokine interleukin (IL)-1α and chemokine CXCL13 were increased in the sera of mucin-fed mice before tumor cell inoculation (Figure 2C), suggesting that the inflammation-promoting effects of mucin were systemic. Strikingly, we found that mucin-treated tumor-xenograft-bearing mice exhibited reduced serum levels of IL-6, IL-1α, IL-10, IL-17A, and IL-23 compared with control animals (Figure 2D). High serum levels of IL-6 and IL-17 were previously associated with poor clinical outcome (Rutkowski et al., 2015; Wang et al., 2009), whereas reduced IL-1α levels were associated with attenuated tumor growth (Apte et al., 2006). Lower serum levels of the chemokines CXCL1 and CXCL13 were also found in mucin-treated mice compared with control mice (Figure S2B), linking levels of both chemokines and cytokines with the anti-tumor response.
Inulin and Mucin Alter Gut Microbiota
We next used 16S rRNA amplicon sequencing to profile the fecal microbiota of WT C57BL/6 mice before and 14 days after prebiotic feeding and 20 days after YUMM1.5 tumor cell inoculation, with tumor cells originally obtained from genetically engineered C57BL/6 mice harboring BrafV600E mutation, Pten deletion, and Cdkn2a deletion. Although the bacterial communities at baseline were heterogeneous and generally not well clustered (Figures 3A and 3B), prebiotic feeding resulted in the formation of more highly related communities that were distinct from those in control mice. Furthermore, the bacterial communities underwent additional restructuring following tumor cell inoculation. These data are consistent with recent observations that distal tumor growth results in a reconfiguration of gut microbiota (Li et al., 2019b). Individual phylotype groups (two or more highly related, but not identical, 16S sequences of strains approximating a species) that were altered in the microbiota of control and prebiotic-treated mice were identified but were not further assessed. Thus, only phylotypes that were associated with a specific prebiotic treatment were further studied.
Figure 3. Mucin and Inulin Modulate the Composition and Diversity of Gut Microbiota.
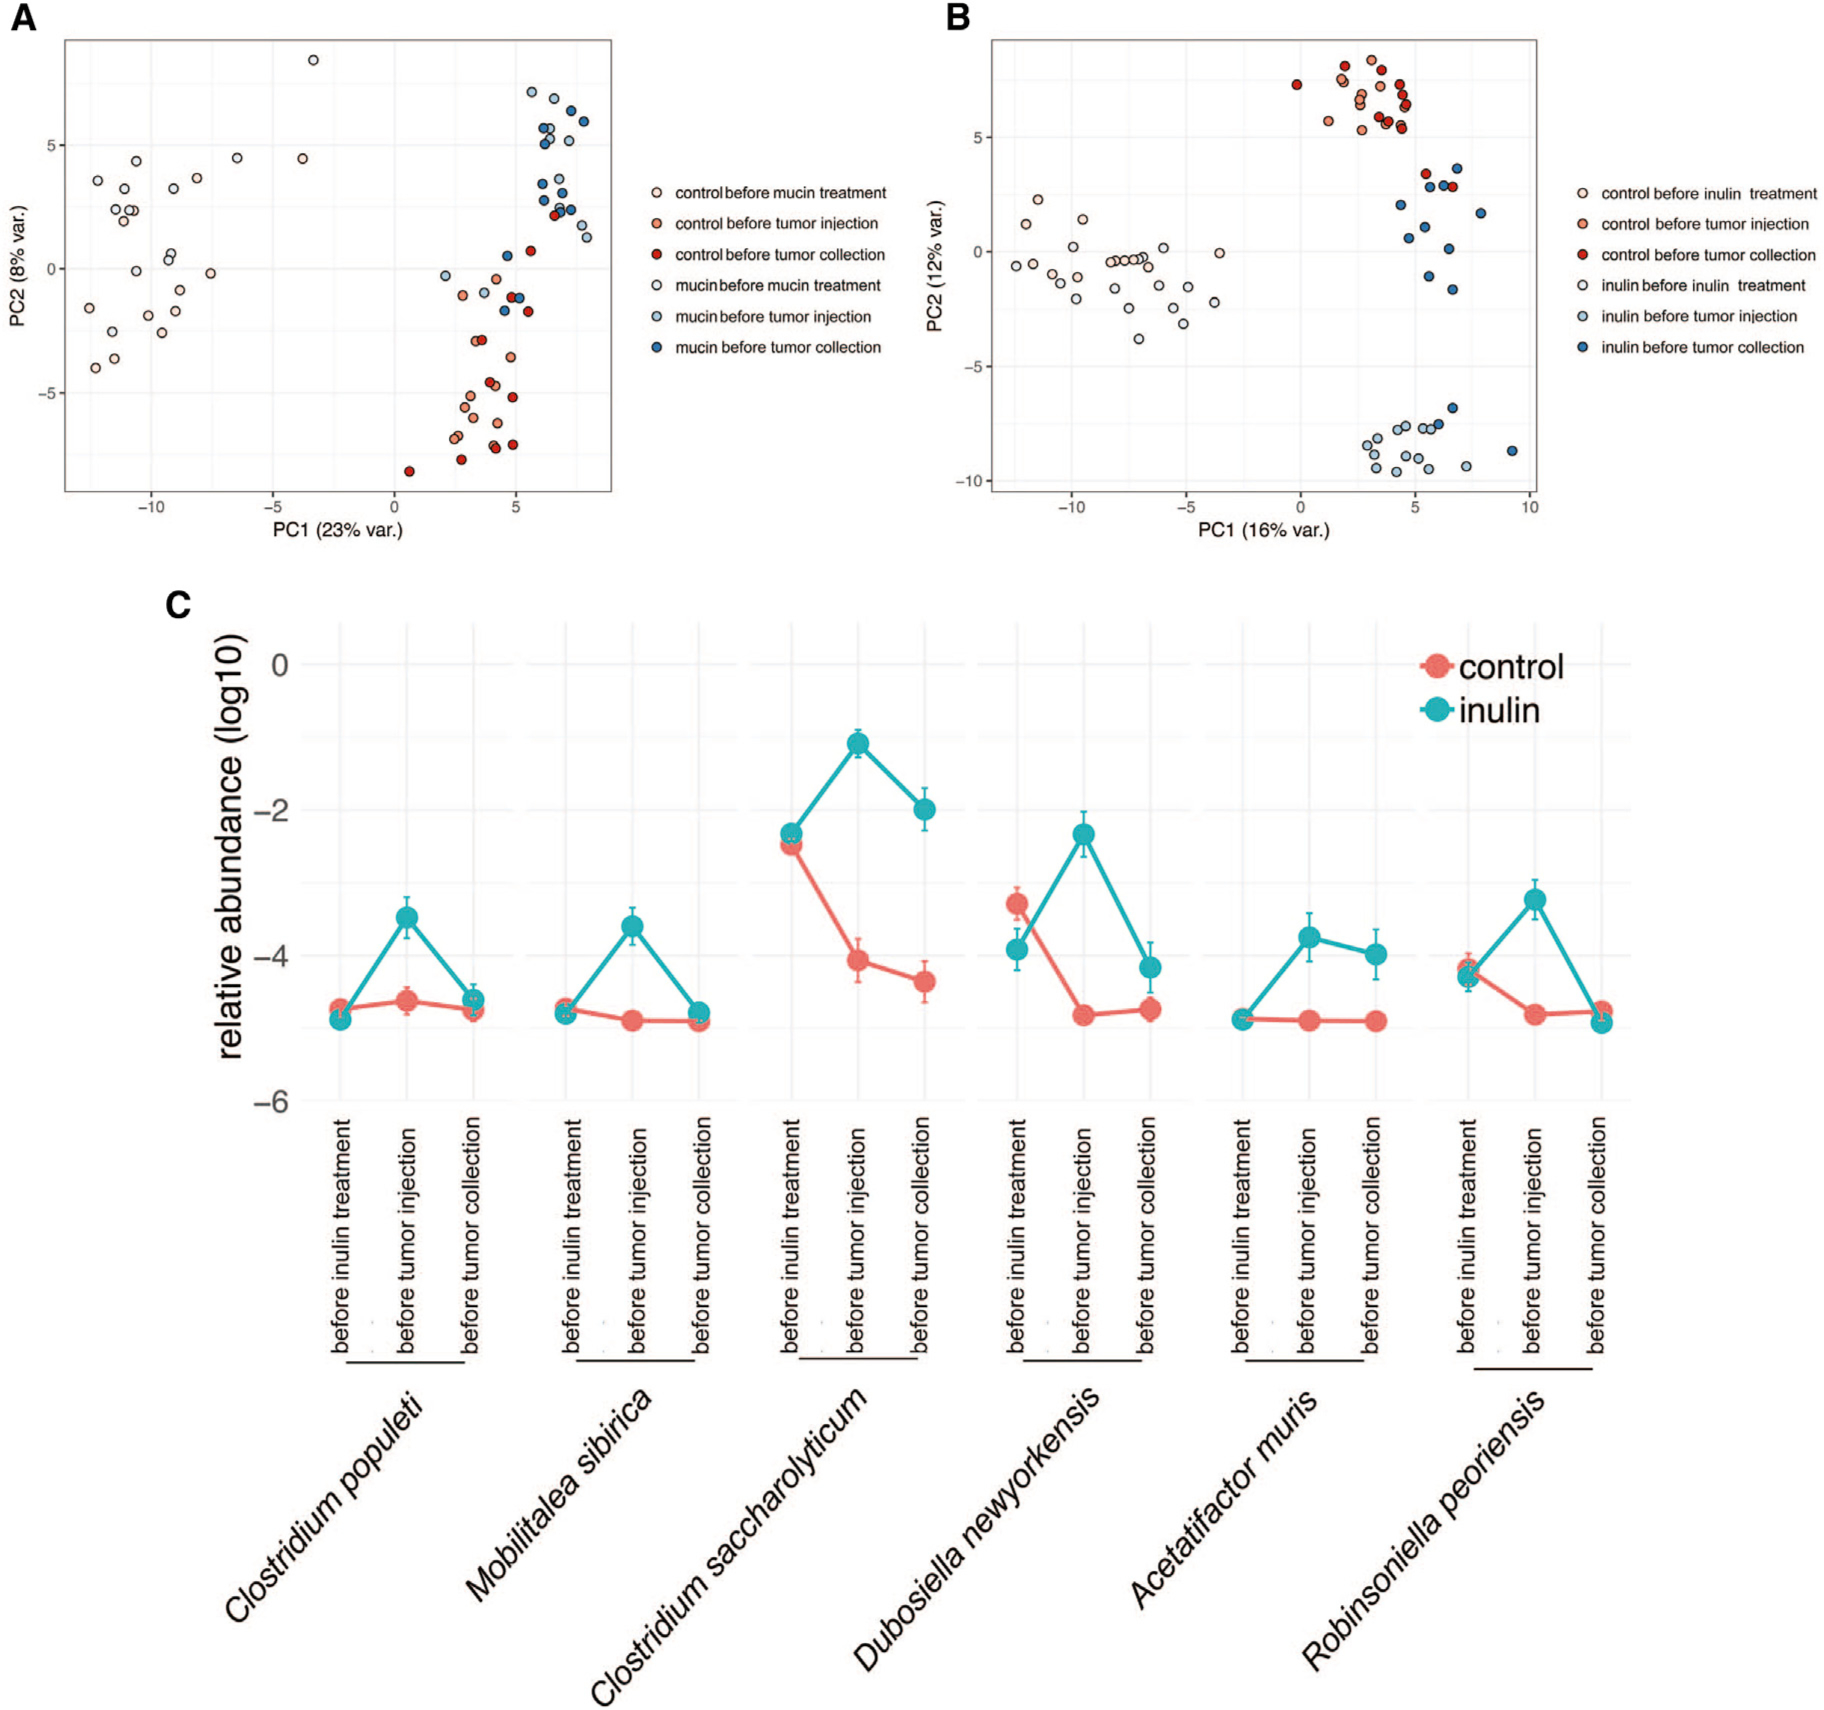
(A and B) Principal-component analysis of all taxa enumerated in fecal microbiota of control and mucin-treated (A) or inulin-treated (B) C57BL/6 mice, examined before prebiotic treatment, before subcutaneous injection of syngeneic YUMM1.5 tumor cells, and before tumor collection (control, n = 12; mucin, n = 15; inulin, n = 15).
(C) Time course of the relative abundance of the six taxa enriched in inulin-treated mice that negatively correlate with YUMM1.5 tumor size (control, n = 12; inulin, n = 15). Time points are before inulin treatment, before tumor injection, and before tumor collection.
Data are representative of two independent experiments.
Sequencing of the amplified 16S V3-V4 region followed by computational analysis led to the identification of increased relative abundance of 17 phylotype groups in inulin-treated mice and 2 phylotype groups in the mucin-treated mice that were not present in control mice (Table S1). Inulin increased the relative abundance of taxa that were phylogenetically coherent, 66% of which mapped most closely to members of Clostridium cluster XIVa, primarily Clostridium populeti- and Clostridium saccharolyticum-related taxa (Table S1). Although this cluster consists of numerous butyrate producers, the phylogenetic distance of the phylotypes profiled here makes the butyrate-producing potential of these taxa uncertain. Among the phylotypes that displayed increased relative abundance following inulin treatment, six were negatively correlated with tumor size (Figure 3C). Mucin also predominantly enriched taxa with similarity to members of Clostridium cluster XIVa (Table S1); however, none of the phylotypes induced by mucin were negatively correlated with tumor size. These findings suggest that inulin and mucin drive distinct changes in gut microbiota, both of which are capable of inducing anti-tumor immunity.
Inulin Attenuates Colon Cancer Growth
We next assessed whether mucin or inulin supplementation affects the growth of tumor types other than melanoma. Using the same protocol (prebiotic feeding starting 2 weeks before tumor inoculation), we found that inulin, but not mucin, attenuated the growth of subcutaneously transplanted MC-38 colon cancer tumors in syngeneic C57BL/6 mice (Figure 4A) and enhanced the anti-tumor immune response, as reflected by increased MHC class I and MHC class II expression on DCs (Figure 4B). No differences in the abundance of CD4+ or CD8+ T cells, total CD45+ cells, DCs, or DC subsets or the production of cytokines were observed in tumors from mucin- or inulin-treated mice (Figure S3). Although both mucin and inulin induced anti-tumor immunity that limited the growth of melanoma tumors, only inulin was able to attenuate colon cancer growth. Thus, the differences in taxa induced by these prebiotics may account for their distinct effects on control of select tumor types.
Figure 4. Inulin Controls Colon Cancer Growth and Induces Anti-tumor Immunity.
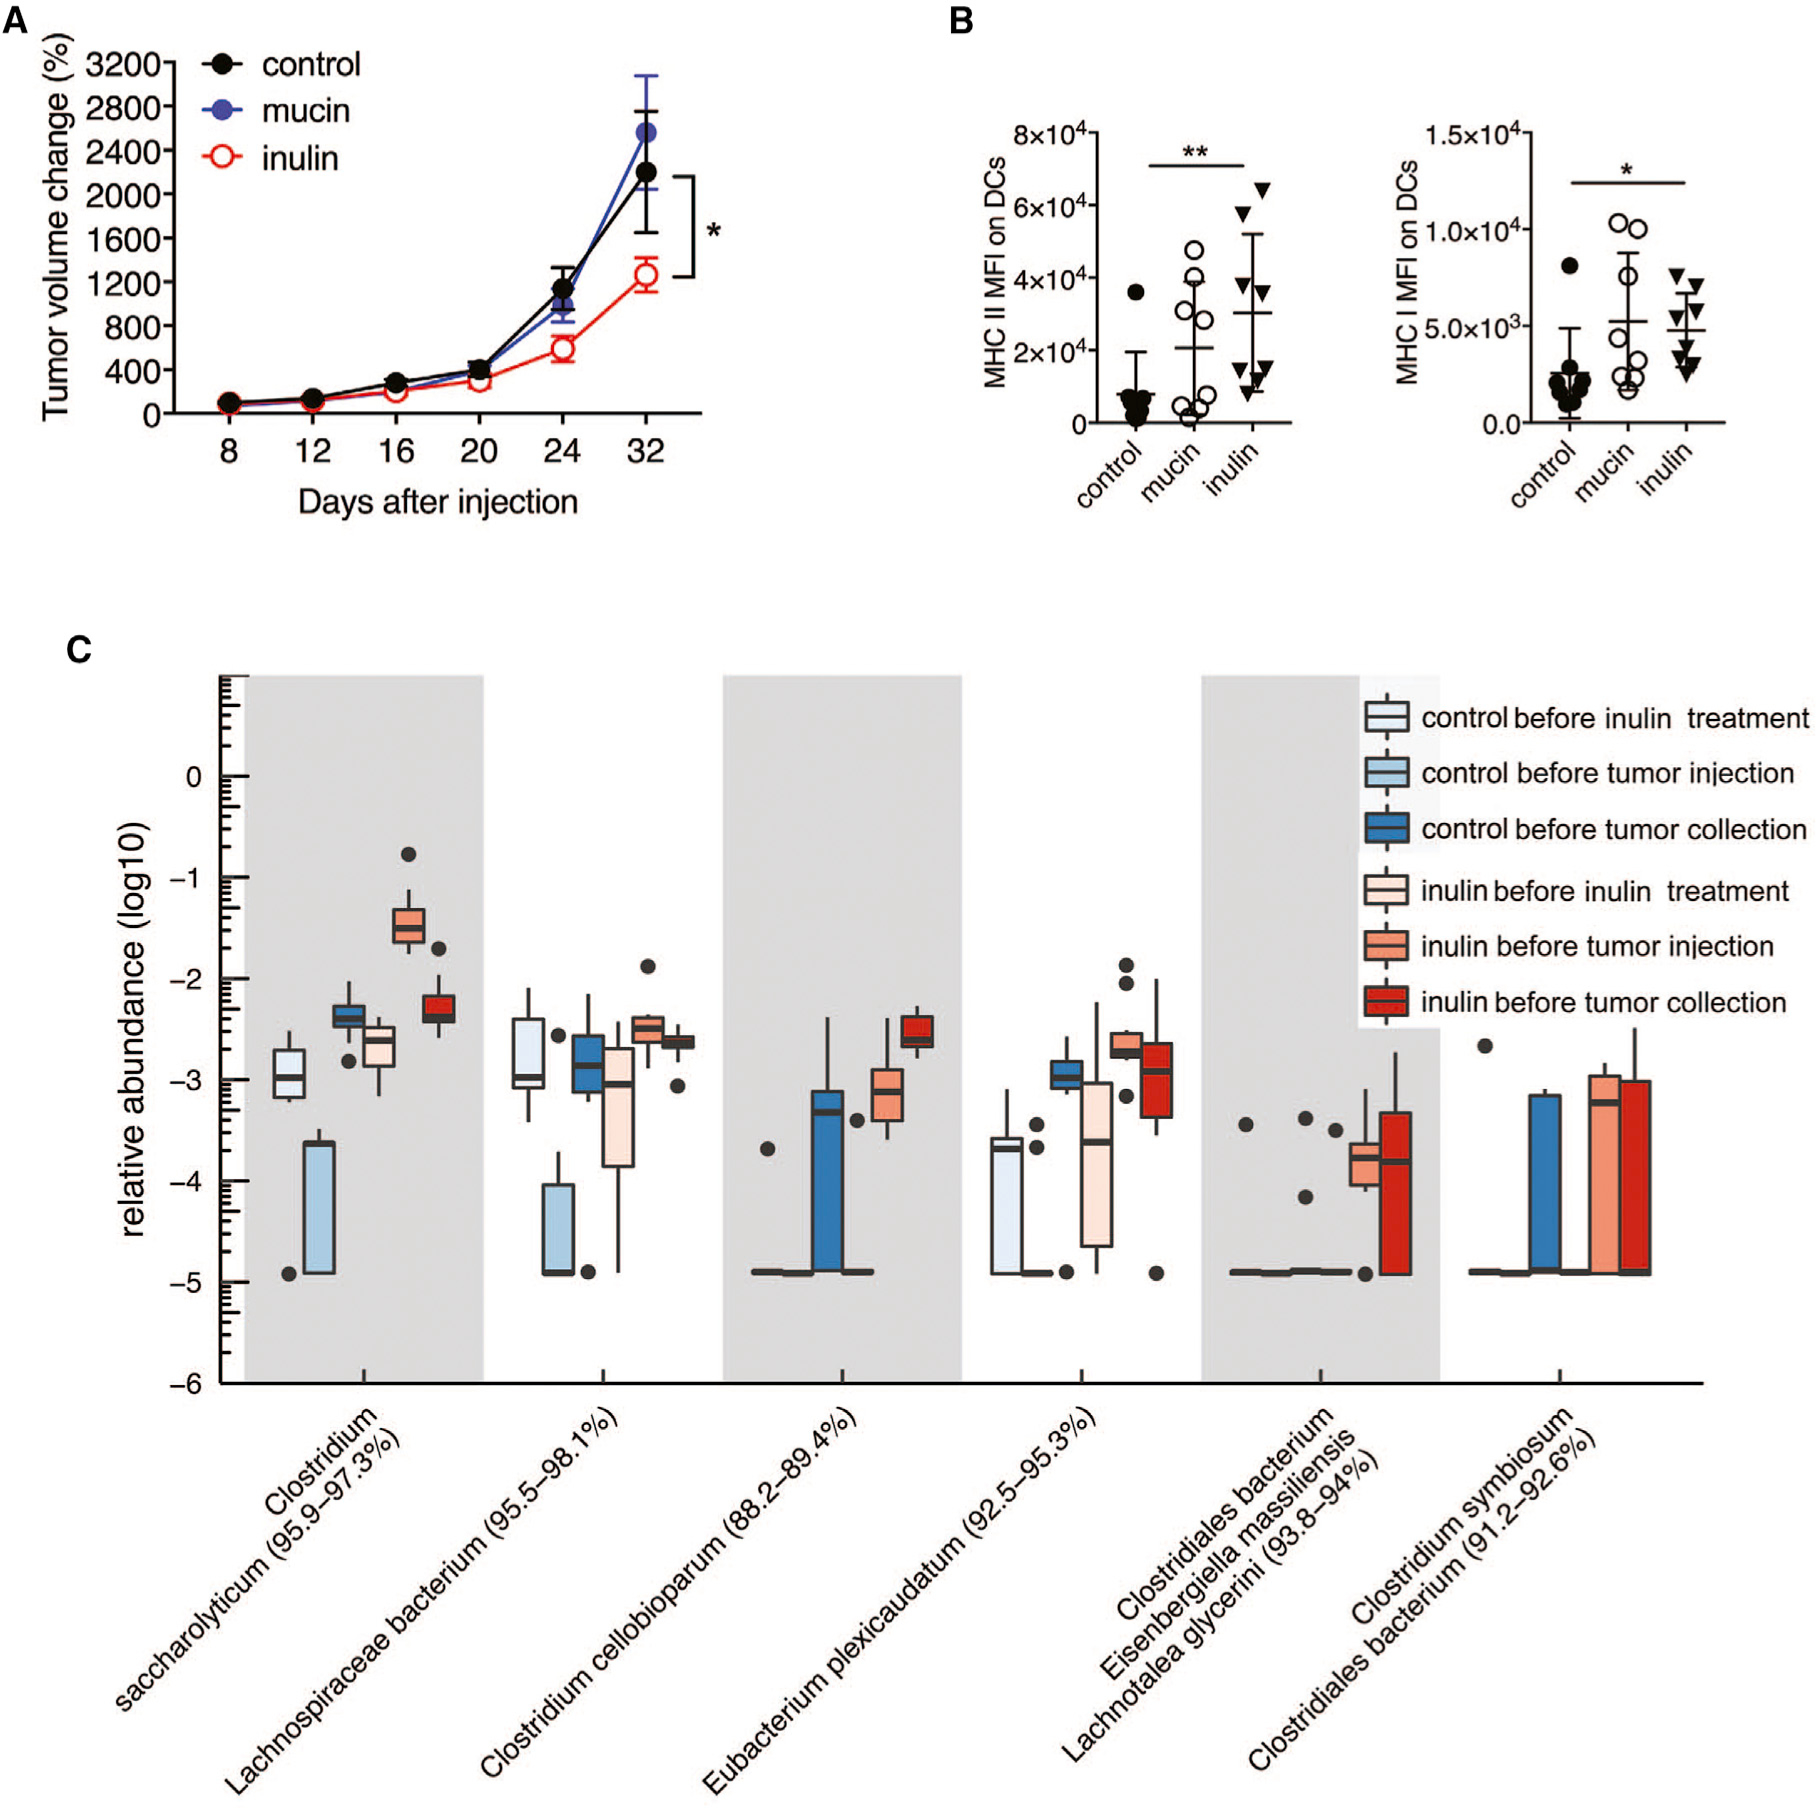
(A) Growth of MC-38 mouse colorectal cancer cells (1 × 10⁶) injected subcutaneously into syngeneic C57BL/6 mice that received control diet, 3% mucin in drinking water, or 15% inulin-supplemented chow starting 14 days before tumor inoculation (control, n = 9; mucin, n = 15; inulin, n = 15).
(B) MFI of MHC class II and MHC class I in MC-38 tumor-infiltrating DCs (n = 8).
(C) Boxplot of the relative abundance of the taxa enriched in inulin-treated mice and positively correlated with tumor size (n = 10).
Data are representative of two independent experiments. Graphs show the mean ± SEM. *p < 0.05, **p < 0.005, ***p < 0.001, ****p < 0.0001 by one-way ANOVA with Bonferroni’s correction (B) or by two-way ANOVA with Tukey’s correction (A).
Specific Microbiota Are Associated with Control of Colon Cancer Growth and Anti-tumor Immunity
Analysis of fecal microbiota from MC-38 tumor-bearing inulin- or mucin-treated mice indicated that both prebiotics increased the relative abundance of a similar number of phylotype groups (25 inulin and 21 mucin), of which 7 were common to both prebiotics (Table S2). More than 68% of the phylotype groups induced by inulin mapped to Clostridium cluster XIVa, compared with 33% induced by mucin. Additional analysis demonstrated that the relative abundance of six inulin-specific phylotypes was inversely correlated with MC-38 tumor size (Figure 4C), whereas no relationship with tumor size was detected for the phylotype groups induced by mucin.
Combination Treatment with Inulin Overcomes Melanoma Resistance to MEKi
We next determined whether prebiotic supplementation influenced the efficacy of MEKi treatment by examining growth of the N-RAS mutant mouse melanoma cell line MaN-RAS that was obtained from genetically engineered N-Ras melanoma grown in C57BL/6 mice. Syngeneic mice (C57BL/6) were subcutaneously inoculated with tumor cells 2 weeks after the initiation of feeding with inulin or mucin with or without MEKi. In the absence of MEKi, inulin, but not mucin, modestly controlled tumor growth (Figure 5A). However, co-administration of MEKi with inulin had an additive effect on tumor growth control, and the emergence of MEKi resistance was delayed compared with MEKi alone (Figure 5A), implying that MEKi resistance may be partially overcome by this prebiotic. Consistent with these findings, tumors from mice treated with inulin+MEKi contained elevated numbers of total CD45+ cells, CD4+ and CD8+ T cells, pDCs, and mDCs, and the DCs expressed elevated levels of MHC class I compared with mice treated with MEKi alone (Figures 5B and 5C). However, no differences in T cell-mediated cytokine production were detected in tumors from inulin+MEKi-treated mice (Figure S4A).
Figure 5. Inulin Supplementation Overcomes Melanoma Resistance to MEKi.

(A) Growth of NRASQ61K mouse melanoma cells (1 × 10⁶) (control, n = 11; mucin, n = 9; inulin, n = 9; MEKi, n = 10; MEKi+mucin, n = 8; MEKi+inulin, n = 10) that were subcutaneously transplanted in syngeneic C57BL/6 mice that received control diet, 3% mucin in drinking water, or 15% inulin-supplemented chow starting 14 days before tumor inoculation. When tumors reached a volume of 10–20 mm2, mice were administered MEKi (PD325901, 10 mg/kg) once daily by gavage. Tumor volume was assessed every 4 days.
(B) Number of tumor-infiltrating effector (CD44hi) CD4+ and CD8+ T cells and total CD45+ cells per tumor weight (in grams) in mice treated as in (A) (MEKi, n = 7; MEKi+mucin, n = 8; MEKi+inulin, n = 8).
(C) Number of tumor-infiltrating DCs and DC subsets per tumor weight (in grams) and expression of MHC class I on DCs in mice treated as in (A) (MEKi, n = 8; MEKi+mucin, n = 7; MEKi+inulin, n = 8).
(D) Pie chart of taxa enriched in inulin-treated mice and negatively correlated with MaN-RAS tumor size (n = 10).
(E) Pie chart of taxa enriched in mucin-treated mice microbiota that negatively correlate with MaN-RAS tumor size (n = 10).
(F) Relative abundance of taxa enriched in inulin+MEKi-treated mice and negatively correlated with MaN-RAS tumor size (n = 10).
(G) Relative abundance of taxa enriched in mucin+MEKi-treated mice and negatively correlated with MaN-RAS tumor size (n = 10).
Data are representative of two independent experiments. Graphs show the mean ± SEM. *p < 0.05, **p < 0.005, ***p < 0.001, ****p < 0.0001 by one-way ANOVA with Tukey’s correction (B and C) or by two-way ANOVA with Bonferroni’s correction (A).
Inulin-Induced Alterations in Gut Microbiota Control NRAS Mutant Melanoma Tumor Growth and MEKi Resistance
Inulin and mucin treatment before MEKi injection increased the relative abundance of 39 and 23 phylotype groups, respectively (Figures 5D, S4B, and S4C), and the abundance of these groups was negatively correlated with tumor size (Figures S4B and S4C). Both inulin and mucin primarily increased the relative abundance of taxa mapping in or near Clostridium cluster XIVa (Figures 5D and 5E). Inulin specifically induced six phylotypes related to Bacteroides spp. (primarily Bacteroides acidifaciens), three phylotypes related to Barnesiella spp., and a group related to Parasutterella excrementihominis, the latter of which was not detected following mucin treatment. Inulin also increased the relative abundance of three phylotype groups related to Bifidobacterium spp., whereas only one group was induced by mucin. The genomes of Bacteroides, Bifidobacterium, and Barnesiella spp. encode numerous glycosyl hydrolase activities (http://www.cazy.org/) that support cross-feeding interactions with sugar-fermenting bacteria, particularly Clostridiales spp.
Mice treated with doses of MEKi alone that effectively controlled subcutaneously implanted MaN-RAS1 tumor growth in syngeneic C57BL/6 mice showed enrichment of 14 phylotype groups in the gut microbiota, none of which negatively correlated with tumor size (Table S3). Analysis of taxa in tumor-bearing mice fed inulin identified eight phylotype groups enriched in Actinobacteria, Bifidobacterium longum, and two Olsenella spp. (Table S3). Only one phylotype group mapping distantly to Clostridium cellobioparum was negatively correlated with tumor size. Mucin treatment alone resulted in an increase in the relative abundance of 56 phylotype groups featuring diversity of taxa, including Bacteroides, Parabacteroides, Olsenella, and Clostridium. Mucin uniquely increased the relative abundance of five Lactobacillus spp., all of which were positively correlated with tumor size, albeit not to the level of statistical significance. Mucin feeding may thus induce an imbalance between enrichment of phylotypes that correlated positively versus negatively with tumor size, resulting in a failure to control tumor growth (Table S3).
MEKi co-administration altered the relative abundance of 21 phylotype groups (5 increased) in inulin-treated mice and of 15 phylotype groups (6 increased) in mucin-treated mice at sacrifice (Table S3). Analysis of the phylotypes in inulin+MEKi-treated mice compared with inulin-treated mice revealed four groups that negatively correlated with tumor size, based on relative abundance at sacrifice (Figure 5F). Of these, Akkermansia muciniphila was robustly enriched, together with Actinobacteria, Bifidobacterium longum, Olsenella profusa, and Parvibacter caecicola. Akkermansia muciniphila has previously been demonstrated to possess anti-tumor properties (Routy et al., 2018). Because Akkermansia muciniphila was also induced in mucin+MEKi-treated mice, enrichment of this phylotype may be insufficient to control MaN-RAS tumor growth. Rather, interactions between other inulin-induced taxa may be required for Akkermansia muciniphila to promote the anti-tumor phenotype. The four phylotype groups that were enriched in mucin+MEKi-treated mice compared with mucin-treated mice, and that negatively correlated with tumor size, may be involved in mucin-promoted control of tumor growth (Figure 5G).
Meta-analysis of Anti-tumor Microbiota
Studies of microbiota-mediated control of tumor growth have largely focused on a single or small group of bacterial species and/or species that are over-represented in mice or humans and are positively associated with control of tumor growth. However, in the present study, we detected negative correlations between tumor size and the abundance of multiple phylogenetic clades (Figure 6), which has been difficult to reconcile with earlier studies. Some bacterial strains identified here have not previously been described to be associated with anti-tumor immunity. In addition to Bifidobacteria, Bacteroides, Barnesiella, and Parabacteroides (Daillère et al., 2016; Matson et al., 2018; Sivan et al., 2015; Tanoue et al., 2019; Vétizou et al., 2015), which have been implicated in anti-tumor responses, we identified Olsenella, Prevotellamassilia, and Culturomica as additional taxa whose abundance correlates with tumor size. Six members of the Firmicutes phylum, including taxa mapping in or near Clostridium cluster XIVa, were also associated with tumor growth inhibition (Figure 6).
Figure 6. A Cladogram Representation of Taxa Enriched in Fecal Microbiota of Mice Administered Mucin or Inulin.
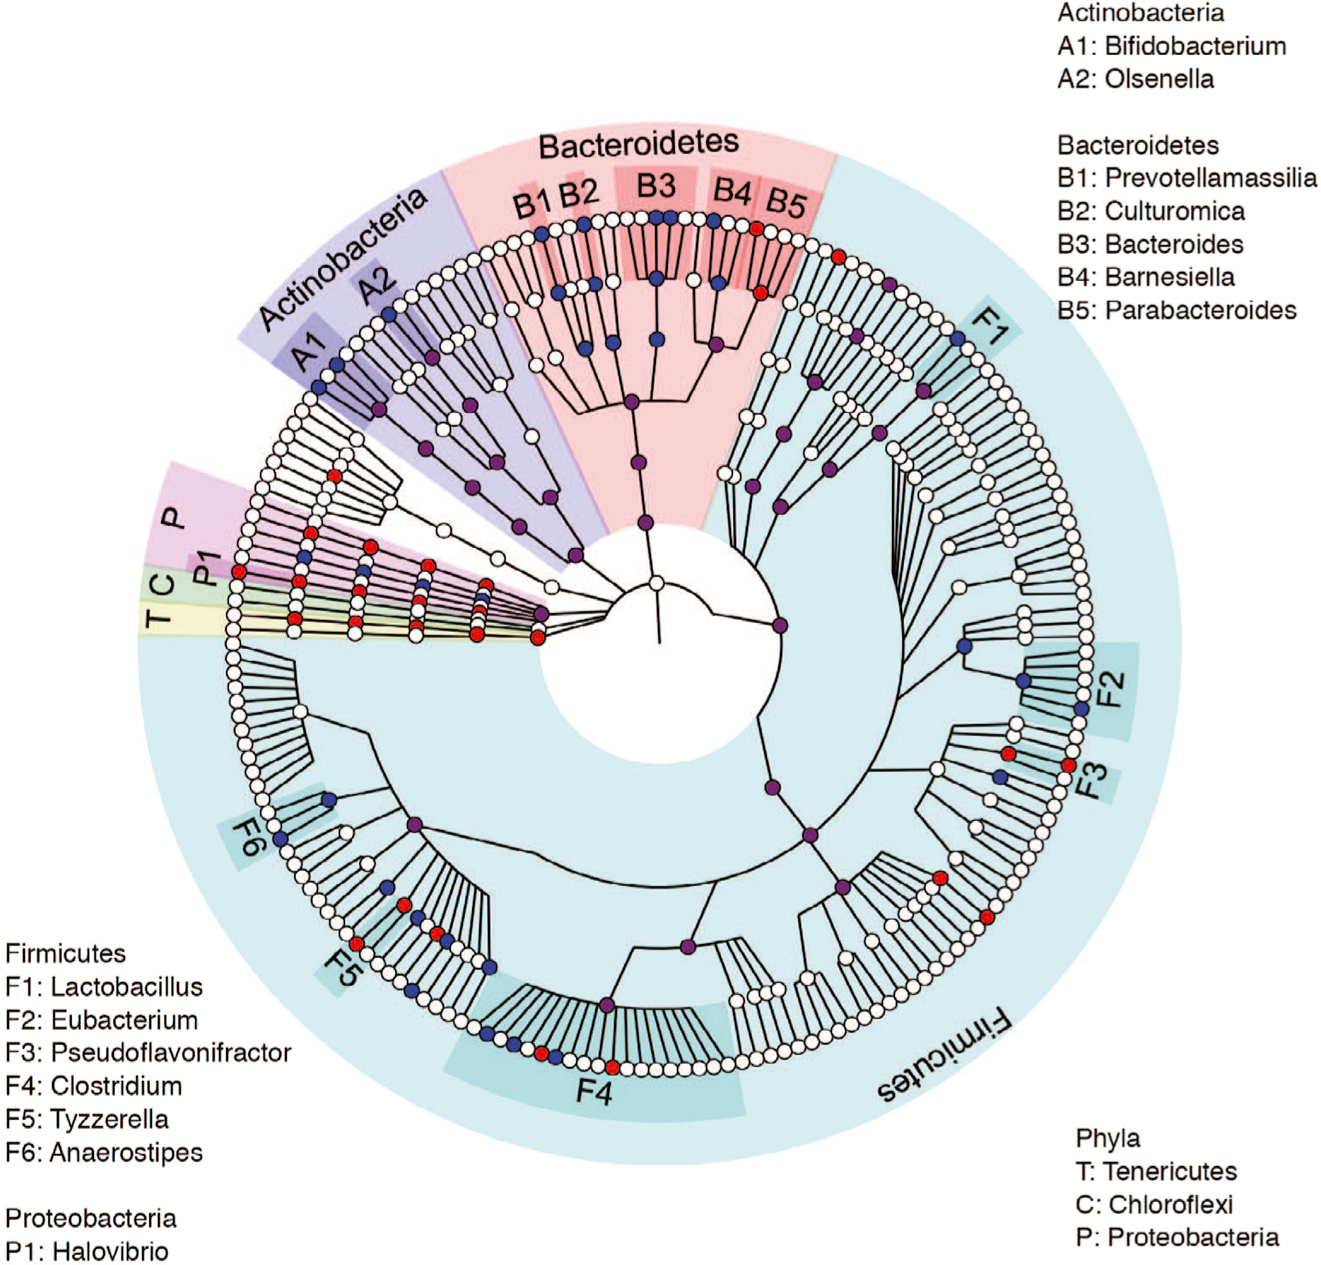
Cladogram representation of taxa enriched in fecal microbiota of mice (control, n = 12; mucin, n = 15; inulin, n = 15) administered mucin (red) or inulin (blue). Data are representative of two independent experiments.
Short-Chain Fatty Acids Are Not Sufficient to Attenuate Tumor Growth
Among the taxa enriched in gut microbiota of prebiotic-fed mice that control tumor growth are many that mapped in or near Clostridium cluster XIVa, which includes butyrate-producing species. We therefore next tested the effect on tumor growth of individual or combinations of the short-chain fatty acids (SCFAs) butyrate, propionate, and acetate (150 mM alone or 50 mM each in combination) administered in the drinking water starting 2 weeks before melanoma cell injection and for the duration of the experiment thereafter. None of the SCFAs, alone or in combination, reduced the tumor burden (Figure S5A), suggesting that production of SCFAs alone is insufficient to affect tumor growth.
Mucin-Induced Tumor Control Depends on Gut Microbiota
To verify the dependency of prebiotic-induced tumor control on gut microbiota, a minimal microbiota (altered Schaedler flora [ASF]) was allowed to colonize GF C3H/HeN mice for 2 weeks to induce immune maturation, and then the mice were initiated on mucin treatment for 2 weeks before injection of subcutaneously transplanted N-Ras mutant SW1 tumor cells. In these mice, mucin treatment failed to attenuate SW1 tumor growth (Figure S5B), indicating that mucin-promoted tumor growth control depends on specific gut microbiota. These observations are consistent with our previous demonstration that transfer of feces from Rnf5−/− mice, which harbor microbiota that can limit tumor growth, to WT GF mice elicited an effective anti-melanoma response (Li et al., 2019b).
Mucin and Inulin Treatment Leads to Activation of DCs and T Cells
To further explore the mechanism of action of mucin and inulin on the anti-tumor immune response, we treated murine bone marrow-derived DCs (BMDCs) for 24 h in vitro with mucin or inulin (0.05 or 0.5 mg/mL). As shown in Figure S5C, expression of the DC activation markers CD40 and CD80, as well as MHC class I and MHC class II, was increased by mucin treatment, but not inulin treatment. In contrast, in vitro treatment of CD8+ T cells isolated from the spleens of C57BL/6 mice revealed that whereas mucin had a limited effect on T cell activation (Figure S5D), inulin treatment increased the production of cytokines, chemokines, and the cytotoxic effector protein granzyme B (Figure S5D). These results suggest that inulin and mucin differentially affect the expression of genes involved in activation of antigen-presenting and/or effector functions of DCs and T cells. Given that mucin failed to elicit anti-tumor immunity and tumor growth inhibition in GF mice, we speculate that the effects of mucin and inulin detected in vitro would likely be secondary to the effects of prebiotics on the microbiota in vivo (Figure S5B).
Mucin and Inulin Promote Proinflammatory Gene Expression in Intestinal Epithelial Cells In Vivo
We next determined the effect of mucin and inulin on gene expression by intestinal epithelial cells (IECs), which have been implicated in the activation of DCs and T cells in vivo (Wang et al., 2003). After treatment of WT C57BL/6 with inulin or mucin for 2 weeks, IECs were isolated from the small intestine and were examined for expression of immune-related cytokines and chemokines. IECs from inulin- or mucin-treated mice exhibited enhanced expression of select genes; thus, although tumor necrosis factor alpha (TNF-α) mRNA levels were elevated in IECs from mucin-treated mice, NOD2, IL-6, and CXCL2 mRNA were increased in IECs from inulin-treated mice (Figure S5E). These findings suggest that inulin and mucin differentially enhance the transcription of key immune-activating cytokines and chemokines in IECs, providing a potential mechanism by which alterations of the gut microbiota may elicit anti-tumor immunity.
Prebiotic Therapy Does Not Augment the Efficacy of Anti-PD-1 Immune Checkpoint Therapy of Cold Melanomas
We next asked whether prebiotic treatment can enhance the efficacy of anti-PD-1 antibody, a commonly used immune checkpoint therapy. YUMM1.5, the BRAF mutant mouse melanoma cell line, is considered a cold tumor, that is, poorly responsive to immune checkpoint therapy (Haanen, 2017; Meeth et al., 2016). Administration of anti-PD-1 or the prebiotics reduced the growth of YUMM1.5 tumors in C57BL/6 mice. However, combination treatment with anti-PD-1 plus either inulin or mucin did not further attenuate tumor growth (Figures 7A and 7B), implying that anti-PD-1 and prebiotic therapy may elicit similar or overlapping changes in the immune system.
Figure 7. Combination Therapy with Prebiotics and Anti-PD-1 Modulates Tumor Growth in a Context-Dependent Manner.

(A) Growth of YUMM1.5 tumors that were subcutaneously transplanted in syngeneic C57BL/6 mice that were fed control chow or chow supplemented with 15% inulin starting 14 days before tumor inoculation (control, n = 7; inulin, n = 7; PD-1, n = 10; PD-1+inulin, n = 9). Mice were injected with control IgG or anti-PD-1 blocking antibody on days 7, 10, 13, and 16 after tumor inoculation.
(B) Growth of YUMM1.5 tumors in C57BL/6 mice that received 0% or 3% mucin in drinking water starting 14 days before tumor inoculation (control, n = 7; mucin, n = 7; PD-1, n = 10; PD-1+mucin, n = 9). Mice were injected with antibodies as described in (A).
(C) Growth of SW1 mouse melanoma cells in C3H/ HeOuJ mice that received a control diet, 3% mucin in drinking water, or 15% inulin-supplemented chow starting 14 days before tumor inoculation (control, n = 8; mucin, n = 8; inulin, n = 7; mucin+inulin, n = 9). Data are representative of two independent experiments. Graphs show the mean ± SEM. *p < 0.05, **p < 0.005, ***p < 0.001, ****p < 0.0001 by two-way ANOVA with Bonferroni’s correction.
Mucin and Inulin Effects on Melanoma Growth Are Context Dependent
To determine whether mucin and inulin in combination have additive or synergistic effects on melanoma growth, we employed two models. In the first, the growth of syngeneic SW1 NRAS mutant melanoma tumors that were subcutaneously transplanted in the syngeneic C3H/HeOuJ mice was attenuated by mucin treatment alone, a response that was enhanced by co-administration of mucin and inulin (Figure 7C). In contrast, growth of YUMM1.5 BRAF mutant melanoma tumors that were subcutaneously transplanted in the syngeneic C57BL/6 mice was reduced by treatment with either mucin or inulin alone, but they did not have an additive effect (Figure S6). These findings suggest that tumor genotypes and/or mouse strains affect the ability of prebiotics to attenuate tumor growth, further illustrating the complexity of the mechanisms by which gut microbiota impacts the anti-tumor phenotype.
DISCUSSION
In this study, we have demonstrated, using subcutaneously implanted tumors, that inulin and mucin induce anti-tumor immunity and concomitantly control tumor growth in syngeneic mouse models. The prebiotic effects depended on changes in the composition of gut microbiota, as illustrated by the failure of mucin to induce anti-tumor immunity in gnotobiotic mice harboring a minimal ASF community. In turn, changes in gut microbiota resulted in enhanced expression of select chemokines and cytokines in IECs, which have known roles in the activation of DCs and T cells (Belkaid and Hand, 2014; Chistiakov et al., 2015). As a result, the growth of melanoma and/or colon cancer was attenuated, accompanied by increased infiltration of effector T cells and DCs and increased expression of immune-related genes, including chemokines and Toll-like receptor (TLRs). Notably, our studies were limited to subcutaneously implanted melanoma or colon cancer cell lines in two syngeneic mouse strains (C57BL/6 and C3H) to capture the inherent immune response. Thus, our studies did not address the complex nature of human tumors, which would be achieved using patient-derived xenografts that lack intact immune response unless carried out in humanized mouse models, and they did not examine the effect of the prebiotics studied here in genetically engineered mouse models, which could have also allowed monitoring of the effect of these prebiotics at different phases of tumor evolution and in the proper microenvironment. Heterogenous phenotypes, of both tumors and hosts, are likely to best represent the heterogeneity found in man, for which corresponding models are urgently needed.
We found that both inulin and mucin effectively limited the growth of melanoma cells, but they elicited distinct phenotypes that are likely to stem from their differential effects on gut microbiota. For example, growth of KRAS mutant MC-38 colon cancer cells was inhibited by inulin, but not by mucin. In addition, inulin combined with MEKi, but not mucin, was able to attenuate the MEKi resistance of NRAS melanoma. These data suggest that mucin and inulin elicit distinct changes in gut microbiota, which then elicit anti-tumor immunity via different mechanisms. Our results are consistent with earlier findings that inulin can inhibit tumor growth (Mauro et al., 2013; Taper and Roberfroid, 1999), although the underlying mechanism of action remained largely unexplored.
Inulin and mucin shared a common ability to promote substantial alterations in the composition of fecal microbiota, leading to increases in the relative abundance of multiple bacterial phylotypes. We observed a negative correlation between the tumor size and a subset of these phylotypes, many of which have been reported to have anti-tumor potential in independent studies. Among those are Bifidobacterium (Matson et al., 2018; Sivan et al., 2015), Bacteroides (Li et al., 2019b; Vétizou et al., 2015), Parabacteroides (Daillère et al., 2016; Li et al., 2019b), Akkermansia muciniphila (Routy et al., 2018), and Barnesiella (Daillère et al., 2016). These taxa were enriched following prebiotic feeding and MEKi treatment, pointing to their possible role in mediating tumor control. We previously observed elevated expression and post-translational modification of mucin in Rnf5−/−mice, which exhibit strong anti-tumor immunity, although the change in mucin expression was not accompanied by alterations in mucus thickness or intestinal leakiness (Li et al., 2019b; data not shown). Thus, modification of mucin may be one facet of crosstalk between the gut microbiota and the immune system that contributes to the anti-tumor phenotype.
Among the phylotypes induced by inulin and mucin are taxa in the butyrate-producing Clostridium cluster XIVa. This result is consistent with an earlier report demonstrating that over-representation of three butyrate-producing taxa was strongly associated with responsiveness to ipilimumab in human melanoma patients (Chaput et al., 2017). However, we found that butyrate, propionate, and acetate, alone or in combination, had no effect on melanoma growth, suggesting that production of other SCFAs or microbial products may mediate this microbiota-driven anti-tumor response.
Increasing attention is being paid to the effects of MEKi, which target a signaling pathway often deregulated in tumors, on immune system components (Sanlorenzo et al., 2018; Yue et al., 2018). MEKi has been shown to impede the growth of tumors in mice while concomitantly promoting the effector phenotype and longevity of tumor-infiltrating CD8+ T cells (Ebert et al., 2016). Furthermore, MEKi can promote tumor immunogenicity in preclinical models of triple-negative breast cancer, in which MEKi in combination with either anti-4–1BB or anti-OX-40 agonist antibodies resulted in superior therapeutic efficacy (Dushyanthen et al., 2017). MEKi is also capable of promoting the maturation of DCs, as reflected by enhanced antigen uptake, processing, and cross-presentation to T cells (Vella et al., 2014). Despite effective tumor inhibition by MEKi, resistance to these inhibitors invariably occurs (Brighton et al., 2018; Fedele et al., 2018). Here, we demonstrated that co-administration of inulin reduces the resistance of melanoma to MEKi, pointing to the possible consideration of prebiotics as a means to limit therapy resistance, which remains a crucial unmet clinical need.
Several lines of evidence support the ability of microbiota to enhance the effectiveness of chemotherapy, radiotherapy, and immunotherapy (Alexander et al., 2017; Iida et al., 2013; Roy and Trinchieri, 2017). However, more recent studies have shown that antibiotic treatment or select enrichment of gut microbiota taxa can also limit the effectiveness of immune checkpoint therapy (Gopalakrishnan et al., 2018a, 2018b; Pitt et al., 2016). Thus, our finding that inulin and mucin are as effective as anti-PD-1 immune checkpoint therapy in limiting cold melanoma growth suggests that these prebiotics do not impede but possibly affect the same pathways as anti-PD-1 therapy. Combination treatment with inulin and mucin had an additive effect on the growth of NRAS mutant SW1 melanoma in C3H/ HeOuJ mice, but not on the growth of YUMM1.5 BRAF mutant melanoma in C57BL/6 mice, further illustrating that the effective cooperation between prebiotics depends on both tumor and genetic background.
Collectively, the results of this study advances our understanding of tumor growth control by gut microbiota, demonstrating that taxa from multiple unrelated phylogenetic groups share the capacity to induce anti-tumor immunity. It is expected that refinement of the specific bacterial strains and metabolites that mediate these phenotypes will not only advance our understanding of the phenomenon but also facilitate the development of therapeutic modalities that could be tested across species.
STAR★METHODS
Detailed methods are provided in the online version of this paper and include the following:
LEAD CONTACT AND MATERIALS AVAILABILITY
Further information and requests for reagents should be directed to and will be fulfilled by the Lead contact, Ze’ev Ronai, at zeev@ronailab.net. All reagents generated in this study are available from the Lead Contact with a completed Materials Transfer Agreement.
EXPERIMENTAL MODEL AND SUBJECT DETAILS
Animals and tumor model
All experimental animal procedures were approved by the Institutional Animal Care and Use Committee of Sanford Burnham Prebys Medical Discovery Institute (SBP: approval #13–130, 16–028, and 17–001) and complied with all relevant ethical regulations for animal testing and research. C57BL/6 mice were obtained from SBP. OT-I mice were obtained from SBP and crossed to CD45.1+ B6.SJLB6.SJL-Ptprca Pepcb/BoyJ mice (Jackson Laboratories). C3H/HeOuJ mice were purchased from Jackson Laboratories. Male 6–8-week-old mice were used for all experiments. GF ASF-bearing C3H/HeN mice were bred and maintained at the University of Nebraska-Lincoln (UNL) Gnotobiotic Mouse Facility under gnotobiotic conditions in flexible film isolators. Experiments involving GF and gnotobiotic mice were approved by the Institutional Animal Care and Use Committee at UNL (protocol #1534). All mice were fed an autoclaved chow diet ad libitum (LabDiet 5K67, Purina Foods). GF status was routinely checked as previously described (Gomes-Neto et al., 2017). Briefly, fresh feces were collected and analyzed by bacterial 16S rRNA gene-specific PCR (30 cycles, universal bacteria primers 8F and 1391R) in combination with aerobic and anaerobic culture of feces in Brain Heart Infusion, Wilkins–Chalgren, and Yeast Mold broths, and on Tryptic Soy Agar plates (all media from Difco Becton Dickinson) at 37°C for 7 days. ASF colonization status was verified by qPCR analysis of fecal samples as previously described (Li et al., 2019b). Briefly, genomic DNA was extracted from fecal samples and ASF bacteria were quantified by qPCR with species-specific primers.
For tumor growth experiments, mice were injected subcutaneously (s.c.) with 1 × 10⁶ tumor cells. Tumor size was measured twice a week for calculation of tumor volume. Tumors were weighed at the time of excision. Mouse selection for experiments was not formally randomized or blinded.
Cell lines
BrafV600E/+;Pten−/−;Cdkn2a−/− mouse melanoma cell line YUMM1.5 (Meeth et al., 2016), MC-38 cells ((Hampton et al., 2000); provided by M Karin, UCSD), MaN-RASQ61K mouse melanoma cells ((Petit et al., 2019); Provided by Lionel Larue, CNRS) SW1 mouse melanoma cells ((Bhoumik et al., 2002); provided by M Kripke, MDACC) B16-OVA ((Bellone et al., 2000); Provided by L Bradley SBP). Cell lines were maintained in Dulbecco’s modified Eagle’s medium supplemented with 10% fetal bovine serum (FBS) and antibiotics. All cell lines were free of mycoplasma and were authenticated by SBP genomic core service.
Bacterial strains and anaerobic fecal cultures
ASF (Altered Schaedler Flora) consisted of the following eight isolates: ASF 356, Clostridium sp.; ASF 360, Lactobacillus intestinalis; ASF 361, Lactobacillus murinus; ASF 457, Mucispirillum schaedleri; ASF 492, Eubacterium plexicaudatum; ASF 500, Pseudoflavonifractor sp.; ASF 502, Clostridium sp.; and ASF 519, Parabacteroides goldsteinii. Stool collected from 12 healthy vegetarian volunteers or WT mice (approximately 106 cells) were inoculated into chemically defined medium (CDM) alone or supplemented with 1% inulin or 1% porcine gastric mucin in Hungate tubes. Anaerobic cultures (9% H2, 81% N2) were grown statically for 3–4 days at 3°C to approximate saturation.
METHOD DETAILS
Chemically defined medium (CDM)
CDM contained 50 mM HEPES, 2.2 mM KH2PO4, 10 mM Na2HPO4, 60 mM NaHCO3; 4 mM of each amino acid except leucine (15 mM); 10 mL ATCC Trace Mineral Supplement; nucleoside bases (100 mg/L) inosine, xanthine, adenine, guanine, cytosine, thymi-dine, and uracil (400 mg/L); choline (100 mg/L), ascorbic acid (500 mg/L), lipoic acid (2 mg/L), hemin (1.2 mg/L), and myo-inositol (400 mg/L). Resazurin (1 mg/L) was added to visually monitor dissolved oxygen. The pH was adjusted to 7.4.
Bacterial DNA extraction and 16S library preparation
Gut microbiota in the mouse reach a stable homeostatic state at about 8 weeks of age (Laukens et al., 2016). Fecal pellets from mice ≥ 8 weeks of age were frozen on dry ice and stored at −80°C. Bacterial DNA was extracted using a QIAmp Fast DNA Stool Mini Kit (QIAGEN) with an additional 5-min bead-beating step using a Mini-Beadbeater-16 (Biospec Products, OK, USA). Library preparation for the Illumina MiSeq platform was performed by amplification of the V3-V4 region of the bacterial 16S ribosomal DNA gene using forward primer: 5′-TCGTCGGCAGCGTCAGATGTGTATAAGAGACAGCCTACGGGNGGCWGCAG and reverse primer: 5′-GTCTCGTGGGCTCGGAGATGTGTATAAGAGACAG GACTACHVGGGTATCTAATCC. Adaptor and barcode sequences for dual indices were used as described by Illumina. PCR cleanup steps were performed using a QIAquick 96-PCR Cleanup Kit (QIAGEN, Germany), and library quantification was performed using a KAPA Library Quantification Kit for Illumina platforms (KAPA Biosystems, MA, USA). An Experion Automated Gel Electrophoresis System (Bio-Rad, CA, USA) was used to measure the DNA concentration and purity in the pooled libraries. The 16S libraries were sequenced at Novagene (Beijing, China) and at the SBP sequencing core.
16S sequencing data processing
The original FASTQ files from Illumina 250 base-pair paired-end sequencing were processed using a 16S amplicon sequencing pipeline HiMap (http://github.com/taolonglab/himap; BioRxiv 565572). The output of HiMap is Operational Strain Unit (OSU) which contains one or more bacterial strains that best match the 16S sequence and cannot be further distinguished. The percentage similarity between the 16S sequence and the aligned region of 16S rRNA genes of the strains in the OSU is indicated. OSUs mapped to the same strains are grouped together (adding read counts) if percentage similarities are within 3%. Read counts are converted into relative abundance as described in HiMap. Log10-transformed relative abundances were used for comparisons between samples under different experimental conditions. The raw 16S sequencing data is available as BioProject PRJNA593851 online at: https://www.ncbi.nlm.nih.gov/bioproject/PRJNA593851.
Taxa selection
Taxa that distinguished microbiota of inulin- or mucin-treated mice from control mice were selected into three sets as follows. (1) Taxa induced by inulin or mucin were selected by performing a paired one-tail Wilcoxon rank-sum test on the log10-transformed relative abundances of all OSU groups in mice treated with prebiotics at time point B (after the start of prebiotic treatment and before tumor injection) compared with time point A (before prebiotic treatment) with abundance at time point B greater than time point A. Taxa with p values less than 0.05 were selected as set 1. (2) A similar selection to (1) was made for data from the control mice. Taxa with p values less than 0.2 were selected as set 2. This set contains taxa that were induced in the control group from time point A to time point B. (3) The third set of OSU groups were selected by calculating Spearman’s correlations between each of the OSU groups and tumor size at time point B, and selecting groups with p values less than 0.1. The final set of inulin- or mucin-induced taxa was selected as the difference between set 1 and set 2 intersected with set 3. These are the taxa induced in inulin- or mucin-treated mice, but not in control mice, and had relative abundances before tumor injection that negatively correlated with tumor size at tumor collection. For analysis of mice treated with MEKi in combination with prebiotics, OSU groups in the fecal samples of mice treated with prebiotics alone or in combination with MEKi were compared at time point D (final time point before tumor collection) with unpaired two-sided Wilcoxon rank-sum test. OSU groups with p values less than 0.05 were selected for calculating Spearman’s correlations with tumor size at time point D. The OSU groups with correlation p values less than 0.1 were selected as the differential taxa that were negatively correlated with tumor size.
Tumor digestion
Tumors were excised, minced, and digested with 1 μg/mL collagenase D (Roche) and 100 μg/mL DNase I (Sigma) at 37°C for 1 h. Digests were then passed through a 70-μm cell strainer to generate a single-cell suspension. The cells were washed twice with PBS containing 2 mM EDTA and then stained for flow cytometry.
Flow cytometry
Tumor-derived single-cell suspensions were washed twice with FACS staining buffer, fixed for 15 min with 1% formaldehyde in PBS, washed twice, and resuspended in FACS staining buffer. For intracellular cytokine staining, cells were resuspended in complete RPMI-1640 (containing 10 mM HEPES, 1% non-essential amino acids and L-glutamine, 1 mM sodium pyruvate, 10% heat-inactivated FBS, and antibiotics) supplemented with 50 U/mL IL-2 (NCI) and 1 mg/mL brefeldin A (BFA, Sigma), and then incubated with phorbol myristate acetate (10 ng/mL) and ionomycin (0.5 μg/mL) at 37°C. The cells were fixed and permeabilized using a Cytofix/Cytoperm Kit (BD Biosciences) before staining. Antibodies to the following proteins were used: CD45.2 (104), CD8α (53–6.7), CD4 (GK1.5), CD44 (IM7), TNF-α (MP6-XT22), IFN-γ (XMG1.2), CD11c (N418), CD11b (M1/70), MHC class II (M5/114.15.2), PDCA (129c1), and B220 (RA3–6B2) (all from BioLegend), IL-2 (JES6–5H4) and MHC class I (AF6–88.5.5.3) (both from eBioscience). All data were collected on an LSRFortessa (BD Biosciences) and analyzed using FlowJo Software (Tree Star).
Mucin and inulin treatment
For mucin treatment, C57BL/6, C3H/HeOuJ or GF ASF-bearing C3H/HeN mice (male, 6~8 weeks old) were provided with drinking water with or without 3% mucin (Lee Biosolutions) starting 14 days before tumor inoculation. Water was changed every other day. For inulin treatment, C57BL/6 or C3H/HeOuJ mice (male, 6~8 weeks old) received standard chow (TD. 94048, AIN-93M, Purified Diet, ENVIGO), standard chow enriched with long-chain inulin by substituting all sucrose and 5% of corn starch, or a modified chow (TD. 160256, Modified AIN-93M, Diet with 15% inulin, ENVIGO) starting 14 days before tumor inoculation. Chow was refreshed two times a week.
RNA extraction and qRT-PCR analysis
Total RNA was extracted from tumor samples using an RNeasy Fibrous Tissue Midi Kit (QIAGEN) or from cells using a High Capacity Reverse Transcriptase Kit (Invitrogen), according to the manufacturers’ protocols. Purity and concentration of extracted RNA were determined by reading at 260 and 280 nm in a NanoDrop spectrophotometer (Thermo Fisher). qRT-PCR analysis was performed using a SYBR Green RT-PCR Kit (Invitrogen) on a Bio-Rad CFX Connect Real-Time system. Expression levels were normalized to 18S or Tubb5 levels. The sequence-specific primers used in this study are shown in Table S4.
BMDCs
BM cells were isolated from the tibiae and femurs of C57BL/6 mice and cultured in DMEM medium containing 10% FBS, 1% penicillin/streptomycin, and recombinant mouse GM-CSF (20 ng/mL; BioLegend) for 8 days at 37°C.
Isolation of IECs
A 10-cm section of mouse small intestine was opened longitudinally, minced, washed in 150 mM NaCl containing 1 mM DTT, and then resuspended in dissociation buffer (130 mM NaCl, 10 mM EDTA, 10 mM HEPES [pH 7.4], 10% FCS, and 1 mM DTT). The sections were incubated at 37°C for 30 min with vigorous shaking to release the IECs from the lamina propria. The IEC suspension was then carefully aspirated, centrifuged, and washed in ice-cold PBS.
Serum cytokine and chemokine detection
Serum cytokines and chemokines were quantified using the LEGENDplex™ mouse inflammation panel and mouse proinflammatory chemokine panel (BioLegend), respectively. All data were collected on an LSRFortessa and analyzed using LEGENDplex™ software (BioLegend).
In vivo antibody treatments
Mice were injected i.p. with 200 μg anti-PD-1 (clone RMP1–14) or rat IgG2a isotype control on days 7, 10, 13, and 16 after tumor inoculation. All mAbs for in vivo use were GoInVivo grade from BioLegend. CD4+ and CD8+ T cells were depleted by i.p. injection of 400 μg anti-mouse Thy1.2 (CD90.2, clone 30H12 from Bio X Cell) or rat IgG2b isotype control. Antibodies were injected two times a week starting on day 3 after tumor inoculation. The efficacy of depletion was assessed by FACS analysis of blood samples collected on day 8 after tumor inoculation.
In vivo OT-I T cell proliferation assay
CD8+ T cells were isolated from the spleens of naive OT-I CD45.1+ mice, labeled with CFSE, and injected i.v. into WT CD45.2+ C57BL/6 mice treated with or without mucin. After 24 h, the mice were injected s.c. with 1 × 10⁶ B16-OVA melanoma cells. Seven days later, the spleen, tumor-draining lymph nodes, and non-draining lymph nodes were harvested and analyzed by flow cytometry. The proliferation of OT-1 CD8+ T cells was assessed by analysis of CFSE dilution within the population by gating on CD45.1+ CD8+ T cells.
CD8+ T cell enrichment
CD8+ T cells were enriched by negative selection (StemCell Technologies, Inc.) according to the manufacturer’s instruction from spleens of C57BL/6 mice that were untreated or treated with mucin or inulin for 2 weeks. Briefly, the enrichment of mouse CD8+ naive T cells utilized a biotinylated antibody cocktail (Biotinylated CD4, CD11b, CD11C, CD19, CD24 and B220 antibodies) that were captured on streptavidin-coated magnetic beads. Pre-incubation of cells with the antibody cocktail-bound magnetic beads enriched the CD8+ T cells in solution. The purity of the enriched CD8+ T was confirmed by flow cytometry (> 95%). FACS analysis was performed using FlowJo software.
QUANTIFICATION AND STATISTICAL ANALYSIS
Unless otherwise noted, all data are shown as the mean ± s.e.m. Before statistical analysis, data were subjected to the Kolmogorov– Smirnov test to determine distribution. Variance similarity was tested using an F test for two groups and Bartlett’s test for multiple groups. Two groups were compared using the two-tailed t test for parametric data or the Mann–Whitney U test for non-parametric data. Multiple groups were compared using one-way ANOVA with Tukey’s, Dunnett’s, or Bonferroni’s correction for parametric data or using the Kruskal–Wallis test with Dunn’s correction for non-parametric data. Tumor growth curves were analyzed using two-way ANOVA with Sidak’s, Tukey’s, or Bonferroni’s correction for multiple comparisons. Statistical details of each experiment are indicated in the corresponding figure legends.
DATA AND CODE AVAILABILITY
The approach used to map microbiota taxa (Figures 5, 6, and S4) is detailed at: http://github.com/taolonglab/himap; BioRxiv 565572. The microbiome sequence data used for mapping the microbiota taxa have been deposited in NCI BioProject: PRJNA593851 https://www.ncbi.nlm.nih.gov/bioproject/PRJNA593851. The raw data of this manuscript was deposited online in the Mendeley archive https://data.mendeley.com/datasets/zrjr39f7mb/draft?a=28ed04b4-6d90-4eec-be59-c42e05589ade.
Supplementary Material
KEY RESOURCES TABLE
| REAGENT or RESOURCE | SOURCE | IDENTIFIER |
|---|---|---|
| Antibodies | ||
| Purified anti-mouse CD16/32 | BioLegend | Cat#101302; clone 93; RRID: AB_312800 |
| PerCP anti-mouse CD45.2 | BioLegend | Cat# 109826; clone 104; RRID: AB_893349 |
| Pacific Blue anti-mouse CD8a | BioLegend | Cat# 100725; clone 53–6.7; RRID: AB_493425 |
| Brilliant Violet 605 anti-mouse CD4 | BioLegend | Cat# 100451; clone GK1.5; RRID:AB_2564591 |
| FITC anti-mouse CD25 | BioLegend | Cat# 101908; clone 3C7; RRID: AB_961210 |
| APC/Cy7 anti-mouse/human CD44 | BioLegend | Cat# 103028; clone IM7; RRID: AB_830785 |
| PE/Cy7 anti-mouse TNF-α | BioLegend | Cat# 506324; clone MP6-XT22; RRID: AB_2204356 |
| APC anti-mouse IFN-γ | BioLegend | Cat# 505810; clone XMG1.2; RRID: AB_315403 |
| APC anti-mouse CD11c | BioLegend | Cat# 117310; clone N418; RRID: AB_313778 |
| APC anti-mouse CD103 | BioLegend | Cat# 121414; clone 2E7; RRID: AB_1227503 |
| FITC anti-mouse H-2Kb | BioLegend | Cat# 116506; clone AF6–88.5; RRID: AB_313733 |
| Pacific Blue anti-mouse I-A/I-E | BioLegend | Cat# 107620; clone M5/114.15.2; RRID: AB_493527 |
| FITC anti-mouse CD45.1 | BioLegend | Cat# 110706; clone A20; RRID: AB_313495 |
| APC/Cy7 anti-mouse/human CD11 b | BioLegend | Cat# 101225; clone M1/70; RRID: AB_830641 |
| PE anti-mouse CD317 (BST2, PDCA-1) | BioLegend | Cat#127104; clone129C1; RRID: AB_1953283 |
| FITC anti-mouse/human IL-2 | eBioscience | Cat# 11–7021–41; clone JES6–5H4; RRID: AB_10734043 |
| FITC anti-mouse/human MHC Class I | eBioscience | Cat# 11–5958–82; clone AF6–88.5.5.3; RRID: AB_11149502 |
| PE/Cy7 anti-mouse/human CD45R/B220 | BioLegend | Cat# 103222; clone RA3–6B2; RRID: AB_313005 |
| GoInVivo Purified anti-mouse CD279 (PD-1) | BioLegend | Cat# 114112; clone RMP1–14; RRID: AB_2566090 |
| GoInVivo Purified Rat IgG2a, κ Isotype Ctrl | BioLegend | Cat#400560; clone RTK2758 |
| InVivoMAb anti-mouse Thy1.2 (CD90.2) | BioXCell | Cat# BE0066; clone 30H12; AB_1107682 |
| Bacterial and Virus Strains | ||
| ASF | (Li et al., 2018) | N/A |
| Chemicals, Peptides, and Recombinant Proteins | ||
| GM-CSF | BioLegend | Cat# 576306 |
| CFSE (carboxyfluorescein succinimidyl easter) | Thermo Fisher Scientific | Cat# C34554 |
| Collagenase D | Roche | Cat #11088882001 |
| DNase | Sigma | Cat #DN25–1G |
| Brefeldin A | Sigma | Cat# B7651–5MG |
| Phorbol 12-myristate 13-acetate | Sigma | Cat# P8139–1MG |
| lonomycin calcium salt | Sigma | Cat# 3909–1ML |
| Mucin | Lee Biosolutions | Cat# 435–10 |
| Dulbecco’s modified Eagle’s medium (DMEM) | Corning | Cat# 10–013-CV |
| Fetal bovine serum (FBS) | Gemini Bioproducts | Cat#900–208 |
| Penicillin (100 units/mL) and Streptomycin (100ug/mL) | Corning | Cat#30–002-CI |
| Trypsin-EDTA (0.25%), phenol red | Fisher Scientific | Cat#25200056 |
| DPBS without Mg2+ and Ca2+ | Corning | Cat#21–031-CV |
| HBSS without Mg2+ and Ca2+ | Corning | Cat#21021152 |
| RBC lysis buffer | Sigma | Cat#R7757 |
| HEPES Buffer | Corning | Cat#25–060-CI |
| 2-mercaptoethanol | Sigma | Cat#133051 |
| Critical Commercial Assays | ||
| RNeasy Plus Mini Kit | QIAGEN | Cat#74134 |
| LEGENDplex mouse inflammation panel | BioLegend | Cat#740446 |
| LEGENDplex mouse proinflammatory chemokine panel | BioLegend | Cat#740451 |
| RNeasy Fibrous Tissue Mini kit | QIAGEN | Cat#74704 |
| High Capacity Reverse Transcriptase kits | Invitrogen | Cat#4368814 |
| SYBR Green RT-PCR kits | Invitrogen | Cat#4385610 |
| BD Cytofix/Cytoperm | BD Biosciences | Cat#554714 |
| QIAquick 96-PCR Cleanup kit | QIAGEN | Cat#28181 |
| QIAamp Fast DNA Stool Mini Kit | QIAGEN | Cat#51604 |
| Deposited Data | ||
| Bacterial 16 s sequence | This paper | The approach used to map microbiota taxa is detailed at: http://github.com/taolonglab/himap; BioRxiv 565572. The microbiome sequence data have been deposited in the NCI BioProject: PRJNA593851 https://www.ncbi.nlm.nih.gov/bioproject/PRJNA593851 |
| Raw data | This paper | The raw data were deposited to Mendeley https://data.mendeley.com/datasets/zrjr39f7mb/draft?a=28ed04b4-6d90-4eec-be59-c42e05589ade. |
| Experimental Models: Cell Lines | ||
| Mouse: YUMM1.5 | Gift from Marcus Bosenberg (Meeth et al., 2016) | N/A |
| Mouse: MC-38 | Gift from Michael Karin (Li et al., 2019b) | N/A |
| Mouse: MaN-RASQ61K | Gift from Lionel Larue (Petit et al., 2019) | N/A |
| Mouse: SW1 | Gift from Margaret Kripke (Bhoumik et al., 2002) | N/A |
| Mouse: B16-OVA | Gift from Linda Bradley (Li et al., 2019b) | N/A |
| Experimental Models: Organisms/Strains | ||
| Mouse: C57BL/6 | Sanford Burnham Prebys Medical Discovery Institute | N/A |
| Mouse: CD45.1 (B6.SJLB6.SJL-Ptprca Pepcb/BoyJ) | The Jackson Laboratory | Stock No: 002014 |
| Mouse: C3H/HeOuJ | The Jackson Laboratory | Stock No: 000635 |
| Mouse: EX-germ-free ASF-bearing C3H/HeN | University of Nebraska-Lincoln (UNL) | N/A |
| Oligonucleotides | ||
| qPCR primer sequences, See Table S4 | This paper | N/A |
| V3-V4 Forward primer: TCGTCGGCAGCGTCAGATGTGTATAAGAGACAGCCTACGGGNGGCWGCAG | This paper | N/A |
| V3-V4 Reverse primer: GTCTCGTGGGCTCGGAGATGTGTATAAGAGACAG GACTACHVGGGTATCTAATCC | This paper | N/A |
| Software and Algorithms | ||
| GraphPad Prism 6 and 7 | Graphpad Software | N/A |
| FlowJo v10.1 and v9.9 | Treestar | N/A |
| FACSDiva Software | BD | N/A |
| Algorithms HiMAP | This paper | N/A |
| LEGENDplexTM | BioLegend | N/A |
| Other | ||
| 100 um cell strainer | Thermo Fisher | Cat# 22363549 |
| Purified Diet, AIN-93M, | ENVIGO | TD. 94048, |
| Modified AIN-93M, Diet w 15% inulin, | ENVIGO | TD. 160256 |
| Chow diet ad libitum (Purina Foods) | LabDiet | Form: 5K67 |
Highlights.
Mucin and inulin, prebiotics, inhibit melanoma growth in syngeneic mouse models
Changes in gut microbiota taxa by these prebiotics induce anti-tumor immunity
Inulin attenuates melanoma resistance to MEKi in a mouse melanoma model
Inulin and mucin elicit distinct microbiota changes and an additive effect in select models
ACKNOWLEDGMENTS
We thank members of the Ronai lab for discussions and Miguel A. Tam (BioLegend) for the gift of the anti-PD-1 antibodies. Support through grant P30 CA030199 to the analytical genomics, vivarium, fluorescence-activated cell sorting (FACS), and histology core facilities at Sanford Burnham Prebys Medical Discovery Institute (NCI Cancer Center) is gratefully acknowledged. Support from NCI OIA grants R35CA197465 (to Z.A.R.), R01 CA216187 (to L.M.B., S.N.P., and Z.A.R.), Melanoma Research Alliance award 509524 (Z.A.R.), and CDMRP award CA150892 (Y.L.) are gratefully acknowledged.
Footnotes
SUPPLEMENTAL INFORMATION
Supplemental Information can be found online at https://doi.org/10.1016/j.celrep.2020.01.035.
DECLARATION OF INTERESTS
Z.A.R. is a co-founder and serves as a scientific advisor to Pangea Therapeutics. All other authors declare no competing interests. A patent application detailing the findings disclosed in this manuscript has been filed by SBP Discovery.
REFERENCES
- Adolph TE, Tomczak MF, Niederreiter L, Ko HJ, Böck J, Martinez-Naves E, Glickman JN, Tschurtschenthaler M, Hartwig J, Hosomi S, et al. (2013). Paneth cells as a site of origin for intestinal inflammation. Nature 503, 272–276. [DOI] [PMC free article] [PubMed] [Google Scholar]
- Alexander JL, Wilson ID, Teare J, Marchesi JR, Nicholson JK, and Kinross JM (2017). Gut microbiota modulation of chemotherapy efficacy and toxicity. Nat. Rev. Gastroenterol. Hepatol 14, 356–365. [DOI] [PubMed] [Google Scholar]
- Apte RN, Dotan S, Elkabets M, White MR, Reich E, Carmi Y, Song X, Dvozkin T, Krelin Y, and Voronov E (2006). The involvement of IL-1 in tumorigenesis, tumor invasiveness, metastasis and tumor-host interactions. Cancer Metastasis Rev. 25, 387–408. [DOI] [PubMed] [Google Scholar]
- Arthur JC, Perez-Chanona E, Mühlbauer M, Tomkovich S, Uronis JM, Fan TJ, Campbell BJ, Abujamel T, Dogan B, Rogers AB, et al. (2012). Intestinal inflammation targets cancer-inducing activity of the microbiota. Science 338, 120–123. [DOI] [PMC free article] [PubMed] [Google Scholar]
- Bäckhed F, Ley RE, Sonnenburg JL, Peterson DA, and Gordon JI (2005). Host-bacterial mutualism in the human intestine. Science 307, 1915–1920. [DOI] [PubMed] [Google Scholar]
- Belkaid Y, and Hand TW (2014). Role of the microbiota in immunity and inflammation. Cell 157, 121–141. [DOI] [PMC free article] [PubMed] [Google Scholar]
- Bellone M, Cantarella D, Castiglioni P, Crosti MC, Ronchetti A, Moro M, Garancini MP, Casorati G, and Dellabona P (2000). Relevance of the tumor antigen in the validation of three vaccination strategies for melanoma. J. Immunol 165, 2651–2656. [DOI] [PubMed] [Google Scholar]
- Bhoumik A, Huang TG, Ivanov V, Gangi L, Qiao RF, Woo SL, Chen SH, and Ronai Z (2002). An ATF2-derived peptide sensitizes melanomas to apoptosis and inhibits their growth and metastasis. J. Clin. Invest 110, 643–650. [DOI] [PMC free article] [PubMed] [Google Scholar]
- Bonnet M, Buc E, Sauvanet P, Darcha C, Dubois D, Pereira B, Déche-lotte P, Bonnet R, Pezet D, and Darfeuille-Michaud A (2014). Colonization of the human gut by E. coli and colorectal cancer risk. Clin. Cancer Res 20, 859–867. [DOI] [PubMed] [Google Scholar]
- Brighton HE, Angus SP, Bo T, Roques J, Tagliatela AC, Darr DB, Karagoz K, Sciaky N, Gatza ML, Sharpless NE, et al. (2018). New Mechanisms of Resistance to MEK Inhibitors in Melanoma Revealed by Intravital Imaging. Cancer Res. 78, 542–557. [DOI] [PMC free article] [PubMed] [Google Scholar]
- Chaput N, Lepage P, Coutzac C, Soularue E, Le Roux K, Monot C, Boselli L, Routier E, Cassard L, Collins M, et al. (2017). Baseline gut microbiota predicts clinical response and colitis in metastatic melanoma patients treated with ipilimumab. Ann. Oncol 28, 1368–1379. [DOI] [PubMed] [Google Scholar]
- Chistiakov DA, Bobryshev YV, Kozarov E, Sobenin IA, and Orekhov AN (2015). Intestinal mucosal tolerance and impact of gut microbiota to mucosal tolerance. Front. Microbiol 5, 781. [DOI] [PMC free article] [PubMed] [Google Scholar]
- Colli LM, Machiela MJ, Zhang H, Myers TA, Jessop L, Delattre O, Yu K, and Chanock SJ (2017). Landscape of Combination Immunotherapy and Targeted Therapy to Improve Cancer Management. Cancer Res. 77, 3666–3671. [DOI] [PMC free article] [PubMed] [Google Scholar]
- Daillère R, Vétizou M, Waldschmitt N, Yamazaki T, Isnard C, Poirier-Colame V, Duong CPM, Flament C, Lepage P, Roberti MP, et al. (2016). Enterococcus hirae and Barnesiella intestinihominis Facilitate Cyclophosphamide-Induced Therapeutic Immunomodulatory Effects. Immunity 45, 931–943. [DOI] [PubMed] [Google Scholar]
- Dapito DH, Mencin A, Gwak GY, Pradere JP, Jang MK, Mederacke I, Caviglia JM, Khiabanian H, Adeyemi A, Bataller R, et al. (2012). Promotion of hepatocellular carcinoma by the intestinal microbiota and TLR4. Cancer Cell 21, 504–516. [DOI] [PMC free article] [PubMed] [Google Scholar]
- Dushyanthen S, Teo ZL, Caramia F, Savas P, Mintoff CP, Virassamy B, Henderson MA, Luen SJ, Mansour M, Kershaw MH, et al. (2017). Agonist immunotherapy restores T cell function following MEK inhibition improving efficacy in breast cancer. Nat. Commun 8, 606. [DOI] [PMC free article] [PubMed] [Google Scholar]
- Ebert PJR, Cheung J, Yang Y, McNamara E, Hong R, Moskalenko M, Gould SE, Maecker H, Irving BA, Kim JM, et al. (2016). MAP Kinase Inhibition Promotes T Cell and Anti-tumor Activity in Combination with PD-L1 Checkpoint Blockade. Immunity 44, 609–621. [DOI] [PubMed] [Google Scholar]
- Eggermont AMM, Crittenden M, and Wargo J (2018). Combination Immunotherapy Development in Melanoma. Am. Soc. Clin. Oncol. Educ. Book 38, 197–207. [DOI] [PubMed] [Google Scholar]
- Everard A, Belzer C, Geurts L, Ouwerkerk JP, Druart C, Bindels LB, Guiot Y, Derrien M, Muccioli GG, Delzenne NM, et al. (2013). Crosstalk between Akkermansia muciniphila and intestinal epithelium controls diet-induced obesity. Proc. Natl. Acad. Sci. USA 110, 9066–9071. [DOI] [PMC free article] [PubMed] [Google Scholar]
- Fedele C, Ran H, Diskin B, Wei W, Jen J, Geer MJ, Araki K, Ozerdem U, Simeone DM, Miller G, et al. (2018). SHP2 Inhibition Prevents Adaptive Resistance to MEK Inhibitors in Multiple Cancer Models. Cancer Discov. 8, 1237–1249. [DOI] [PMC free article] [PubMed] [Google Scholar]
- Fehlbaum S, Prudence K, Kieboom J, Heerikhuisen M, van den Broek T, Schuren FHJ, Steinert RE, and Raederstorff D (2018). In Vitro Fermentation of Selected Prebiotics and Their Effects on the Composition and Activity of the Adult Gut Microbiota. Int. J. Mol. Sci 19, E3097. [DOI] [PMC free article] [PubMed] [Google Scholar]
- Gomes-Neto JC, Mantz S, Held K, Sinha R, Segura Munoz RR, Schmaltz R, Benson AK, Walter J, and Ramer-Tait AE (2017). A real-time PCR assay for accurate quantification of the individual members of the Altered Schaedler Flora microbiota in gnotobiotic mice. J. Microbiol. Methods 135, 52–62. [DOI] [PMC free article] [PubMed] [Google Scholar]
- Gopalakrishnan V, Helmink BA, Spencer CN, Reuben A, and Wargo JA (2018a). The Influence of the Gut Microbiome on Cancer, Immunity, and Cancer Immunotherapy. Cancer Cell 33, 570–580. [DOI] [PMC free article] [PubMed] [Google Scholar]
- Gopalakrishnan V, Spencer CN, Nezi L, Reuben A, Andrews MC, Karpinets TV, Prieto PA, Vicente D, Hoffman K, Wei SC, et al. (2018b). Gut microbiome modulates response to anti-PD-1 immunotherapy in melanoma patients. Science 359, 97–103. [DOI] [PMC free article] [PubMed] [Google Scholar]
- Haanen JBAG (2017). Converting Cold into Hot Tumors by Combining Immunotherapies. Cell 170, 1055–1056. [DOI] [PubMed] [Google Scholar]
- Haapanen ML, Kalland M, Heliövaara A, Hukki J, and Ranta R (1997). Velopharyngeal function in cleft patients undergoing maxillary advancement. Folia Phoniatr. Logop 49, 42–47. [DOI] [PubMed] [Google Scholar]
- Hampton TA, Conry RM, Khazaeli MB, Shaw DR, Curiel DT, LoBuglio AF, and Strong TV (2000). SEREX analysis for tumor antigen identification in a mouse model of adenocarcinoma. Cancer Gene Ther. 7, 446–455. [DOI] [PubMed] [Google Scholar]
- Humphries A, and Daud A (2018). The gut microbiota and immune checkpoint inhibitors. Hum. Vaccin. Immunother 14, 2178–2182. [DOI] [PMC free article] [PubMed] [Google Scholar]
- Iida N, Dzutsev A, Stewart CA, Smith L, Bouladoux N, Weingarten RA, Molina DA, Salcedo R, Back T, Cramer S, et al. (2013). Commensal bacteria control cancer response to therapy by modulating the tumor microenvironment. Science 342, 967–970. [DOI] [PMC free article] [PubMed] [Google Scholar]
- Johnson DB, and Puzanov I (2015). Treatment of NRAS-mutant melanoma. Curr. Treat. Options Oncol 16, 15. [DOI] [PMC free article] [PubMed] [Google Scholar]
- Laukens D, Brinkman BM, Raes J, De Vos M, and Vandenabeele P (2016). Heterogeneity of the gut microbiome in mice: guidelines for optimizing experimental design. FEMS Microbiol. Rev 40, 117–132. [DOI] [PMC free article] [PubMed] [Google Scholar]
- Ley RE, Lozupone CA, Hamady M, Knight R, and Gordon JI (2008). Worlds within worlds: evolution of the vertebrate gut microbiota. Nat. Rev. Microbiol 6, 776–788. [DOI] [PMC free article] [PubMed] [Google Scholar]
- Li X, Leonardi I, Semon A, Doron I, Gao IH, Putzel GG, Kim Y, Kabata H, Artis D, Fiers WD, et al. (2018). Response to Fungal Dysbiosis by Gut-Resident CX3CR1(+) Mononuclear Phagocytes Aggravates Allergic Airway Disease. Cell Host Microbe 24, 847–856. [DOI] [PMC free article] [PubMed] [Google Scholar]
- Li K, Zhang L, Xue J, Yang X, Dong X, Sha L, Lei H, Zhang X, Zhu L, Wang Z, et al. (2019a). Dietary inulin alleviates diverse stages of type 2 diabetes mellitus via anti-inflammation and modulating gut microbiota in db/db mice. Food Funct. 10, 1915–1927. [DOI] [PubMed] [Google Scholar]
- Li Y, Tinoco R, Elmén L, Segota I, Xian Y, Fujita Y, Sahu A, Zarecki R, Marie K, Feng Y, et al. (2019b). Gut microbiota dependent anti-tumor immunity restricts melanoma growth in Rnf5−/− mice. Nat. Commun 10, 1492. [DOI] [PMC free article] [PubMed] [Google Scholar]
- Martz CA, Ottina KA, Singleton KR, Jasper JS, Wardell SE, Peraza-Penton A, Anderson GR, Winter PS, Wang T, Alley HM, et al. (2014). Systematic identification of signaling pathways with potential to confer anti-cancer drug resistance. Sci. Signal 7, ra121. [DOI] [PMC free article] [PubMed] [Google Scholar]
- Matson V, Fessler J, Bao R, Chongsuwat T, Zha Y, Alegre ML, Luke JJ, and Gajewski TF (2018). The commensal microbiome is associated with anti-PD-1 efficacy in metastatic melanoma patients. Science 359, 104–108. [DOI] [PMC free article] [PubMed] [Google Scholar]
- Mauro MO, Monreal MT, Silva MT, Pesarini JR, Mantovani MS, Ribeiro LR, Dichi JB, Carreira CM, and Oliveira RJ (2013). Evaluation of the antimutagenic and anticarcinogenic effects of inulin in vivo. Genet. Mol. Res 12, 2281–2293. [DOI] [PubMed] [Google Scholar]
- Meeth K, Wang JX, Micevic G, Damsky W, and Bosenberg MW (2016). The YUMM lines: a series of congenic mouse melanoma cell lines with defined genetic alterations. Pigment Cell Melanoma Res. 29, 590–597. [DOI] [PMC free article] [PubMed] [Google Scholar]
- Petit V, Raymond J, Alberti C, Pouteaux M, Gallagher SJ, Nguyen MQ, Aplin AE, Delmas V, and Larue L (2019). C57BL/6 congenic mouse NRASQ61K melanoma cell lines are highly sensitive to the combination of Mek and Akt inhibitors in vitro and in vivo. Pigment Cell Melanoma Res. 32, 829–841. [DOI] [PubMed] [Google Scholar]
- Pitt JM, Vétizou M, Waldschmitt N, Kroemer G, Chamaillard M, Boneca IG, and Zitvogel L (2016). Fine-Tuning Cancer Immunotherapy: Optimizing the Gut Microbiome. Cancer Res. 76, 4602–4607. [DOI] [PubMed] [Google Scholar]
- Ribas A, Lawrence D, Atkinson V, Agarwal S, Miller WH Jr., Carlino MS, Fisher R, Long GV, Hodi FS, Tsoi J, et al. (2019). Combined BRAF and MEK inhibition with PD-1 blockade immunotherapy in BRAF-mutant melanoma. Nat. Med 25, 936–940. [DOI] [PMC free article] [PubMed] [Google Scholar]
- Routy B, Le Chatelier E, Derosa L, Duong CPM, Alou MT, Daillère R, Fluckiger A, Messaoudene M, Rauber C, Roberti MP, et al. (2018). Gut microbiome influences efficacy of PD-1-based immunotherapy against epithelial tumors. Science 359, 91–97. [DOI] [PubMed] [Google Scholar]
- Roy S, and Trinchieri G (2017). Microbiota: a key orchestrator of cancer therapy. Nat. Rev. Cancer 17, 271–285. [DOI] [PubMed] [Google Scholar]
- Rutkowski MR, Stephen TL, Svoronos N, Allegrezza MJ, Tesone AJ, Perales-Puchalt A, Brencicova E, Escovar-Fadul X, Nguyen JM, Cadungog MG, et al. (2015). Microbially driven TLR5-dependent signaling governs distal malignant progression through tumor-promoting inflammation. Cancer Cell 27, 27–40. [DOI] [PMC free article] [PubMed] [Google Scholar]
- Sanlorenzo M, Vujic I, Floris A, Novelli M, Gammaitoni L, Giraudo L, Macagno M, Leuci V, Rotolo R, Donini C, et al. (2018). BRAF and MEK Inhibitors Increase PD-1-Positive Melanoma Cells Leading to a Potential Lymphocyte-Independent Synergism with Anti-PD-1 Antibody. Clin. Cancer Res 24, 3377–3385. [DOI] [PubMed] [Google Scholar]
- Singh A, Zapata RC, Pezeshki A, Reidelberger RD, and Chelikani PK (2018). Inulin fiber dose-dependently modulates energy balance, glucose tolerance, gut microbiota, hormones and diet preference in high-fat-fed male rats. J. Nutr. Biochem 59, 142–152. [DOI] [PubMed] [Google Scholar]
- Sivan A, Corrales L, Hubert N, Williams JB, Aquino-Michaels K, Earley ZM, Benyamin FW, Lei YM, Jabri B, Alegre ML, et al. (2015). Commensal Bifidobacterium promotes antitumor immunity and facilitates anti-PD-L1 efficacy. Science 350, 1084–1089. [DOI] [PMC free article] [PubMed] [Google Scholar]
- Sommer F, and Bäckhed F (2013). The gut microbiota—masters of host development and physiology. Nat. Rev. Microbiol 11, 227–238. [DOI] [PubMed] [Google Scholar]
- Tanoue T, Morita S, Plichta DR, Skelly AN, Suda W, Sugiura Y, Narushima S, Vlamakis H, Motoo I, Sugita K, et al. (2019). A defined commensal consortium elicits CD8 T cells and anti-cancer immunity. Nature 565, 600–605. [DOI] [PubMed] [Google Scholar]
- Taper HS, and Roberfroid M (1999). Influence of inulin and oligofructose on breast cancer and tumor growth. J. Nutr 129 (Suppl 7), 1488S–1491S. [DOI] [PubMed] [Google Scholar]
- Vella LJ, Pasam A, Dimopoulos N, Andrews M, Knights A, Puaux AL, Louahed J, Chen W, Woods K, and Cebon JS (2014). MEK inhibition, alone or in combination with BRAF inhibition, affects multiple functions of isolated normal human lymphocytes and dendritic cells. Cancer Immunol. Res 2, 351–360. [DOI] [PubMed] [Google Scholar]
- Vétizou M, Pitt JM, Daillère R, Lepage P, Waldschmitt N, Flament C, Rusakiewicz S, Routy B, Roberti MP, Duong CP, et al. (2015). Anticancer immunotherapy by CTLA-4 blockade relies on the gut microbiota. Science 350, 1079–1084. [DOI] [PMC free article] [PubMed] [Google Scholar]
- Wang L, Walia B, Evans J, Gewirtz AT, Merlin D, and Sitaraman SV (2003). IL-6 induces NF-kappa B activation in the intestinal epithelia. J. Immunol 171, 3194–3201. [DOI] [PubMed] [Google Scholar]
- Wang L, Yi T, Kortylewski M, Pardoll DM, Zeng D, and Yu H (2009). IL-17 can promote tumor growth through an IL-6-Stat3 signaling pathway. J. Exp. Med 206, 1457–1464. [DOI] [PMC free article] [PubMed] [Google Scholar]
- York A (2018). Microbiome: Gut microbiota sways response to cancer immunotherapy. Nat. Rev. Microbiol 16, 121. [DOI] [PubMed] [Google Scholar]
- Yue P, Harper T, Bacot SM, Chowdhury M, Lee S, Akue A, Kukuruga MA, Wang T, and Feldman GM (2018). BRAF and MEK inhibitors differentially affect nivolumab-induced T cell activation by modulating the TCR and AKT signaling pathways. OncoImmunology 8, e1512456. [DOI] [PMC free article] [PubMed] [Google Scholar]
Associated Data
This section collects any data citations, data availability statements, or supplementary materials included in this article.
Supplementary Materials
Data Availability Statement
The approach used to map microbiota taxa (Figures 5, 6, and S4) is detailed at: http://github.com/taolonglab/himap; BioRxiv 565572. The microbiome sequence data used for mapping the microbiota taxa have been deposited in NCI BioProject: PRJNA593851 https://www.ncbi.nlm.nih.gov/bioproject/PRJNA593851. The raw data of this manuscript was deposited online in the Mendeley archive https://data.mendeley.com/datasets/zrjr39f7mb/draft?a=28ed04b4-6d90-4eec-be59-c42e05589ade.