

Abstract
The mechanisms that regulate the switch between epidermal progenitor state and differentiation are not fully understood. Recent findings indicate that the chromatin remodelling BAF complex (Brg1‐associated factor complex or SWI/SNF complex) and the transcription factor p63 mutually recruit one another to open chromatin during epidermal differentiation. Here, we identify a long non‐coding transcript that includes an ultraconserved element, uc.291, which physically interacts with ACTL6A and modulates chromatin remodelling to allow differentiation. Loss of uc.291 expression, both in primary keratinocytes and in three‐dimensional skin equivalents, inhibits differentiation as indicated by epidermal differentiation complex genes down‐regulation. ChIP experiments reveal that upon uc.291 depletion, ACTL6A is bound to the differentiation gene promoters and inhibits BAF complex targeting to induce terminal differentiation genes. In the presence of uc.291, the ACTL6A inhibitory effect is released, allowing chromatin changes to promote the expression of differentiation genes. Thus, uc.291 interacts with ACTL6A to modulate chromatin remodelling activity, allowing the transcription of late differentiation genes.
Keywords: ACTL6A/BAF complex, epidermis, keratinocyte, lncRNA
Subject Categories: Chromatin, Epigenetics, Genomics & Functional Genomics; Development & Differentiation; RNA Biology
The long non‐coding transcript uc.291 contains an ultraconserved region and is upregulated during keratinocyte differentiation. Uc.291 interacts with the BAF‐associated protein ACTL6A to remodel chromatin, promoting late differentiation gene expression.
Introduction
During somatic tissue differentiation, progenitor proliferating cells establish a specific programme of gene activation and silencing that underlies their differentiation into specialized cell types. This process is nicely recapitulated during epidermis formation and epidermis homeostasis. Recent studies demonstrated that epigenetic regulators from multiple classes play a critical role in activating and repressing gene expression by affecting the chromatin state. The epigenetic regulators that promote proliferation and inhibit activation of terminal differentiation‐associated genes in progenitor cells include DNA methyltransferase 1 (DNMT1) 1, histone deacetylases 1 and 2 (HDAC1/2) 2, and polycomp components Bmi1, Ezh1/2 3, 4, 5 and Cbx4 6. Conversely, histone demethylase Jumonji domain‐containing 3 7, adenosine triphosphate‐dependent (ATP‐dependent) chromatin remodeller Brg1/BAF complex 6, 8, 9 and genome organizer Satb1 10 promote terminal keratinocyte differentiation 11, 12, 13, 14, 15. The BAF pro‐differentiation role is prevented by ACTL6A (actin‐like 6A, also known as BAF53A), a BAF‐associated protein that is highly expressed in proliferating epithelial precursors 8. However, the mechanism through which ACTL6A inhibits DNA targeting of the BAF complex is not known, nor is the mechanism to drive ACTL6A down‐regulation/inactivation in epithelial progenitors to allow differentiation.
In the last decade, long non‐coding RNAs (lncRNAs) have generated significant interest in controlling progenitor stem cell biology and somatic lineage specification and differentiation 16, 17. So far, only few lncRNAs have been described to play a role in controlling the proliferation/differentiation switch in keratinocytes: ANCR, anti‐differentiation ncRNA, and TINCR, terminal differentiation‐induced ncRNA. Although TINCR controls differentiation via a post‐transcriptional mechanism, the ANCR‐mediated mechanism to promote the undifferentiated cell state in the epidermis has not been identified 18, 19. Similarly, LIN00941 has also been recently implicated in controlling epidermal homeostasis repressing the expression of pro‐differentiation genes with an not‐yet identified mechanisms 20. Through a bioinformatics analysis comparing mouse, rat and human genomes, a specific sub‐class of lncRNAs containing ultraconserved regions (UCRs) was identified 21, 22, 23. LncRNA‐containing UC regions are transcribed from 481 genomic loci that contain 200–779 bases of highly conserved sequences amongst the three species mentioned before 21, with 100% identity (no insertions or deletions). Interestingly, under genomic instability conditions such as cancer, these UC sequences accumulate mutations 24. A large fraction of these 481 genomic loci are transcribed (T‐UCRs) in normal cells and tissues; some of them are ubiquitously expressed, whereas others follow tissue‐specific expression patterns 25, 26, 27, 28, 29. T‐UCR functions are largely unknown; the fact that they contain a highly conserved region implies that they are important for mammalian phylogenesis and/or ontogenesis 21.
Here, starting from a genome‐wide expression profiling, we demonstrated for the first time a functional link between UC‐containing lncRNAs (T‐UCRs) and the switch between the undifferentiated state and the terminal‐differentiated state in the epidermis. We found that uc.291 physically interacts with ACTL6A modulating chromatin remodelling to allow differentiation. Chromatin immunoprecipitation (ChIP) experiments show that silencing uc.291 preserves the ACTL6A binding to differentiation gene promoters and possibly inhibits the BAF complex from targeting epidermal differentiation complex (EDC) genes; conversely, in the presence of uc.291, ACTL6A is released, allowing chromatin changes to promote the expression of epithelial differentiation genes.
Results
Uc.291 expression changes during epidermal differentiation
To investigate the role of UC‐containing lncRNAs (T‐UCRs) in progenitor/undifferentiated and differentiated keratinocytes (HEKn, human epidermal keratinocytes, neonatal), we performed a microarray in which we compared T‐UCR expression profiles of undifferentiated proliferating keratinocytes with those of differentiated keratinocytes (Fig 1A). We found 79 T‐UCRs that are significantly modulated during the differentiation (P < 0.05, 22 up‐regulated; 57 down‐regulated) (Fig EV1A; Appendix Table S1). After RT–qPCR validation of 20 T‐UCRs (Fig EV1B and C), we selected uc.291 (fold change 3.8 ± 0.9) for functional studies, taking into account that uc.291 was consistently up‐regulated during keratinocyte differentiation also in different human keratinocyte donors (Fig 1B); it has also been detected in many human epithelial tissues 25. Uc.291 gradually accumulates during HEKn calcium‐induced differentiation, increasing by 2.2‐, 7.5‐ and 8.5‐fold over the control after 3, 6 and 9 days of treatment, respectively (P < 0.05, P < 0.01; Fig 1B). Its expression paralleled the expression of early (IVL, KRT10) and late (LOR) differentiation markers (Fig 1C). These in vitro results were confirmed by in situ hybridization of the human epidermis, showing uc.291 accumulation in the epidermis supra‐basal layers and a strong staining in supra‐basal nuclei (Fig 1D). HEKn FISH analysis (Fig 1E) and subcellular fractionation (Fig 1F, fold change 112 ± 29, P < 0.05) showed that it is mainly found in the nuclei of keratinocytes, indicating a nuclear function of this pro‐differentiation lncRNA. Notably, the uc.291 transcript has the same orientation of its hosted gene, and it is expressed approximately eightfold higher than the antisense transcript (that is the limit of detectability; Figs 1G and H, and EV2A–C); therefore, siRNAs were designed to specifically target the sense uc.291 transcript. Uc.291 is located on chromosome 10 (hg38, chr10:76,523,866–76,524,096) and is hosted in the sixth intron of the LRMDA gene (previously named C10orf11, Fig 1H). During keratinocyte differentiation, the expression of the LRMDA flanking exons (exon 2–3 and exon 6–7) by RT–qPCR (Fig 1I) decreases, indicating that uc.291 is transcribed independently from LRMDA mRNA. Originally, only the ultraconserved sequence (231 bp in Ref. 21; 424 bp in UCNEbase) of uc.291 was known (Fig 1H); to gain additional information on the transcript, we performed a “cDNA walking” approach using multiple primer amplifications and cloned a transcript of 3,816 nt (nucleotides) that included the original UCR (Appendix Figs S1 and S2).
Figure 1. Uc.291 expression is induced during epidermal differentiation.
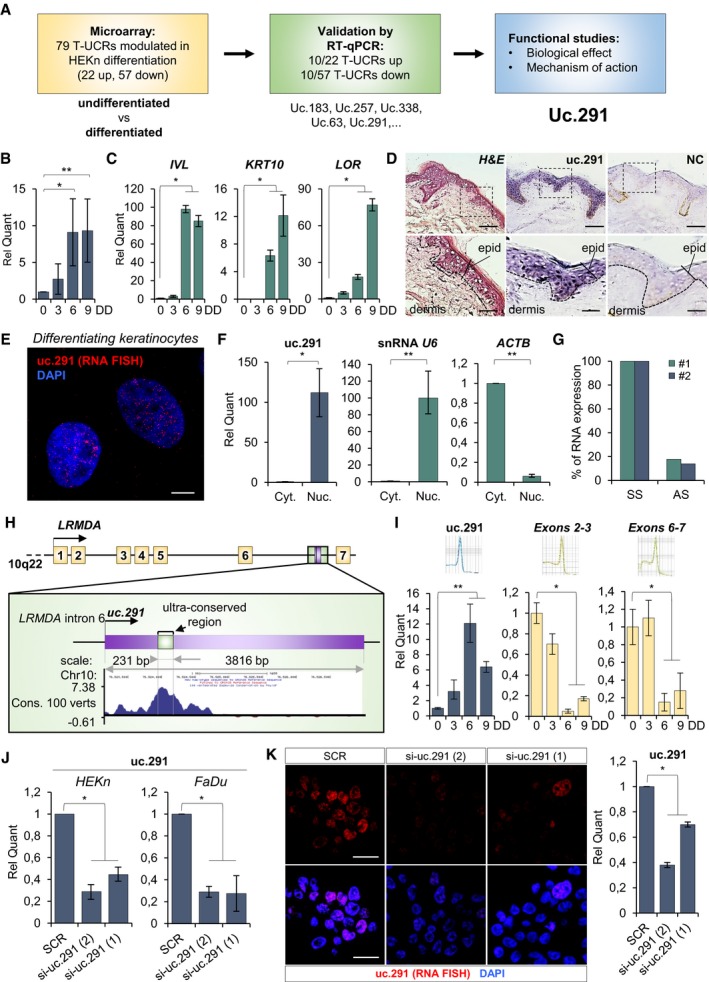
- Workflow of the study.
- Relative uc.291 expression quantification during calcium‐induced in vitro differentiation of HEKn (3, 6 and 9 days of differentiation, DD). The quantification is relative to uc.291 expression in proliferating HEKn (0 day). Data shown represent the mean ± standard deviation (s.d.); n = 4 different human donors; *P < 0.05, **P < 0.01, Student's t‐test.
- Involucrin (IVL), Keratin 10 (KRT10) and Loricrin (LOR) expression levels evaluated by RT–qPCR are shown as positive control of differentiation. The quantification is relative to gene expression in proliferating HEKn (0 day). Data shown represent the mean ± s.d.; n = 3 technical on 1 of the 4 human donors used in panel (B); *P < 0.05, Student's t‐test.
- Haematoxylin/eosin (H&E) staining and in situ hybridization of specific (uc.291) or not specific (negative control, NC) probes on human skin section. Scale bars denote 50 and 500 μm.
- RNA FISH for uc.291 (red, Quasar 570) on HEKn at 9 days of differentiation. Nuclei were stained with DAPI. Scale bar: 10 μm.
- Relative uc.291 quantification after RNA isolation from cytosolic and nuclear cellular compartments. snRNA U6 quantification was used as nuclear fraction positive control, while ACTB as cytosolic fraction positive control. Data shown are mean ± s.d.; n = 3 technical on 1 of the 4 human donors used in panel (B); *P < 0.05, **P < 0.01, Student's t‐test.
- Strand‐specific RT–qPCR shows that uc.291 is transcribed in genomic sense orientation in HEKn cells; n = 2 technical (#1 and #2) on 1 human donor; SS: sense strand transcript, AS: antisense strand transcript.
- Picture showing uc.291 and LRMDA genomic location.
- Expression of uc.291 and LRMDA exons 2‐3 and exons 6–7 during keratinocyte differentiation. Data shown are mean ± s.d.; n = 2 different donors (3 technical/donor); *P < 0.05, **P < 0.01, Student's t‐test.
- Relative uc.291 quantification after si‐uc.291(1) and si‐uc.291(2) in HEKn and FaDu cells. Data shown are mean ± s.d.; HEKn n = 3 technical on 1 human donor; FaDu n = 2 biological replicates (3 technical/biological replicate); *P < 0.05, Student's t‐test.
- RNA FISH for uc.291 (red, Quasar 570) on A253 in scramble (SCR) and silenced (si‐uc.291(1) and si‐uc.291(2)) cells. Nuclei were stained with DAPI. Scale bar: 10 μM. The histogram derives from the RT–qPCR using the leftover cells after removing the slides used for the FISH staining. Data shown are mean ± s.d; n = 3 biological replicates *P < 0.05, Student's t‐test.
Figure EV1. UC RNA is modulated during keratinocyte differentiation.
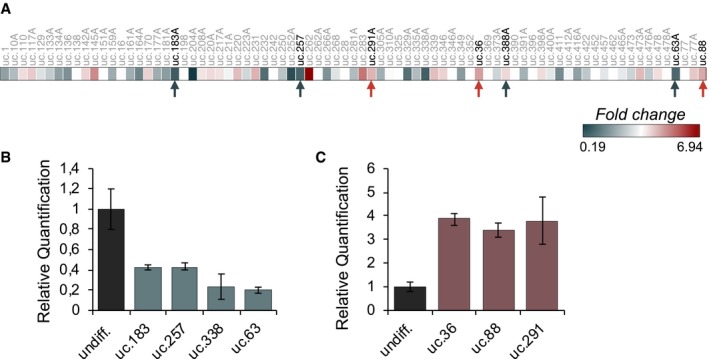
- Heatmap showing microarray data results. Data are expressed as fold change.
- Validation by RT–qPCR of down‐regulated UCs showed in (A).
- Validation by RT–qPCR of up‐regulated UCs showed in (A). In (B) and (C), the quantification is relative to the same UC expression in undifferentiated HEKn (undiff., dark grey bars); data shown represent the mean ± standard error (RT–qPCR has been done in triplicate); n = 1 (technical).
Figure EV2. Characterization of uc.291 transcript by strand‐specific RT–qPCR .
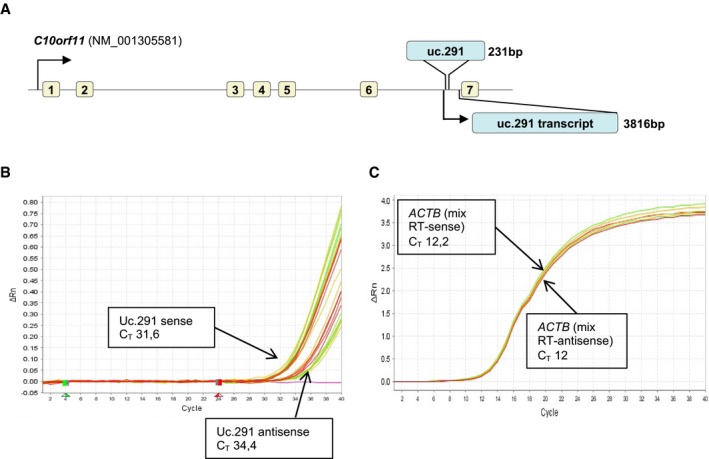
- Uc.291 (3,816 bp) genomic location on chromosome 10 in the sixth intron of the C10orf11 gene.
- Uc.291 strand‐specific RT–qPCR; representative amplification plots (#2 of Fig 1G) of strand‐specific RT–qPCR; qPCR curves relative to the sense and the antisense transcripts are shown.
- ACTB mRNA strand‐specific RT–qPCR was used as control.
Silencing of uc.291 alters epidermal proliferation and differentiation
The biological function of uc.291 was assessed by RNA interference in primary human keratinocytes growing in differentiating conditions. SiRNA sequence specificity was validated both in HEKn and in FaDu cancer cells (Fig 1J). FISH experiments performed after si‐uc.291 did not detect signals in contrast to scramble transfected cells, further confirming siRNAs specificity for uc.291 (Fig 1K).
Silencing of uc.291 during differentiation strongly impaired this process. This was evaluated by RT–qPCR (Fig 2A) and by Western blot (WB) analysis of differentiation genes (Fig 2B). Notably, the late differentiation marker Loricrin was strongly reduced at both mRNA and protein levels, while the early differentiation marker Keratin 10 (K10) was not affected by uc.291 expression (Fig 2B), thereby suggesting an important role in the late differentiation steps. Interestingly, uc.291 is a pro‐differentiation transcript independently from the differentiation stimuli used in vitro; beside calcium‐induced differentiation (Figs 1B and EV3A, CaCl2), uc.291 is up‐regulated even with confluence‐induced differentiation in both EpiLife medium and Eagle's minimum essential medium (Fig EV3A, Epi and EMEM). Uc.291 knock‐down in organotypic human epidermal tissue, a setting that recapitulates the structure and the gene expression profile of the human epidermis 30, confirmed the data shown thus far. Although the uc.291‐deficient epidermis was normally stratified, the expression of key differentiation genes, including Loricrin and Filaggrin, was markedly reduced, while K10 did not change (Fig 2C). In uc.291‐depleted human organotypic epidermis, the expression of the proliferation marker Ki67 increased from 18.9 to 23.1% (P < 0.05) and 24.8% (P < 0.01) in scramble and si‐uc.291 sequences 1 and 2, respectively (Fig EV3B). Similarly, p63‐positive keratinocytes increased from 64.2 to 70.6% (P < 0.05) and 72.2% (P < 0.01) in the same conditions, respectively (Fig 2D and E), while we detected a decrease of the cyclin‐dependent kinase inhibitor 1B (p27Kip1) and a higher expression level of ΔNp63 in si‐uc.291 cells grown in both proliferating and differentiating conditions (Fig 2F).
Figure 2. Silencing of Uc.291 affects epidermal differentiation.
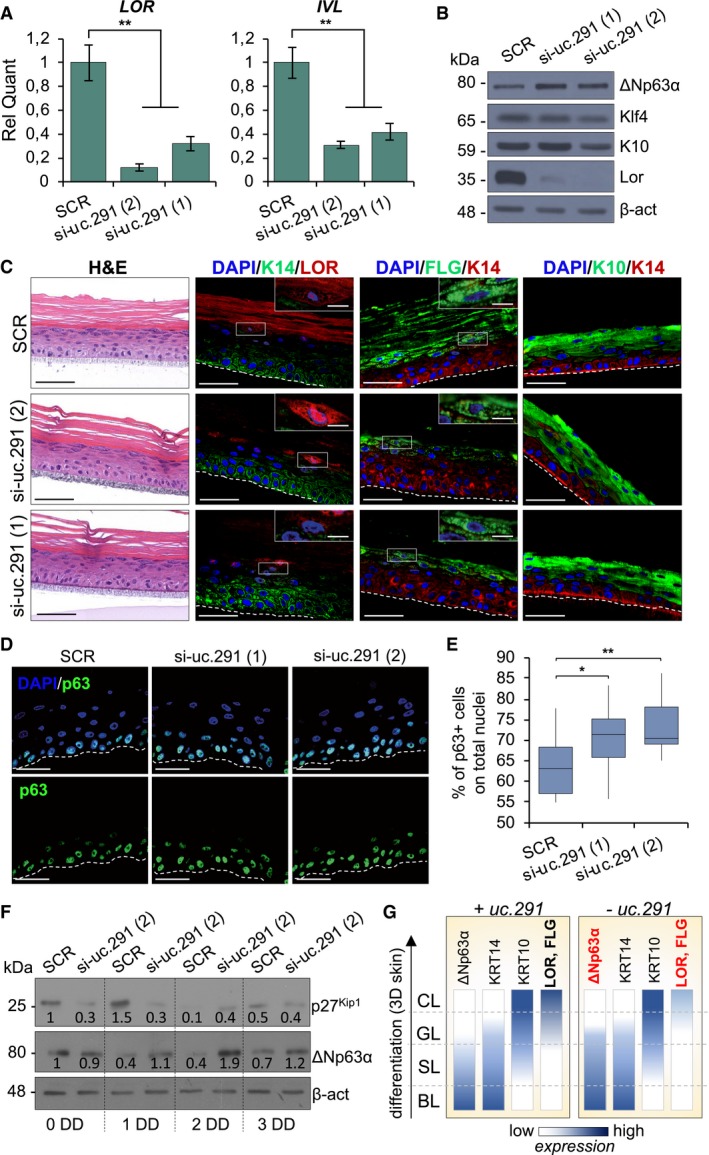
- Relative quantification of the differentiation markers LOR and IVL in HEKn transfected with uc.291 siRNA (1) and (2) or SCR control siRNA and collected after 3 days of differentiation. Data shown represent the mean ± s.d.; n = 4 different human donors; **P < 0.01, Student's t‐test.
- WB showing ΔNp63α, Klf4, K10 and Loricrin (LOR) protein levels in HEKn transfected cells as described in (A). β‐actin was shown as loading control. One representative experiment of three is shown.
- IF staining of late differentiation markers Loricrin and Filaggrin in uc.291‐depleted, si‐uc.291(1) and si‐uc.291(2), organotypic human epidermis compared to scramble control one (SCR); haematoxylin/eosin (H&E) staining shows the organotypic epidermis structure (left panels); scale bars: 50 μm. The magnified boxes show expression of Loricrin and Filaggrin in the granular layer; scale bars: 10 μm. Dotted lines represent the insert border. One representative experiment of three is shown.
- IF staining and confocal analysis of p63 in the organotypic human epidermis obtained as described in (C). Dotted lines represent the insert border. One representative experiment of three is shown. Scale bars: 50μm.
- Box plot showing quantification of p63‐positive nuclei on total nuclei. Each central line represents the median; each box represents Q1 (quartile 1, below the median) and Q3 (quartile 3, above the median); the whiskers represent minimum (Q1 − 1.5*IQR) and maximum (Q3 + 1.5*IQR). IQR = interquartile range; 16, 15 and 19 images were analysed for SCR, si‐uc.291 (1) and si‐uc.291 (2) respectively; *P < 0.05; **P < 0.01, Student's t‐test.
- WB showing cyclin‐dependent kinase inhibitor 1B (p27Kip1) and ΔNp63α protein levels in HEKn cells transfected with uc.291 siRNA (2) or SCR control siRNA and collected in proliferating (0 day) or differentiating (1, 2 and 3 days of differentiation, DD) conditions. β‐actin was used as loading control. The numbers below the bands represent the densitometric analysis normalized for the loading control. One representative experiment of three is shown.
- Schematic representation of the expression of selected markers in organotypic human epidermis upon uc.291 depletion.
Source data are available online for this figure.
Figure EV3. uc.291 is up‐regulated during keratinocyte differentiation, regardless of the differentiation methodology.
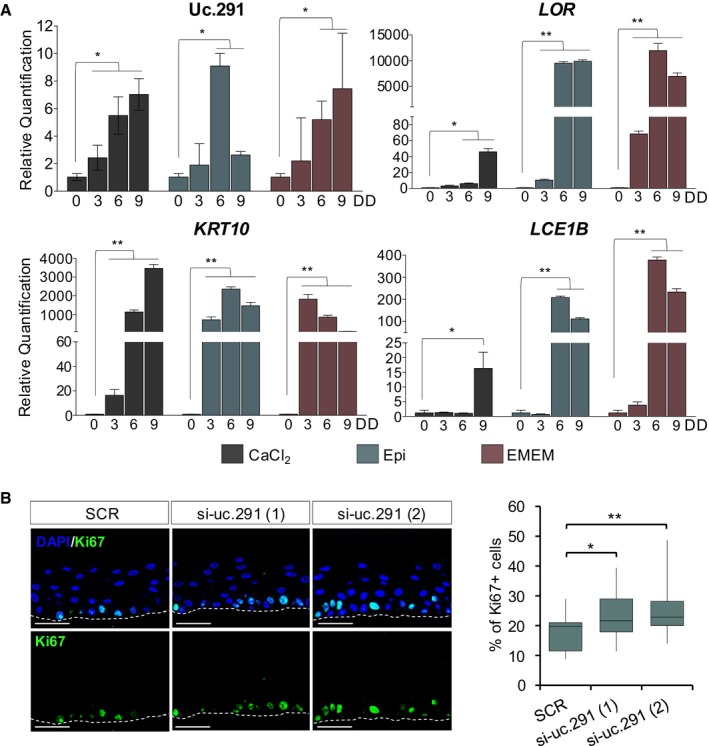
- RT–qPCR showing uc.291 expression in HEKn grown in calcium‐induced differentiation (CaCl2) or confluence‐induced differentiation (in Epi and EMEM). CaCl2 = calcium chloride; Epi = EpiLife; EMEM = Eagle's minimum essential medium. LOR, KRT10 and LCE1B were used as differentiation markers. DD = days of differentiation; the quantification is relative to the same expression in undifferentiated HEKn (0 DD); data shown represent the mean ± standard deviation; n = 3 (technical); *P < 0.05, **P < 0.01, Student's t‐test.
- Box plot showing quantification of Ki67‐positive nuclei on total nuclei. In parallel with the increase of p63 expression (Fig 2), depletion of uc.291 affects the proliferation rate of basal keratinocytes. Each central line represents the median; each box represents Q1 (quartile 1, below the median) and Q3 (quartile 3, above the median); the whiskers represent minimum (Q1 − 1.5*IQR) and maximum (Q3 + 1.5*IQR). IQR = interquartile range; 15, 14 and 15 images were analysed for SCR, si‐uc.291 (1) and si‐uc.291 (2), respectively; *P < 0.05; **P < 0.01, Student's t‐test.
Altogether, these results strongly indicate that uc.291 is required to allow the expression of terminal differentiation genes and that alteration of the late differentiation steps also affects the proliferating keratinocyte compartment (Fig 2G).
Silencing of uc.291 disrupts the expression of genes involved in epidermal differentiation
To gain further information on the role of uc.291 during differentiation, transcriptomic profiling of uc.291‐depleted differentiating keratinocytes was performed. We demonstrated that the down‐regulation of uc.291 affected the expression of 596 genes (P < 0.05), 203 of which were up‐regulated and 393 were down‐regulated (Fig 3A–C; Dataset EV1). Uc.291‐regulated genes were enriched for skin, epidermis, and epithelia development‐, epidermal cell differentiation‐ and keratinization‐related Gene Ontology (GO) terms (Fig 3D and E). The latter is in line with the phenotype of the uc.291‐depleted epidermis (Fig 2). Interestingly, amongst the down‐regulated genes, 23 belonged to the EDC (Fig 3F and G). The EDC comprises several genes that are of crucial importance for the maturation/keratinization of the human epidermis and are located in a 2 Mb region on human chromosome 1q21 31, 32. The EDC contains three clustered families of genes that encode a group of precursor proteins of the cornified envelope (CE), including involucrin, Loricrin, SPRRs (small proline‐rich proteins) and the “late cornified envelope” (LCE) proteins; calcium‐binding proteins (S100); and the “fused gene” proteins (SFTPs), including Filaggrin, Filaggrin‐2, trichohyalin, trichohyalin‐like protein, hornerin, repetin and cornulin (Fig 3F and G) 33. RT–qPCR was used to validate the down‐regulation of EDC genes (Fig 3H); we also confirmed their down‐regulation in the uc.291‐depleted epidermis (Fig 3I). These results confirmed that uc.291 is important for regulating gene expression during differentiation, including the expression of many genes located in the EDC, including LOR.
Figure 3. Uc.291 regulates the expression of epidermal differentiation genes, including the epidermal differentiation complex (EDC) genes.
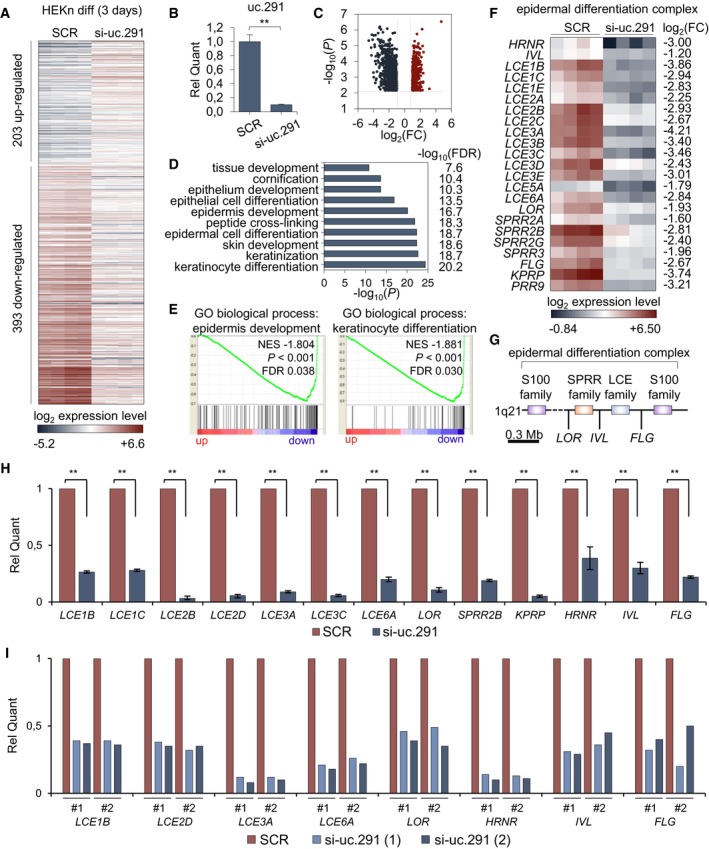
- Heatmap showing gene expression profile of HEKn silenced by either SCR or si‐uc.291 (2) siRNAs by gene microarray analysis; n = 4 technical replicates using 1 human donor; P < 0.05, Student's t‐test, abs (FC) > 2.
- RT–qPCR confirming the efficiency of silencing. Data shown are mean ± s.d; the same samples of (A) were used; **P < 0.01, Student's t‐test.
- Volcano plot showing fold changes of differently expressed genes from (A): up‐regulated genes are shown in red, and down‐regulated genes are shown in dark grey.
- GO terms analysis for genes down‐regulated upon uc.291 depletion from (A).
- GSEA comparing a query gene set of modulated genes from (A) with GO biological process signatures associated with epidermis development and keratinocyte differentiation. NES = normalized enrichment score, FDR = false discovery rate. Kolmogorov–Smirnov statistic was used.
- Heatmap showing gene expression of the most down‐regulated genes located within epidermal differential complex (EDC) upon depletion of uc.291 from (A).
- Scheme of the epidermal differentiation complex (EDC) genes.
- Validation of array data by RT–qPCR showing mRNA quantification of thirteen EDC genes down‐regulated upon si‐uc.291. Data shown are mean ± s.d.; (n = 3 different human donors); **P < 0.01, Student's t‐test).
- Validation of array data by RT–qPCR showing mRNA quantification of eight EDC genes down‐regulated in uc.291‐depleted organotypic human epidermis; n = 2 technical (#1 and #2) from 1 human donor.
Uc.291 interacts with ACTL6A
The effect of uc.291 depletion on the expression of EDC genes suggested that uc.291 could interfere with epigenetic modulators that control gene expression during differentiation. To determine the mechanisms of uc.291 action, we aimed to identify uc.291 binding proteins of relevance to epidermal differentiation. Uc.291 sense and antisense (the latter as control) RNA was transcribed with Cy5 and independently hybridized to a protein microarray (HuProt v.2 Human Proteome Arrays) containing 50,000 recombinant human proteins (Fig EV4A and B). We performed two replicates, obtaining a correlation of 0.79 for RNA‐binding protein (RBP) interactions and 0.76 for chromatin‐related proteins (Fig EV4C). Using the fluorescence over background (F‐B) average calculated for both replicates, we selected uc.291 interactions with a positive score (15,400; Fig EV4B). The filtering computational procedure narrowed down the list. To investigate the specific link between uc.291 and chromatin modification, we restricted our analysis to chromatin‐related proteins (QuickGO and UniProt), resulting in 40 candidates (Appendix Table S2; Fig EV4D), 20 of which are epidermis‐expressed proteins (Fig 4A and B; Appendix Table S2). We found that ACTL6A is the 3rd ranked candidate out of 20 proteins, preceded by BATF2 and SMARCE1. ACTL6A is a BAF‐associated protein and is highly expressed in proliferating epithelial precursors 8; it was recently shown to block the BAF pro‐differentiation role that specifically affects EDC gene expression 11, 15. Uc.291 and ACTL6A reciprocal binding was demonstrated by RNA cross‐linking immunoprecipitation (CLIP) and by RNA immunoprecipitation (RIP) experiments (Fig 4C and D) using a specific anti‐ACTL6A antibody. We added SMARCC2, another subunit of the complex, and found that it interacts with uc.291 by CLIP. As negative control, we tested a nuclear unrelated transcript FAM83‐AS1 8. FAM83‐AS1 is expressed in both proliferating and differentiating keratinocytes, and RIP experiment showed a negative result confirming that, unlike uc.291, FAM83‐AS1 does not interact with ACTL6A (Fig EV5A and B). The predicted uc.291 region interacting with ACTL6A (score = 0.59, prediction by Global Score 34) results in a highly structured region as shown by the CROSS algorithm modelling 35 (Fig 4E and F; Appendix Fig S2). Our results indicate that uc.291 interacts with ACTL6A to modulate chromatin remodelling.
Figure EV4. Uc.291 protein microarray.
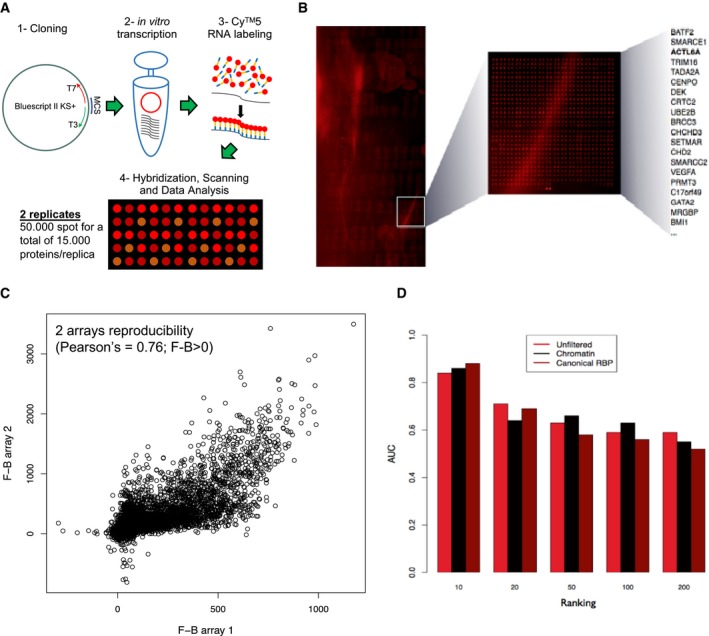
- Schematic depicting high‐throughput analysis performed to identify uc.291 protein interactome.
- Protein array analysis showing the top 20 chromatin‐related candidates; see also Appendix Table S2.
- Reproducibility between the two human recombinant protein arrays spotted with 50,000 different proteins. (Pearson's correlation = 0.76; F‐B > 0).
- Area under ROC curve (AUC) to assess Global Score 34 ability to separate proteins interacting with uc.291 from those that are non‐interacting. The F‐B score was employed to select different groups of high‐affinity (top ranked) and low‐affinity (bottom ranked) interactions reported in the array: (1) RBP, (2) chromatin‐related and (3) unfiltered (i.e. without selecting by category). In all cases, Global Score performances increase from poor signal (top/bottom 200) to strong signal (top/bottom 10) interactions, showing AUCs that raise from 0.60 to 0.80.
Figure 4. Uc.291 interacts with ACTL6A.
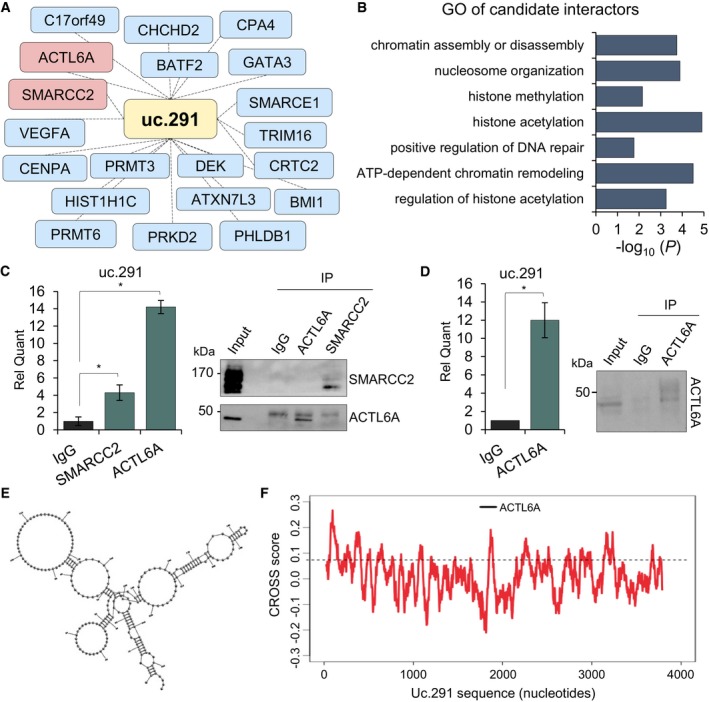
- Network of putative interactors, ranked as described in the text, and relative GO analysis. Interactors expressed in the epidermis are shown; see also Appendix Table S1.
- GO analysis of the predicted interactors.
- RT–qPCR showing the validation of uc.291‐ACTL6A interaction by RNA cross‐linking immunoprecipitation (CLIP) in HEK293E cells, as fold enrichment over IgG. SMARCC2 was also included. Data shown are mean ± s.d.; n = 3 (technical); *P < 0.05, Student's t‐test. On the right, control WB for immunoprecipitation of both antibodies.
- RT–qPCR showing the validation of uc.291‐ACTL6A interaction by RNA immunoprecipitation (RIP) in differentiated HEKn as fold enrichment over IgG. Data shown are mean ± s.d.; n = 3 technical, on 1 human donor; *P < 0.05, Student's t‐test. On the right, control WB for immunoprecipitation.
- Secondary structure of uc.291 predicted binding region (nt 1,700–2,000) using the CROSS Global Score as a soft constraint inside RNA structure 43.
- Uc.291 predicted binding region to interact with ACTL6A (nucleotide 1,763–1,912) by Global Score (score of 0.59). Dotted line defines the CROSS score threshold 43.
Source data are available online for this figure.
Figure EV5. Negative controls for RIP, CLIP and ChIP .
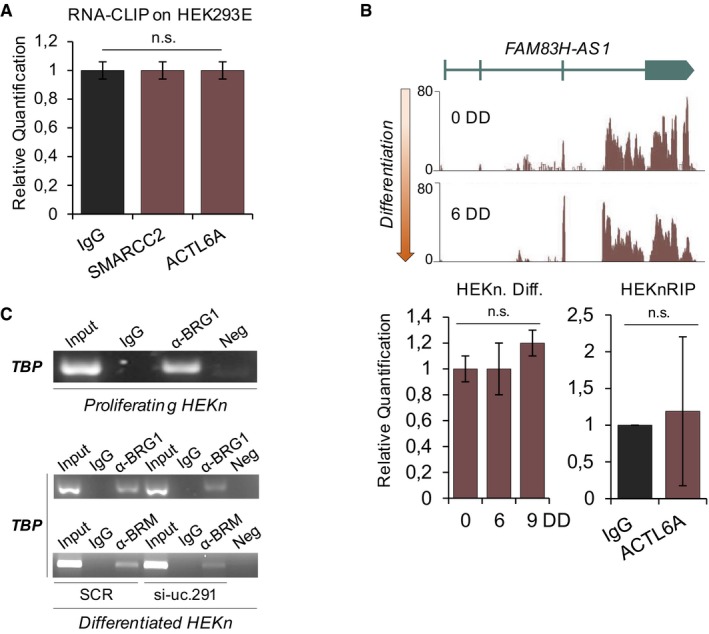
- RT–qPCR amplifying the lncRNA FAM83H‐AS1 used as negative control in the RNA‐CLIP experiment (Fig 4C). Note that FAM83H‐AS1 resulted expressed in HEK293E (C t mean in the input = 26.3, data not shown) but was undetectable in all the immunoprecipitated samples (IgG, SMARCC2, ACTL6A). The same samples of Fig 4C were used (n = 3 technical); n.s. = not significant, Student's t‐test; HEK293 = human embryonic kidney 293.
- FAM83H‐AS1 was used as negative control for the RIP performed in HEKn (Fig 4D). On top, RNA sequencing in HEKn (from Ref. 8) showing FAM83H‐AS1 expression is unchanged during keratinocyte differentiation. On bottom, RT–qPCR confirming FAM83H‐AS1 is not modulated during the in vitro differentiation process (left histogram; same samples of Fig 1B (n = 4 different human donors) were used) and it does not interact with ACTL6A (right histogram; same samples of Fig 4D (n = 3 replicates on 1 human donor) were used); n.s. = not significant, Student's t‐test; DD = days of differentiation.
- On the top, end‐point PCR of TATA‐box‐binding protein (TBP) promoter after BRG1 chromatin IP in proliferating HEKn. On the bottom, end‐point PCR of TBP promoter after BRG1 (upper agarose gel) and BRM (lower agarose gel) ChIP in differentiated HEKn silenced for uc.291. The same samples of Fig 5 were used.
Silencing of uc.291 affects the chromatin status of Loricrin, Filaggrin and LCE1B promoters
To demonstrate that uc.291 and ACTL6A interaction has a functional role in controlling the expression of differentiation genes, we performed a chromatin immunoprecipitation (ChIP) assay on selected differentiation gene promoters (LOR, FLG and LCE1B) that were down‐regulated upon uc.291 silencing (Figs 2 and 3), to examine ACTL6A and BRM/BRG1 binding as a function of uc.291. We confirmed that in proliferating conditions, ACTL6A binds LOR, FLG and LCE1B promoters to block the binding of BRM/BRG1, which are the BAF catalytic subunits 8 (Fig 5A). This is in line with previous results showing that BRM/BRG1 (BAF complex) are required to bind and activate differentiation gene promoters. This binding is repressed by ACTL6A in progenitors and proliferating keratinocytes 8, 9. Instead, differentiated keratinocytes displayed enhanced binding of BRM/BRG1 at the promoter of the selected genes, whereas ACTL6A did not bind them (Fig 5B, SCR). BRM/BRG1 binding paralleled the H3K27ac histone modification and LOR, FLG and LCE1B expression at the mRNA levels (Fig 5C and D). Interestingly, the depletion of uc.291 in differentiating conditions resulted in enhanced ACTL6A binding and reduced BRM/BRG1 binding (Fig 5B, si‐uc.291). Consequently, we detected a decrease of histone modification in H3K27ac (Fig 5D) and the decreased expression of LOR, FLG and LCE1B at the mRNA levels and LOR at the protein level (Fig 5C and E). Controls for an uc.291‐unrelated gene (TATA‐box‐binding protein, TBP) are shown in Fig EV5C. The role of ACTL6A in repressing differentiation gene expression is confirmed in Fig 5C and D, in which the depletion of ACTL6A resulted in increased LOR, FLG and LCE1B at the mRNA levels and LOR at the protein level. To note that uc.291 silencing does not affect ACTL6A expression and that ACTL6A and uc.291 are partially co‐expressed as indicated in in vivo calcium‐induced differentiation and in organotypic human epidermis (Appendix Fig S3A and B). Altogether, these results indicate that uc.291, by interfering with ACTL6A, participates in the release of ACTL6A inhibitory effects on the BAF complex, thus allowing it to bind to and activate differentiated genes. To further confirm our findings, we compared transcript profiling between ACTL6A‐ and si‐uc.291‐deficient keratinocytes (Fig 6A). We found that transcript profiling of ACTL6A‐deficient keratinocytes 8 showed an overlap with uc.291 regulated genes (39 genes). In particular, we found that the genes repressed by ACTL6A in proliferating keratinocytes are also down‐regulated by si‐uc.291 in differentiating conditions, further supporting the observation that the interaction between uc.291 and ACTL6A is required to allow the expression of epidermal differentiation genes.
Figure 5. Uc.291‐ACTL6A interaction modifies chromatin status at LOR, FLG and LCE1B promoters.
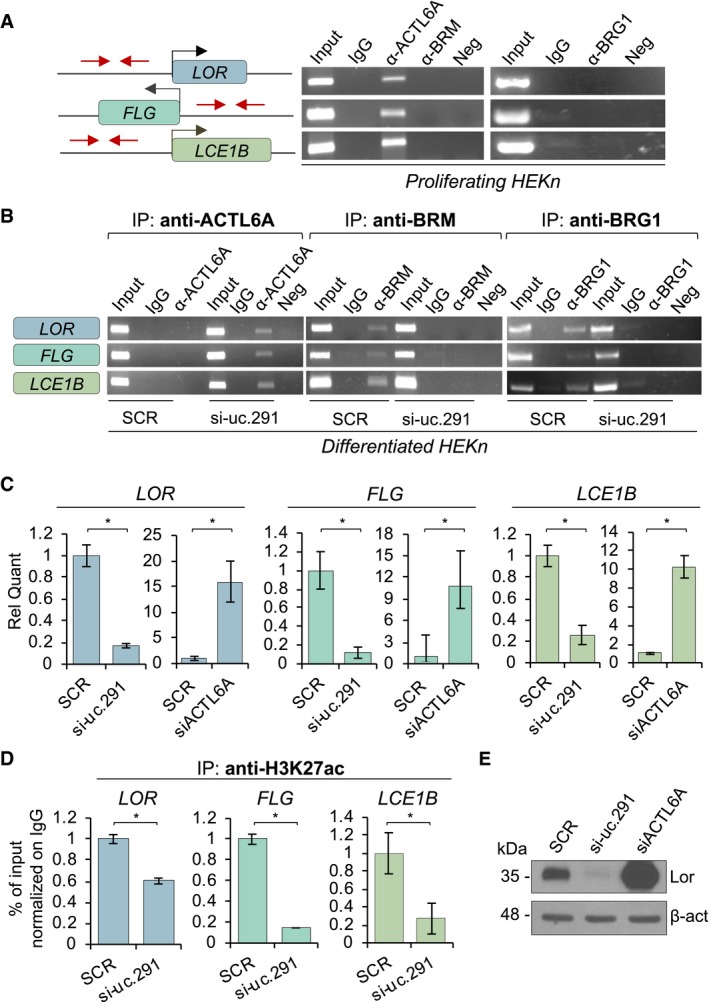
- Agarose gel electrophoresis of LOR, FLG and LCE1B promoter fragments amplified by end‐point PCR after ACTL6A and BRM (left), or BRG1 (right) chromatin IP in proliferating keratinocytes.
- Agarose gel electrophoresis of the same PCR products described in (A) after ACTL6A (left), BRM (middle) and BRG1 (right) chromatin IP in uc.291 silenced and differentiated HEKn cells. One representative experiment of three is shown.
- Relative quantification by RT–qPCR of LOR, FLG and LCE1B mRNA in uc.291 and ACTL6A silenced and differentiated HEKn cells. Data shown are mean ± s.d.; n = 3 (technical); *P < 0.05, Student's t‐test.
- Quantification by real‐time PCR of LOR, FLG and LCE1B promoter fragments after H3K27ac chromatin IP in the same samples described in (B). Data shown are mean ± s.d.; n = 3 (technical); *P < 0.05, Student's t‐test.
- WB analysis of Loricrin expression in uc.291 and ACTL6A silenced and differentiated HEKn cells. β‐actin was used as loading control. One representative experiment of three is shown.
Source data are available online for this figure.
Figure 6. Uc.291 and ACTL6A regulate common genes.
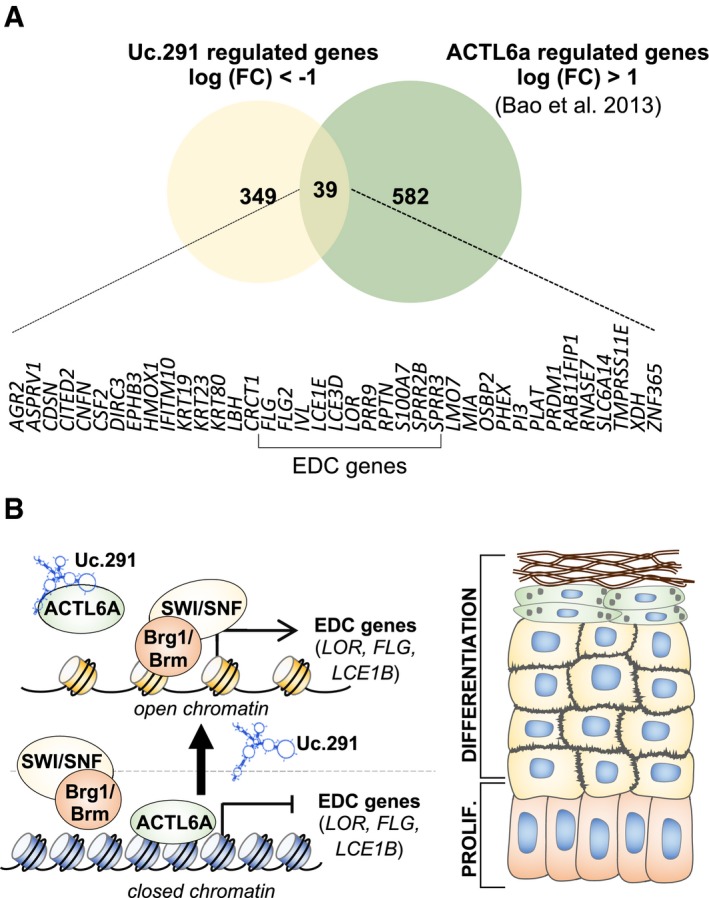
- Venn diagram showing the uc.291 up‐regulated genes in si‐uc.291 keratinocytes in common with the si‐ACTL6A down‐regulated genes. The 39 common genes are listed below, and the EDC genes are indicated. The expression of the genes is inversely correlated. The inverse correlation amongst them functionally supports the negative regulation of uc.291 in controlling ACTL6A functions.
- Schematic model of uc.291 role in regulating epidermal differentiation.
Discussion
Many studies have indicated a critical role of chromatin regulators in controlling somatic stem cell fate and epithelial differentiation 2, 3, 4, 5, 6, 8. Amongst them, the BAF (SWI/SNF, switch/sucrose non‐fermenting) complex has been shown to have a crucial role for proper execution of the epidermal differentiation programme, in which it regulates the transition from the epidermal progenitor state (proliferating basal layer keratinocytes) to the epidermal differentiated state (spinous, granular and cornified layers keratinocytes) 9, 11. Recently, ACTL6A, which is a part of several epigenetic regulator complexes 36, has been shown to play a crucial role in modulating the BAF complex to block keratinocyte differentiation 8. ACTL6A prevents the BAF complex from binding to promoters of differentiation genes 37. Indeed, in vivo ablation of ACTL6A resulted in decreased proliferation, accelerated differentiation and skin hypoplasia, whereas over‐expression resulted in the expansion of the proliferation compartment. ACTL6A is also amplified and highly expressed together with ΔNp63; it is physically associated with ΔNp63 in squamous cell carcinomas of the head and neck 38, 39, 40, 41, 42. This opens up an unexplored possibility that uc.291 could also play a role in head and neck squamous cell carcinomas. Many aspects regarding ACTL6A‐BAF complex regulation remain unknown, including the mechanistic action that the actin‐like proteins employed on the BAF complexes and how ACTL6A inhibits/interferes with DNA targeting of the BAF complex in proliferating/progenitor cells; our data provide some interesting light. Here, we identified a novel mechanism involving a long non‐coding RNA that contains an ultraconserved element, named uc.291. Uc.291 participates in the establishment of cell‐specific epigenetic changes. Its expression increases during differentiation; by physically interacting with ACTL6A, it releases the ACTL6A‐mediated repression of differentiation genes (Fig 6B). Following uc.291‐ACTL6A interaction, the BRM/BRG1 subunit (BAF complex) is able to interact with differentiation promoters and releases chromatin to allow the transcription of EDC genes (Fig 6B). Interestingly, in addition to ACTL6A, amongst the putative uc.291 interactors, we identified other chromatin‐related subunits belonging to the BAF (SWI/SNF) complex, such as SMARCE1 (chromatin remodelling complex BRG1‐associated factor 57), SMARCC2 (BAF170 or mammalian chromatin remodelling complex BRG1‐associated factor 170) and SMARCD3 (BAF60C or SWI/SNF‐related matrix‐associated actin‐dependent regulator of chromatin subfamily D member 3). Beside ACTL6A, we validated uc.291‐SMARCC2 interaction by CLIP, yet we do not have evidences that this is a direct interaction. These findings further support that amongst the chromatin‐associated epigenetic modulators, uc.291 is strongly associated with ATP‐dependent nucleosome remodelling complexes. However, other chromatin modulators, i.e. BMI1 (component of the polycomb group complex 1) and SIRT1 (NAD‐dependent protein deacetylase), are also putative interactors. The protein microarray also shows that transcription factors and transcription co‐activators including BATF2, GATA2, GATA3 and CRTC2 interact with uc.291 with a high score (Appendix Table S2). Altogether, these results suggest that uc.291 may be involved in gene expression regulation with additional mechanisms, yet to be identified. An intriguing issue is the function of the ultraconserved sequence contained in uc.291 (nt 717–1,140). We modelled the secondary structure of this region using CROSS 35 and found that is highly structured. Amongst the 40 interactors identified, none have been predicted to interact with this region, opening new interesting scenarios leading to the investigation of other possible functions.
Altogether, our results describe a human terminal differentiation‐associated lncRNA that interacts with an ATP‐dependent nucleosome remodelling complex subunit to exert a non‐redundant role in controlling somatic differentiation and tissue homeostasis. Our study expands the understanding of the complexity of the epigenetic regulation that occurs during epithelial differentiation, necessary to balance progenitor compartment and terminally differentiated cells.
Materials and Methods
Cell culture and transfection
Human epidermal keratinocytes, neonatal (HEKn) (Cascade, Invitrogen) were grown in EpiLife medium supplemented with HKGS (Invitrogen). Differentiation was induced by 1.2 mM CaCl2 addiction to culture medium. HEKn were transfected using two different si‐uc.291 sequences. HEKn were transfected using two different si‐uc.291 sequences HP Custom siRNA (Qiagen) or a negative control siRNA (Qiagen) by Lipofectamine RNAiMAX reagent (Invitrogen) according to the manufacturer's protocols. Forty‐eight hours after transfection, in vitro differentiation was induced. Specific uc.291 siRNA sequences are as follows: si‐uc.291 (i) 5′‐GUAUUGAUUAAACUUUUAAAUTT‐3′ and si‐uc.291 (ii) 5′‐ACAGG CUGAGAACAGAUTT‐3′. HEK293E cells were grown in Dulbecco's modified Eagle's medium (Thermo Fisher) supplemented with 10% (vol/vol) foetal bovine serum (Thermo Fisher) and 1% penicillin/streptomycin (Thermo Fisher). HEK293E cells were transfected to express full‐length TUC‐291 lncRNA using Effectene Reagent (Qiagen) according to the manufacturer protocol. FaDu and A253 cells were grown, respectively, in Eagle's minimum essential medium and McCoy's 5A medium supplemented with 10% (vol/vol) foetal bovine serum and 1% penicillin/streptomycin. FaDu and A253 were transfected using two different si‐uc.291 sequences HP Custom siRNA (Qiagen) or a negative control siRNA (Qiagen) by Lipofectamine RNAiMAX reagent (Invitrogen) according to the manufacturer's protocols.
Cell fractionation and RNA extraction
Cells were resuspended in 1 ml of RSB (10 mM Tris, pH 7.4, 10 mM NaCl, 3 mM MgCl2), incubated for 3 min on ice and centrifuged at 4°C. Cell pellet was resuspended in four volumes of lysis buffer RSBG40 (10 mM Tris, pH 7.4, 10 mM NaCl, 3 mM MgCl2, 10% glycerol, 0.5% Nonidet P‐40, 0.5 mM DTT and 100 U/ml rRNasin Promega, WI). Nuclei were pelleted by centrifugation at 4,600 g for 3 min, and the supernatant was saved as the cytoplasmic fraction. Nuclear pellets were resuspended in RSBG40, and one‐tenth volume of detergent buffer was added (3.3% wt/wt sodium deoxycholate and 6.6% vol/vol Tween 40). Nuclei were incubated 5 min on ice and pelleted. Supernatant was saved and added to cytoplasmic fraction. Nuclei were collected by centrifugation at 9,400 g for 5 min, and the resulting pellet was used for nuclear RNA extraction. RNA was extracted using TRIzol method, according to the manufacturer's instructions (Invitrogen, CA). Cell lysis and nuclear integrity were monitored during the procedure by light microscopy following trypan blue staining.
Gene array
Total RNA was extracted with mirVana miRNA isolation kit (Ambion, AM1561). RNA quality was monitored by Agilent 2100 Bioanalyzer (Agilent Technologies, Santa Clara, CA). Cyanine‐3 (Cy3)‐labelled cRNA was prepared from 100 ng RNA using the Low Input Quick Amp Labeling Kit one‐colour (Agilent) according to the manufacturer's instructions and purified by RNeasy column (QIAGEN, Valencia, CA). Dye incorporation and cRNA yield were checked with the NanoDrop ND‐1000 Spectrophotometer. 600 ng of Cy3‐labelled cRNA (specific activity > 6.0 pmol Cy3/μg cRNA) was fragmented at 60°C for 30 min following the manufacturer's instructions and then hybridized to Agilent SurePrint G3 Human 8 × 60k Microarrays (G4858A) for 17 h at 65°C. Slides were washed and dried. Slides were scanned by Agilent DNA Microarray Scanner (G2505B) using one‐colour scan setting (scan area 61 × 21.6 mm, scan resolution 10 μm, dye channel is set to green and green PMT is set to 100%). The scanned images were analysed with Feature Extraction Software 10.3.7.1 (Agilent) using default parameters (protocol GE1_107_Sep09 and Grid: 039494_D_F_20150612) to obtain background subtracted and spatially detrended Processed Signal intensities. Features flagged in Feature Extraction as feature non‐uniform outliers were excluded. Microarray data have been deposited in the NCBI's Gene Expression Omnibus [GEO: GSE103890].
cDNA walking
Two μg of total RNA from differentiated HEKn was retrotranscribed as described before to obtain cDNA. PCR was performed using Phusion High‐Fidelity DNA Polymerase (Thermo Scientific) according to the manufacturer's protocol, and the PCR fragments of interest were completely sequenced. The primers used are listed in Appendix Table S3.
Organotypic epidermis culture
After 48‐h transfection, 3 × 10⁵ HEKn cells were resuspended in CnT‐PR medium (CELLnTEC) and seeded onto Millicell PCF 12 mm inserts with 0.4 μm pore size (PIHP01250; Millipore). Twenty‐four hours later, medium was replaced inside and outside the insert with CnT‐PR‐3D medium (CELLnTEC). Twenty‐four hours later, air‐lifting was induced by removing the medium inside. Outside, medium was changed every 3 days during the following of 20 days of culture. Inserts were fixed in 10% buffered formalin solution, processed and paraffin‐embedded.
In situ hybridization
Human tissues were embedded in frozen specimen medium Killik (Bio‐Optica) after an overnight incubation in 4% paraformaldehyde followed by an overnight incubation in 0.5 M sucrose. 14‐μm‐thin sections were cut and mounted on Superfrost glass slides. Slides were then fixed for 10 min in 4% paraformaldehyde and acetylated for 10 min in triethanolamine/acetic anhydride. Slides were then hybridized in incubation chambers overnight at 46°C using 30 nM detection digoxigenin probes (miRCURY LNA; Exiqon). After hybridization, slides were washed (20 min in 5 × SSC, two times for 30 min in Tween 20/SSC at 50°C, and twice for 15 min in 0.2 × SSC and 15 min in PBS at room temperature (RT)). After 1‐h incubation in blocking solution at RT, slides were hybridized for 2 h in alkaline phosphatase‐conjugated antidigoxigenin Fab fragment (1:200 dilution; Roche, 11093274910) at RT. After two washes of 20 min, detection was performed by incubating 250 μl nitroblue tetrazolium/BCIP (1‐STEP; Thermo Fisher Scientific) together with 2 mM levamisole on the slides for 16 h in the dark at RT.
RNA FISH
Custom Stellaris® FISH Probes were designed against Uc. 291 sequence by utilizing the Stellaris® RNA FISH Probe Designer (Biosearch Technologies, Inc., Petaluma, CA) available online at http://www.biosearchtech.com/stellarisdesigner. The fixed HEKn cells were hybridized with the Uc.291 Stellaris RNA FISH Probe set labelled with Quasar 570 dye (Biosearch Technologies, Inc.), following the manufacturer's instructions available online at http://www.biosearchtech.com/stellarisprotocols.
Immunofluorescence
Slides were incubated at 60°C for 1 h and dewaxed by Bio‐Clear washing (Bio‐Optica) and sections rehydrated by 100, 90, 80, 70 and 50% ethanol incubations. Antigen retrieval was performed by boiling in 0.01 M Sodium Citrate Buffer pH 6.0. IF staining was as follows: permeabilization by Triton X‐100 0.2% PBS incubation; 1‐h blocking in 5% goat serum (Gibco) in PBS at RT; 3‐h primary antibody incubation at RT; and 1‐h secondary antibody and DAPI (4′,6‐diamidino‐2‐phenylindole) incubation at RT. IF images were acquired by Nikon A1 confocal laser microscope. The following antibodies were used: anti‐K14 (Abcam, ab7800); anti‐K14 (BioLegend, PRB‐155P); anti‐FLG (Santa Cruz, SC66192); anti‐LOR (BioLegend, PRB‐145P); anti‐Ki67 (Cell Signaling, D3B5, 9129S); anti‐p63 (Abcam, ab735); Alexa Fluor goat anti‐rabbit 568 (Life Technologies, A11011); goat anti‐rabbit 488 (Life Technologies, A11034); goat anti‐mouse 568 (Life Technologies, A11019); and goat anti‐mouse 488 (Life Technologies, A11017).
Haematoxylin/eosin staining
Sections were dewaxed and rehydrated as described before, then incubated 5 min in Mayer's haematoxylin (Bio‐Optica) solution, extensively washed in distilled water, incubated 5 min in Eosin Y alcoholic solution (Bio‐Optica), extensively washed in distilled water and finally dehydrated by 70, 90, 100% ethanol solution incubation. Slides were mounted using Bio Mount HM (Bio‐Optica).
Protein microarray
Uc.291 (3,816 nucleotide sequence) sequence was cloned in pBSII‐SK containing T7 promoter using the following primers: 5′‐GGCCGCGGCCGCCCTGGGC ACTTAGCTCTCCAC‐3′ and 5′‐GGCCCTCGAGCTTTACGTTTTAGGGTACACGTG‐3′. The plasmid was linearized and purified with the MinElute PCR Purification Kit (Beckman Coulter) following the manufacturer's instructions. In vitro transcription was performed with the T7 Megascript T7, High Yield Transcription Kit (Thermo Scientific) according to the standard procedure with the addition of 1% DMSO and 1% RiboLock, overnight at 37°C. The synthetized RNA was treated with TURBO DNAse 2 U/μl (Invitrogen) at 37°C for 15 min, purified using magnetic beads (Agencourt RNAClean XP) and eluted in nuclease‐free water. The integrity and specificity of the RNA were checked by RNA denaturing agarose gel and Bioanalyzer quality control. Uc.291 was labelled with Cy5 Label IT uArray Labeling Kit (Mirus). Briefly, 5 μg of RNA was mixed with 1:5 Label IT Cy5 reagent and incubated at 37°C for 70 min. The labelled RNA was purified by magnetic beads (Agencourt RNAClean XP). RNA concentration and labelling density were measured using a NanoDrop 1000 Spectrophotometer (Thermo Scientific) and calculated as follows:
Base:dye = (Abase*ε dye)/(Adye*ε base)
Abase = A260‐(Adye*CF260)
Constants: ε dye = 250,000; CF260 = 0.05; ε base = 8,250.
Only reactions with a labelling density of 1 Cy5 dye/700–900nt were used in the following experiments. Labelled RNA integrity was verified with the Agilent 2100 Bioanalyzer. Fifty pmol of labelled RNA was hybridized in the protein arrays HuProt v.2 Human Proteome Arrays (Cambridge Arrays, LTD). Two technical replicates were performed. The arrays were dried and immediately scanned at 635 nm in Microarray Scanner G2505B (Agilent). GenePix Pro 6.1 software (Molecular Devices) was used to determine the signal at 635 nm of each spotted protein location and therefore quantify the RNA‐protein interaction. Specifically, the local background intensity (B635) was subtracted from the intensity (F635) at each of the duplicate spots for a given protein, to quantify. Data were filtered based on signal to background ratio for each of the duplicate feature to be greater than 2.5‐fold and Z‐Score ≥ 3 from the global mean signal from all the spotted proteins. Finally, the intersection of technical replicates was considered as the final value for quantification.
Chromatin immunoprecipitation
ChIP was performed using MAGnify Chromatin Immunoprecipitation System (Invitrogen) following the manufacturer's protocol. Chromatin was sonicated at 25% amplitude for 15 min (20″ sonication/30″ pause) using SONOPULS UW3100 (BANDELIN electronics). End‐point PCRs were performed using GoTaq G2 Flexi DNA Polymerase (Promega) according to the manufacturer's protocol. Real‐time PCR (Fig 5C) was performed using GoTaq qPCR Master Mix (Promega); the primers used are listed in Appendix Table S5. The antibodies used were as follows: anti‐ACTL6A (Cell Signaling, 76682S); anti‐SMARCC2 (Cell Signaling, D809V, 12760S); and anti‐H3K27ac (Diagenode, C15410174).
RNA immunoprecipitation
RIP was performed using Magna RIP RNA‐Binding Protein Immunoprecipitation Kit (Millipore) according to the manufacturer's protocol. RNA (80 ng) was retrotranscribed using SuperScript VILO cDNA Synthesis Kit (Applied Biosystems) following the manufacturer's protocol. RT–qPCR was performed as described before. The antibodies used were as follows: anti‐ACTL6A (Cell Signaling, 76682S) and anti‐SMARC2 (Cell Signaling, D809V, 12760S). RNA/ChIP was performed using RNA ChIP‐IT Kit (Active Motif) according to the manufacturer's protocol. RNA was retrotranscribed using GoScript Reverse Transcription System (Promega) according to the manufacturer's protocols. RT–qPCR was performed as described before. The antibodies used were as follows: anti‐ACTL6A (Cell Signaling, 76682S) and anti‐SMARCC2 (Cell Signaling, D809V, 12760S).
RNA extraction and RT–qPCR analysis
Total RNA was isolated from HEKn by RNeasy Mini Kit (QIAGEN) and retrotranscribed by GoScript Reverse Transcription System (Promega) according to the manufacturer's protocols. RT–qPCR was performed using GoTaq qPCR Master Mix (Promega). The primers used are listed in Appendix Table S4. The expression of each gene was defined from the threshold cycle (C t), and the relative expression levels were calculated by using the 2−ΔΔCt method after normalization with reference to expression of housekeeping gene.
Strand‐specific retrotranscription was performed using GoScript Reverse Transcription System (Promega). Two reverse transcription reaction mix were made for strand‐specific cDNA synthesis: one to detect uc.291 sense‐oriented transcript (using the following reverse primer, 5′‐AGTTGTTCCTAGTAAACCATTTTAC‐3′ and a reverse primer for ACTB, 5′‐AATGTCACGCACGATTTCCCG‐3′) and one to detect uc.291 antisense‐oriented transcript (using the following forward primer, 5′‐GGATGA AAAGATGGTGGACAAAC‐3′ and the same reverse primer for ACTB). qPCR was carried on by TaqMan probe using the following primers/probe: uc.291FW 5′‐TTTGTGAGCCCCGCATTC‐3′; uc.291 REV 5′‐AATGACACGTCAGCCGTCTTT‐3′; and uc.291 probe, 5′‐ACTTTCCTTTGAGGTTGGT‐3′.
Western blot
Total cell extracts were resolved on a SDS–polyacrylamide gel and blotted on Amersham Hybond P0.45 PVDF membrane (GE Healthcare Life Science). Membranes were blocked by non‐fat dry milk Blotting‐Grade Blocker (Bio‐Rad) 5% in PBS 0.1% Tween‐20 (Sigma‐Aldrich), incubated with primary antibodies overnight at 4°C, washed and hybridized for 1 h at RT using the appropriate secondary antibody. The following antibodies were used: anti‐p27 (BD Biosciences, 610241); anti‐p63 (Abcam, ab735); anti‐p63α (Cell Signaling, CS13109); anti‐KLF4 (R&D System, 12173S); anti‐K10 (BioLegend, PRB‐159P); anti‐LOR (BioLegend, PRB‐145P); anti‐β‐actin AC‐15 (Sigma, A5441); goat anti‐mouse HRP Conjugate (Bio‐Rad, 170‐5047); goat anti‐rabbit HRP Conjugate (Bio‐Rad, 170‐6517); and bovine anti‐goat HRP conjugate (Santa Cruz Biotechnology, SC‐2350).
Bioinformatics and statistics
The biological process categories were obtained by using Gene Ontology Consortium tools (http://www.geneontology.org/). Experimental result significance was evaluated by Student's t‐test as expression of P‐value (*P < 0.05; **P < 0.01).
Author contributions
EP, AML, MM, AS, AMar, XZ and TBO performed the research (AML and MM: T‐UC array, validation, studies on si‐uc.291; AMar: uc.291 transcript characterization; EP and AS: si‐uc.291 in differentiation, organotypic epidermis, si‐uc.291 array, validation; XZ: in situ hybridization; TBO and RDP: protein array; and EP: ChIP and RNAIP); EC designed the research; EC, GM, GAC, RDP, AMau and GGT analysed the data; EC wrote the paper; and all the authors read the paper and made comments.
Conflict of interest
Chanel Parfumeur was partially involved in preliminary experiments. However, the data included in this article are unrelated to Chanel Parfumeur.
Supporting information
Appendix
Expanded View Figures PDF
Dataset EV1
Source Data for Appendix
Review Process File
Source Data for Figure 2
Source Data for Figure 4
Source Data for Figure 5
Acknowledgements
The authors thank Dr. Ivano Amelio for gene microarray analysis, Maria Aguilar from the Genomics Facility at the Centre for Genomic Regulation for the scanning arrays, Milena Nicoloso and Simona Rossi for the TUCR array and Simone Bischetti for 3D‐skin histology. This work has been mainly supported by Italian Ministry of Health and IDI‐IRCCS (RC to EC) and by AIRC IG grant 22206 to EC. This work has also been partially supported by the European Research Council (RIBOMYLOME_309545), the Spanish Ministry of Economy and Competitiveness (BFU2014‐55054‐P) and “Fundació La Marató de TV3” (PI043296).
EMBO Reports (2020) 21: e46734
Contributor Information
Gerry Melino, Email: melino@uniroma2.it.
Eleonora Candi, Email: candi@uniroma2.it.
Data availability
The data reported in this paper have been deposited in GEO: GSE103890 (http://www.ncbi.nlm.nih.gov/geo/query/acc.cgi?acc=GSE103890).
References
- 1. Sen GL, Reuter JA, Webster DE, Zhu L, Khavari PA (2010) DNMT1 maintains progenitor function in self‐renewing somatic tissue. Nature 463: 563–567 [DOI] [PMC free article] [PubMed] [Google Scholar]
- 2. LeBoeuf M, Terrell A, Trivedi S, Sinha S, Epstein JA, Olson EN, Morrisey EE, Millar SE (2010) Hdac1 and Hdac2 act redundantly to control p63 and p53 functions in epidermal progenitor cells. Dev Cell 19: 807–818 [DOI] [PMC free article] [PubMed] [Google Scholar]
- 3. Dauber KL, Perdigoto CN, Valdes VJ, Santoriello FJ, Cohen I, Ezhkova E (2016) Dissecting the roles of polycomb repressive complex 2 subunits in the control of skin development. J Invest Dermatol 136: 1647–1655 [DOI] [PMC free article] [PubMed] [Google Scholar]
- 4. Eckert RL, Adhikary G, Rorke EA, Chew YC, Balasubramanian S (2011) Polycomb group proteins are key regulators of keratinocyte function. J Invest Dermatol 131: 295–301 [DOI] [PMC free article] [PubMed] [Google Scholar]
- 5. Botchkarev VA, Mardaryev AN (2016) Repressing the keratinocyte genome: how the polycomb complex subunits operate in concert to control skin and hair follicle development. J Invest Dermatol 136: 1538–1540 [DOI] [PMC free article] [PubMed] [Google Scholar]
- 6. Mardaryev AN, Gdula MR, Yarker JL, Emelianov VU, Poterlowicz K, Sharov AA, Sharova TY, Scarpa JA, Joffe B, Solovei I et al (2014) p63 and Brg1 control developmentally regulated higher‐order chromatin remodelling at the epidermal differentiation complex locus in epidermal progenitor cells. Development 141: 101–111 [DOI] [PMC free article] [PubMed] [Google Scholar]
- 7. Sen GL, Webster DE, Barragan DI, Chang HY, Khavari PA (2008) Control of differentiation in a self‐renewing mammalian tissue by the histone demethylase JMJD3. Genes Dev 22: 1865–1870 [DOI] [PMC free article] [PubMed] [Google Scholar]
- 8. Bao X, Tang J, Lopez‐Pajares V, Tao S, Qu K, Crabtree GR, Khavari PA (2013) ACTL6a enforces the epidermal progenitor state by suppressing SWI/SNF‐dependent induction of KLF4. Cell Stem Cell 12: 193–203 [DOI] [PMC free article] [PubMed] [Google Scholar]
- 9. Indra AK, Dupe V, Bornert J‐M, Messaddeq N, Yaniv M, Mark M, Chambon P, Metzger D (2005) Temporally controlled targeted somatic mutagenesis in embryonic surface ectoderm and fetal epidermal keratinocytes unveils two distinct developmental functions of BRG1 in limb morphogenesis and skin barrier formation. Development 132: 4533–4544 [DOI] [PubMed] [Google Scholar]
- 10. Fessing MY, Mardaryev AN, Gdula MR, Sharov AA, Sharova TY, Rapisarda V, Gordon KB, Smorodchenko AD, Poterlowicz K, Ferone G et al (2011) P63 regulates Satb1 to control tissue‐specific chromatin remodeling during development of the epidermis. J Cell Biol 194: 825–839 [DOI] [PMC free article] [PubMed] [Google Scholar]
- 11. Avgustinova A, Benitah SA (2016) Epigenetic control of adult stem cell function. Nat Rev Mol Cell Biol 17: 643–658 [DOI] [PubMed] [Google Scholar]
- 12. Adam RC, Fuchs E (2016) The Yin and Yang of chromatin dynamics in stem cell fate selection. Trends Genet 32: 89–100 [DOI] [PMC free article] [PubMed] [Google Scholar]
- 13. Frye M, Benitah SA (2012) Chromatin regulators in mammalian epidermis. Semin Cell Dev Biol 23: 897–905 [DOI] [PubMed] [Google Scholar]
- 14. Perdigoto CN, Valdes VJ, Bardot ES, Ezhkova E (2014) Epigenetic regulation of epidermal differentiation. Cold Spring Harb Perspect Med 4: a015263 [DOI] [PMC free article] [PubMed] [Google Scholar]
- 15. Bao X, Rubin AJ, Qu K, Zhang J, Giresi PG, Chang HY, Khavari PA (2015) A novel ATAC‐seq approach reveals lineage‐specific reinforcement of the open chromatin landscape via cooperation between BAF and p63. Genome Biol 16: 284 [DOI] [PMC free article] [PubMed] [Google Scholar]
- 16. Flynn RA, Chang HY (2014) Long noncoding RNAs in cell‐fate programming and reprogramming. Cell Stem Cell 14: 752–761 [DOI] [PMC free article] [PubMed] [Google Scholar]
- 17. Moran VA, Perera RJ, Khalil AM (2012) Emerging functional and mechanistic paradigms of mammalian long non‐coding RNAs. Nucleic Acids Res 40: 6391–6400 [DOI] [PMC free article] [PubMed] [Google Scholar]
- 18. Kretz M, Webster DE, Flockhart RJ, Lee CS, Zehnder A, Lopez‐Pajares V, Qu K, Zheng GXY, Chow J, Kim GE et al (2012) Suppression of progenitor differentiation requires the long noncoding RNA ANCR. Genes Dev 26: 338–343 [DOI] [PMC free article] [PubMed] [Google Scholar]
- 19. Kretz M, Siprashvili Z, Chu C, Webster DE, Zehnder A, Qu K, Lee CS, Flockhart RJ, Groff AF, Chow J et al (2013) Control of somatic tissue differentiation by the long non‐coding RNA TINCR. Nature 493: 231–235 [DOI] [PMC free article] [PubMed] [Google Scholar]
- 20. Ziegler C, Graf J, Faderl S, Schedlbauer J, Strieder N, Förstl B, Spang R, Bruckmann A, Merkl R, Hombach SKM (2019) The long non‐coding RNA LINC00941 and SPRR5 are novel regulators of human epidermal homeostasis. EMBO Rep 20: e46612 [DOI] [PMC free article] [PubMed] [Google Scholar]
- 21. Bejerano G, Pheasant M, Makunin I, Stephen S, Kent WJ, Mattick JS, Haussler D (2004) Ultraconserved elements in the human genome. Science 304: 1321–1325 [DOI] [PubMed] [Google Scholar]
- 22. Scaruffi P (2011) The transcribed‐ultraconserved regions: a novel class of long noncoding RNAs involved in cancer susceptibility. Sci World J 11: 340–352 [DOI] [PMC free article] [PubMed] [Google Scholar]
- 23. Baira E, Greshock J, Coukos G, Zhang L (2008) Ultraconserved elements: genomics, function and disease. RNA Biol 5: 132–134 [DOI] [PubMed] [Google Scholar]
- 24. Wojcik SE, Rossi S, Shimizu M, Nicoloso MS, Cimmino A, Alder H, Herlea V, Rassenti LZ, Rai KR, Kipps TJ et al (2010) Non‐codingRNA sequence variations in human chronic lymphocytic leukemia and colorectal cancer. Carcinogenesis 31: 208–215 [DOI] [PMC free article] [PubMed] [Google Scholar]
- 25. Calin GA, Liu CG, Ferracin M, Hyslop T, Spizzo R, Sevignani C, Fabbri M, Cimmino A, Lee EJ, Wojcik SE et al (2007) Ultraconserved regions encoding ncRNAs are altered in human leukemias and carcinomas. Cancer Cell 12: 215–229 [DOI] [PubMed] [Google Scholar]
- 26. Jiang J, Azevedo‐Pouly ACP, Redis RS, Lee EJ, Gusev Y, Allard D, Sutaria DS, Badawi M, Elgamal OA, Lerner MR et al (2016) Globally increased ultraconserved noncoding RNA expression in pancreatic adenocarcinoma. Oncotarget 7: 53165–53177 [DOI] [PMC free article] [PubMed] [Google Scholar]
- 27. Ferdin J, Nishida N, Wu X, Nicoloso MS, Shah MY, Devlin C, Ling H, Shimizu M, Kumar K, Cortez MA et al (2013) HINCUTs in cancer: hypoxia‐induced noncoding ultraconserved transcripts. Cell Death Differ 20: 1675–1687 [DOI] [PMC free article] [PubMed] [Google Scholar]
- 28. Marini A, Lena AM, Panatta E, Ivan C, Han L, Liang H, Annicchiarico‐Petruzzelli M, Di Daniele N, Calin GA, Candi E et al (2014) Ultraconserved long non‐coding RNA uc.63 in breast cancer. Oncotarget 8: 35669–35680 [DOI] [PMC free article] [PubMed] [Google Scholar]
- 29. Braconi C, Valeri N, Kogure T, Gasparini P, Huang N, Nuovo GJ, Terracciano L, Croce CM, Patel T (2011) Expression and functional role of a transcribed noncoding RNA with an ultraconserved element in hepatocellular carcinoma. Proc Natl Acad Sci USA 108: 786–791 [DOI] [PMC free article] [PubMed] [Google Scholar]
- 30. Arnette C, Koetsier JL, Hoover P, Getsios S, Green KJ (2016) In vitro model of the epidermis: connecting protein function to 3D structure. Methods Enzymol 569: 287–308 [DOI] [PMC free article] [PubMed] [Google Scholar]
- 31. Mischke D, Korge BP, Marenholz I, Volz A, Ziegler A (1996) Genes encoding structural proteins of epidermal cornification and S100 calcium‐binding proteins form a gene complex (‘epidermal differentiation complex’) on human chromosome 1q21. J Invest Dermatol 106: 989–992 [DOI] [PubMed] [Google Scholar]
- 32. Marenholz I, Zirra M, Fischer DF, Backendorf C, Ziegler A, Mischke D (2001) Identification of human epidermal differentiation complex (EDC)‐encoded genes by subtractive hybridization of entire YACs to a gridded Keratinocyte cDNA library. Genome Res 11: 341–355 [DOI] [PMC free article] [PubMed] [Google Scholar]
- 33. Kypriotou M, Huber M, Hohl D (2012) The human epidermal differentiation complex: cornified envelope precursors, S100 proteins and the ‘fused genes’ family. Exp Dermatol 21: 643–649 [DOI] [PubMed] [Google Scholar]
- 34. Cirillo D, Blanco M, Armaos A, Buness A, Avner P, Guttman M, Cerase A, Tartaglia GG (2016) Quantitative predictions of protein interactions with long noncoding RNAs: To the Editor. Nat Methods 14: 5–6 [DOI] [PubMed] [Google Scholar]
- 35. Delli Ponti R, Marti S, Armaos A, Tartaglia GG (2017) A high‐throughput approach to profile RNA structure. Nucleic Acids Res 45: e35 [DOI] [PMC free article] [PubMed] [Google Scholar]
- 36. Wu JI, Lessard J, Crabtree GR (2009) Understanding the words of chromatin regulation. Cell 136: 200–206 [DOI] [PMC free article] [PubMed] [Google Scholar]
- 37. Segre JA, Bauer C, Fuchs E (1999) Klf4 is a transcription factor required for establishing the barrier function of the skin. Nat Genet 22: 356–360 [DOI] [PubMed] [Google Scholar]
- 38. Saladi SV, Ross K, Karaayvaz M, Tata PR, Mou H, Rajagopal J, Ramaswamy S, Ellisen LW (2017) ACTL6A is co‐amplified with p63 in squamous cell carcinoma to drive YAP activation, regenerative proliferation, and poor prognosis. Cancer Cell 31: 35–49 [DOI] [PMC free article] [PubMed] [Google Scholar]
- 39. Candi E, Rufini A, Terrinoni A, Dinsdale D, Ranalli M, Paradisi A, De Laurenzi V, Spagnoli LG, Catani MV, Ramadan S et al (2006) Differential roles of p63 isoforms in epidermal development: selective genetic complementation in p63 null mice. Cell Death Differ 13: 1037–1047 [DOI] [PubMed] [Google Scholar]
- 40. Candi E, Dinsdale D, Rufini A, Salomoni P, Knight RA, Mueller M, Krammer PH, Melino G (2007) TAp63 and ΔNp63 in cancer and epidermal development. Cell Cycle 6: 274–284 [DOI] [PubMed] [Google Scholar]
- 41. Dötsch V, Bernassola F, Coutandin D, Candi E, Melino G (2010) P63 and P73, the ancestors of P53. Cold Spring Harb Perspect Biol 2: a004887 [DOI] [PMC free article] [PubMed] [Google Scholar]
- 42. Rivetti di Val Cervo P, Lena AM, Nicoloso M, Rossi S, Mancini M, Zhou H, Saintigny G, Dellambra E, Odorisio T, Mahe C et al (2012) p63‐microRNA feedback in keratinocyte senescence. Proc Natl Acad Sci USA 109: 1133–1138 [DOI] [PMC free article] [PubMed] [Google Scholar]
- 43. Reuter JS, Mathews DH (2010) RNAstructure: software for RNA secondary structure prediction and analysis. BMC Bioinformatics 11: 129 [DOI] [PMC free article] [PubMed] [Google Scholar]
Associated Data
This section collects any data citations, data availability statements, or supplementary materials included in this article.
Supplementary Materials
Appendix
Expanded View Figures PDF
Dataset EV1
Source Data for Appendix
Review Process File
Source Data for Figure 2
Source Data for Figure 4
Source Data for Figure 5
Data Availability Statement
The data reported in this paper have been deposited in GEO: GSE103890 (http://www.ncbi.nlm.nih.gov/geo/query/acc.cgi?acc=GSE103890).