

Summary
Tumor-associated macrophages (TAMs) are frequently the most abundant immune cells in cancers and are associated with poor survival. Here, we generated TAM molecular signatures from K14cre;Cdh1flox/flox;Trp53flox/flox (KEP) and MMTV-NeuT (NeuT) transgenic mice that resemble human invasive lobular carcinoma (ILC) and HER2+ tumors, respectively. Determination of TAM-specific signatures requires comparison with healthy mammary tissue macrophages to avoid overestimation of gene expression differences. TAMs from the two models feature a distinct transcriptomic profile, suggesting that the cancer subtype dictates their phenotype. The KEP-derived signature reliably correlates with poor overall survival in ILC but not in triple-negative breast cancer patients, indicating that translation of murine TAM signatures to patients is cancer subtype dependent. Collectively, we show that a transgenic mouse tumor model can yield a TAM signature relevant for human breast cancer outcome prognosis and provide a generalizable strategy for determining and applying immune cell signatures provided the murine model reflects the human disease.
Keywords: mouse model, human, co-expression network analysis, transcriptome, innate immunity, breast cancer, tumor-associated macrophage, clinical outcome prediction, invasive lobular carcinoma
Graphical Abstract
Highlights
-
•
Murine TAM signatures prognosticate outcomes in corresponding cancer patients
-
•
TAM signatures are robust when they are compared with healthy tissue macrophages
-
•
TAM transcriptome is dictated by tissue and tumor subtype-related signals
-
•
Murine TAM signatures can be translated only when a suitable model is chosen
Tuit et al. show that TAM transcriptomes in murine models of breast cancer are governed mainly by tissue and tumor subtype-specific signals. Clinical translation of murine signatures can be achieved when human and mouse breast tumor subtypes are matched and only upon proper comparison of TAMs with healthy tissue macrophages.
Introduction
The immune system plays an important role during tumor development, progression, and therapy response, and immune cells have evolved into attractive targets of therapeutic manipulation (Chen and Mellman, 2013, Shalapour and Karin, 2015, Nobel Media, 2018). Ongoing and future attempts to fine-map the immune cell landscape of tumors will give us a full picture of the tumor microenvironment (TME) and may provide novel biomarkers and therapeutic targets (Ruffell et al., 2012). Myeloid cells and, in particular, tumor-associated macrophages (TAMs) are a major component of the TME (Noy and Pollard, 2014). In the majority of cancer types, TAMs are often described as pro-tumorigenic, and an enrichment of TAMs, as defined by immunohistochemistry and flow cytometry, has been linked to poor clinical outcomes in several cancers, including breast and lung cancer (Quatromoni and Eruslanov, 2012, Zhao et al., 2017).
Large multi-omics datasets from different cancers consisting of thousands of human samples have been used to classify tumors on the basis of immune cell-derived molecular signatures that could potentially be exploited to improve patient stratification and therapeutic strategies (Gentles et al., 2015, Hoadley et al., 2018, Thorsson et al., 2018). For example, in colorectal cancer and T cell lymphomas, T cell gene signatures based on transcriptomic data were successfully used to diagnose, classify, and prognosticate disease outcome (Iqbal et al., 2010, Johdi et al., 2017).
Most recently, Cassetta et al. (2019) elegantly illustrated that TAM transcriptomes are altered in human breast cancer. Signature changes in aggressive breast cancer subtypes were associated with shorter disease-specific survival. Alternative approaches using human level information to achieve outcome predictors did not use TAMs specifically (Hironaka-Mitsuhashi et al., 2017, Tran et al., 2018, Klimczak et al., 2019, McCart Reed et al., 2019). Despite the enormous progress in the deconvolution of the immune infiltrate in cancer (Lyons et al., 2017), the use and value of TAM-derived signatures for clinical prognosis are far from being understood.
Previous approaches in murine cancer models to define TAM-associated transcriptome signatures might have been hampered by the fact that macrophages possess a tissue-specific transcriptional profile (Gosselin et al., 2014, Lavin et al., 2014, Mass et al., 2016). TAM-associated transcriptome signatures have often been determined by comparison of TAMs with classical sources of macrophages, such as the spleen or the peritoneum (Biswas et al., 2006, Ojalvo et al., 2009). In light of recent findings (Gosselin et al., 2014, Lavin et al., 2014, Mass et al., 2016), we would hypothesize that such approaches would not lead to TAM-specific signatures but would mainly reflect tissue-specific differences. Consequently, the identification of TAM-specific signatures would not be possible without access to healthy macrophages of the same organ. Such reference data are still very limited, particularly in humans (Cassetta et al., 2019), and efforts such as the Human Cell Atlas (Regev et al., 2017) are not yet ready to provide such information. Whether the generation of cell-type-specific signatures by single-cell transcriptomics (Tirosh et al., 2016, Lavin et al., 2017, Azizi et al., 2018, Lambrechts et al., 2018, Savas et al., 2018) will be sufficient to infer TAM-specific signatures is currently not clear, considering the sparse nature of single-cell RNA sequencing (RNA-seq) data.
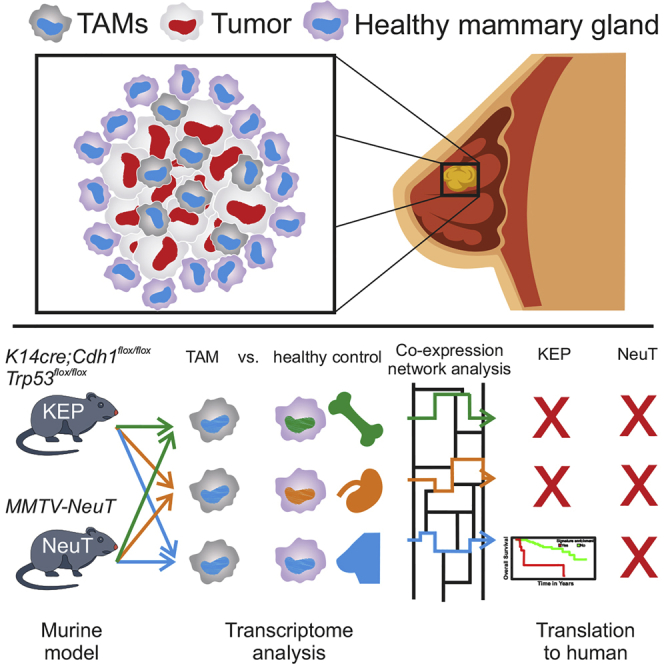
In light of current shortcomings, we propose an alternative approach to define TAM-specific signatures and test their clinical applicability for outcome prognosis. We first defined TAM signatures in well-defined murine tumor models by comparison with macrophages from different organs, including the organ of tumor origin. For proof of principle, we generated TAM signatures from the K14cre;Cdh1flox/flox;Trp53flox/flox (KEP) murine breast cancer model (Derksen et al., 2006), which recapitulates human invasive lobular carcinoma (ILC), the second most common histotype in humans, accounting for 10%–15% of all breast cancers, and the MMTV-NeuT (NeuT) breast cancer model (Boggio et al., 1998), which has been indicated to resemble HER2-positive breast cancers. Next to showing a shared transcriptional profile, TAMs from the two models present unique molecular signatures, illustrating the impact of the tumor subtype on TAMs. Tumor model-specific TAM signatures were then applied to clinical samples from large existing multi-omics studies (Curtis et al., 2012, Ciriello et al., 2015) to assess the value of these TAM-specific signatures for prognosing clinical outcome.
Results
Characterization of TAMs in Two Murine Breast Cancer Models
We first characterized TAMs isolated from two spontaneous murine breast cancer models: the KEP (FVB background) (Derksen et al., 2006) and the NeuT (BALB/c background) models (Boggio et al., 1998; Figure 1A). Mammary tumorigenesis in KEP mice resembles ILC in its pathology and progression (Derksen et al., 2006), while mammary tumors arising in NeuT mice have previously been shown to resemble HER2+ breast tumors (Boggio et al., 1998). Assessment of the myeloid cell compartment in mammary tumors of both breast cancer models identified a CD11bhiF4/80hi macrophage population, hereafter referred to as TAMs, as well as a CD11bhiF4/80low/− population that contained Ly-6Chi monocytes, Ly-6GhiLy-6Clow neutrophils, and in the KEP model also a Ly-6CloLy-6Glo population (Figures 1B and 1C). Comparison by immunohistochemistry showed that both the KEP and NeuT models were characterized by an increased accumulation of TAMs (Figure 1D), and their numbers represented 30% and 6% of the total live cells in the mammary tumors, respectively (Figure 1E).
Figure 1.

Mammary Tumorigenesis in Two Transgenic Mouse Models Is Characterized by Macrophage Influx
(A) Schematic representation of the macrophage sample collection for RNA sequencing.
(B and C) Representative dot plots of a KEP mammary tumor (B) and a NeuT tumor (C) stained for F4/80 and CD11b, confirming absence of monocytes (Ly-6G−Ly-6C+) and neutrophils (Ly-6G+Ly-6Clow) in the F4/80+CD11b+ TAM population. Dot plots are gated on CD45+ cells.
(D) Representative images of immunohistochemical F4/80 staining of a mammary gland from a WT FVB mouse, an early lesion in the mammary gland of a 4-month-old KEP mouse, and a KEP tumor (top row) and of a mammary gland of a WT BALB/c mouse, an early lesion in the mammary gland of a 2-month-old NeuT mouse, and an NeuT mammary tumor (lower row); scale bar, 20 μm.
(E) Average percentage of CD11b+ F4/80+ macrophages gated on live cells in mammary glands and mammary tumors of KEP mice (left graph) and in mammary glands and mammary tumors of NeuT mice (right graph). Data are mean ± SEM from n = 5 or 6 animals per group and were analyzed using a Mann-Whitney test (∗p < 0.05 and ∗∗p < 0.001).
See also Figures S1 and S2.
Further characterization of the macrophage phenotype showed that compared with controls, significantly fewer TAMs from the KEP but not the NeuT model express the mannose receptor CD206, while a higher proportion of TAMs in the NeuT model and not in the KEP model expresses MHC-II compared with macrophages from the mammary gland (Figures S1A–S1D). In addition, a significant increase in the frequency of Ki67+ TAMs was observed only in the KEP model (Figures S1E and S1F). On the basis of these data, we defined and sorted CD11bhiF4/80hi breast cancer TAMs, as well as tissue macrophages from the mammary gland of KEP and NeuT mice (MTMs [KEP model], MTMs [NeuT model]), mammary tissue macrophages from KEP mice containing early neoplastic lesions, but not palpable tumors (MTMs [PRE-KEP model]), and spleen and bone marrow of wild-type (WT) and mammary tumor-bearing mice (WT spleen/BM [KEP/NeuT model] and spleen/BM [KEP/NeuT model]) for genome-wide assessment of transcriptional regulation (Figures S2A–S2H).
Tissue Origin Dictates Transcriptional Regulation of TAMs
Considering findings demonstrating that tissue macrophages are characterized by organ-specific transcriptional regulation (Lavin et al., 2014), we first compared the transcriptome profiles of the TAMs derived from the two breast cancer models (KEP, NeuT) with publicly available TAM profiles of two lung cancer models (Lewis lung carcinoma cell line and lung adenocarcinoma cell line) and with the profiles of tissue macrophages of the mammary gland or lung, respectively. In addition, macrophages harvested from seven organs derived from either WT, mammary tumor-bearing, or helminth-infected mice as well as other immune and epithelial cells (Squadrito et al., 2012, Thomas et al., 2012, Lavin et al., 2014, Choi et al., 2015, Lu et al., 2015) were used as controls (Figure 2A; Figures S3A and S3B). Cells of the macrophage/monocyte lineage clustered together, separated from T cells, neutrophils, natural killer (NK) cells, and epithelial cells (Figure S3C).
Figure 2.

Tissue of Origin Determines the Fate of the Macrophage Phenotype
(A) Schematic representation depicting the bioinformatics workflow.
(B) Network visualization of sample-centered correlation analysis, where each node represents one sample.
(C and D) HC (C) and PCCM (D) maps based on the 1,000 genes with the highest variance within the dataset. Indicated in bold (D) are the disease-state macrophages.
(E and F) CoCena2 cluster-condition heatmap (E) and (F) CoCena2 visualization of all present co-expressed genes in all tissues. Tissue-specific clusters for mammary gland/tumors are colored according to the clustering as seen in cluster-condition heatmap. Representative cluster-specific genes are noted next to them. GFC, group fold change.
See also Figure S3.
To elaborate the relationship between the different tissue macrophages and cancer models, we performed sample-sample co-expression network analysis (CNA) on the basis of Pearson correlation (cutoff 0.977) on all present genes. CNA showed a distinct cluster consisting of mammary gland tissue macrophages (MTMs) and TAMs derived from both breast cancer models, strongly suggesting that the tissue of origin dictates most of the transcriptional regulation in TAMs (Figure 2B). This was similarly true for the lung cancer TAMs, which clustered together with the healthy lung tissue macrophages. To computationally validate these findings, we performed hierarchical clustering (HC) on the 1,000 genes with the highest variance within the dataset (Figure 2C) and generated a Pearson correlation coefficient matrix (PCCM) (Figure 2D). Both approaches supported our initial findings, clearly indicating that the TAMs of the two breast and lung cancer models were part of the mammary gland or lung clusters, respectively. Similarly, macrophages derived from spleen or bone marrow of tumor-bearing KEP or NeuT mice also clustered with the respective organ (Figures 2C and 2D). Moreover, we observed that the transcriptional differences between TAMs and their respective healthy tissue counterparts were less pronounced than those between healthy and helminth-infected animals (Figures 2C and 2D).
As an alternative to statistical models, we used CNA on all genes and created a scale-free network (R2 = 0.772) on the basis of a Pearson correlation cutoff of 0.87 (Figures S3D and S3E). A total of 28 clusters were identified in the CNA (construction of CNA–automated [CoCena2]) cluster-condition heatmap (Figure 2E), and specific gene signatures for each of the macrophage samples were discovered in this network, as depicted in Figure S3F. We detected modules associated with classic macrophage genes, such as scavenger receptors (Cd163, Mrc1, Cd36) and transcription factors (Maf) in MTMs, whereas the pro-inflammatory Il12b, the integrin Itgb8, and the G protein-coupled receptor Gpr31b associated mainly with breast cancer TAMs (Figure 2F). Taken together, our data suggest that the tissue of origin dictates the transcriptomes not only of healthy tissue macrophages but also of TAMs and dictates their transcriptional programs.
Identification of TAM-Specific Transcripts
Although the comparison of TAMs with different tissue macrophage populations revealed that the tissue of origin is the major driver of the global transcriptome, we were also interested to determine truly TAM-specific gene expression profiles. In previous reports, TAM functionalities have been compared with macrophages isolated from a different tissue than the tumor origin (Biswas et al., 2006, Ojalvo et al., 2009). In contrast, we defined such genes by direct comparison of breast cancer TAMs with macrophages from age-matched healthy mammary gland tissue and related them to those derived from comparisons of TAMs with other tissue-resident macrophages (Figure 3A). We used Venn diagrams to compare KEP-TAMs with either MTMs or splenic macrophages (KEP model) (Figure 3B), as well as splenic macrophages (KEP model) with either KEP-TAMs or MTMs (KEP model) (Figure 3C). We found that the fold change (FC) of differentially expressed (DE) genes in the TAMs versus splenic macrophages correlated better with the FC of DE genes in the MTMs versus splenic macrophages (KEP model) (r = 0.8) as opposed to the FC of DE genes in the TAMs versus MTMs (KEP model) (r = 0.28), indicating an overestimation of differential gene expression by TAMs compared with splenic macrophages (Figures 3B and S3C). This was also reflected in the respective FC/FC plots, in which many genes were similarly DE when plotting KEP-TAMs versus either MTMs (KEP model) or splenic macrophages (Figure S4A). Plotting KEP-TAMs versus splenic macrophages against MTMs indicated that the TAMs and MTMs displayed a transcriptome profile substantially different from that of splenic macrophages (Figure S4B). Similarly, the same pattern was observed in the NeuT model (Figures S4C and S4D) or when splenic macrophages were replaced with bone marrow macrophages in both breast cancer models (Figures S4E–S4H).
Figure 3.

Inter-tissue Comparison Leads to False Interpretation of Changes in TAMs
(A) Schematic representation outlining the bioinformatics approach.
(B and C) Venn diagrams of the comparisons of KEP-TAMs with MTMs and splenic macrophages (KEP model; B) and splenic macrophages with KEP-TAMs and MTMs (KEP model; C). Correlation plots of the FCs of the DE genes in the comparisons are shown (right) for both Venn diagrams.
(D) Heatmap visualization of z-transformed surface marker (SM) absolute expression values. Overlapping DE genes from KEP and NeuT models were extracted from FC/FC plots, filtered for SMs, and plotted.
See also Figure S4.
To identify truly TAM-associated cell surface markers, we plotted genes elevated in TAMs in comparison with either MTMs or splenic macrophages from both models (Figure 3D). This analysis revealed a small set of genes that was DE against both MTMs and splenic macrophages (cluster 3). Moreover, we also identified genes that were DE only against splenic macrophages (cluster 2) or MTMs (cluster 1) and that would wrongfully be included or excluded from downstream analysis if splenic macrophages were to be used as the reference macrophage population. Collectively, these analyses further support the notion that the determination of TAM transcriptomic profiles requires comparison with macrophages derived from the same tissue and strongly argue for the careful selection of reference macrophage populations.
TAM Transcriptomes Differ between Different Breast Cancer Models
Our experimental setting also allowed us to define tumor model-specific regulation of macrophages (Figure 4A). To define differences in TAM transcriptomes between the KEP and the NeuT model, we performed principal-component analysis (PCA) (Figure 4B), HC of the 1,000 genes with the highest variance (Figure 4C), and a PCCM (Figure 4D). All three approaches demonstrated that TAMs from both breast cancer models are more closely related to one another than to MTMs from healthy or early neoplastic lesions. However, we also identified tumor model-specific gene alterations in TAMs as depicted in the HC analysis of KEP and NeuT models (Figure 4C, clusters 5 and 8, respectively), implying that the tumor subtype also shapes the transcriptional regulation of TAMs. Two clusters (1 and 4) were related to the different genetic backgrounds of the models as the same up- or downregulated genes in KEP-TAMs and NeuT-TAMs were also seen in MTMs (KEP model) and MTMs (NeuT model), respectively. Representative genes from clusters 5 (Hif1a, Vegfa, Itgam, Cxcr4, Il1rn) and 8 (Tlr12, Itga8, Itgb8, Icosl) of the HC are depicted in the model-specific volcano plots in Figures 4E and 4F.
Figure 4.

Breast Cancer Subtype Influences TAM Phenotype: Conventional Approach
(A) Schematic representation outlining the bioinformatics approach.
(B) PCA using all present genes.
(C) HC map based on the 1,000 genes with the highest variance within the dataset. Representative cluster-specific genes are noted next to them.
(D) PCCM map based on the 1,000 genes with the highest variance within the dataset.
(E) Volcano plot of the DE genes from the comparison KEP-TAMs with MTMs (KEP model).
(F) Volcano plot of the DE genes from the comparison NeuT-TAMs with MTMs (NeuT model). DE genes (FC ≥ 2, false discovery rate [FDR]-adjusted p value ≤ 0.05) are indicated in red, and representative upregulated DE genes are noted.
(G) Venn diagram of the comparisons of KEP-TAMs with MTMs (KEP model) and NeuT-TAMs with MTMs (NeuT model).
(H) Venn diagram of the comparisons of KEP-TAMs with MTMs (PRE-KEP model) and KEP-TAMs with MTMs (KEP model).
See also Figure S5.
We next visualized the DE genes from the comparison of KEP-TAMs and NeuT-TAMs to the respective MTMs in Venn diagrams and found a small overlap in both the upregulated (17%, upper diagram) and downregulated (26%, lower diagram) DE genes (Figure 4G). Because we also had the opportunity to isolate MTMs (PRE-KEP model), we could determine whether there were already transcriptional changes in macrophages at this stage. However, the transcriptional changes of MTMs (PRE-KEP model) to KEP-TAMs were comparable with those of healthy MTMs to KEP-TAMs, as shown in the respective Venn diagrams for upregulated (70%, upper diagram) and downregulated (50%, lower diagram) DE genes, suggesting that they are similar to each other (Figure 4H).
On the basis of the DE genes in both tumor models, we inferred overall biological changes by Gene Ontology (GO) enrichment analysis (GOEA) (Figures S5A–S5C). Common breast cancer TAM ontology terms included proliferation-related processes, regulation of innate immune responses and cell migration-related processes, wound healing processes, and T cell activation processes (Figure S5A), whereas vasculature development and cell cycle-related processes (KEP-TAMs) and regulation of cell growth and angiogenesis-related processes (NeuT-TAMs) were associated with model-specific TAM populations (Figures S5B and S5C). Notably, the cell cycle-related processes were significantly enriched only in KEP-TAMs which is in line with the phenotypical observations of Figures S1E and S1F. In conclusion, our data show that the breast cancer subtype contributes to TAM transcriptional differences in different murine models.
Identification of TAM-Associated Hubs by CNA
To link our information concerning differential transcriptional regulation within TAMs of different models to potential regulatory circuits, we used co-regulation of gene expression as our model and applied CNA on the DE genes between TAMs and MTMs in at least one of the breast cancer models (Figure 5A). The scale-free network (Figure 5B; R2 = 0.714) comprised eight modules and confirmed that the transcriptomes of KEP-TAMs and NeuT-TAMs consisted of genes that followed shared (turquoise module) and model-specific expression patterns (blue and magenta modules) (Figure 5C). Immune-related DE genes that were co-expressed are shown for the turquoise (Ccr5, Cx3cr1, Cxcl16, Ifngr2, Itgav, Mmp14), blue (Nt5e, Cxcr4, Hif1a, Itgam) and magenta (Icosl, Itga8, Itgb8, Tlr12) modules in Figure 5D.
Figure 5.

Breast Cancer Subtype Influences TAM Phenotype: Co-expression-Based Approach
(A) Schematic representation outlining bioinformatics workflow.
(B) CoCena2 logged network degree distribution with linear fitting.
(C) CoCena2 cluster-condition heatmap.
(D) CoCena2 visualization of all present co-expressed genes. Network nodes are colored according to their cluster membership, and representative cluster-specific genes are noted.
(E) Schematic representation outlining bioinformatics workflow for I-GIN construction for breast cancer TAM-specific genes (turquoise cluster).
(F) I-GIN node coloring represents regulatory or receiving status obtained from a Bayesian approach and points out highly co-expressed genes and their known or proposed links to strongest correlated neighbors. Candidate genes mentioned in the text are highlighted in yellow boxes. GFC, group fold change.
See also Figure S5.
We then went one step further and investigated the potential hierarchies in TAM-associated gene regulation by building intracluster gene interaction networks (I-GINs). From the previous network analysis, we first focused on the gene module changed in both TAM models (turquoise module). We visualized the top 25% nodes on the basis of degree and correlation and the top 25% correlation-ranked edges to identify known interactions from the STRING protein-protein interactions database (Figure 5E). Subsequently, all edges to hubs were kept, allowing a maximum of two edges between hubs. Already 46% of the identified interactions within the common breast cancer TAM network were known on the basis of protein-protein interaction databases. Among the selected candidates, we detected cytokine receptors (Ifngr2), chemokines (Cxcl16), and metalloproteinases (Mmp14), which reflect the immune activation of breast cancer TAMs in the TME (Figure 5F). Further assessment of the KEP-TAM- and NeuT-TAM-specific modules revealed the co-regulation of hypoxia factor (Hif1a), 5′-nucleotidase (Nt5e) and scavenger receptors (Msr1) in the KEP-TAM dataset and pathogen recognition receptors (Tlr12), co-stimulatory molecules (Icosl) and integrins (Itgax) in the NeuT-TAM dataset (Figures S5E and S5F). Finally, the co-expressed genes detected here presented a remarkably high degree of overlap with the DE genes identified by statistical models in Figure 4C, further strengthening their relevance as breast cancer model-specific biomarkers in TAMs.
Model-Specific TAM Gene Signature Prognoses Disease Outcome in Humans
To determine the clinical relevance of the identified murine model-specific TAM signatures, we next set out to translate our findings to humans. For this purpose, we generated a unique list of TAM-associated genes defined by statistical and co-expression models (Figure 6A), identifying 198 KEP-TAM-associated genes, 227 NeuT-associated genes, and 116 common breast cancer TAM genes (Figure 6B). The 10 most significant GO terms for each of the three gene lists are shown in Figure 6C and include chemotaxis-related terms (common breast cancer TAMs), nucleotide metabolism (KEP-TAMs), and cell activation/regulation of adaptive immune cells (NeuT-TAMs). We selected one common breast cancer TAM gene (Cx3cr1) and one KEP-TAM-associated gene (Nt5e) on the basis of FC and antibody availability (Table S1) and validated these genes at the protein level. In line with the RNA expression levels, Cx3cr1 protein levels were significantly elevated in TAMs from both models, whereas Nt5e (also known as CD73) was selectively increased in KEP-TAMs (Figures S1G–S1J).
Figure 6.

KEP-TAM-Specific Signature Prognoses Overall Survival in ILC Patients
(A) Schematic representation depicting the bioinformatics approach.
(B) Venn diagrams of overlapping CoCena2- and ANOVA-derived gene sets for KEP-TAMs (top), NeuT-TAMs (middle), and breast cancer TAMs (bottom left); HC map of the union of KEP-TAM-, NeuT-TAM-, and breast cancer TAM-specific genes (right).
(C) Top ten most significant GO terms for the common breast cancer TAM, KEP-TAM, and NeuT-TAM signatures.
(D) The LM22 signature was used as input to identify the relative fraction of several immune cell populations in the ILC specimens (TCGA cohort, n = 125).
(E–H) Kaplan-Meier survival analysis of TCGA ILC patients. ILC specimens having a significant (p < 0.05) enrichment for KEP-TAM (E), NeuT-TAM (F), random (G), and CIBERSORT (H) macrophage signatures are visualized in red line and numbers. The rest of ILC patients are visualized in green line and numbers. Z score higher than 2 marks indicates significant enrichment of gene signature.
As a next step, we interrogated RNA-seq samples derived from ILC patients within The Cancer Genome Atlas (TCGA) (n = 125) (Ciriello et al., 2015) and the METABRIC (n = 147) (Curtis et al., 2012) databases for their macrophage content (Figure 6D; Figure S6A). We used linear support vector regression (LSVR) and the LM22 macrophage gene signature set (Newman et al., 2015) to describe the immune cell content of these samples. When ranking the samples for predicted macrophage content, it became clear that ILC patients have quite variable amounts of macrophages within their TME (Figure 6D). We also tested whether the specific murine TAM signatures could be identified (Figure S6A). Indeed, when applying LSVR using signatures derived from KEP-TAMs, NeuT-TAMs, and respective MTMs, the KEP-TAM signature represented a major part in most of the ILC patients (TCGA cohort), while the NeuT-TAM signature was present to a lower extent in most of the cases (Figure S6A), indicating that the former might better reflect the biology of TAMs in ILC patients.
On the basis of these encouraging results, we assessed the prognostic value of these breast cancer model-specific TAM signatures for disease outcome. Kaplan-Meier analysis showed that the KEP-TAM signature correlated with worse clinical outcomes (p = 0.037) in ILC patients from the TCGA cohort (Figure 6E) and the METABRIC cohort (p = 0.048) (Figure S6B). Importantly, the NeuT-TAM signature was not enriched in ILC patients or did not correlate with better or worse overall survival in both patient cohorts (Figure 6F; Figure S6C). To further prove the validity of these findings, we used a gene signature from the comparison of KEP-TAMs with splenic macrophages, random and LSVR-derived total human macrophage signatures and assessed whether they were prognostic of the outcome in the TCGA and METABRIC ILC cohorts (Figures 6G and 6H; Figures S6D–S6G). In fact, none of these signatures showed a prognostic value of disease outcome of ILC patients in both cohorts.
Using this approach, we then tested whether the model-specific signatures could be prognostic for human triple-negative breast cancer (TNBC). Neither the KEP-TAM nor the NeuT-TAM signature correlated with worse or improved overall survival of TNBC patients (Figure S6). Interestingly, the ILC patients showing enrichment of the KEP-TAM but not of other signatures (common breast cancer TAM, NeuT-TAM, random signatures, or splenic macrophages) also displayed enrichment of a specific breast cancer cell proliferation signature. Indeed, the KEP-TAMs themselves showed enrichment of cell cycle-related GO terms (Figure S5D). Collectively, these data indicate that the generation of meaningful gene signatures for outcome prognosis derived from TAMs requires a matched clinically relevant murine model and the comparison of TAMs with their healthy tissue counterparts (here MTMs) instead of unrelated macrophage sources such as spleen or bone marrow.
Discussion
It is widely acknowledged that the immune system plays an important role in cancer development and progression (Shalapour and Karin, 2015), with macrophage abundance associating with disease outcomes (Aras and Zaidi, 2017, Poh and Ernst, 2018). Here we provide a strategy to derive TAM-specific gene signatures and demonstrate that they can be used as prognostic biomarkers for overall survival in two independent ILC cohorts. These signatures could only be generated by proper comparison with the healthy tissue macrophage counterparts, but not by comparison with macrophages derived from unrelated tissues (e.g., spleen or bone marrow). Moreover, we show that the global transcriptome of TAMs is defined mainly by tissue signals, although the tumor subtype also plays a crucial role in shaping the TAM transcriptional networks. Collectively, our approach illustrates how transcriptional regulation of TAMs derived from a murine model closely resembling the human disease (here ILC) can be successfully translated into clinically meaningful disease outcome prognosis.
Previous studies have defined TAM gene signatures by comparing TAMs with healthy tissue macrophages derived from tissues, such as the spleen (Biswas et al., 2006, Ojalvo et al., 2009). However, recent evidence highlighted the diversity of the transcriptomes and epigenomes of the several tissue macrophage populations (Gosselin et al., 2014, Lavin et al., 2014). With these findings in hand, it was conceivable to address whether such definitions would indeed lead to TAM-specific signatures. We provide compelling evidence that TAMs still share most genes with their healthy tissue counterparts and that comparison with macrophage populations from other organs mainly reflect tissue differences. As a consequence, we strongly propose to study TAMs in the context of their healthy tissue counterparts when searching for truly TAM-related changes in gene expression and functions. Clearly, this can be more easily achieved in murine model systems compared with human cancer. More recently, Cassetta et al. (2019) reported on a 37-gene TAM signature derived from four breast cancer patients. This signature was mainly enriched in the Her2 breast cancer subtype or the “claudin-low” molecular subtype as defined by the PAM50 classification (Parker et al., 2009) and could also be linked to worse outcome prognosis, albeit not specifically for a particular breast cancer subtype.
Another important finding of our study is the observation that only a TAM-specific signature derived from the KEP model was prognostic for outcome in ILC patients. Similar results were reported by Michea et al. (2018), who showed that tumor-infiltrating DCs in two subtypes of human breast cancer express survival-prognosis signatures in a subset- and tumor subtype-specific manner. In our case, although the two breast cancer models shared tumor-associated changes, we also observed and validated in silico functionality differences between the two murine models, such as the cell cycle. This also points toward an important aspect, namely, that therapeutic interventions capable of changing the biology of the tumor, including cells within the TME, can also have an impact on the prognostic value of TAM-associated signatures. Such changes must be taken into consideration for further development of signatures as potential diagnostic tools.
We also asked whether murine TAM signature genes could be further validated on protein level. We chose two genes as examples; one from the common breast cancer TAM (Cx3cr1) and one from the KEP-TAM (Nt5e/Cd73) signature. Cx3cr1 is expressed by a distinct subset of pro-angiogenic macrophages that contribute to breast and lung cancer metastasis (Pucci et al., 2009, Qian et al., 2009), while Nt5e/Cd73 has been demonstrated to confer tumor resistance to anti-4-1BB/CD137 therapy, and its blockade has been shown to inhibit breast tumor growth and metastasis in pre-clinical models (Stagg et al., 2010, Chen et al., 2019). On the basis of these findings, it is conceivable that their prognostic value could be also evaluated on protein level in prospective studies.
Differences in functions between breast cancer TAM populations have been previously described (Qian and Pollard, 2010, Kim and Zhang, 2016). For instance, breast cancer TAM populations in different tumor models have been shown to differ in migratory behavior and their ability to uptake fluorescent dextran (Egeblad et al., 2008). Similarly, macrophage function can differ with varying oxygen levels across different tumor models (Movahedi et al., 2010, Casazza et al., 2013). Moreover, in the MMTV-PyMT mouse model both MTMs and TAMs are found in the mammary tumors, but only TAMs play a role in tumor progression (Franklin et al., 2014, Tymoszuk et al., 2014). Collectively, our findings show that the tumor subtype affects the phenotype of TAMs inducing a unique TAM signature in the two models.
Although concerns have been raised about the validity of murine cancer models (Mak et al., 2014), we demonstrate here that an appropriate cancer model such as the KEP can directly lead to clinically translatable results, here the generation of prognostic signatures TAM transcriptomes, that could be tested in prospective clinical trials to assess their performance. In this context, it is important to stress that only the KEP-TAM-derived and not the NeuT-TAM-based gene signature was informative for the ILC patient cohorts. For TNBC patients, we could not identify a signature from the murine NeuT or the KEP model that was prognostic, arguing that the KEP is sufficiently modeling only ILC. Together, these findings illustrate the requirement for murine tumor models that match the patient tumor subtype. Such models are then ideally suited to address further questions concerning the role of the myeloid cell compartment within the TME (Salvagno et al., 2019).
Although we could successfully translate population-level information derived from the KEP model to a clinical question, other questions might need higher resolution analysis such as can be provided by single-cell omics technologies (Papalexi and Satija, 2018). Such a question in our study is the assessment of the underlying heterogeneity in the MTMs (PRE-KEP model). It is very likely that although these cells were found to be transcriptionally very similar to MTMs at the bulk population level, substructure analysis might reveal concealed homogeneous subsets with distinct transcriptomic profiles that follow a spectrum ranging from those of MTMs to KEP-TAMs. In this light, single-cell RNA-seq data from fewer than 100 macrophages derived from 11 patients were described in an initial study (Ferreri et al., 2010), and a more recent study profiled more than 45,000 CD45+ cells from 8 patients, also including macrophages (Azizi et al., 2018). Although particularly the second study highlighted the enormous heterogeneity of the immune cell compartment in breast cancer, corroborating previous findings (Iqbal et al., 2010, Johdi et al., 2017), it is too early to link this rich information to patient outcome prognosis. Clearly, further studies are required that link approaches as presented here with these exciting new technologies to evaluate their clinical potential for diagnosis, subclassification of disease, and outcome prognosis.
STAR★Methods
Key Resources Table
| REAGENT OR RESOURCE | SOURCE | IDENTIFIER |
|---|---|---|
| Antibodies | ||
| anti-mouse F4/80 | AbD Serotec | Cat. No. MCA497; RRID: AB_2098196 |
| biotinylated goat anti-rat IgG | SouthernBiotech | Cat. No. 3030-08; RRID: AB_2795822 |
| anti-mouse CD45 | eBioscience | Cat.No. 83-0451-42; RRID: AB_2574712 |
| anti-mouse CD11b | Biolegend | Cat. No. 101239; RRID: AB_11125575 |
| anti-mouse F4/80 | eBioscience | Cat. No. 11-4801-82; RRID: AB_2637191 |
| anti-mouse Ly-6G | Biolegend | Cat.No. 127621; RRID: AB_10640452 |
| anti-mouse Ly-6C | eBioscience | Cat.No. 48-5932-82; RRID: AB_10805519 |
| anti-mouse CD11b | eBioscience | Cat. No. 17-0112-81; RRID: AB_469342 |
| anti-mouse F4/80 | eBioscience | Cat. No. 12-4801-82; RRID: AB_465923 |
| anti-mouse Ly-6G | BD Biosciences | Cat. No. 551460; RRID: AB_394207 |
| Fc block (CD16/CD32) purified | BD Biosciences | Cat. No. 553141; RRID: AB_394656 |
| anti-mouse CD45 | BD Biosciences | Cat.No. 564279; RRID: AB_2651134 |
| anti-mouse F4/80 | Biolegend | Cat. No. 123129; RRID: AB_2277848 |
| anti-mouse Ly-6C | Biolegend | Cat.No. 128043; RRID: AB_2566576 |
| anti-mouse MHC-II | eBioscience | Cat. No. 47-5321-82; RRID: AB_1548783 |
| anti-mouse CD206 | AbD Serotec | Cat.No. MCA2235A488; RRID: AB_324891 |
| anti-mouse CD3 | eBioscience | Cat. No. 48-0031-82; RRID: AB_10735092 |
| anti-mouse CD45 | eBioscience | Cat.No. 45-0451-82; RRID: AB_1107002 |
| anti-mouse CX3CR1 | Biolegend | Cat. No. 149007; RRID: AB_2564491 |
| anti-mouse CD73 | eBioscience | Cat.No. 12-0731-82; RRID: AB_763513 |
| Ki-67 | eBioscience | Cat. No. 14-5698-82; RRID: AB_10854564 |
| Chemical, Peptides and Recombinant proteins | ||
| Collagenase type A | Roche | Cat. No. 10103586001 |
| Difco trypsin 250 | BD Biosciences | Cat. No. 215240 |
| TRIzol | Invitrogen | Cat. No. 15596018 |
| Proteinase K | Sigma-Aldrich | Cat. No. P2308 |
| 7-AAD Viability Staining Solution | eBioscience | Cat. No. 00-6993-50 |
| Fixable Viability Dye | eBioscience | Cat. No. 65-0865-14 |
| Fixable aqua dead cell dye | ThermoFisher Scientific | Cat. No. L34957 |
| Critical Commercial Kits | ||
| anti-APC magnetic MicroBeads | Miltenyi Biotec | Cat. No. 130-090-855 |
| Rneasy Mini kit | QIAGEN | Cat. No. 74104 |
| Rneasy Micro kit | QIAGEN | Cat. No. 74004 |
| Ovation RNA-seq system V2 | NuGEN | Cat. No. 7102 |
| Encore Rapid library system | NuGEN | Cat. No. 0316 |
| Foxp3/transcription factor staining Buffer set kit | ThermoFisher Scientific | Cat.No. 00-5523-00 |
| Deposited Data | ||
| Raw and normalized data | This paper | GEO: GSE126268 |
| Raw data | (Squadrito et al., 2012) | GEO: GSE34903 |
| Raw data | (Thomas et al., 2012) | Elixir (ArrayExpress): E-MTAB-955 |
| Raw data | (Lavin et al., 2014) | GEO: GSE63341 |
| Raw data | (Choi et al., 2015) | GEO: GSE59831 |
| Raw data | (Lu et al., 2015) | GEO: GSE68511 |
| Experimental Models: Organisms/Strains | ||
| K14cre;Cdh1F/F;Trp53F/F mice | Taconic Biosciences | https://www.taconic.com/ |
| MMTV-NeuT mice | Charles River Laboratories | https://guide.labanimal.com/supplier/charles-river-laboratories-italia-srl |
| Software and Algorithms | ||
| TopHat2 | (Kim et al., 2013) | https://dgarijo.github.io/ResearchObjects/aaai2017/ontosoft/tophat.html |
| Partek Genomics Suite | Partek | http://www.partek.com/partek-genomics-suite/ |
| DESeq2 | (Love, Huber and Anders, 2014) | https://bioconductor.org/packages/release/bioc/html/DESeq2.html |
| SigmaPlot | Systat Software Inc. | https://systatsoftware.com/ |
| MayDay | (Battke, Symons and Nieselt, 2010) | https://doi.org/10.1186/1471-2105-11-121 |
| BioLayout Express3D | (Theocharidis et al., 2009) | https://www.ebi.ac.uk/about/news/service-news/BioLayoutExpress3D |
| Cytoscape | Cytoscape | http://www.cytoscape.org |
| BiNGO | (Maere, Heymans and Kuiper, 2005) | https://doi.org/10.1093/bioinformatics/bti551 |
| EnrichmentMap | (Merico et al., 2010) | https://doi.org/10.1371/journal.pone.0013984 |
| WordCloud | (Oesper et al., 2011) | https://doi.org/10.1186/1751-0473-6-7 |
| clusterProfiler | (Yu et al., 2012) | https://doi.org/10.1089/omi.2011.0118 |
| CoCena2 | This paper | https://github.com/UlasThomas/CoCena2 |
| Hmisc | CRAN depository | https://cran.r-project.org/web/packages/Hmisc/Hmisc.pdf |
| igraph | CRAN depository | https://cran.r-project.org/web/packages/igraph/igraph.pdf |
| STRING | STRING Consortium | https://string-db.org/ |
| bnlearn | (Scutari, 2010) | https://github.com/cran/bnlearn |
| CIBERSORT | (Newman et al., 2015) | https://github.com/cran/bnlearn |
| TCGA specimens | (Ciriello et al., 2015) | https://www.cancer.gov/about-nci/organization/ccg/research/structural-genomics/tcga |
| METABRIC cohort | (Curtis et al., 2012) | http://molonc.bccrc.ca/aparicio-lab/research/metabric/ |
| BioMart | (Durinck et al., 2009) | https://bioconductor.org/packages/release/bioc/html/biomaRt.html |
| GSVA | (Hänzelmann, Castelo and Guinney, 2013) | https://bioconductor.org/packages/release/bioc/html/GSVA.html |
| Survival | CRAN | https://cran.r-project.org/web/packages/survival/survival.pdf |
Lead Contact and Materials Availability
The study did not generate new unique reagents. Further information and requests for resources and reagents should be directed to and fulfilled by the Lead Contact, Joachim L. Schultze (j.schultze@uni-bonn.de).
Experimental Model and Subject Details
Animals
The generation and characterization of K14cre;Cdh1F/F;Trp53F/F mice have been previously described in detail (Derksen et al., 2006). The mice were backcrossed onto the FVB/N background and genotype was confirmed by PCR (Derksen et al., 2006, Coffelt et al., 2015). MMTV-NeuT mice on a BALB/c background (Boggio et al., 1998) were purchased from Charles River Laboratories (Calco, Italy) and were bred in house. Female K14cre;Cdh1F/F;Trp53F/F and MMTV-NeuT mice were monitored twice every week for the onset of mammary tumor formation by caliper and palpation measurement starting at 2 or 4 months of age, respectively. Mice were kept in open cages with food and water provided ad libitum at a 12-hour light/dark cycle. Animal experiments were approved by the Animal Ethics Committee of the Netherlands Cancer Institute (Amsterdam, Netherlands) and performed in accordance with institutional, national and European guidelines for Animal Care and Use (CCD license: AVD3010020172688).
Method Details
Macrophage isolation
Macrophages were isolated according to (Salvagno and de Visser, 2016). Briefly, mammary glands or mammary tumors (size ± 225mm2), spleen and bone marrow were harvested from 4 month old K14cre;Cdh1F/F;Trp53F/F female mice containing early lesions, 6-8 months old tumor-bearing K14cre;Cdh1F/F;Trp53F/F, 4 month old tumor-bearing MMTV-NeuT female mice and age- and sex-matched FVB/N and BALB/c mice. Tumors and mammary glands were mechanically chopped with a McIlwain Tissue Chopper (Ted Pella, Inc, CA, USA) and were enzymatically digested for 1 hour at 37°C with 3 mg/ml collagenase type A (Roche) and 1.5 mg/ml porcine pancreatic trypsin (BD Biosciences) in serum-free DMEM medium. Digestion was stopped by the addition of DMEM supplemented with 8% FBS and the suspension was disaggregated through a 70 μm cell strainer. Spleens and bone marrow cells from tibiae and femora were harvested and disaggregated through a 70 μm cell strainer. Splenic suspensions were subsequently treated twice with NH4Cl erythrocyte lysis buffer for 3 min at room temperature. All single-cell suspensions were stained for 20 min at 4°C in the dark with anti-mouse F4/80 (1:200; BM8; eBioscience) and anti-mouse CD11b (1:200; M1/70; eBioscience) in IMDM supplemented with 2% FBS, 0.5% beta-mercaptoethanol, 0.5 mM EDTA, Pen/Strep. Cells were then washed and incubated with magnetic MicroBeads (Miltenyi Biotec) following the manufacturer’s guidelines. Isolation of F4/80+ cells from the CD11b+-enriched fraction was performed on a BD FACS ARIA II sorter with Diva software (BD Biosciences). DAPI was added to select viable cells. Sorted macrophages were stored at −80°C in TRIzol (Invitrogen). Cell purity was determined on a FACSCalibur using CellQuestPro software (BD Biosciences) and data were analyzed using FlowJo software v9.9.
Immunohistochemistry
Immunohistochemical analysis was performed by the Animal Pathology facility at the Netherlands Cancer Institute. Briefly, formalin-fixed paraffin-embedded tissues were blocked with 4% BSA/5% normal goat serum in PBS and stained with anti-mouse F4/80 (1:300; Cl:A3-1; AbD Serotec) after antigen retrieval with 20 ug/ml Proteinase K (Sigma-Aldrich) at 37°C for 20 min. Endogenous peroxidase activity was neutralized in 3% H2O2 in methanol for 20 min at room temperature. Slides were then incubated with biotinylated goat anti-rat secondary antibody (1:100; SouthernBiotech) followed by DAB detection. Samples were visualized with a BX43 upright microscope (Olympus) and images were acquired in brightfield using cellSens Entry software (Olympus) at 40X magnification.
Flow cytometry
Single-cell suspensions were stained with anti-mouse CD45 (1:200; 30-F11; BD Biosciences), anti-mouse CD45 (1:200; 30-F11; eBioscience), anti-mouse CD11b (1:400; M1/70; Biolegend), anti-mouse CD11b (1:200; M1/70; eBioscience), anti-mouse F4/80 (1:200; BM8; eBioscience), anti-mouse F4/80 (1:200; BM8; Biolegend), anti-mouse CD206 (1:100; MR5D3; AbD Serotec), anti-mouse Ly-6C (1:400; HK1.4; eBioscience), anti-mouse Ly-6C (1:400; HK1.4; Biolegend), anti-mouse Ly-6G (1:200; 1A8; BD Biosciences), anti-mouse Ly-6G (1:200; 1A8; Biolegend), anti-mouse CX3CR1 (1:400; SA011F11; Biolegend), anti-mouse CD73 (1:200; eBioTY/11.8; eBioscience), anti-mouse CD3 (1:200; 145-2C11; eBioscience) and anti-mouse MHC-II (1:200; M5/114.15.2; eBioscience) for 20 min at 4°C in the dark in PBS supplemented with 0.5% BSA. 7AAD (1:20; eBioscience), Fixable Viability Dye (1:1000; eBioscience) or Fixable aqua dead cell dye (1:100, ThermoFisher Scientific) were added to exclude dead cells. For Ki67 detection in macrophages, cells were fixed and permeabilized with the Foxp3/transcription factor staining Buffer set kit (ThermoFisher Scientific) as manufacturer’s recommendations, followed by incubation with Fc block (CD16/CD32 purified; 1:50; 2.4G2; BD Biosciences) and stained with Ki67 (1:200; eBioscience) or anti-mouse IgG2aκ (1:200; eBioscience). Experiments were performed using a LSRII flow cytometer (BD Biosciences) and data analysis were performed using FlowJo software v9.9.
Library preparation
Total RNA was extracted using the RNeasy Mini and Micro Kits (QIAGEN). RNA (10 ng) was converted into cDNA libraries using the Ovation RNA-Seq system V2 and Encore Rapid library systems protocols (NuGEN) and samples were sequenced on a HiSeq 1500 system (Illumina).
Standard bioinformatic analysis
Publicly available datasets (Squadrito et al., 2012, Thomas et al., 2012, Lavin et al., 2014, Choi et al., 2015, Lu et al., 2015) were trimmed using fastx trimmer (-l 50 -i Sample.fastq -o Sample_trim50.fastq) to 50 bp reads to match experimental settings. All datasets were aligned against the murine mm10 reference genome using TopHat2 (v2.0.11) default parameters (Kim et al., 2013). The aligned reads were then imported into Partek Genomics Suite v6.6 (PGS) separately to deduct gene and transcript information before performing normalization using the DESeq2 package (Love, Huber and Anders, 2014) in R (v3.0.2). Normalized read counts were floored to a value of at least 1 after batch correction. Finally, the datasets were filtered to a minimum value of 10 counts per group. The 1000 genes with the highest variance and DE gene calculations were performed utilizing a one-way ANOVA model in PGS. Genes with FC ≥ 2 and FDR ≤ 0.05 were defined as differentially expressed and were visualized in volcano plots and FC/FC plots using SigmaPlot (v12.0) (Systat Software) and correlation plots. For more detailed analysis, the ANOVA model was filtered based on the respective gene lists (Fulton et al., 2009). TAM-specific surface marker expression was visualized in a heatmap using Mayday (Battke, Symons and Nieselt, 2010).
Comparative and biological function-related bioinformatic analysis
Global similarity comparisons between macrophage populations were performed by correlation analysis based on Pearson correlation coefficients (Pearson correlation ≥ 0.977) using BioLayout Express3D (Theocharidis et al., 2009). The correlation network was visualized in Cytoscape (http://www.cytoscape.org/). The structure of our breast cancer dataset was visualized utilizing PCA on all expressed genes. HC and PCCM were performed on the 1000 genes with the highest variance within the dataset using default settings in PGS. To link DE genes to known biological functions, GOEA was applied on DE gene sets extracted from FC/FC plots. Subsequently, Cytoscape was used to visualize GOEA results in a global view using the plug-ins BiNGO (Maere, Heymans and Kuiper, 2005), EnrichmentMap (Merico et al., 2010) and WordCloud (Oesper et al., 2011). GOEA for the common breast cancer TAM, KEP-TAM, NeuT-TAM signatures was performed using the R package clusterProfiler and the default settings (Yu et al., 2012).
CoCena2
To define differences and similarities in transcript expression patterns among the different groups, CoCena2 (Construction of co-expression Network Analysis – automated) was performed based on Pearson correlation. Either all present genes or the union of DE genes from the three comparisons KEP-TAMs versus MTMs from the KEP model, NeuT-TAMs versus MTMs from the NeuT model and KEP-TAMs versus MTMs from the PRE-KEP model were used as the input. Pearson correlation was performed using the R package Hmisc (v4.1-1). To increase data quality, only significant (p < 0.05) correlation values were kept. A Pearson correlation coefficients cutoff of 0.878 (all present genes; 7,610 nodes and 310,789 edges) and of 0.87 (union DE genes; 1,992 nodes and 52,392 edges) was chosen to construct scale-free networks. The nodes were colored based on the Group Fold Change (GFC), the mean of each condition versus overall mean for each gene respectively, for each group separately. Unbiased clustering was performed using the “label propagation” algorithm in igraph (v1.2.1) and was repeated 1000 times. Genes assigned to more than 5 different clusters during the iterations got no cluster assignment. The mean GFC expression for each cluster and condition were visualized in the Cluster/Condition heatmap. Clusters smaller than 10 genes were not shown.
I-GIN (Intraclusteral Gene Interaction Network)
To investigate condition-specific clusters (common breast cancer TAM signature: turquoise [289 genes], NeuT-specific signature: magenta [236 genes] and KEP-specific signature: blue [255 genes]), an I-GIN was constructed based on the CoCena2 results. To enhance the structure and information access of the respective networks, hub genes were identified for each network separately. A gene was defined as hub gene, having a mean correlation greater or equal 75% of the connected edges. Maximal the top 25 most correlated and the two highest correlated edges with other hubs edges were visualized. All edges were classified as either already known or unknown via STRING database v1.20.0. Genes having more than 5 known connections were additionally defined and labeled as hubs. All known interactions to hubs were kept and the resulting network nodes were sized according to their degree of connectivity in the resulting network. All edges in the network were colored gray and only known interactions were colored red. Hub genes were colored based on their property being regulating (purple) or being regulated (blue) by another gene. This information was calculated using Bayesian Network Analysis.
Bayesian Network Analysis
Bayesian Network Analysis was used to calculate the causal relationship of each gene pair within the cluster of interest defined by CoCena2, providing additional information about the direction of regulation between two connected nodes within the I-GIN network. Bayesian Network Analysis extracted information from the turquoise, the blue and the magenta clusters and a greedy-search hill-climbing algorithm from the R-package “bnlearn” v4.4 (Scutari, 2010) was used to create a network that best fits the observed data and represents the conditional dependencies and independencies between the genes within the cluster of interest. The network structure was then used to determine the regulatory status of each gene, classifying it as receiving if its number of parent nodes exceeded its number of children or as regulating if its number of children exceeded its number of parents. Genes were color-coded with respect to their regulatory status. Genes with a high regulatory potential of children-to-parent ratio (CP-ratio) more than 5 were classified as “hot spots.”
Identification of TAM core signatures
Core signatures for common breast cancer TAMs, KEP-TAMs, NeuT-TAMs were defined by overlapping CoCena2 clusters and the respective DE genes (Table S1). The breast cancer TAM signature is the intersection between the turquoise cluster and the common upregulated genes between KEP-TAMs versus MTMs (KEP model) and NeuT-TAMs versus MTMs (NeuT model). The KEP-TAM signature is the intersection between the blue cluster and the upregulated genes between KEP-TAMs versus MTMs (KEP model) and the NeuT-TAMs signature is the intersection between the magenta cluster and the upregulated genes between NeuT-TAMs versus MTMs (NeuT model). Subsequently, the union of the core signatures was visualized in a HC map using PGS.
CIBERSORT deconvolution analysis
CIBERSORT (Newman et al., 2015) was employed to characterize the relative contribution of immune cell populations to the TME of ILC patients. The normalized gene expression table of the TCGA ILC cohort was utilized as input mixture file and the published immune cell signature LM22 was used to compute the relative immune cell populations within bulk ILC samples (1,000 permutations). For custom signature generation by CIBERSORT, a gene expression matrix containing KEP-TAM and NeuT-TAM data was used as input.
TAM enrichment analysis
Bulk RNA-sequenced ILC TCGA specimens (Ciriello et al., 2015) were accessed through the Genomic Data Commons (https://gdc.cancer.gov/; phs000178.v9.p8) and were aligned against the human hg19 reference genome using TopHat2 (v2.0.11) default parameters. The TNBC TCGA cohort was acquired as quantified counts through the GDC data portal (https://portal.gdc.cancer.gov/) and it was selected based on lack of three clinical parameters (progesterone, HER2 and estrogen). Both datasets were normalized separately with DESeq2 in R (v3.0.2) and floored to a value of at least 1. Access to bulk ILC and TNBC microarray specimens of the METABRIC cohort (Curtis et al., 2012) was granted through the EGA depository (EGAD00010000162). The dataset was imported into PGS, quantile-normalized following log2 transformation of absolute expression values and subsequently filtered for probe sets exerting the highest variance. Genes were defined as expressed if the maximum value over all group means utilizing the classification in (Ciriello et al., 2015) was higher than 10 (TCGA) or 6.5 (log2 transformed; METABRIC). Before the enrichment in the human TCGA or METABRIC datasets, the KEP-TAM and the NeuT-TAM signatures were translated into human orthologs using the BioMart package (Durinck et al., 2009) v2.36.1. The signature enrichment analysis for the human TCGA and METABRIC datasets was calculated using GSVA (v1.28.0) using the z-score method (Hänzelmann, Castelo and Guinney, 2013). Enrichment analysis were performed for the KEP-TAM, NeuT-TAM, KEP-TAMs versus splenic macrophage (intersection of the blue cluster and KEP-TAM upregulated genes comparing KEP-TAMs versus splenic macrophages) and random signatures. Random gene signatures were generated by sampling a total of 300 genes from the union of signatures (common breast cancer TAM, KEP-TAM and NeuT-TAM) and randomly assigning them to two groups, each holding 150 genes. For each patient and each combination of dataset (TCGA and METABRIC) and signature, an enrichment score was calculated.
Proliferation signature enrichment analysis
Upon enrichment analysis of the KEP-TAM, NeuT-TAM, KEP-TAM versus splenic macrophage and random signatures as described before, gene set enrichment analysis of a signature defined by human breast tumor expression data Broad MSigDB was used and a t test based on the enrichment score from the proliferation signature and on the grouping defined by the enrichment analysis of the core signatures was performed to define significant differences.
Kaplan Meier survival analysis
Kaplan-Meier survival analysis was performed utilizing the survival package in R (v3.0.2).
Quantification and Statistical Analysis
Except where stated otherwise, all analyses were conducted in at least three biological replicates (animals). Data are presented as mean with standard error of the mean (SEM) calculated as indicated. Groups of biological replicates were compared using Mann-Whitney tests. Significance levels are indicated by asterisks (∗p < 0.05, ∗∗p < 0.001).
Data and Code Availability
The datasets generated in this study are deposited in the Gene Expression Omnibus database under GEO: GSE126268. The CoCena2 code is available at https://github.com/UlasThomas/CoCena2.
Acknowledgments
We thank H.-S. Sow for technical assistance and Lorenzo Bonaguro for analyzing flow cytometry data. We would like to acknowledge the flow cytometry facility, the animal facility, and the animal pathology facility at the Netherlands Cancer Institute. Research leading to these results has received funding from the People Programme (Marie Skłodowska-Curie Actions) of the European Union’s Seventh Framework Programme (FP7/2077-2013) under REA grant agreement 317445 to J.L.S. and K.E.d.V. J.L.S. is supported by Deutsche Forschungsgemeinschaft (DFG; German Research Foundation) under Germany’s Excellence Strategy (EXC2151 – 390873048), the Helmholtz Association-funded project Sparse2Big and the European Union (H2020, 733100: SYSCID, “A Systems Medicine Approach to Chronic Inflammatory Diseases”). Research in the K.E.d.V. lab is further supported by the Dutch Cancer Society (NKI10623), the European Research Council (ERC consolidator award INFLAMET 615300), NWO (VICI 91819616), and Oncode.
Author Contributions
J.L.S., K.E.d.V., and T.U. designed the study. S.T., C.S., and C.-S.H. performed experiments. S.T., C.S., L.S., M.O., K.K., and T.U. performed analysis. T.S.K. wrote the manuscript with input from all authors.
Declaration of Interests
The authors declare no competing interests.
Published: October 29, 2019
Footnotes
Supplemental Information can be found online at https://doi.org/10.1016/j.celrep.2019.09.067.
Contributor Information
Karin E. de Visser, Email: k.d.visser@nki.nl.
Joachim L. Schultze, Email: j.schultze@uni-bonn.de.
Supplemental Information
References
- Aras S., Zaidi M.R. TAMeless traitors: macrophages in cancer progression and metastasis. Br. J. Cancer. 2017;117:1583–1591. doi: 10.1038/bjc.2017.356. [DOI] [PMC free article] [PubMed] [Google Scholar]
- Azizi E., Carr A.J., Plitas G., Cornish A.E., Konopacki C., Prabhakaran S., Nainys J., Wu K., Kiseliovas V., Setty M. Single-cell map of diverse immune phenotypes in the breast tumor microenvironment. Cell. 2018;174:1293–1308.e36. doi: 10.1016/j.cell.2018.05.060. [DOI] [PMC free article] [PubMed] [Google Scholar]
- Battke F., Symons S., Nieselt K. Mayday—integrative analytics for expression data. BMC Bioinformatics. 2010;11:121. doi: 10.1186/1471-2105-11-121. [DOI] [PMC free article] [PubMed] [Google Scholar]
- Biswas S.K., Gangi L., Paul S., Schioppa T., Saccani A., Sironi M., Bottazzi B., Doni A., Vincenzo B., Pasqualini F. A distinct and unique transcriptional program expressed by tumor-associated macrophages (defective NF-kappaB and enhanced IRF-3/STAT1 activation) Blood. 2006;107:2112–2122. doi: 10.1182/blood-2005-01-0428. [DOI] [PubMed] [Google Scholar]
- Boggio K., Nicoletti G., Di Carlo E., Cavallo F., Landuzzi L., Melani C., Giovarelli M., Rossi I., Nanni P., De Giovanni C. Interleukin 12-mediated prevention of spontaneous mammary adenocarcinomas in two lines of Her-2/neu transgenic mice. J. Exp. Med. 1998;188:589–596. doi: 10.1084/jem.188.3.589. [DOI] [PMC free article] [PubMed] [Google Scholar]
- Casazza A., Laoui D., Wenes M., Rizzolio S., Bassani N., Mambretti M., Deschoemaeker S., Van Ginderachter J.A., Tamagnone L., Mazzone M. Impeding macrophage entry into hypoxic tumor areas by Sema3A/Nrp1 signaling blockade inhibits angiogenesis and restores antitumor immunity. Cancer Cell. 2013;24:695–709. doi: 10.1016/j.ccr.2013.11.007. [DOI] [PubMed] [Google Scholar]
- Cassetta L., Fragkogianni S., Sims A.H., Swierczak A., Forrester L.M., Zhang H., Soong D.Y.H., Cotechini T., Anur P., Lin E.Y. Human tumor-associated macrophage and monocyte transcriptional landscapes reveal cancer-specific reprogramming, biomarkers, and therapeutic targets. Cancer Cell. 2019;35:588–602.e10. doi: 10.1016/j.ccell.2019.02.009. [DOI] [PMC free article] [PubMed] [Google Scholar]
- Chen D.S., Mellman I. Oncology meets immunology: the cancer-immunity cycle. Immunity. 2013;39:1–10. doi: 10.1016/j.immuni.2013.07.012. [DOI] [PubMed] [Google Scholar]
- Chen S., Fan J., Zhang M., Qin L., Dominguez D., Long A., Wang G., Ma R., Li H., Zhang Y. CD73 expression on effector T cells sustained by TGF-β facilitates tumor resistance to anti-4-1BB/CD137 therapy. Nat. Commun. 2019;10:150. doi: 10.1038/s41467-018-08123-8. [DOI] [PMC free article] [PubMed] [Google Scholar]
- Choi H., Sheng J., Gao D., Li F., Durrans A., Ryu S., Lee S.B., Narula N., Rafii S., Elemento O. Transcriptome analysis of individual stromal cell populations identifies stroma-tumor crosstalk in mouse lung cancer model. Cell Rep. 2015;10:1187–1201. doi: 10.1016/j.celrep.2015.01.040. [DOI] [PubMed] [Google Scholar]
- Ciriello G., Gatza M.L., Beck A.H., Wilkerson M.D., Rhie S.K., Pastore A., Zhang H., McLellan M., Yau C., Kandoth C., TCGA Research Network Comprehensive molecular portraits of invasive lobular breast cancer. Cell. 2015;163:506–519. doi: 10.1016/j.cell.2015.09.033. [DOI] [PMC free article] [PubMed] [Google Scholar]
- Coffelt S.B., Kersten K., Doornebal C.W., Weiden J., Vrijland K., Hau C.S., Verstegen N.J.M., Ciampricotti M., Hawinkels L.J.A.C., Jonkers J., de Visser K.E. IL-17-producing γδ T cells and neutrophils conspire to promote breast cancer metastasis. Nature. 2015;522:345–348. doi: 10.1038/nature14282. [DOI] [PMC free article] [PubMed] [Google Scholar]
- Curtis C., Shah S.P., Chin S.F., Turashvili G., Rueda O.M., Dunning M.J., Speed D., Lynch A.G., Samarajiwa S., Yuan Y., METABRIC Group The genomic and transcriptomic architecture of 2,000 breast tumours reveals novel subgroups. Nature. 2012;486:346–352. doi: 10.1038/nature10983. [DOI] [PMC free article] [PubMed] [Google Scholar]
- Derksen P.W.B., Liu X., Saridin F., van der Gulden H., Zevenhoven J., Evers B., van Beijnum J.R., Griffioen A.W., Vink J., Krimpenfort P. Somatic inactivation of E-cadherin and p53 in mice leads to metastatic lobular mammary carcinoma through induction of anoikis resistance and angiogenesis. Cancer Cell. 2006;10:437–449. doi: 10.1016/j.ccr.2006.09.013. [DOI] [PubMed] [Google Scholar]
- Durinck S., Spellman P.T., Birney E., Huber W. Mapping identifiers for the integration of genomic datasets with the R/Bioconductor package biomaRt. Nat. Protoc. 2009;4:1184–1191. doi: 10.1038/nprot.2009.97. [DOI] [PMC free article] [PubMed] [Google Scholar]
- Egeblad M., Ewald A.J., Askautrud H.A., Truitt M.L., Welm B.E., Bainbridge E., Peeters G., Krummel M.F., Werb Z. Visualizing stromal cell dynamics in different tumor microenvironments by spinning disk confocal microscopy. Dis. Model. Mech. 2008;1:155–167. doi: 10.1242/dmm.000596. [DOI] [PMC free article] [PubMed] [Google Scholar]
- Ferreri A.J.M., Illerhaus G., Zucca E., Cavalli F., International Extranodal Lymphoma Study Group Flows and flaws in primary central nervous system lymphoma. Nat. Rev. Clin. Oncol. 2010;7(8) doi: 10.1038/nrclinonc.2010.9-c1. [DOI] [PubMed] [Google Scholar]
- Franklin R.A., Liao W., Sarkar A., Kim M.V., Bivona M.R., Liu K., Pamer E.G., Li M.O. The cellular and molecular origin of tumor-associated macrophages. Science. 2014;344:921–925. doi: 10.1126/science.1252510. [DOI] [PMC free article] [PubMed] [Google Scholar]
- Fulton D.L., Sundararajan S., Badis G., Hughes T.R., Wasserman W.W., Roach J.C., Sladek R. TFCat: the curated catalog of mouse and human transcription factors. Genome Biol. 2009;10:R29. doi: 10.1186/gb-2009-10-3-r29. [DOI] [PMC free article] [PubMed] [Google Scholar]
- Gentles A.J., Newman A.M., Liu C.L., Bratman S.V., Feng W., Kim D., Nair V.S., Xu Y., Khuong A., Hoang C.D. The prognostic landscape of genes and infiltrating immune cells across human cancers. Nat. Med. 2015;21:938–945. doi: 10.1038/nm.3909. [DOI] [PMC free article] [PubMed] [Google Scholar]
- Gosselin D., Link V.M., Romanoski C.E., Fonseca G.J., Eichenfield D.Z., Spann N.J., Stender J.D., Chun H.B., Garner H., Geissmann F., Glass C.K. Environment drives selection and function of enhancers controlling tissue-specific macrophage identities. Cell. 2014;159:1327–1340. doi: 10.1016/j.cell.2014.11.023. [DOI] [PMC free article] [PubMed] [Google Scholar]
- Hänzelmann S., Castelo R., Guinney J. GSVA: gene set variation analysis for microarray and RNA-seq data. BMC Bioinformatics. 2013;14:7. doi: 10.1186/1471-2105-14-7. [DOI] [PMC free article] [PubMed] [Google Scholar]
- Hironaka-Mitsuhashi A., Matsuzaki J., Takahashi R.U., Yoshida M., Nezu Y., Yamamoto Y., Shiino S., Kinoshita T., Ushijima T., Hiraoka N. A tissue microRNA signature that predicts the prognosis of breast cancer in young women. PLoS ONE. 2017;12:e0187638. doi: 10.1371/journal.pone.0187638. [DOI] [PMC free article] [PubMed] [Google Scholar]
- Hoadley K.A., Yau C., Hinoue T., Wolf D.M., Lazar A.J., Drill E., Shen R., Taylor A.M., Cherniack A.D., Thorsson V., Cancer Genome Atlas Network Cell-of-origin patterns dominate the molecular classification of 10,000 tumors from 33 types of cancer. Cell. 2018;173:291–304.e6. doi: 10.1016/j.cell.2018.03.022. [DOI] [PMC free article] [PubMed] [Google Scholar]
- Iqbal J., Weisenburger D.D., Greiner T.C., Vose J.M., McKeithan T., Kucuk C., Geng H., Deffenbacher K., Smith L., Dybkaer K., International Peripheral T-Cell Lymphoma Project Molecular signatures to improve diagnosis in peripheral T-cell lymphoma and prognostication in angioimmunoblastic T-cell lymphoma. Blood. 2010;115:1026–1036. doi: 10.1182/blood-2009-06-227579. [DOI] [PMC free article] [PubMed] [Google Scholar]
- Johdi N.A., Ait-Tahar K., Sagap I., Jamal R. Molecular Signatures of Human Regulatory T Cells in Colorectal Cancer and Polyps. Front. Immunol. 2017;8:620. doi: 10.3389/fimmu.2017.00620. [DOI] [PMC free article] [PubMed] [Google Scholar]
- Kim I.S., Zhang X.H.F. One microenvironment does not fit all: heterogeneity beyond cancer cells. Cancer Metastasis Rev. 2016;35:601–629. doi: 10.1007/s10555-016-9643-z. [DOI] [PMC free article] [PubMed] [Google Scholar]
- Kim D., Pertea G., Trapnell C., Pimentel H., Kelley R., Salzberg S.L. TopHat2: accurate alignment of transcriptomes in the presence of insertions, deletions and gene fusions. Genome Biol. 2013;14:R36. doi: 10.1186/gb-2013-14-4-r36. [DOI] [PMC free article] [PubMed] [Google Scholar]
- Klimczak M., Biecek P., Zylicz A., Zylicz M. Heat shock proteins create a signature to predict the clinical outcome in breast cancer. Sci. Rep. 2019;9:7507. doi: 10.1038/s41598-019-43556-1. [DOI] [PMC free article] [PubMed] [Google Scholar]
- Lambrechts D., Wauters E., Boeckx B., Aibar S., Nittner D., Burton O., Bassez A., Decaluwé H., Pircher A., Van den Eynde K. Phenotype molding of stromal cells in the lung tumor microenvironment. Nat. Med. 2018;24:1277–1289. doi: 10.1038/s41591-018-0096-5. [DOI] [PubMed] [Google Scholar]
- Lavin Y., Winter D., Blecher-Gonen R., David E., Keren-Shaul H., Merad M., Jung S., Amit I. Tissue-resident macrophage enhancer landscapes are shaped by the local microenvironment. Cell. 2014;159:1312–1326. doi: 10.1016/j.cell.2014.11.018. [DOI] [PMC free article] [PubMed] [Google Scholar]
- Lavin Y., Kobayashi S., Leader A., Amir E.D., Elefant N., Bigenwald C., Remark R., Sweeney R., Becker C.D., Levine J.H. Innate immune landscape in early lung adenocarcinoma by paired single-cell analyses. Cell. 2017;169:750–765.e17. doi: 10.1016/j.cell.2017.04.014. [DOI] [PMC free article] [PubMed] [Google Scholar]
- Love M.I., Huber W., Anders S. Moderated estimation of fold change and dispersion for RNA-seq data with DESeq2. Genome Biol. 2014;15:550. doi: 10.1186/s13059-014-0550-8. [DOI] [PMC free article] [PubMed] [Google Scholar]
- Lu L.F., Gasteiger G., Yu I.S., Chaudhry A., Hsin J.P., Lu Y., Bos P.D., Lin L.L., Zawislak C.L., Cho S. A single miRNA-mRNA interaction affects the immune response in a context- and cell-type-specific manner. Immunity. 2015;43:52–64. doi: 10.1016/j.immuni.2015.04.022. [DOI] [PMC free article] [PubMed] [Google Scholar]
- Lyons Y.A., Wu S.Y., Overwijk W.W., Baggerly K.W., Sood A.K. Immune cell profiling in cancer: molecular approaches to cell-specific identification. NPJ Precis. Oncol. 2017;1:26. doi: 10.1038/s41698-017-0031-0. [DOI] [PMC free article] [PubMed] [Google Scholar]
- Maere S., Heymans K., Kuiper M. BiNGO: a Cytoscape plugin to assess overrepresentation of gene ontology categories in biological networks. Bioinformatics. 2005;21:3448–3449. doi: 10.1093/bioinformatics/bti551. [DOI] [PubMed] [Google Scholar]
- Mak I.W., Evaniew N., Ghert M. Lost in translation: animal models and clinical trials in cancer treatment. Am. J. Translat. Res. 2014;6:114–118. [PMC free article] [PubMed] [Google Scholar]
- Mass E., Ballesteros I., Farlik M., Halbritter F., Günther P., Crozet L., Jacome-Galarza C.E., Händler K., Klughammer J., Kobayashi Y. Specification of tissue-resident macrophages during organogenesis. Science. 2016;353 doi: 10.1126/science.aaf4238. aaf4238–aaf4238. [DOI] [PMC free article] [PubMed] [Google Scholar]
- McCart Reed A.E., Lal S., Kutasovic J.R., Wockner L., Robertson A., de Luca X.M., Kalita-de Croft P., Dalley A.J., Coorey C.P., Kuo L. LobSig is a multigene predictor of outcome in invasive lobular carcinoma. NPJ Breast Cancer. 2019;5:18. doi: 10.1038/s41523-019-0113-y. [DOI] [PMC free article] [PubMed] [Google Scholar]
- Merico D., Isserlin R., Stueker O., Emili A., Bader G.D. Enrichment map: a network-based method for gene-set enrichment visualization and interpretation. PLoS ONE. 2010;5:e13984. doi: 10.1371/journal.pone.0013984. [DOI] [PMC free article] [PubMed] [Google Scholar]
- Michea P., Noël F., Zakine E., Czerwinska U., Sirven P., Abouzid O., Goudot C., Scholer-Dahirel A., Vincent-Salomon A., Reyal F. Adjustment of dendritic cells to the breast-cancer microenvironment is subset specific. Nat. Immunol. 2018;19:885–897. doi: 10.1038/s41590-018-0145-8. [DOI] [PubMed] [Google Scholar]
- Movahedi K., Laoui D., Gysemans C., Baeten M., Stangé G., Van den Bossche J., Mack M., Pipeleers D., In’t Veld P., De Baetselier P., Van Ginderachter J.A. Different tumor microenvironments contain functionally distinct subsets of macrophages derived from Ly6C(high) monocytes. Cancer Res. 2010;70:5728–5739. doi: 10.1158/0008-5472.CAN-09-4672. [DOI] [PubMed] [Google Scholar]
- Newman A.M., Liu C.L., Green M.R., Gentles A.J., Feng W., Xu Y., Hoang C.D., Diehn M., Alizadeh A.A. Robust enumeration of cell subsets from tissue expression profiles. Nat. Methods. 2015;12:453–457. doi: 10.1038/nmeth.3337. [DOI] [PMC free article] [PubMed] [Google Scholar]
- Nobel Media The Nobel Prize in physiology or medicine. 2018. https://www.nobelprize.org/prizes/medicine/2018/summary/
- Noy R., Pollard J.W. Tumor-associated macrophages: from mechanisms to therapy. Immunity. 2014;41:49–61. doi: 10.1016/j.immuni.2014.06.010. [DOI] [PMC free article] [PubMed] [Google Scholar]
- Oesper L., Merico D., Isserlin R., Bader G.D. WordCloud: a Cytoscape plugin to create a visual semantic summary of networks. Source Code Biol. Med. 2011;6:7. doi: 10.1186/1751-0473-6-7. [DOI] [PMC free article] [PubMed] [Google Scholar]
- Ojalvo L.S., King W., Cox D., Pollard J.W. High-density gene expression analysis of tumor-associated macrophages from mouse mammary tumors. Am. J. Pathol. 2009;174:1048–1064. doi: 10.2353/ajpath.2009.080676. [DOI] [PMC free article] [PubMed] [Google Scholar]
- Papalexi E., Satija R. Single-cell RNA sequencing to explore immune cell heterogeneity. Nat. Rev. Immunol. 2018;18:35–45. doi: 10.1038/nri.2017.76. [DOI] [PubMed] [Google Scholar]
- Parker J.S., Mullins M., Cheang M.C., Leung S., Voduc D., Vickery T., Davies S., Fauron C., He X., Hu Z. Supervised risk predictor of breast cancer based on intrinsic subtypes. J. Clin. Oncol. 2009;27:1160–1167. doi: 10.1200/JCO.2008.18.1370. [DOI] [PMC free article] [PubMed] [Google Scholar]
- Poh A.R., Ernst M. Targeting macrophages in cancer: from bench to bedside. Front. Oncol. 2018;8:49. doi: 10.3389/fonc.2018.00049. [DOI] [PMC free article] [PubMed] [Google Scholar]
- Pucci F., Venneri M.A., Biziato D., Nonis A., Moi D., Sica A., Di Serio C., Naldini L., De Palma M. A distinguishing gene signature shared by tumor-infiltrating Tie2-expressing monocytes, blood “resident” monocytes, and embryonic macrophages suggests common functions and developmental relationships. Blood. 2009;114:901–914. doi: 10.1182/blood-2009-01-200931. [DOI] [PubMed] [Google Scholar]
- Qian B.Z., Pollard J.W. Macrophage diversity enhances tumor progression and metastasis. Cell. 2010;141:39–51. doi: 10.1016/j.cell.2010.03.014. [DOI] [PMC free article] [PubMed] [Google Scholar]
- Qian B., Deng Y., Im J.H., Muschel R.J., Zou Y., Li J., Lang R.A., Pollard J.W. A distinct macrophage population mediates metastatic breast cancer cell extravasation, establishment and growth. PLoS ONE. 2009;4:e6562. doi: 10.1371/journal.pone.0006562. [DOI] [PMC free article] [PubMed] [Google Scholar]
- Quatromoni J.G., Eruslanov E. Tumor-associated macrophages: function, phenotype, and link to prognosis in human lung cancer. Am. J. Translat. Res. 2012;4:376–389. [PMC free article] [PubMed] [Google Scholar]
- Regev A., Teichmann S.A., Lander E.S., Amit I., Benoist C., Birney E., Bodenmiller B., Campbell P., Carninci P., Clatworthy M., Human Cell Atlas Meeting Participants The Human Cell Atlas. eLife. 2017;6:e27041. doi: 10.7554/eLife.27041. [DOI] [PMC free article] [PubMed] [Google Scholar]
- Ruffell B., Au A., Rugo H.S., Esserman L.J., Hwang E.S., Coussens L.M. Leukocyte composition of human breast cancer. Proc. Natl. Acad. Sci. U S A. 2012;109:2796–2801. doi: 10.1073/pnas.1104303108. [DOI] [PMC free article] [PubMed] [Google Scholar]
- Salvagno C., de Visser K.E. Purification of immune cell populations from freshly isolated murine tumors and organs by consecutive magnetic cell sorting and multi-parameter flow cytometry-based sorting. Methods Mol. Biol. 2016;1458:125–135. doi: 10.1007/978-1-4939-3801-8_10. [DOI] [PubMed] [Google Scholar]
- Salvagno C., Ciampricotti M., Tuit S., Hau C.S., van Weverwijk A., Coffelt S.B., Kersten K., Vrijland K., Kos K., Ulas T. Therapeutic targeting of macrophages enhances chemotherapy efficacy by unleashing type I interferon response. Nat. Cell Biol. 2019;21:511–521. doi: 10.1038/s41556-019-0298-1. [DOI] [PMC free article] [PubMed] [Google Scholar]
- Savas P., Virassamy B., Ye C., Salim A., Mintoff C.P., Caramia F., Salgado R., Byrne D.J., Teo Z.L., Dushyanthen S., Kathleen Cuningham Foundation Consortium for Research into Familial Breast Cancer (kConFab) Single-cell profiling of breast cancer T cells reveals a tissue-resident memory subset associated with improved prognosis. Nat. Med. 2018;24:986–993. doi: 10.1038/s41591-018-0078-7. [DOI] [PubMed] [Google Scholar]
- Scutari M. Learning Bayesian networks with the bnlearn R package. J. Stat. Softw. 2010;35(3) [Google Scholar]
- Shalapour S., Karin M. Immunity, inflammation, and cancer: an eternal fight between good and evil. J. Clin. Invest. 2015;125:3347–3355. doi: 10.1172/JCI80007. [DOI] [PMC free article] [PubMed] [Google Scholar]
- Squadrito M.L., Pucci F., Magri L., Moi D., Gilfillan G.D., Ranghetti A., Casazza A., Mazzone M., Lyle R., Naldini L., De Palma M. miR-511-3p modulates genetic programs of tumor-associated macrophages. Cell Rep. 2012;1:141–154. doi: 10.1016/j.celrep.2011.12.005. [DOI] [PubMed] [Google Scholar]
- Stagg J., Divisekera U., McLaughlin N., Sharkey J., Pommey S., Denoyer D., Dwyer K.M., Smyth M.J. Anti-CD73 antibody therapy inhibits breast tumor growth and metastasis. Proc. Natl. Acad. Sci. U S A. 2010;107:1547–1552. doi: 10.1073/pnas.0908801107. [DOI] [PMC free article] [PubMed] [Google Scholar]
- Theocharidis A., van Dongen S., Enright A.J., Freeman T.C. Network visualization and analysis of gene expression data using BioLayout Express(3D) Nat. Protoc. 2009;4:1535–1550. doi: 10.1038/nprot.2009.177. [DOI] [PubMed] [Google Scholar]
- Thomas G.D., Rückerl D., Maskrey B.H., Whitfield P.D., Blaxter M.L., Allen J.E. The biology of nematode- and IL4Rα-dependent murine macrophage polarization in vivo as defined by RNA-Seq and targeted lipidomics. Blood. 2012;120:e93–e104. doi: 10.1182/blood-2012-07-442640. [DOI] [PMC free article] [PubMed] [Google Scholar]
- Thorsson V., Gibbs D.L., Brown S.D., Wolf D., Bortone D.S., Ou Yang T.H., Porta-Pardo E., Gao G.F., Plaisier C.L., Eddy J.A., Cancer Genome Atlas Research Network The Immune Landscape of Cancer. Immunity. 2018;48:812–830.e14. doi: 10.1016/j.immuni.2018.03.023. [DOI] [PMC free article] [PubMed] [Google Scholar]
- Tirosh I., Izar B., Prakadan S.M., Wadsworth M.H., 2nd, Treacy D., Trombetta J.J., Rotem A., Rodman C., Lian C., Murphy G. Dissecting the multicellular ecosystem of metastatic melanoma by single-cell RNA-seq. Science. 2016;352:189–196. doi: 10.1126/science.aad0501. [DOI] [PMC free article] [PubMed] [Google Scholar]
- Tran H.Q., Luu P.L., Than V.T., Clarke C., Lam H.N., Nguyen D.T., Le K.V.T., Nguyen T.V., Le M.T., Hoang X.T. A novel melatonergic signature predicts reccurence risk and therapeutic response in breast cancer patients. bioRxiv. 2018 [Google Scholar]
- Tymoszuk P., Evens H., Marzola V., Wachowicz K., Wasmer M.H., Datta S., Müller-Holzner E., Fiegl H., Böck G., van Rooijen N. In situ proliferation contributes to accumulation of tumor-associated macrophages in spontaneous mammary tumors. Eur. J. Immunol. 2014;44:2247–2262. doi: 10.1002/eji.201344304. [DOI] [PubMed] [Google Scholar]
- Yu G., Wang L.G., Han Y., He Q.Y. clusterProfiler: an R package for comparing biological themes among gene clusters. OMICS. 2012;16:284–287. doi: 10.1089/omi.2011.0118. [DOI] [PMC free article] [PubMed] [Google Scholar]
- Zhao X., Qu J., Sun Y., Wang J., Liu X., Wang F., Zhang H., Wang W., Ma X., Gao X., Zhang S. Prognostic significance of tumor-associated macrophages in breast cancer: a meta-analysis of the literature. Oncotarget. 2017;8:30576–30586. doi: 10.18632/oncotarget.15736. [DOI] [PMC free article] [PubMed] [Google Scholar]
Associated Data
This section collects any data citations, data availability statements, or supplementary materials included in this article.
Supplementary Materials
Data Availability Statement
The datasets generated in this study are deposited in the Gene Expression Omnibus database under GEO: GSE126268. The CoCena2 code is available at https://github.com/UlasThomas/CoCena2.