

Abstract
Modifications of histone proteins have essential roles in normal development and human disease. Recognition of modified histones by ‘reader’ proteins is a key mechanism that mediates the function of histone modifications, but how the dysregulation of these readers might contribute to disease remains poorly understood. We previously identified the ENL protein as a reader of histone acetylation via its YEATS domain, linking it to the expression of cancer-driving genes in acute leukaemia1. Recurrent hotspot mutations have been found in the ENL YEATS domain in Wilms tumour2,3, the most common type of paediatric kidney cancer. Here we show, using human and mouse cells, that these mutations impair cell-fate regulation by conferring gain-of-function in chromatin recruitment and transcriptional control. ENL mutants induce gene-expression changes that favour a premalignant cell fate, and, in an assay for nephrogenesis using murine cells, result in undifferentiated structures resembling those observed in human Wilms tumour. Mechanistically, although bound to largely similar genomic loci as the wild-type protein, ENL mutants exhibit increased occupancy at a subset of targets, leading to a marked increase in the recruitment and activity of transcription elongation machinery that enforces active transcription from target loci. Furthermore, ectopically expressed ENL mutants exhibit greater self-association and form discrete and dynamic nuclear puncta that are characteristic of biomolecular hubs consisting of local high concentrations of regulatory factors. Such mutation-driven ENL self-association is functionally linked to enhanced chromatin occupancy and gene activation. Collectively, our findings show that hotspot mutations in a chromatin-reader domain drive self-reinforced recruitment, derailing normal cell-fate control during development and leading to an oncogenic outcome.
The eleven-nineteen-leukaemia protein (ENL) is a chromatin reader that maintains the oncogenic state in leukaemia1,4. ENL interacts with acetylated histone proteins via its well conserved YEATS (Yaf9, ENL, AF9, Taf14, Sas5) domain, and, in so doing, helps to recruit and stabilize its associated transcriptional machinery to drive the transcription of target genes. Recently, somatic mutations in the ENL gene (also known as MLLT1) were found in about 5% of people with Wilms tumour, making ENL one of the most frequently mutated genes in this cancer type. These mutations are recurrent, heterozygous and highly clustered in the ENL YEATS domain. Interestingly, these ‘hotspot’ mutations all involve small in-frame insertions or deletions (Fig. 1a and Extended Data Fig. 1a). Whether and how such ENL mutations promote the formation of Wilms tumour was unclear and is the focus of our study.
Fig. 1 |. ENL mutations drive aberrant developmental programs and impair nephron differentiation.
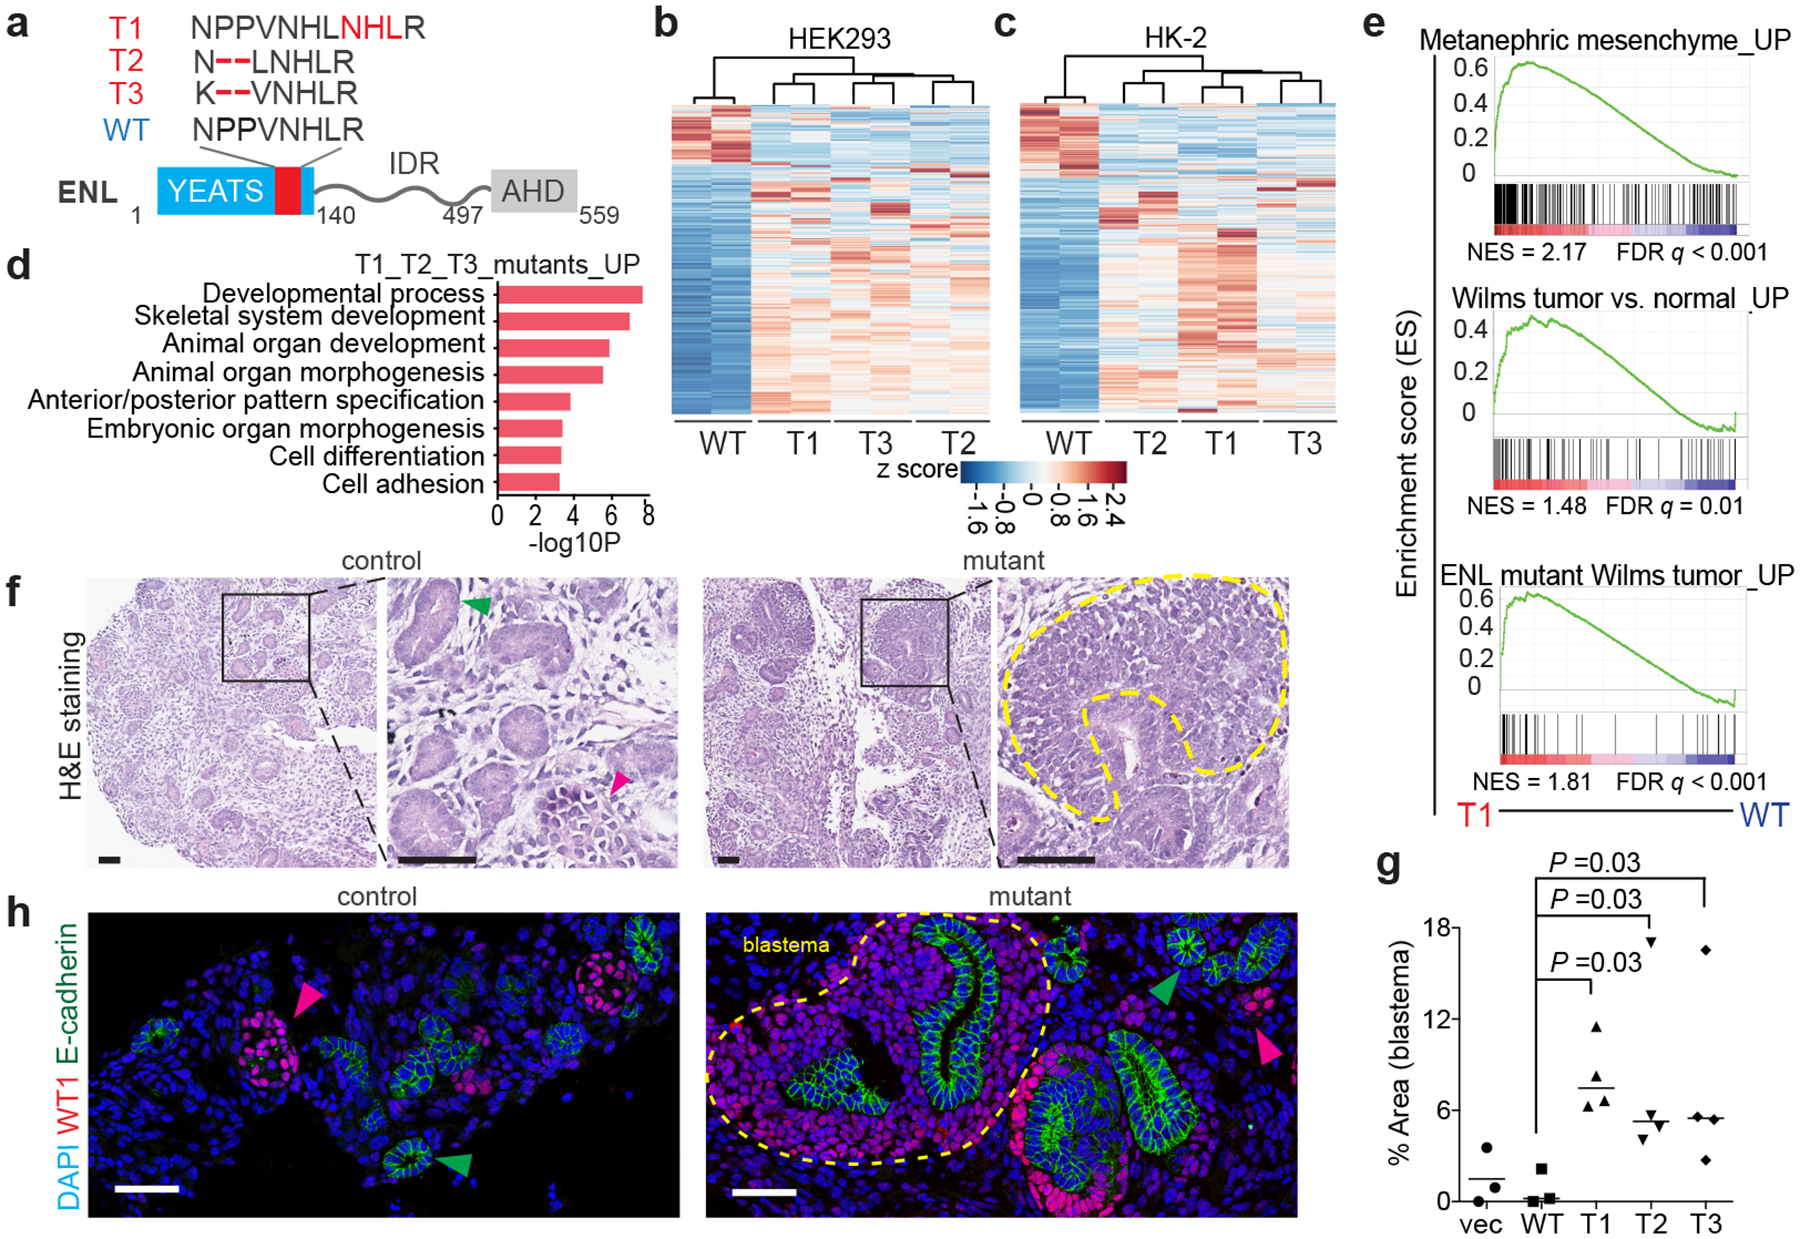
a, Bottom, the domain structure of the ENL protein. Top, the mutations found in the tumour mutants (T1 to T3) compared with the wild-type (WT) protein sequence (in single-letter amino-acid code). The mutated regions are in red. IDR, intrinsically disorderedregion; AHD, ANC1 homologue domain. b, c, Heat map representation of genes that are differentially expressed in HEK293 (b) and HK-2 (c) cells expressing WT or mutant ENL (with a fold change of 1.5 or more, and false discovery rate (FDR) of 0.01 or less). Red and blue indicate relative high and low expression, respectively (Supplementary Tables 1, 2). d, Gene ontology (GO) analyses of upregulated genes (‘UP’) that are common to T1, T2 and T3 mutant in HEK293 cells (n = 219 genes; Supplementary Table 3). P-values (−log10P) were obtained by two-tailed Fisher exact test, adjusted by Bonferroni correction. e, Gene-set-enrichment analysis (GSEA) plots evaluating the changes in the indicated gene signatures (n = 366, 80, 95 genes from top to bottom; Supplementary Table 10) induced by the T1 mutant in HEK293 cells. NES, normalized enrichment score. f, Representative haematoxylin and eosin (H&E) staining of mESC-derived kidney structures. Green and red arrowheads point to nephric tubule and glomerulus, respectively. The yellow dashed line outlines a region of blastema. Control group, empty vector or WT ENL; mutant group, T1, T2 or T3. g, Quantification of the surface area of blastema components. Mean ± s.e.m., one-sided Mann–Whitney ranked test; from left to right, n = 3, 3, 4, 4, 4 independent experiments. h, Representative immunofluorescence staining of induced kidney structures, labelling the nephric-tubule marker E-cadherin (green arrow) and the glomerular marker WT1 (pink arrow). The yellow dashed line outlines a region of blastema. DAPI, 4′,6-diamidino-2-phenylindole, a nuclear marker. Scale bars in f, h represent 50 μm. Data in f, h represent four independent experiments.
Impaired cell fate with ENL mutants
To investigate the functional relevance of these ENL mutations, we created isogenic HEK293 (human embryonic kidney 293) and HK-2 (human kidney-2) cells that stably expressed wild-type ENL or one of three distinct mutants (hereafter referred to tumour mutants, or T mutants) at equal levels (Fig. 1a and Extended Data Fig. 1b, c). The selected mutations include those that are most frequently observed in patients (T1)3, and represent both insertion (T1) and deletion (T2 and T3) mutational patterns (Fig. 1a). By comparison with the transcription induced by wild-type ENL, the transcriptional changes induced by all three mutants were remarkably similar and were highly enriched for pathways involved in developmental processes (Fig. 1b–d and Extended Data Fig. 1d, e). Notably, upon introduction of ENL mutants, there was a marked upregulation of genes that are enriched in embryonic kidney progenitors and Wilms tumour (Fig. 1e and Extended Data Fig. 1f, g). These genes include developmentally critical genes such as HOXA genes3 (Extended Data Fig. 1h, i). We observed a robust increase in the expression of HOXA genes when a mutant transgene was expressed at levels close to those of the endogenous ENL protein (Extended Data Fig. 1j, k). We next expanded the analysis to other ENL YEATS mutations (Extended Data Fig. 1a) that have been found so far in Wilms tumour and leukaemia (T4). All eight ENL mutations tested (T1–T8) were capable of inducing the expression of key target genes (Extended Data Fig. 1l, m), suggesting that they probably act through convergent mechanisms. Taken together, these results indicate that ENL YEATS mutations confer gain-of-function in transcription control and cause gene-expression changes that are involved in kidney differentiation and Wilms tumour.
Wilms tumour is characterized by persistent embryonic kidney tissues and arrested cellular differentiation5. This, coupled with the transcriptional changes induced by ENL mutations, prompted us to examine the impact of ENL mutations on embryonic kidney differentiation. To this end, we adopted a well established three-dimensional nephrogenesis assay6. In this assay, nephron progenitors are first derived from mouse embryonic stem cells (mESCs), and then induced to undergo robust tubulogenesis upon co-culture with embryonic spinal cord (Extended Data Fig. 2a). We observed signature gene-expression changes6 at each step of the differentiation process (Extended Data Fig. 2b). These included Hoxa genes (for example, Hoxa11) peaking at the induced metanephric mesenchyme, which contains nephron progenitors. We also identified differentiated nephron structures, including proximal tubules, distal tubules and glomeruli (Extended Data Fig. 2c–e). In the presence of ENL mutants (Extended Data Fig. 2f), there was a marked increase in the presentation of structures that pathologically resemble undifferentiated blastema components in human Wilms tumour (Fig. 1f–h). Unlike the well differentiated epithelium, these undifferentiated components were highly proliferative, and expressed the mesenchymal marker protein vimentin (Extended Data Fig. 3a–i). They also retained the expression of the Wilms tumour-1 protein (encoded by the WT1 gene) (Fig. 1h)–a transcription factor that is normally expressed in nephron progenitors and glomerular podocytes7. Collectively, these results show that ENL mutations impair kidney cell differentiation and give rise to tumourlike structures, suggesting a role in the development of Wilms tumour.
Enhanced chromatin occupancy by mutant ENL
Next, we investigated the mechanisms by which ENL mutations drive aberrant gene expression. Given that these mutations are clustered in the YEATS domain, which is important for ENL to localize to chromatin1,4, we first investigated whether the genomic distribution of ENL is altered by the mutations. We performed chromatin immunoprecipitation followed by high-throughput DNA sequencing (ChIP–seq) experiments to map Flag-tagged wild-type or mutant ENL in HEK293 and HK-2 cells. We found that all three mutant ENL proteins occupied largely similar genomic loci to wild-type ENL (Extended Data Fig. 4a–f), indicating that the mutations largely do not redistribute ENL to new target sites. Instead, each mutant exhibited enhanced occupancy at a subset of ENL target genes, and there was substantial overlap between the subsets occupied by each mutant, including the HOXA cluster (Fig. 2a and Extended Data Fig. 5a–e). Notably, increased occupancy of ENL mutants at these target genes correlated strongly with gene activation (Fig. 2b and Extended Data Fig. 5f).
Fig. 2 |. ENL mutations enhance chromatin occupancy by ENL and associated SEC complex to enforce active transcription.
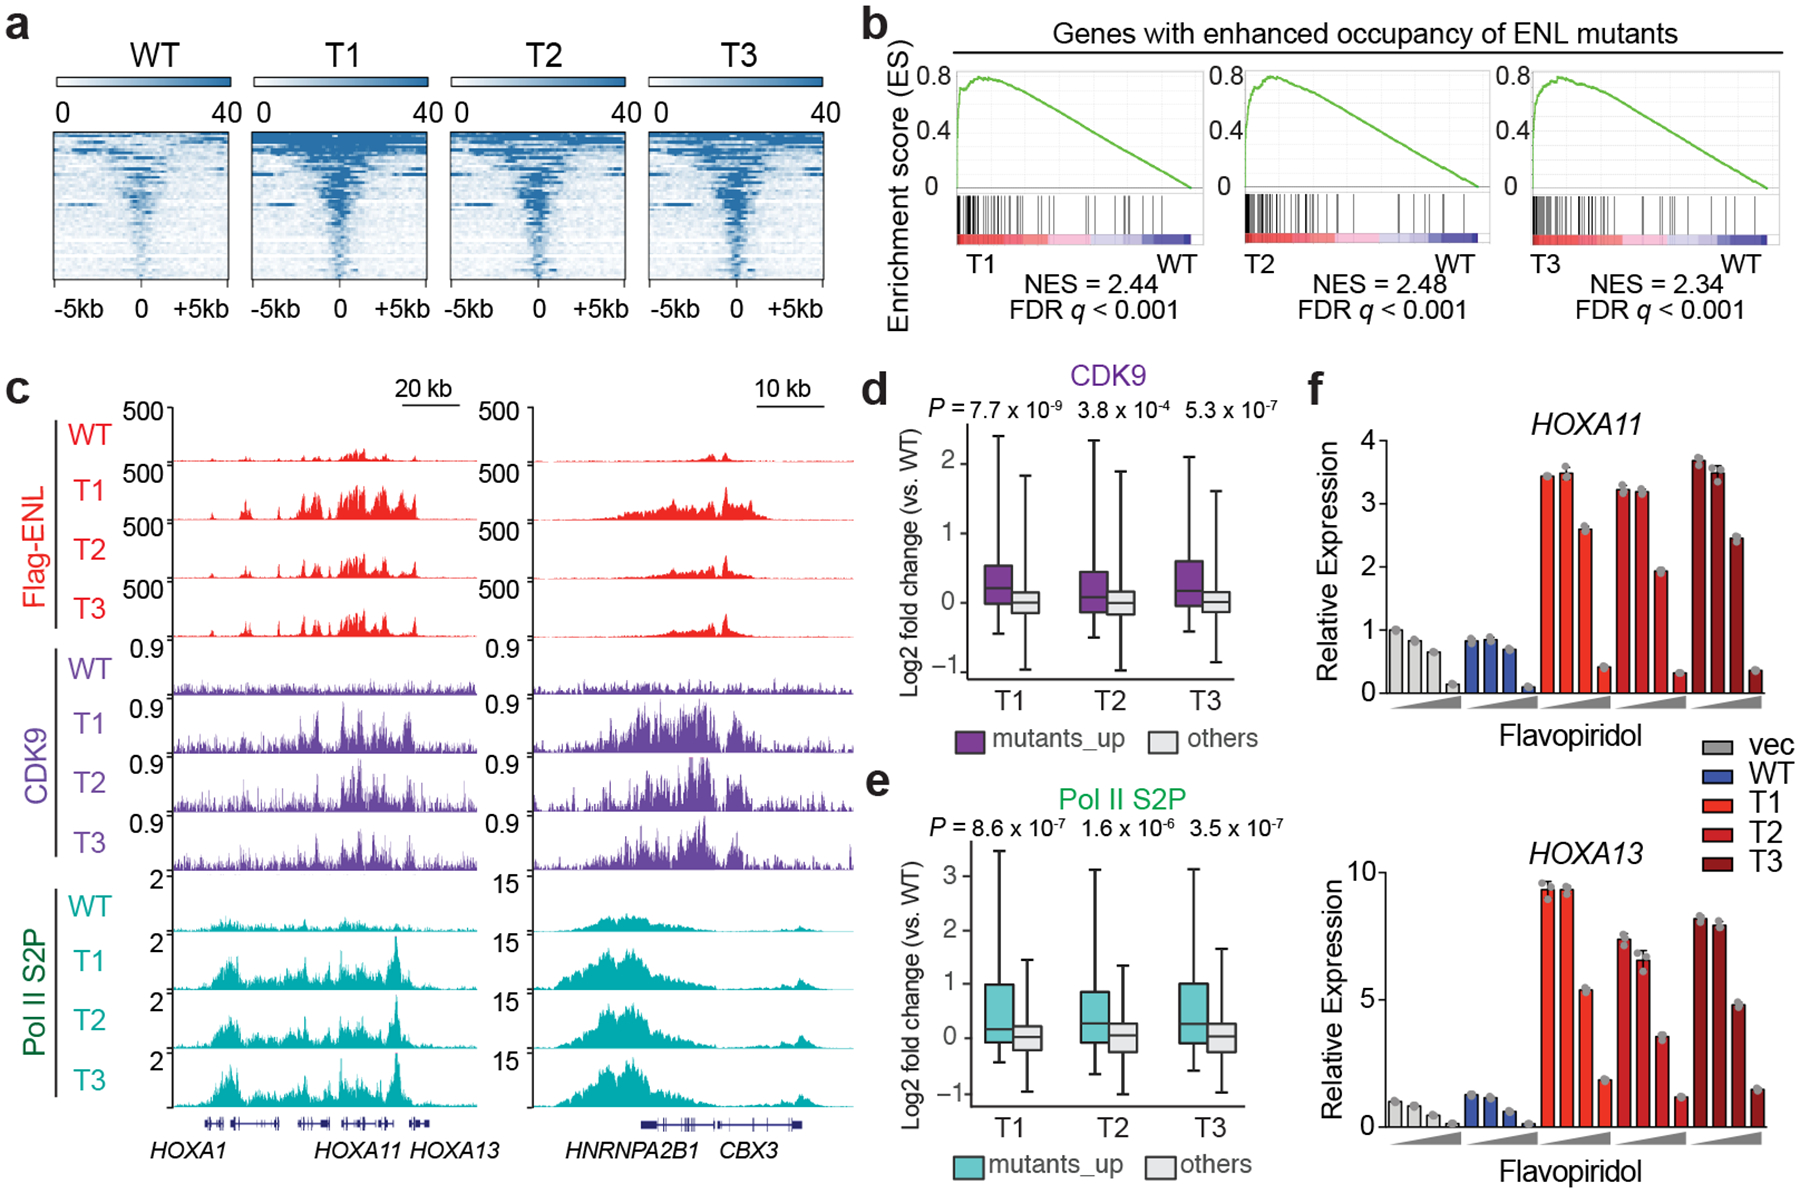
a, Heat map representation of ENL-bound chromatin peaks that show increased occupancy by T1, T 2 and T3 mutants compared with WT ENL (n = 54; Supplementary Table 6) in HEK293 cells. These heat maps are centred on ENL-bound peaks across a ±5-kb window. The colour key represents the signal density, with darker colour representing a more intense signal. b, GSEA plots showing that genes (n = 87; Supplementary Table 10) with enhanced occupancy by ENL mutants are upregulated in mutant-expressing HEK293 cells. c, Genome browser view of Flag–ENL, CDK9 and Pol II phosphorylated serine 2 (S2P) ChIP–seq signals at selected ENL target genes in HEK293 cells. d, e, Box plots showing log2 fold changes (T mutants versus WT) in CDK9 (d) or Pol II S2P (e) ChIP–seq signals at genes that have enhanced binding of ENL mutants (mutants_up, n = 87; Supplementary Table 10) and at the other genes in the genome (others) in H EK293 cells. The indicated P-values were obtained by one-sided Wilcoxon signed-rank tests. For box plots, the centre lines represent the median; the box limits are the 25th and 75th percentiles; and the whiskers show the minimum to maximum values. f, Analysis of messenger RNA expression (normalized to GAPDH expression) from the indicated ENL-target genes in HEK293 cells that express the indicated ENL or vector constructs upon treatment with flavopiridol for 3 h. Increasing dosages (0, 10 nM, 100 nM and 1,000 nM) are depicted by grey wedge. Means ± s.e.m., n = 3 technical replicates. Data represent two independent experiments.
We next investigated how increased occupancy of ENL mutants leads to aberrant gene activation. ENL resides in large protein complexes that are involved in transcription activation, notably the super elongation complex (SEC), elongation-assisting proteins (EAPs), and AFF1-ENL-P-TEFb complex (AEP), which contain overlapping subunits8–10 (for simplicity, we refer only to ‘SEC’ hereafter), as well as the DOT1L complex11. The interaction of ENL with these complexes is mediated by ENL’s ANC1 homologue domain (AHD) (Fig. 1a), and such interactions are not greatly affected by tumour mutations (Extended Data Fig. 6a). We then investigated whether the chromatin occupancy of these complexes is affected by ENL mutations. We first carried out ChIP–seq analyses to compare the binding of cyclin-dependent kinase 9 (CDK9)–a component of the SEC complex that phosphorylates RNA polymerase II (Pol II) at the serine 2 site on its carboxy-terminal tail12. We observed a marked increase in CDK9 occupancy, preferentially at genomic loci that exhibit enhanced binding of ENL mutants (Fig. 2c, d and Extended Data Fig. 6b, d). We also detected increased levels of elongation-specific phosphorylation of Pol II serine 2 at these same sites (Fig. 2c, e and Extended Data Fig. 6c, e). In agreement with this mechanism of gene activation, we found that ENL-mutant-induced gene activation was abolished by treatment with flavopiridol (Fig. 2f and Extended Data Fig. 6g), which inhibits kinase activity of CDK913.
By contrast, we did not observe a substantial change in DOT1L-mediated dimethylation of lysine 79 on histone H3 proteins at the same ENL-target genes (Extended Data Fig. 6f). A recent study14 proposed that increased interaction of ENL with PAF1 underlies the effects of the ENL mutations found in Wilms tumour. However, contrary to this proposed model, we did not observe changes in PAF1 binding as a result of ENL mutations (Extended Data Fig. 7a). Moreover, depletion of PAF1 (Extended Data Fig. 7b, c) had minimal effects on the chromatin occupancy of ENL mutants and the activation of target genes (Extended Data Fig. 7d–f). Together, these results suggest that ENL YEATS mutations drive aberrant gene expression mainly by increasing chromatin occupancy by ENL and associated SEC proteins. This observation prompted us to further investigate the mechanisms underlying the enhanced ENL chromatin occupancy driven by the mutations.
Acylation binding required by ENL mutants
Using the structure of the ENL YEATS domain1, we mapped the tumour mutations to a region that is distant from the acetyl-lysine-binding pocket (Fig. 3a). As such, we wondered whether ENL T mutants could bypass the acetyl-lysine-binding activity that is ordinarily required for chromatin targeting. To this end, we introduced a point mutation (Y78A, referred to as a ‘pocket mutation’ hereafter) that is known to abolish the acetyl-lysine-binding activity of the YEATS domain1 into either wild-type or T-mutant ENL (Extended Data Fig. 8a). As expected, this pocket mutation severely reduced the chromatin occupancy of the otherwise wild-type ENL. Moreover, the chromatin occupancy of T mutants was also diminished upon introduction of the pocket mutation (Fig. 3b, c and Extended Data Fig. 8b–f). Consequently, tumour-mutation-induced activation of target genes was blunted (Fig. 3d). These results indicate that, like wild-type ENL, T-mutant ENL still requires its reader function for proper genomic localization.
Fig. 3 |. Acylation-reading activity is required for enhanced chromatin occupancy by ENL T mutants.
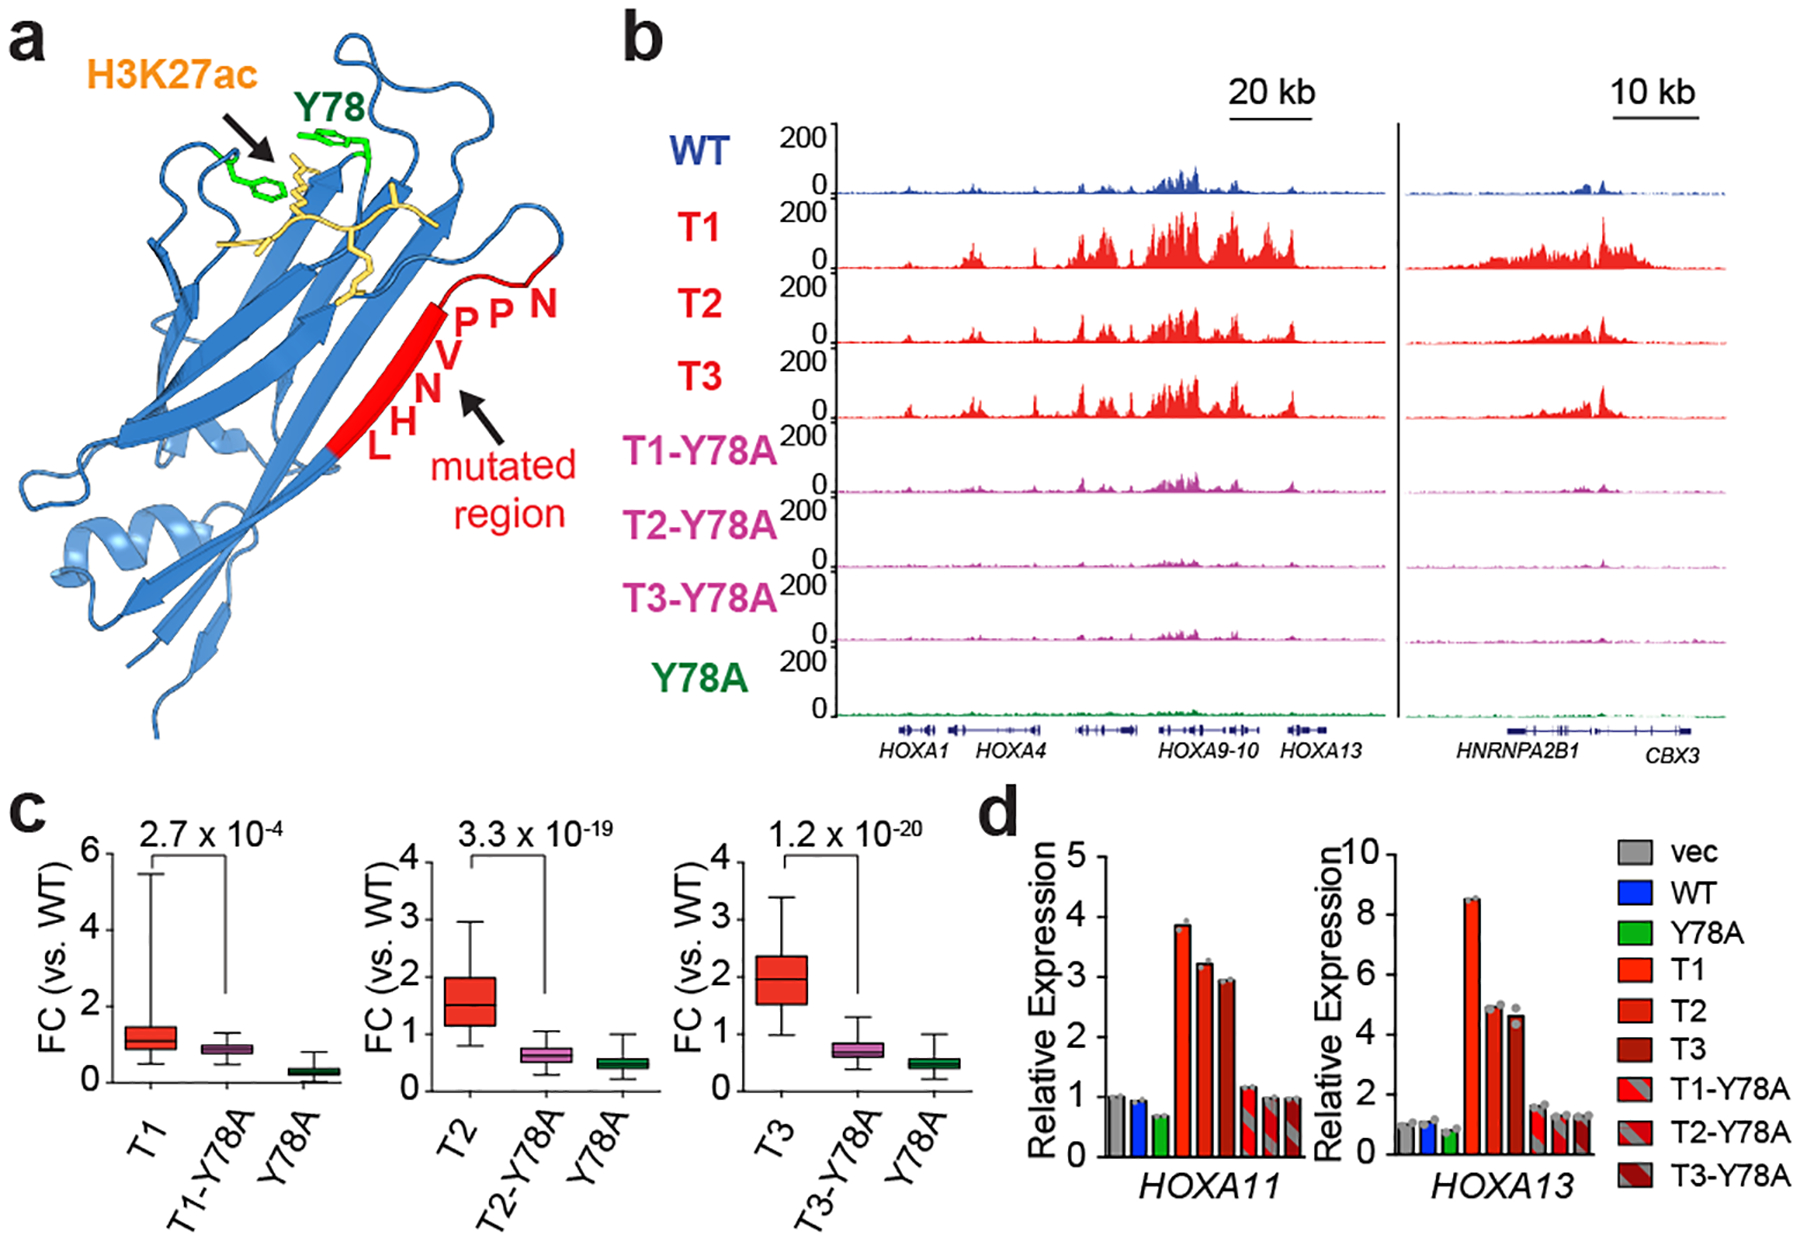
a, Structure (Protein DataBank code 5J9S) of the ENL YEATS domain (blue ribbon) bound to a histone H3 peptide comprising an acetylated lysine 27 residue (H3K27ac, yellow), showing a key ENL residue (Y78, green) that mediates recognition of histone acetylation and the region that is mutated in cancer (red). b, Genome browser view of the ChIP–seq signals from different Flag–ENL proteins at the genes indicated at the bottom in HEK293 cells. c, Box plots showing the fold change (FC) in Flag–ENL ChIP–seq signals (relative to wild-type ENL) at peak regions that bear enhanced occupancy of ENL T mutants (n = 54) in HEK293 cells. Centre lines represent medians, the box limits are the 25th and 75th percentiles and the whiskers show the range of values. P-values were obtained using paired two-tailed t-tests. d, mRNA expression analysis (normalized to GAPDH) of selected genes in HEK293 cells expressing the indicated constructs. Data represent means from n = 2 technical replicates, and results are representative of three independent experiments.
We then considered the possibility that ENL tumour mutations might drive enhanced chromatin occupancy by increasing the acetyl-lysine-binding affinity albeit at a distance from the defined binding pocket. To test this hypothesis, we performed quantitative isothermal titration calorimetry (ITC) assays using the purified wild-type or mutant ENL YEATS domain and a histone H3 peptide comprising acetylated lysine 27. We found that although each T mutant showed variable degrees of interaction with the acetylated histone peptide, none of them exhibited an increase in acetyl-lysine binding compared with the wild type (Extended Data Fig. 8g, h). In addition, these tumour mutations did not increase the binding to other, longer acylations, such as crotonylation (Extended Data Fig. 8i)–another histone modification that the YEATS domain recognizes15. Together, these results strongly suggest that, although mutant ENL still depends on its reader function for chromatin targeting, tumour mutations enhance ENL accumulation at target sites through a mechanism that is distinct from the reading of histone acylation.
Increased self-association of ENL mutants
Given the similar genomic localization of wild-type and mutant ENL proteins (Extended Data Fig. 4a–f), we next speculated that tumour mutations might drive the self-mediated recruitment of ENL to chromatin. To test this possibility, we co-expressed enhanced yellow fluorescent protein (eYFP)-labelled ENL fused with LacI and mCherry–ENL without LacI (Fig. 4a) in cells that contain a synthetic Lac operator (LacO) array in the genome16, and examined the recruitment of ENL to the LacO locus. As expected, the LacO array recruited a large number of eYFP–ENL–LacI molecules via targeted DNA binding, forming a concentrated local interaction hub on the chromatin (Fig. 4b). We predicted that mCherry–ENL becomes enriched at the array only when it can associate with the co-expressed eYFP–ENL–LacI through ENL self-association. We observed a modest self-association of wild-type ENL at the array, while all three T mutants showed much stronger self-mediated recruitment (Fig. 4b, c). These results suggest that tumour mutations promote self-reinforced recruitment of ENL, and that this can occur independently of the initial recruitment mechanism (for example, histone acylation binding) and the underlying genomic target sequences.
Fig. 4 |. Tumour mutations enhance ENL self-association to drive reinforced recruitment and gene activation.
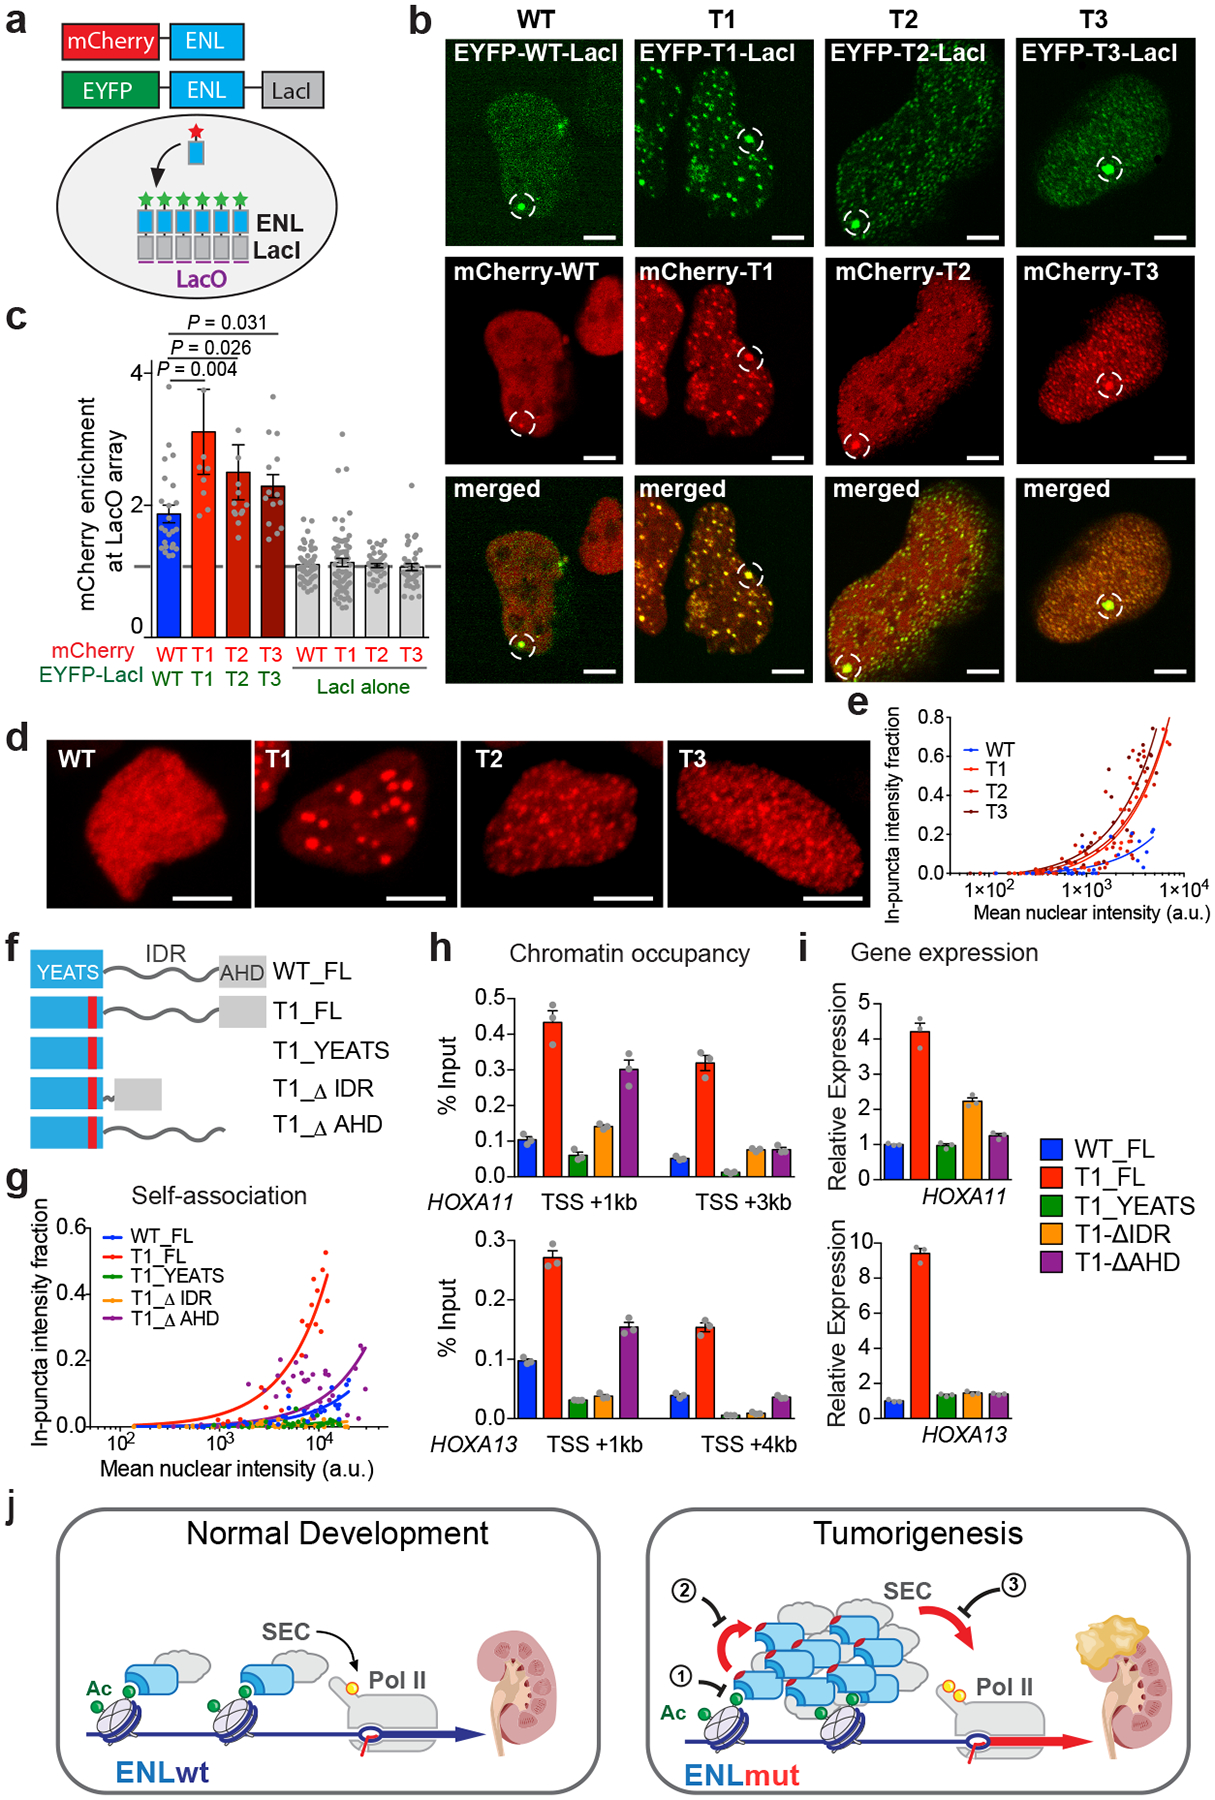
a, Testing of ENL self-mediated recruitment to the LacO array. mCherry–ENL can be recruited to the array only through self-association with eYFP-ENL-LacI proteins that have already been recruited. b, Fluorescence images of LacO-containing U2OS cells that have co-expressed various combinations of mCherry–ENL and eYFP-ENL-LacI. White dashed circles indicate the LacO array. Scale bar, 5 μm. c, Quantification of mCherry–ENL enrichment at the LacO array bound by various eYFP-ENL-LacI proteins. Enrichment of mCherry above an expression level of 1 suggests ENL-ENL sel-fassociation. Shown are means ± s.e.m.; n = 24, 9, 13, 14, 51, 62, 39, 38 cells from left to right; one-tailed unpaired t-test. d, Fluorescence images of HEK293 cells that express similar levels of WT or mutant mCherry–ENL. Scale bar, 5 μm. e, g, Fraction of in-puncta fluorescence intensity in the nucleus of HEK293 cells that express the indicated mCherry–ENL constructs as a function of mean nuclear intensity. Each dot represents one cell. f, Schematics of full-length (FL) or different deletion forms of ENL. AU, arbitrary units. h, ChIP with quantitative PCR (ChlP-qPCR) analysis of the indicated Flag–ENL constructs at HOXA genes in HEK293 cells. TSS, transcription start site. i, mRNA expression analysis (normalized to GAPDH) of HOXA genes in HEK293 cells expressing equal levels of the indicated ENL constructs. The data in panels h, i represent means ± s.e.m. from n = 3 technical replicates; independent experiments were repeated three times with similar results. j, During normal kidney development, wild-type ENL (ENLwt), a component of the SEC, binds to acetylated histone proteins in chromatin. The CDK9 component of the SEC phosphorylates RNA polymerase II (yellow circle on pol II), resulting in transcription appropriate to normal development. By contrast, mutant ENL (ENLmut) shows increased self-association and increased phosphorylation of pol II, resulting in aberrant gene activation that contributes to the development of Wilms tumour. Potential strategies to inhibit the oncogenic effects of ENL mutations are indicated by numbers 1–3.
We also noticed that mutant, but not wild-type, ENL formed many smaller puncta outside of the LacO array (Fig. 4b), further supporting the idea of stronger self-association driven by the mutations. Consistently, we observed the formation of discrete puncta throughout the nucleus by T mutants over a wide range of expression levels (Fig. 4d, e and Extended Data Fig. 9a) when we expressed mutant mCherry–ENL alone. By contrast, wild-type mCherry–ENL was largely diffused throughout the nucleus when expressed at the same levels as the mutants. Of note, the puncta formed by T1 mutants were noticeably larger than those formed by T2 and T3 mutants (Extended Data Fig. 9b), correlating with the highest self-mediated recruitment of T1 to the LacO array (Fig. 4b, c). Notably, T1 exhibits a mutational pattern (an insertion) that is distinct from that of T2 and T3 mutants (deletion). Introduction of the Y78A mutation into all three T mutants had minimal impacts on puncta formation (Extended Data Fig. 9c, d). These results further support the conclusion that tumour mutations promote ENL self-association through a mechanism that is decoupled from the acylation-reading function of ENL.
Further characterization of the puncta formed by ENL mutants revealed that they are spherical in shape (Fig. 4d), undergo fusion on contact (Supplementary Video S1) and are highly dynamic (Extended Data Fig. 9e, f). These features are characteristics of phase-separation-driven biomolecular condensates in other biological contexts17–19–an extreme form of local high-concentration hubs mediated by weak and dynamic multivalent molecular interactions. These results suggest that the self-association of mutant ENL involves multivalent interactions, which could be achieved by proteins composed of modular interaction domains or intrinsically disordered regions17. ENL contains a well structured YEATS domain, a predicted intrinsically disordered region (IDR), and an AHD region that mediates ENL’s interaction with binding partners such as SEC (Fig. 4f). To determine which regions of ENL are required for mutation-driven self-association and function, we generated a series of truncated ENL proteins harbouring the T1 mutation (Fig. 4f). A YEATS domain alone with the T1 mutation was not sufficient to drive the formation of nuclear puncta (Fig. 4g and Extended Data Fig. 9g), suggesting that regions outside of the YEATS domain are also involved. Supporting this, deletion of the IDR, and to a lesser extent of the AHD, compromised T1-driven ENL self-association and reduced puncta formation (Fig. 4g and Extended Data Fig. 9g). Enhanced chromatin occupancy driven by the T1 mutation was also attenuated to varying degrees by deletion of the IDR or AHD (Fig. 4h and Extended Data Fig. 9h). Lastly, we observed a substantial decrease in T1-induced gene activation upon deletion of the IDR or AHD (Fig. 4i). Of note, despite retaining partial self-association and chromatin targeting, deletion of the AHD in T1 mutant ENL resulted in a profound defect in gene activation, further strengthening the conclusion that AHD-mediated interaction with SEC proteins is critical for ENL mutation-driven transcriptional control. These results suggest that, in addition to the YEATS domain, the IDR and, to a lesser extent, the AHD domain are also involved in mutation-driven ENL self-association, and provide further evidence that functionally links the enhanced self-association propensity to chromatin occupancy and gene activation.
Discussion
In this study, we have shown that cancer-associated hotspot mutations in a chromatin reader drive enhanced self-association (Fig. 4j). This gain-of-function property, coupled with its acylation-reading activity, is functionally required for mutant ENL to be recruited to chromatin and to control gene expression, thus providing a previously unrecognized mechanism for driving developmentally critical genes into an extended active state to restrict cellular differentiation (Fig. 4j). These findings shed new light on how the dysregulation of chromatin-mediated mechanisms derails normal cell-fate control towards an oncogenic path, and unveil potential mechanism-guided strategies for inhibiting the oncogenic function of ENL mutations. These strategies include disrupting the interaction between the ENL YEATS domain and acylated histones, blocking the self-association of mutant ENL and inhibiting the activity of ENL-associated SEC (Fig. 4j). Notably, the enhanced self-association conferred by tumour mutations enables overexpressed ENL protein to form local hubs that involve weak and dynamic multivalent interactions and harbour characteristics of phase separation. Future studies are needed to probe the dynamics and regulation of mutant-ENL-driven interaction hubs at target chromatin, and to evaluate the extent to which these interaction hubs resemble recently described transcriptional clusters16,18,19. It remains to be seen whether other chromatin-associated proteins are hijacked in cancer in a similar fashion, but these gain-of-function mutations involving the acylation reader ENL in Wilms tumour and leukaemia expand our knowledge of the types of diseases that are caused by ‘misinterpreting’ histone modifications. These pathologies, together with the rapidly growing list of those that arise from ‘mis-writing’ or ‘mis-erasing’ histone marks20, highlight important roles of histone modifications in human health and disease that warrant further investigation.
Online content
Any methods, additional references, Nature Research reporting summaries, source data, supplementary information, acknowledgements, peer review information; details of author contributions and competing interests; and statements of data and code availability are available at https://doi.org/10.1038/s41586-019-1842-7.
Reporting summary
Further information on research design is available in the Nature Research Reporting Summary linked to this paper.
Data availability
The ChIP–seq and RNA-seq data have been deposited in the Gene Expression Omnibus database under accession number GSE125186. All other raw data generated or analysed during this study are included in this paper, the Extended Data figures, and the Supplementary Information.
Extended Data
Extended Data Fig. 1 |. ENL mutations induce transcriptional changes that are implicated in developmental programs and in Wilms tumour.
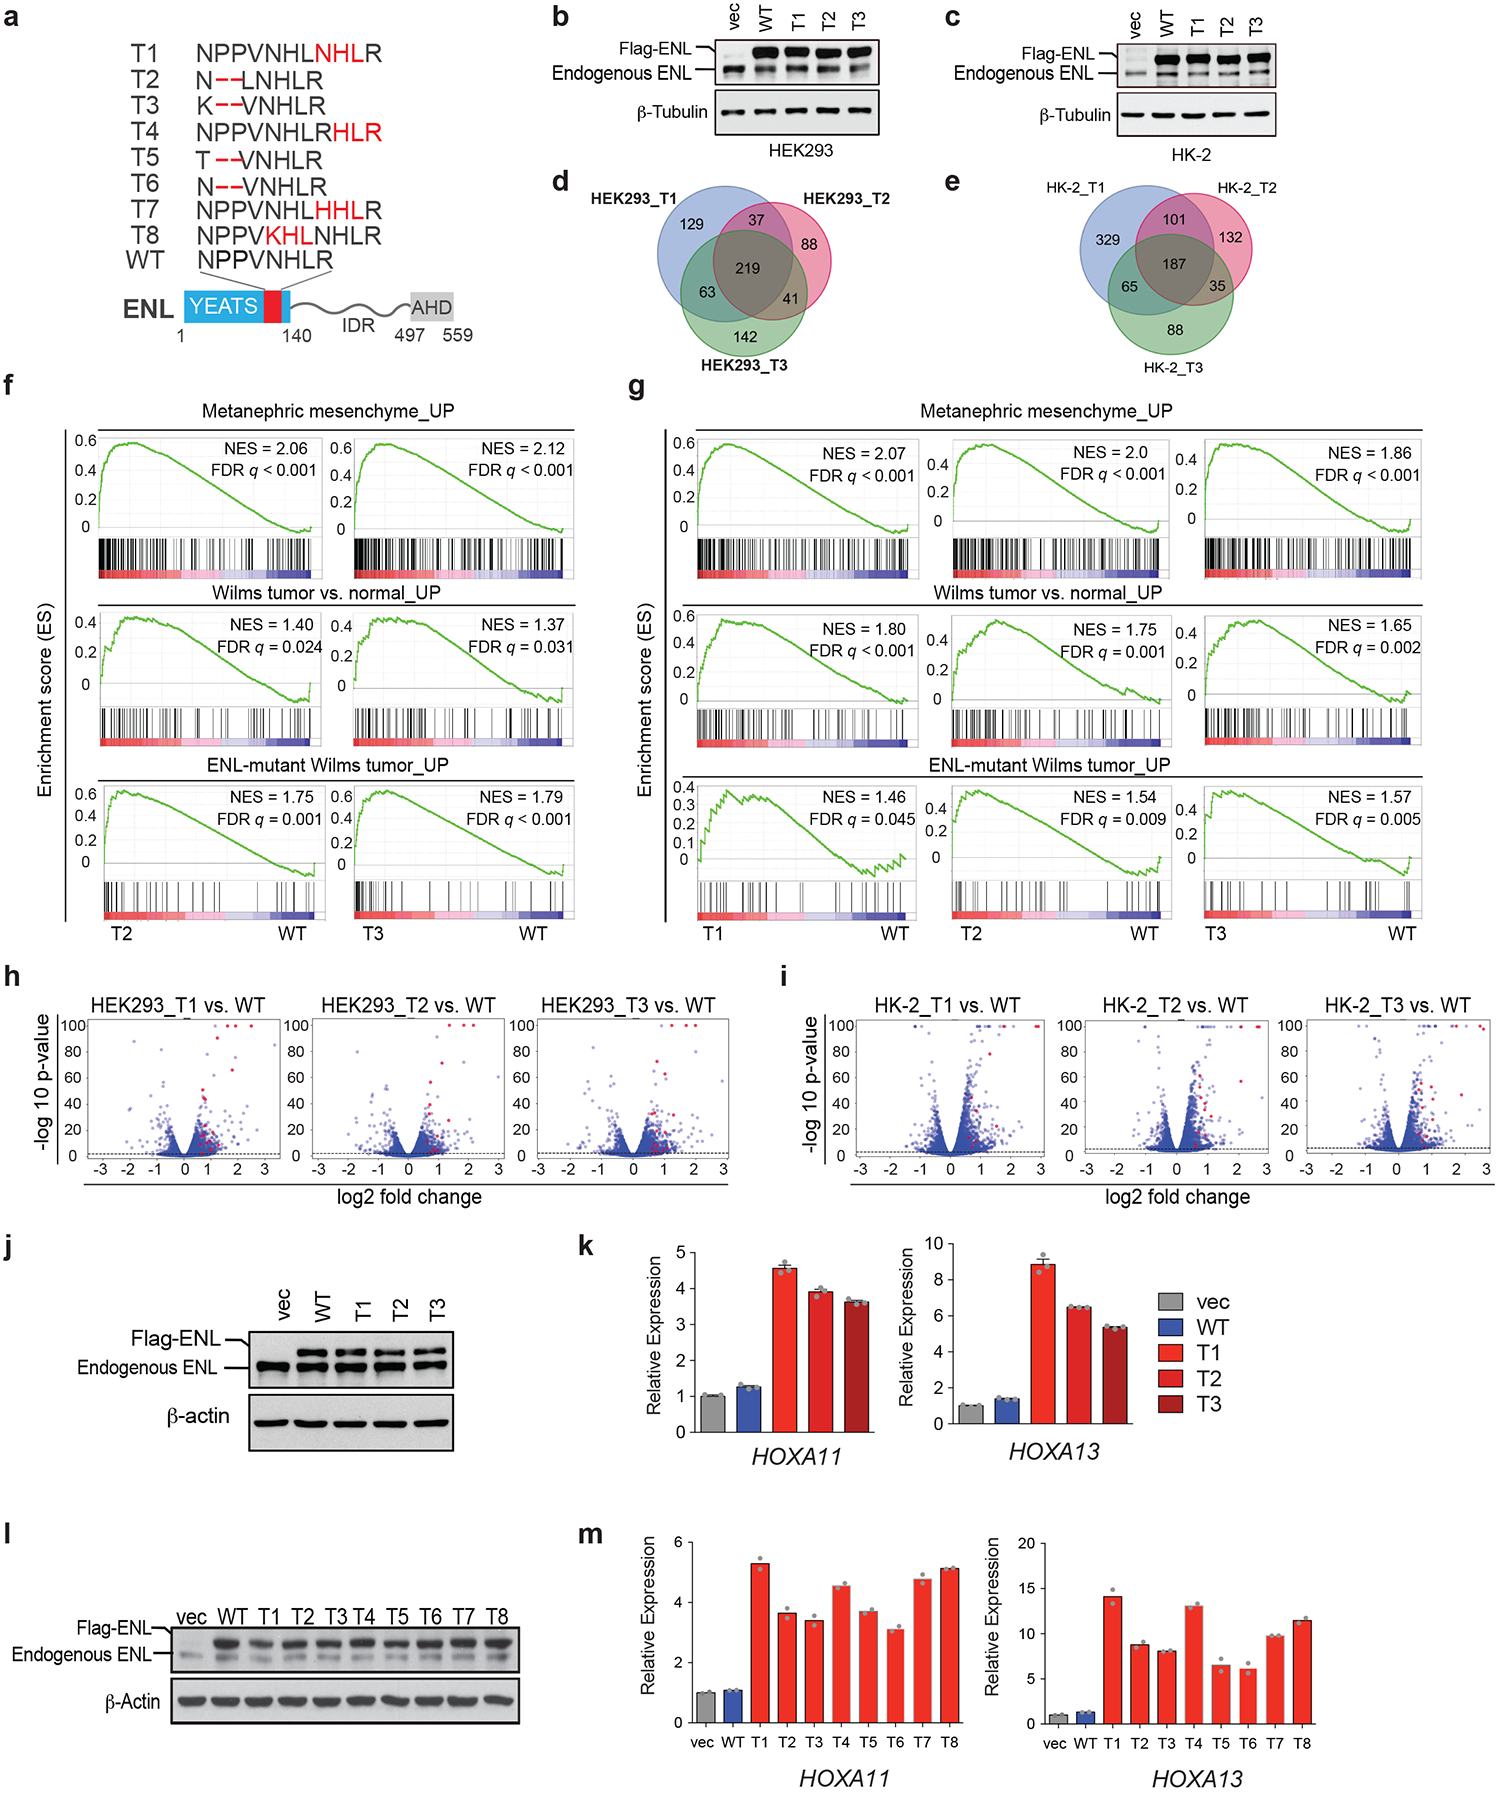
a, Bottom, ENL protein structure, with the region that is mutated in cancer shown in red. Above, amino-acid sequences of the T1 to T8 tumour-associated mutations and the corresponding WT region. b, c, Western blots showing the levels of ectopically expressed WT or mutant Flag–ENL proteins in HEK293 (b) and HK-2 (c) cells. Independent experiments were repeated four times with similar results. β-Tubulin is used as a loading control. d, e, Venn diagrams showing the number and overlap of genes for which expression is significantly upregulated upon expression of mutant ENL as compared with WT ENL in HEK293 (d) and HK-2 (e) cells. Genes with a fold change of 1.5 or more and a false discovery rate (FDR) of 0.01 or less are considered to be significantly upregulated. f, g, GSEA plots evaluating the changes in the indicated gene signatures upon expression of the indicated ENL mutants compared with WT in HEK293 (f) and HK-2 (g) cells. h, i, Volcano plots of RNA-sequencing data demonstrating the −log10 P-values versus log2 fold changes in HEK293 (h) and HK-2 (i) cells. HOXA genes are highlighted in red. P-values were determined by two-tailed exact test, adjusted by FDR. j, Western blot showing the close-to-endogenous levels of ectopically expressed WT or mutant Flag–ENL in HEK293 cells. Independent experiments were repeated three times with similar results. k, mRNA expression analysis (normalized to GAPDH) of selected ENL target genes in HEK293 cells (from panel j) expressing the indicated constructs. vec, vector control. Data represent mean ± s.e.m., n = 3 technical replicates, independent experiments were repeated three times with similar results. l, western blot showing the protein levels of ectopically expressed wildtype or indicated mutants (as illustrated in a) Flag–ENL in HEK293 cells. Experiment repeated three times independently with similar results. m, mRNA expression analysis (normalized to GAPDH) of selected ENL target genes in HEK293 cells (from panel l) expressing the indicated constructs. Vec, vector control. Data represent means from n = 2 technical replicates; results are representative of three independent experiments. For gel source data (b, c, j, l), see Supplementary Fig. 1.
Extended Data Fig. 2 |. Three-dimensional nephron structures derived from mESCs.
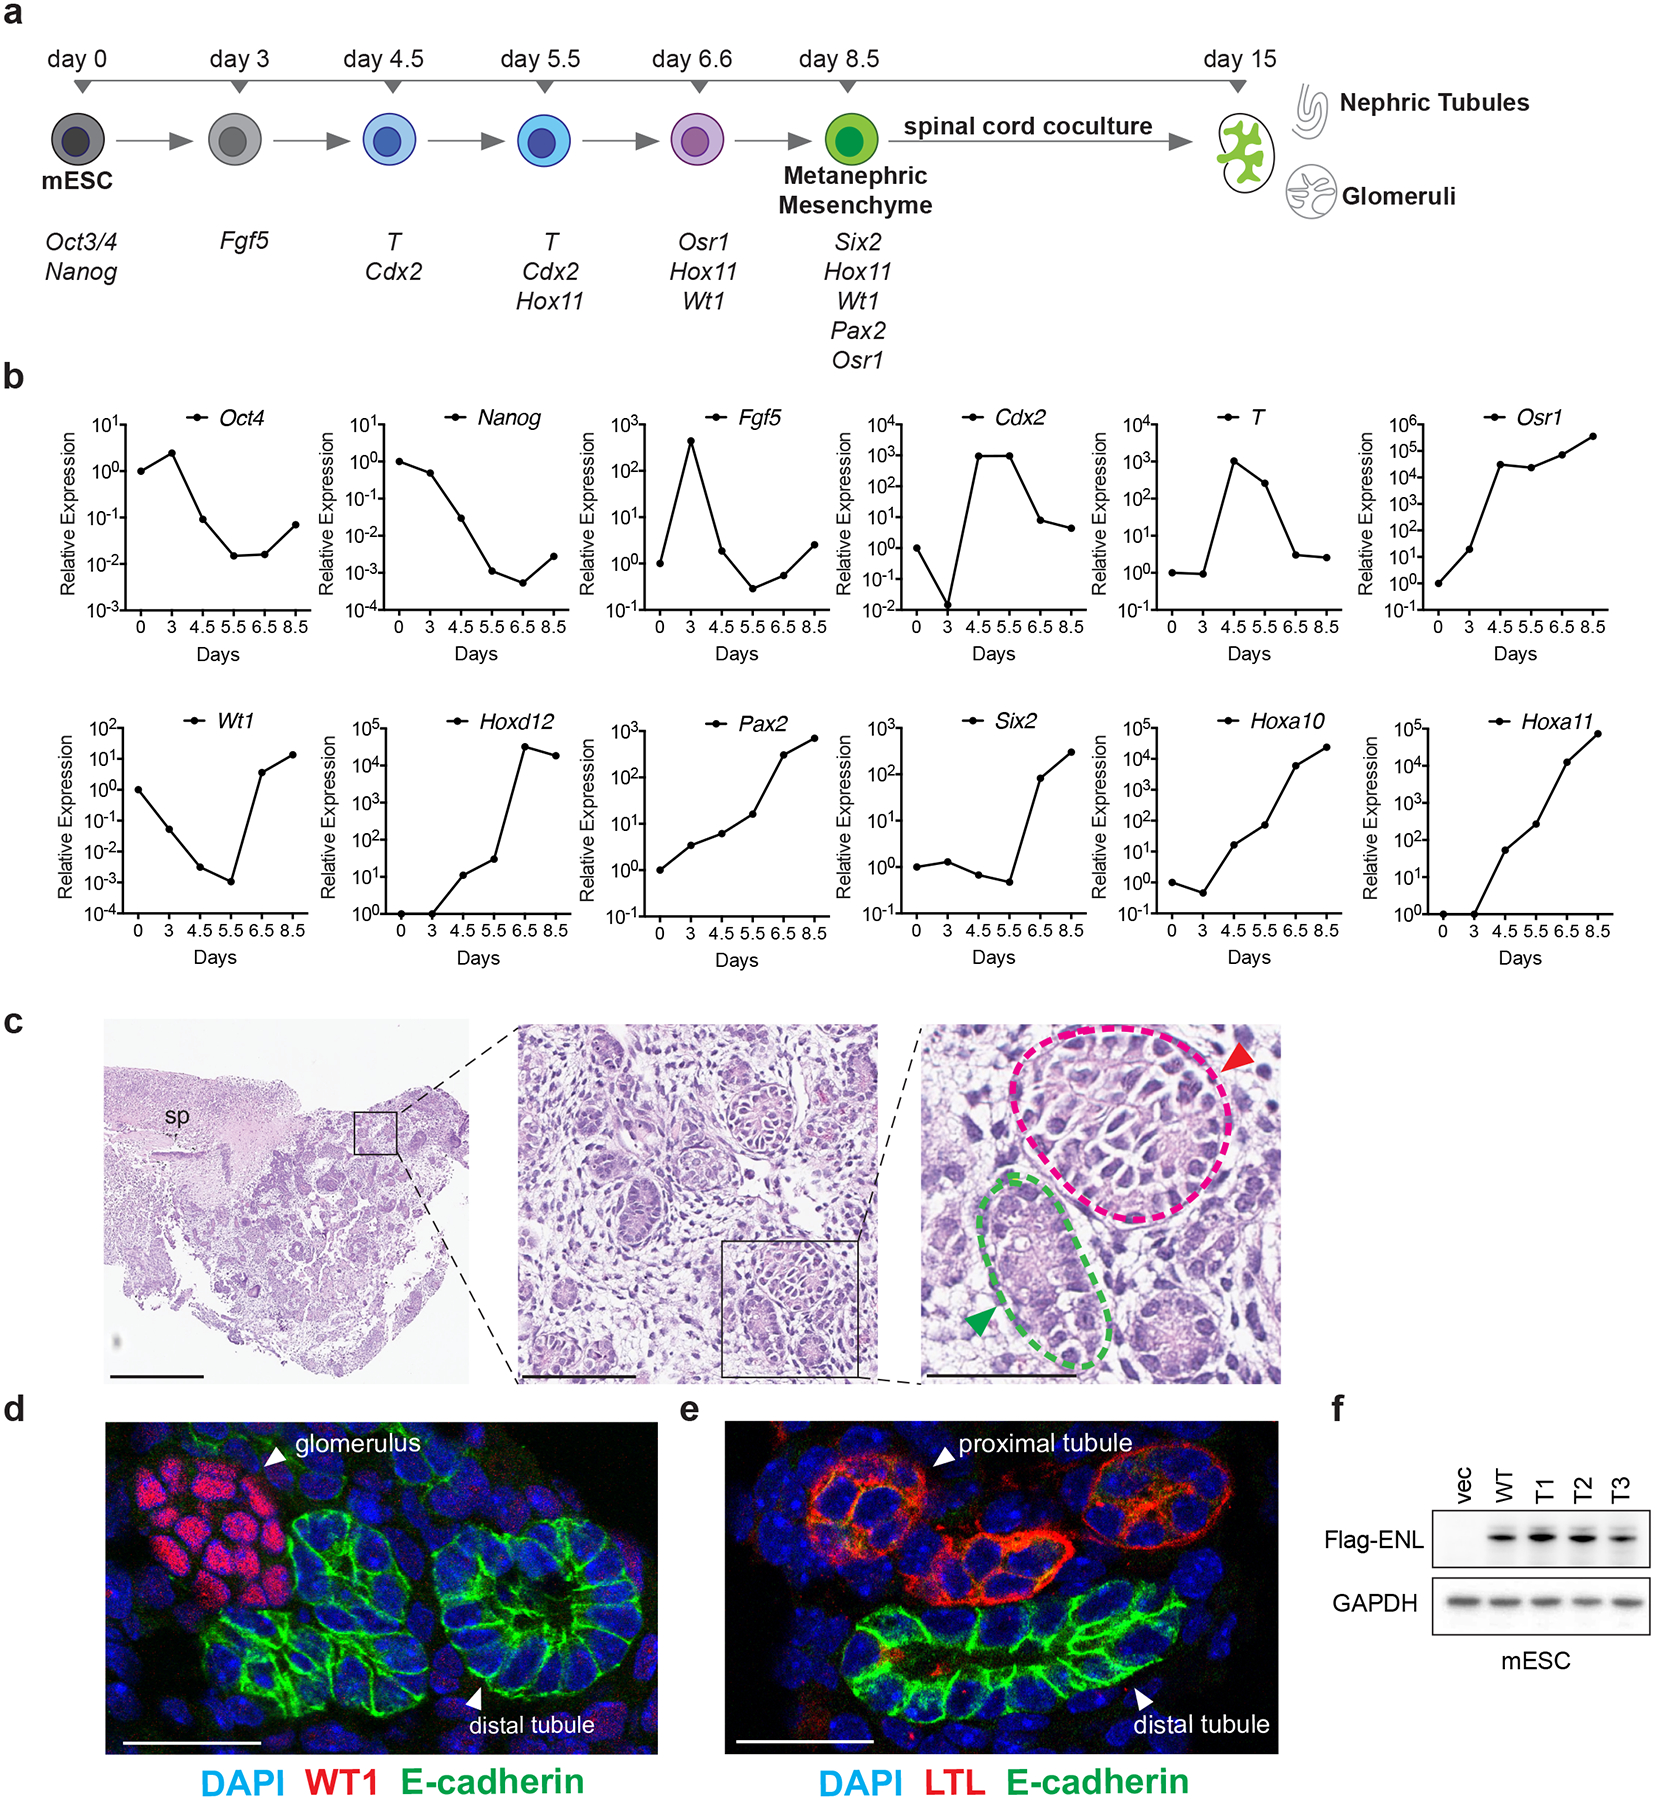
a, Diagram showing the in vitro directed differentiation assay. Signature genes expressed at each step are shown at the bottom. T, the Brachyury gene. b, mRNA expression analysis (normalized to Gapdh) of the indicated genes at different time points during the assay. Data shown are representative of two independent experiments. c, Haematoxylin and eosin staining shows the induced embryoid body co-cultured with the spinal cord (sp). Green and red arrowheads point to nephric tubule and glomerulus, respectively. Scale bars: left, 500 μm; middle, 100 μm; right, 50 μm. d, Representative immunofluorescence staining of induced kidney structures for the nephric distal-tubule marker E-cadherin (green) and the glomerular marker WT1 (red). DNA is stained with DAPI (blue). Scale bar, 25 μm. e, Representative immunofluorescence staining of induced kidney structures for E-cadherin (green) and the proximal-tubule marker lotus tetragonolobus lectin (LTL, red). DNA was stained with DAPI (blue). Scale bar, 25 μm. f, Western blot showing the protein levels of ectopically expressed WT or mutant Flag-tagged ENL in mESCs. For gel source data, see Supplementary Fig. 1. For panels c–f, independent experiments were repeated three times with similar results.
Extended Data Fig. 3 |. Characterization of ENL-mutant kidney structures.
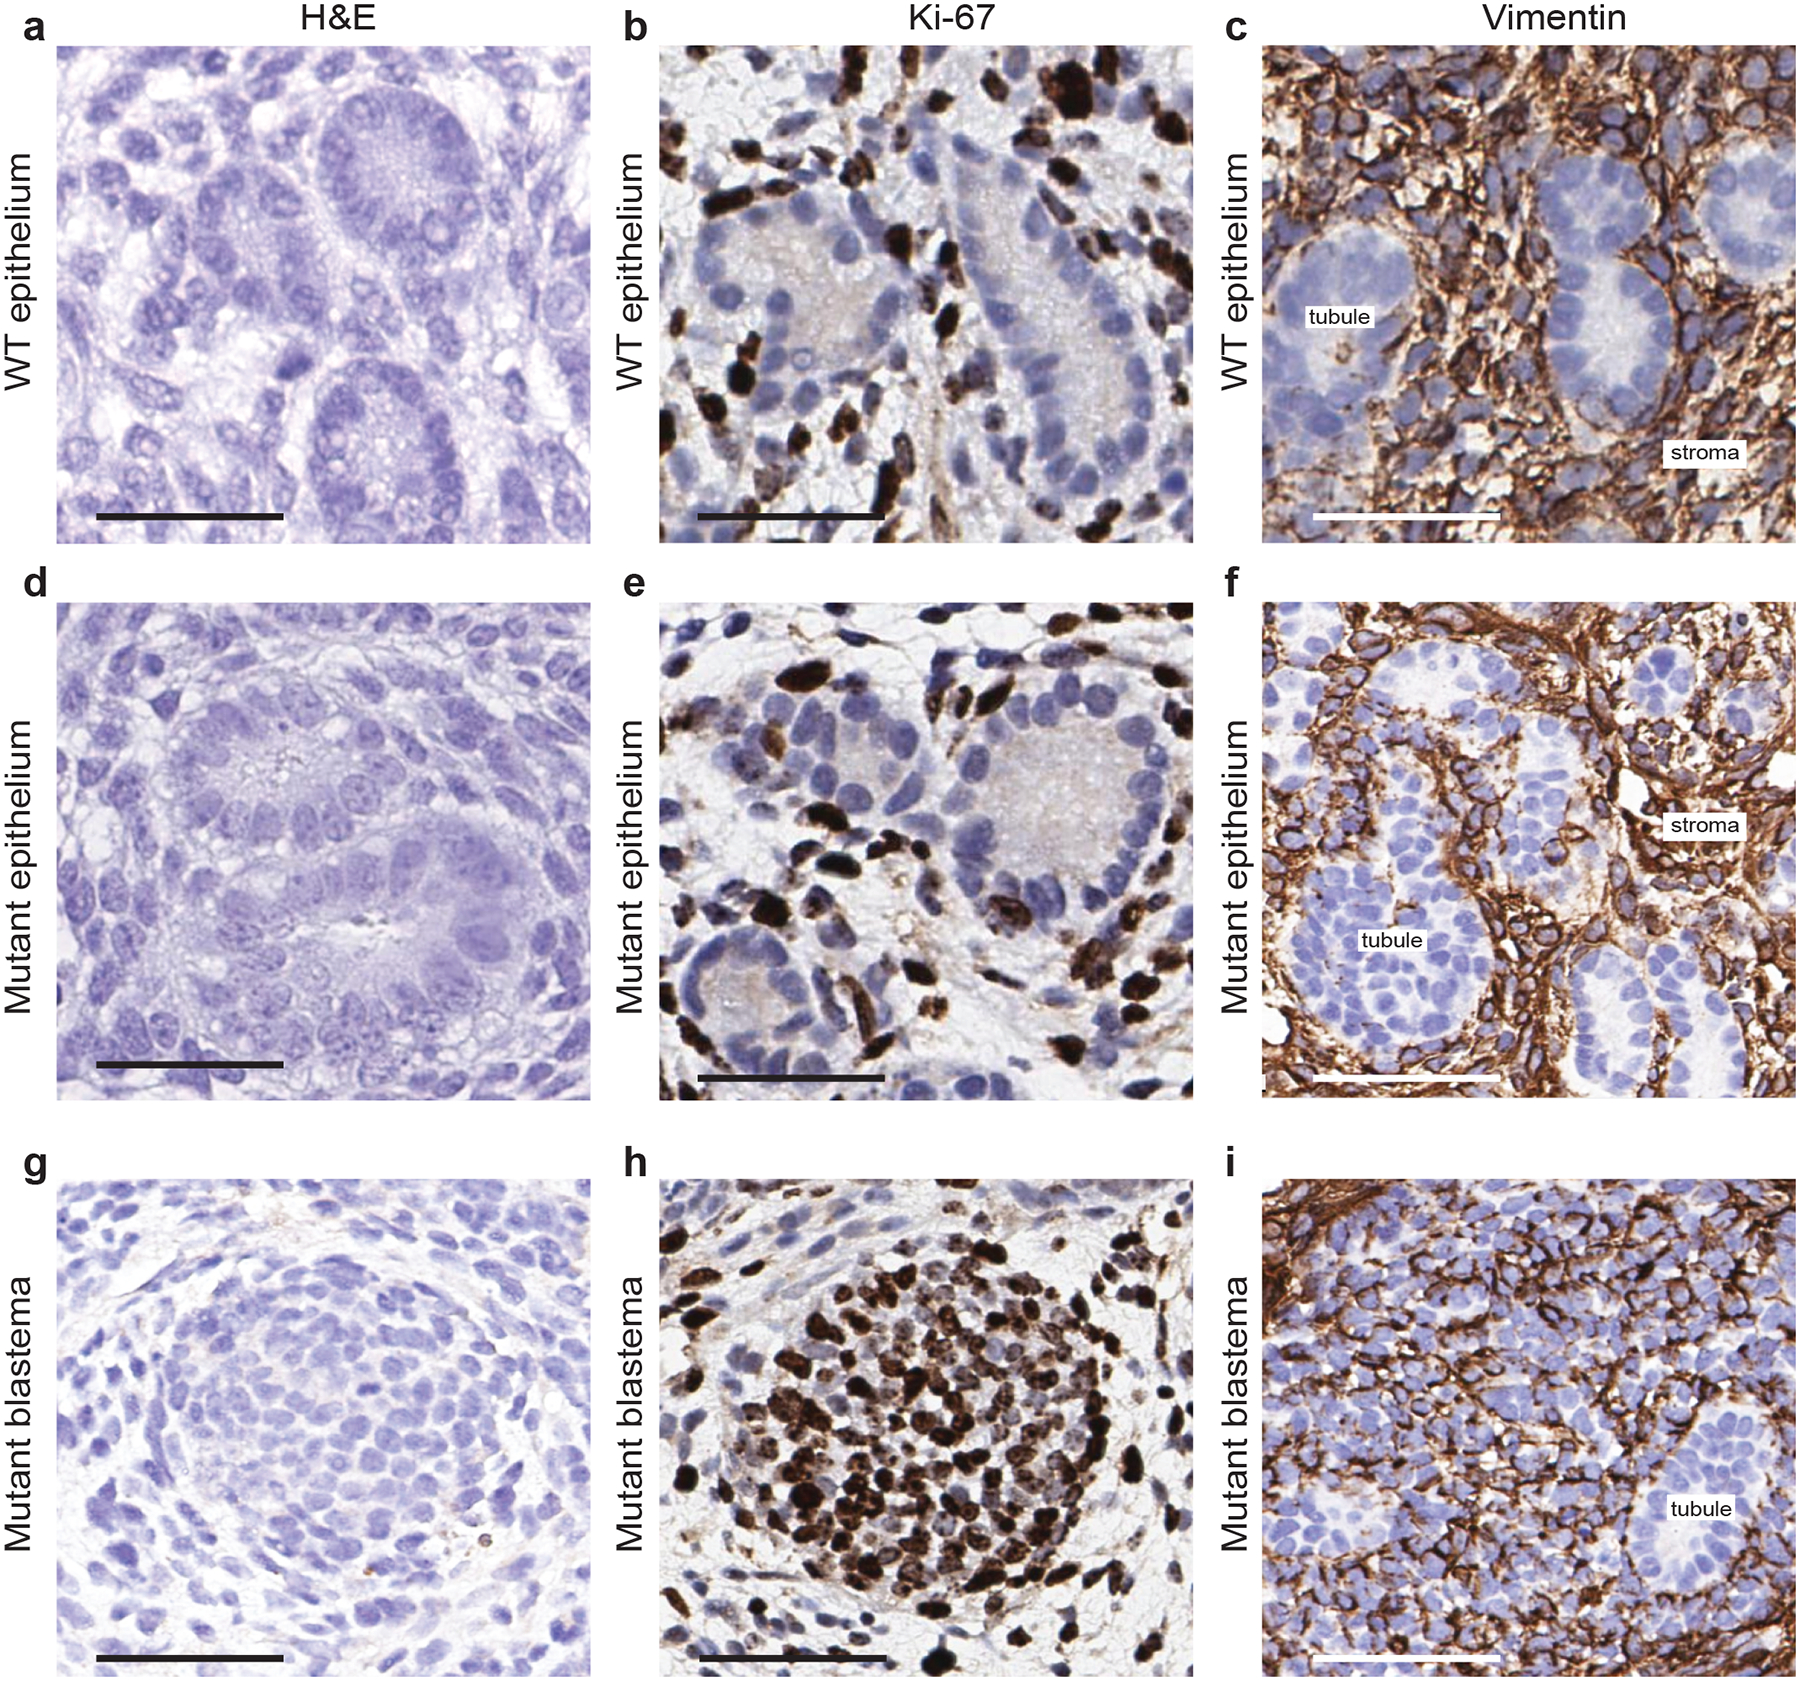
a, d, g, Representative haematoxylin and eosin staining of the indicated kidney structures. b, e, h, Representative immunohistochemistry staining of the indicated kidney structures for the proliferation marker Ki-67. c, f, i, Representative immunohistochemistry staining of the indicated kidney structures for the mesenchymal marker vimentin. In panels c, f, the vimentin-positive cells shown are stroma cells. In panel i, the vimentin-positive cells shown are mostly blastema components. a–c, WT epithelium; d–f, mutant epithelium; g–i, mutant blastema. All experiments were repeated twice with similar results. Scale bars, 50 μm.
Extended Data Fig. 4 |. ENL mutants occupy largely the same genomic loci as the wild-type protein.
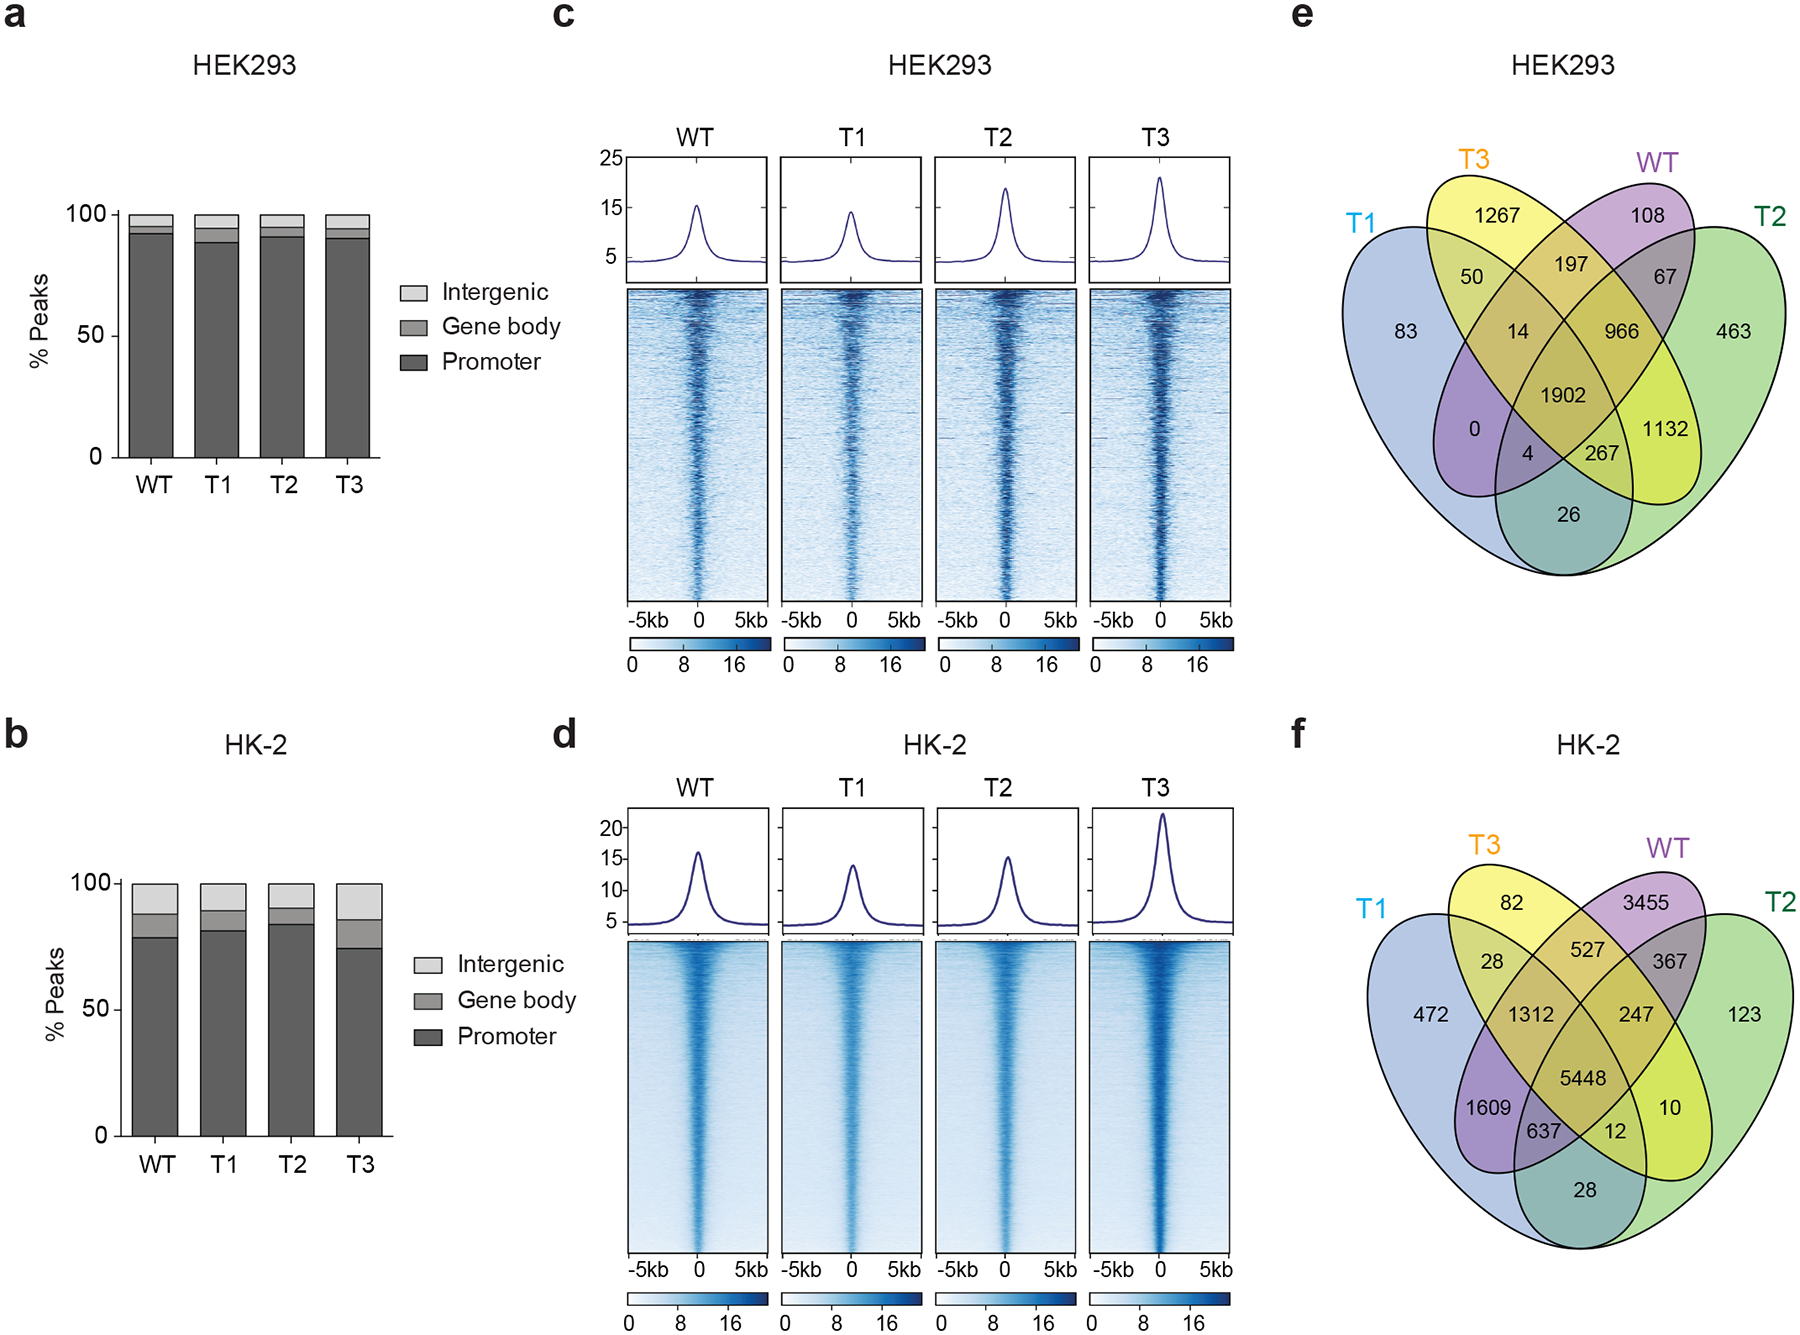
a, b, Bar graphs showing the genomic distribution of Flag–ENL-bound peaks in HEK293 (a) and HK-2 (b) cells. c, d, Heat maps of normalized WT or mutant Flag–ENL ChIP–seq signals in HEK293 (c) and HK-2 (d) cells, centred on ENL-bound peaks across a ±5-kb window. The colour key represents the signal density, with darker colour representing more signal. More details are in Supplementary Tables 4, 5. e, f, Venn diagrams showing the overlap of WT or mutant ENL-bound peaks in HEK293 (e) and HK-2 (f) cells.
Extended Data Fig. 5 |. Enhanced occupancy of ENL mutants at a shared subset of target genes correlates with gene activation.
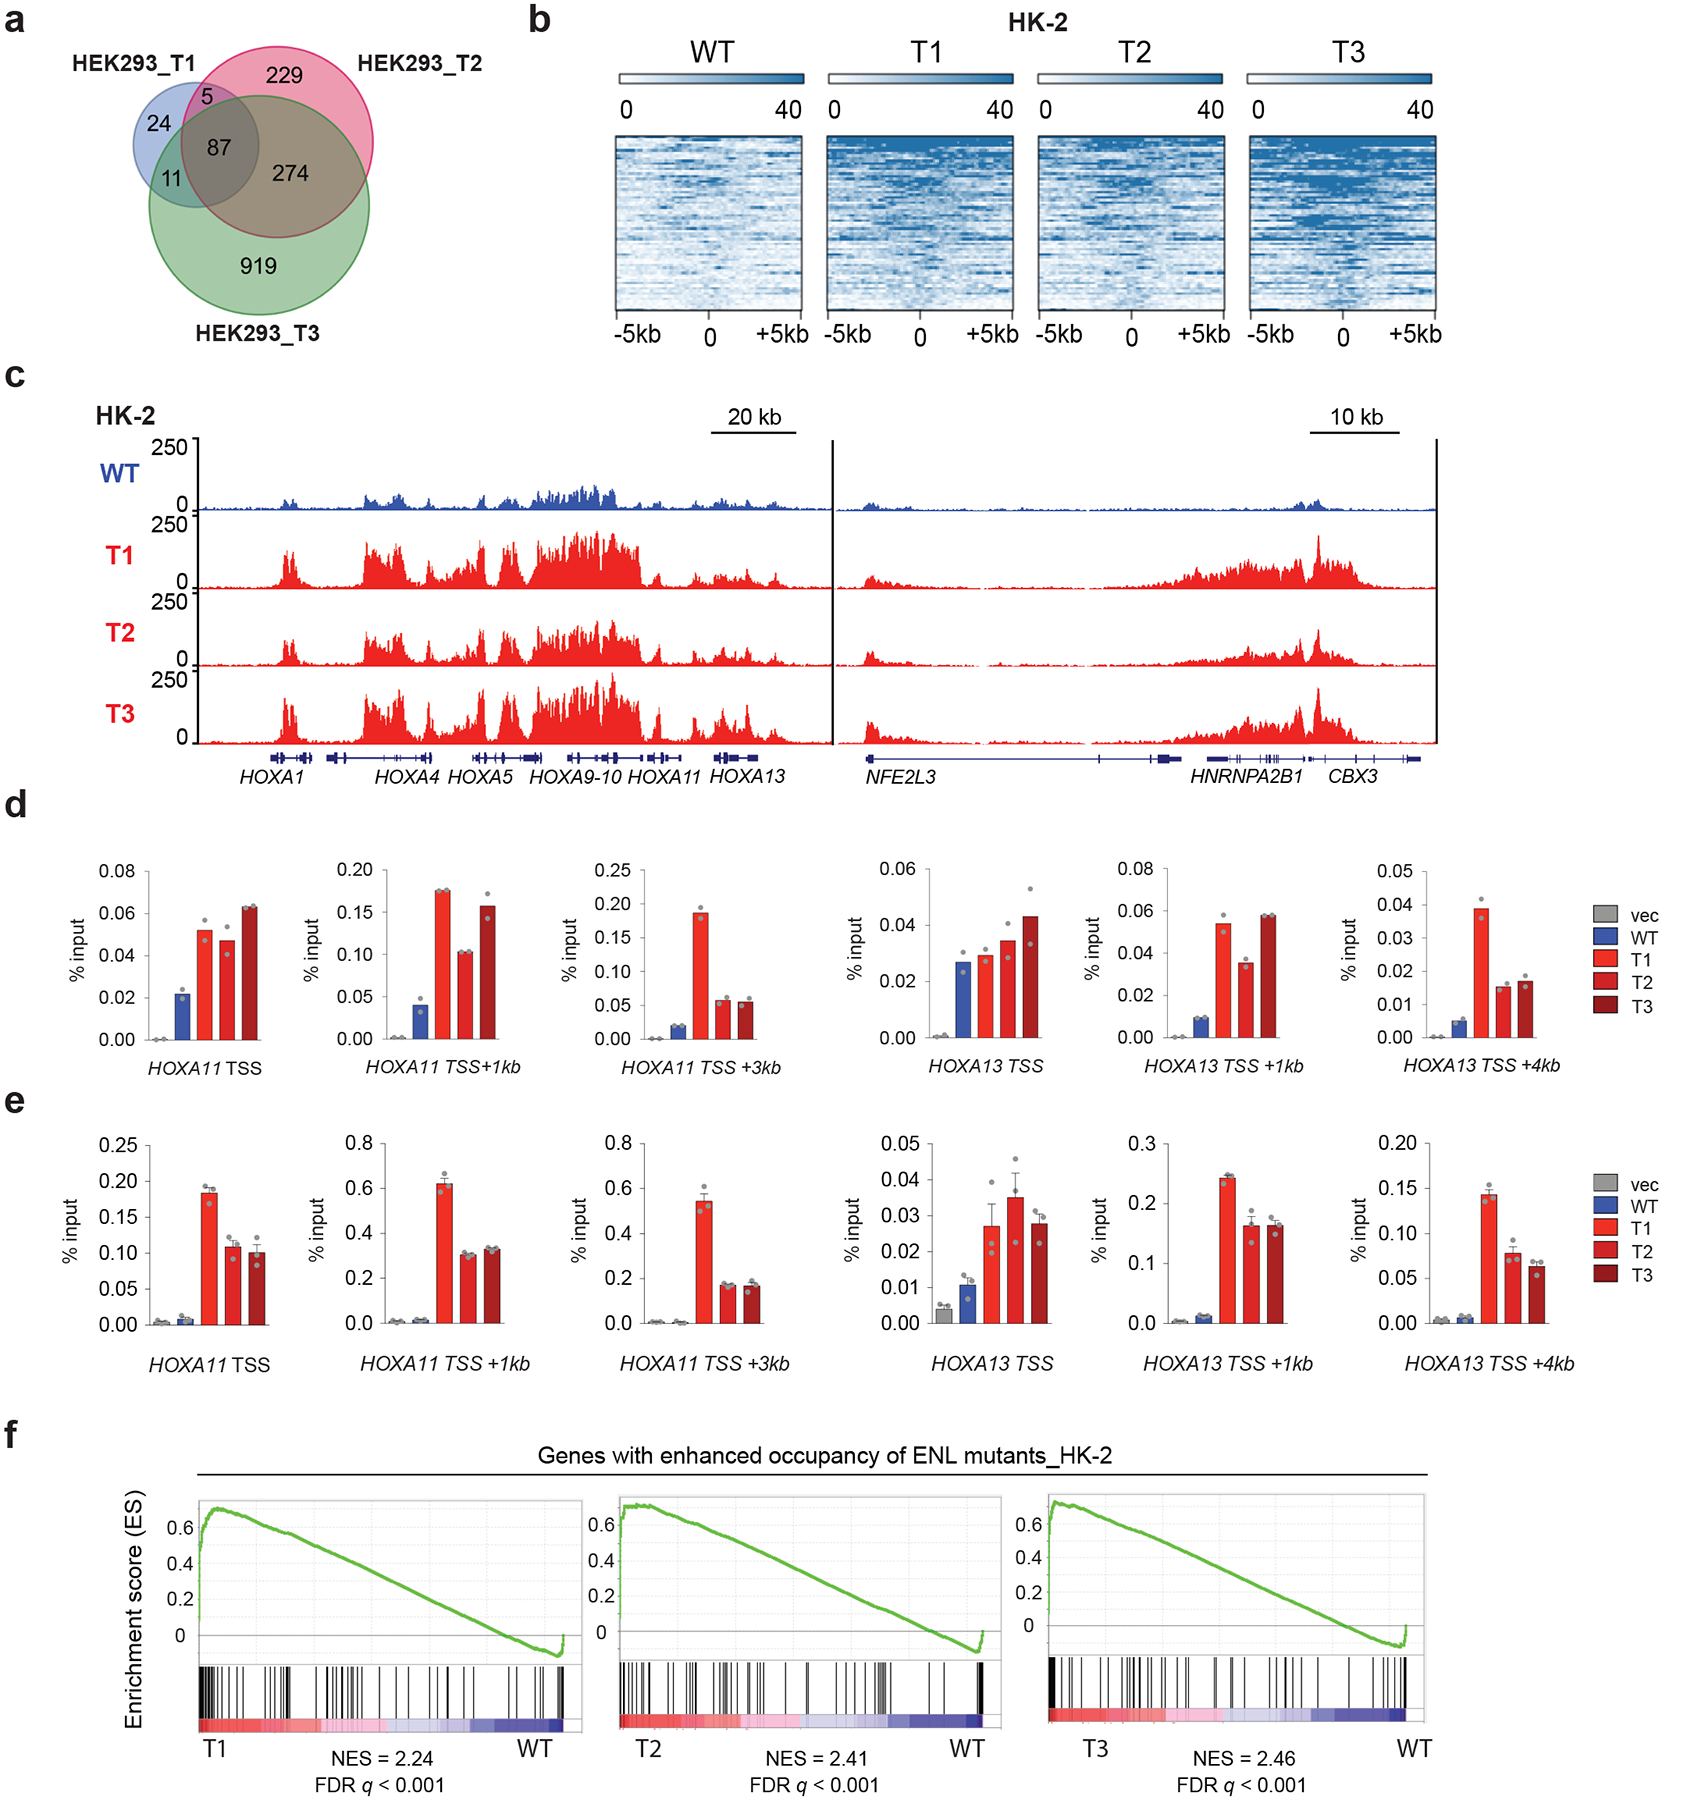
a, Venn diagram showing the number and the overlap of peaks with enhanced binding of individual mutant ENLs as compared with WT ENL in HEK293 cells. b, Heat maps of normalized WT or mutant Flag–ENL ChIP–seq signals in HK-2 cells, centred on mutant-enhanced peaks (fold change greater than 1.5) across a ± 5-kb window. More details are in Supplementary Table 7. c, Genome browser view of Flag–ENL ChIP–seq signals at selected target genes in HK-2 cells expressing indicated Flag–ENL transgenes. d, e, ChIP-qPCR of Flag–ENL at selected ENL target genes in two batches of HEK293 cells that are expressing the indicated ENL transgenes at levels higher than those of the endogenous ENL protein (d; see Extended Data Fig. 1b) or close to endogenous levels (e; see Extended Data Fig. 1j). Data in d represent means from n = 2 technical replicates, and are representative of three independent experiments. Data in e represent means ± s.e.m. from n = 3 technical replicates; independent experiments were repeated twice with similar results. f, GSEA plots showing that genes (n = 91; Supplementary Table 10) with enhanced occupancy of ENL mutants are upregulated in mutant-expressing HK-2 cells.
Extended Data Fig. 6 |. Enhanced binding of ENL mutants at target genes leads to increased SEC recruitment and activity.
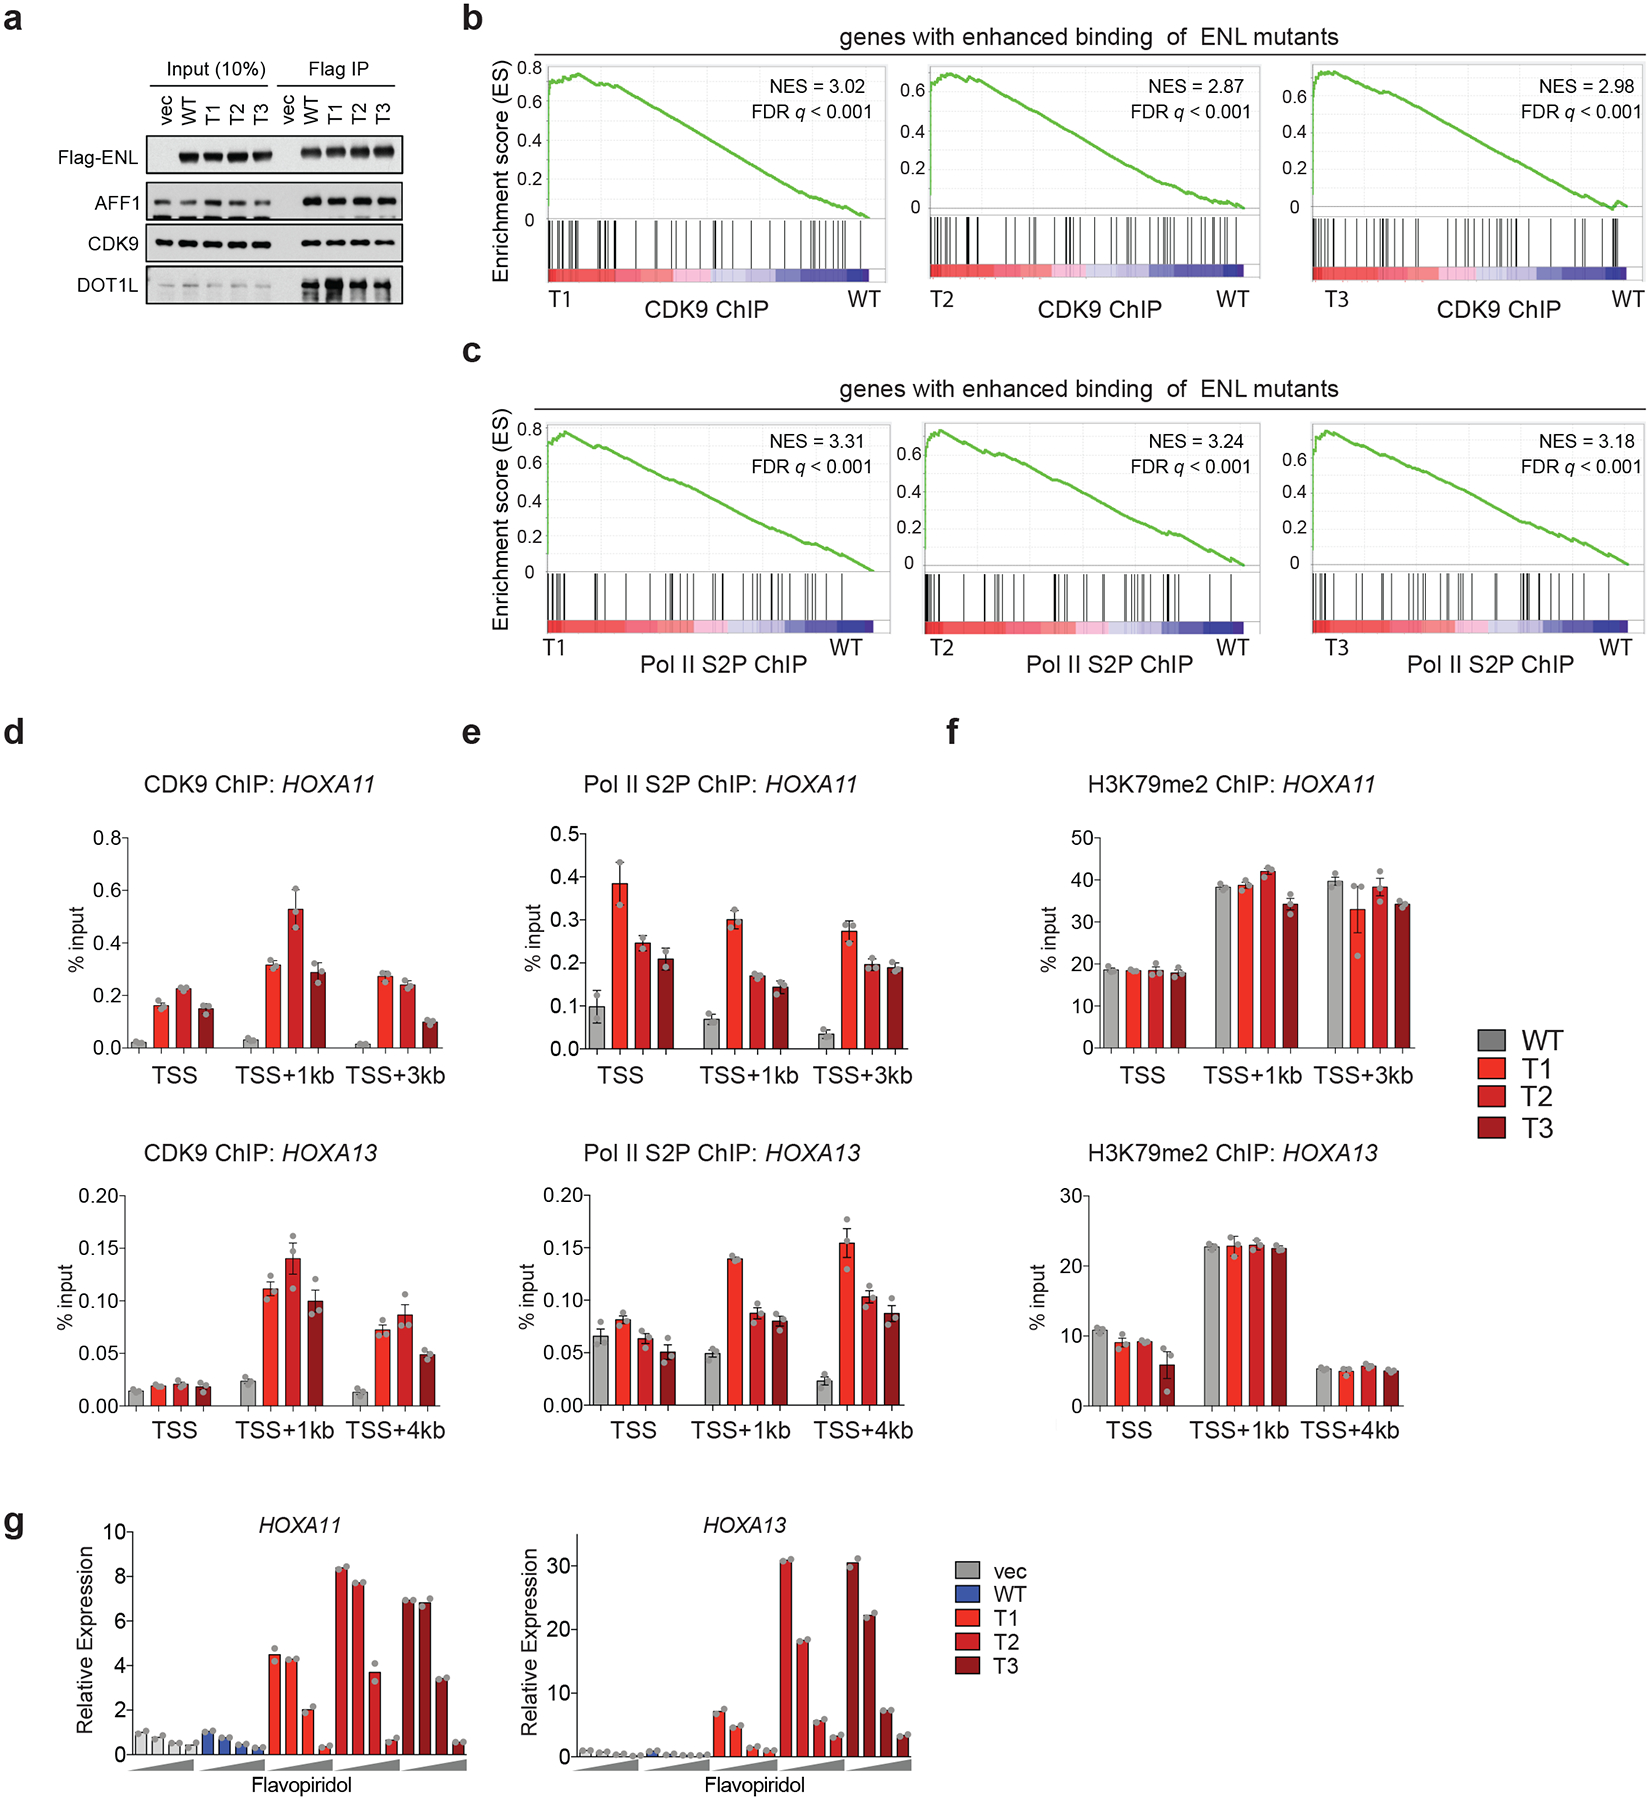
a, Western blot analysis of co-immunoprecipitation (IP) using the M2 anti-Flag antibody with lysates from HEK293T cells that are expressing the indicated Flag–ENL constructs. The experiment was repeated twice with similar results. For source data, see Supplementary Fig. 1. b, c, GSEA plots of genes ranked by their fold-change (mutant over WT) of CDK9 (b) or Pol II S2P (c) ChIP–seq signals in HEK293 cells, annotated against the set of genes (n = 87) that show increased occupancy of ENL mutants compared with WT. d-f, ChIP-qPCR analysis of CDK9 (d), Pol II S2P (e) and H3K79me2 (f; dimethylation of lysine 79 of histone H3) at selected ENL target genes in HEK293 cells that are expressing the indicated Flag–ENL constructs. Data represent means ± s.e.m.; n = 3 technical replicates. Experiments were repeated twice with similar results. g, mRNA expression analysis (normalized to GAPDH) of selected ENL target genes in HK-2 cells expressing the indicated constructs upon treatment with flavopiridol for 3 h. Increasing dosages (0, 125 nM, 250 nM and 1,000 nM) are depicted by grey wedges. Data represent means from n = 2 technical replicates. Experiments were repeated twice with similar results.
Extended Data Fig. 7 |. Loss of PAF1 has minimal effect on the functionality of cancer-associated ENL mutants.
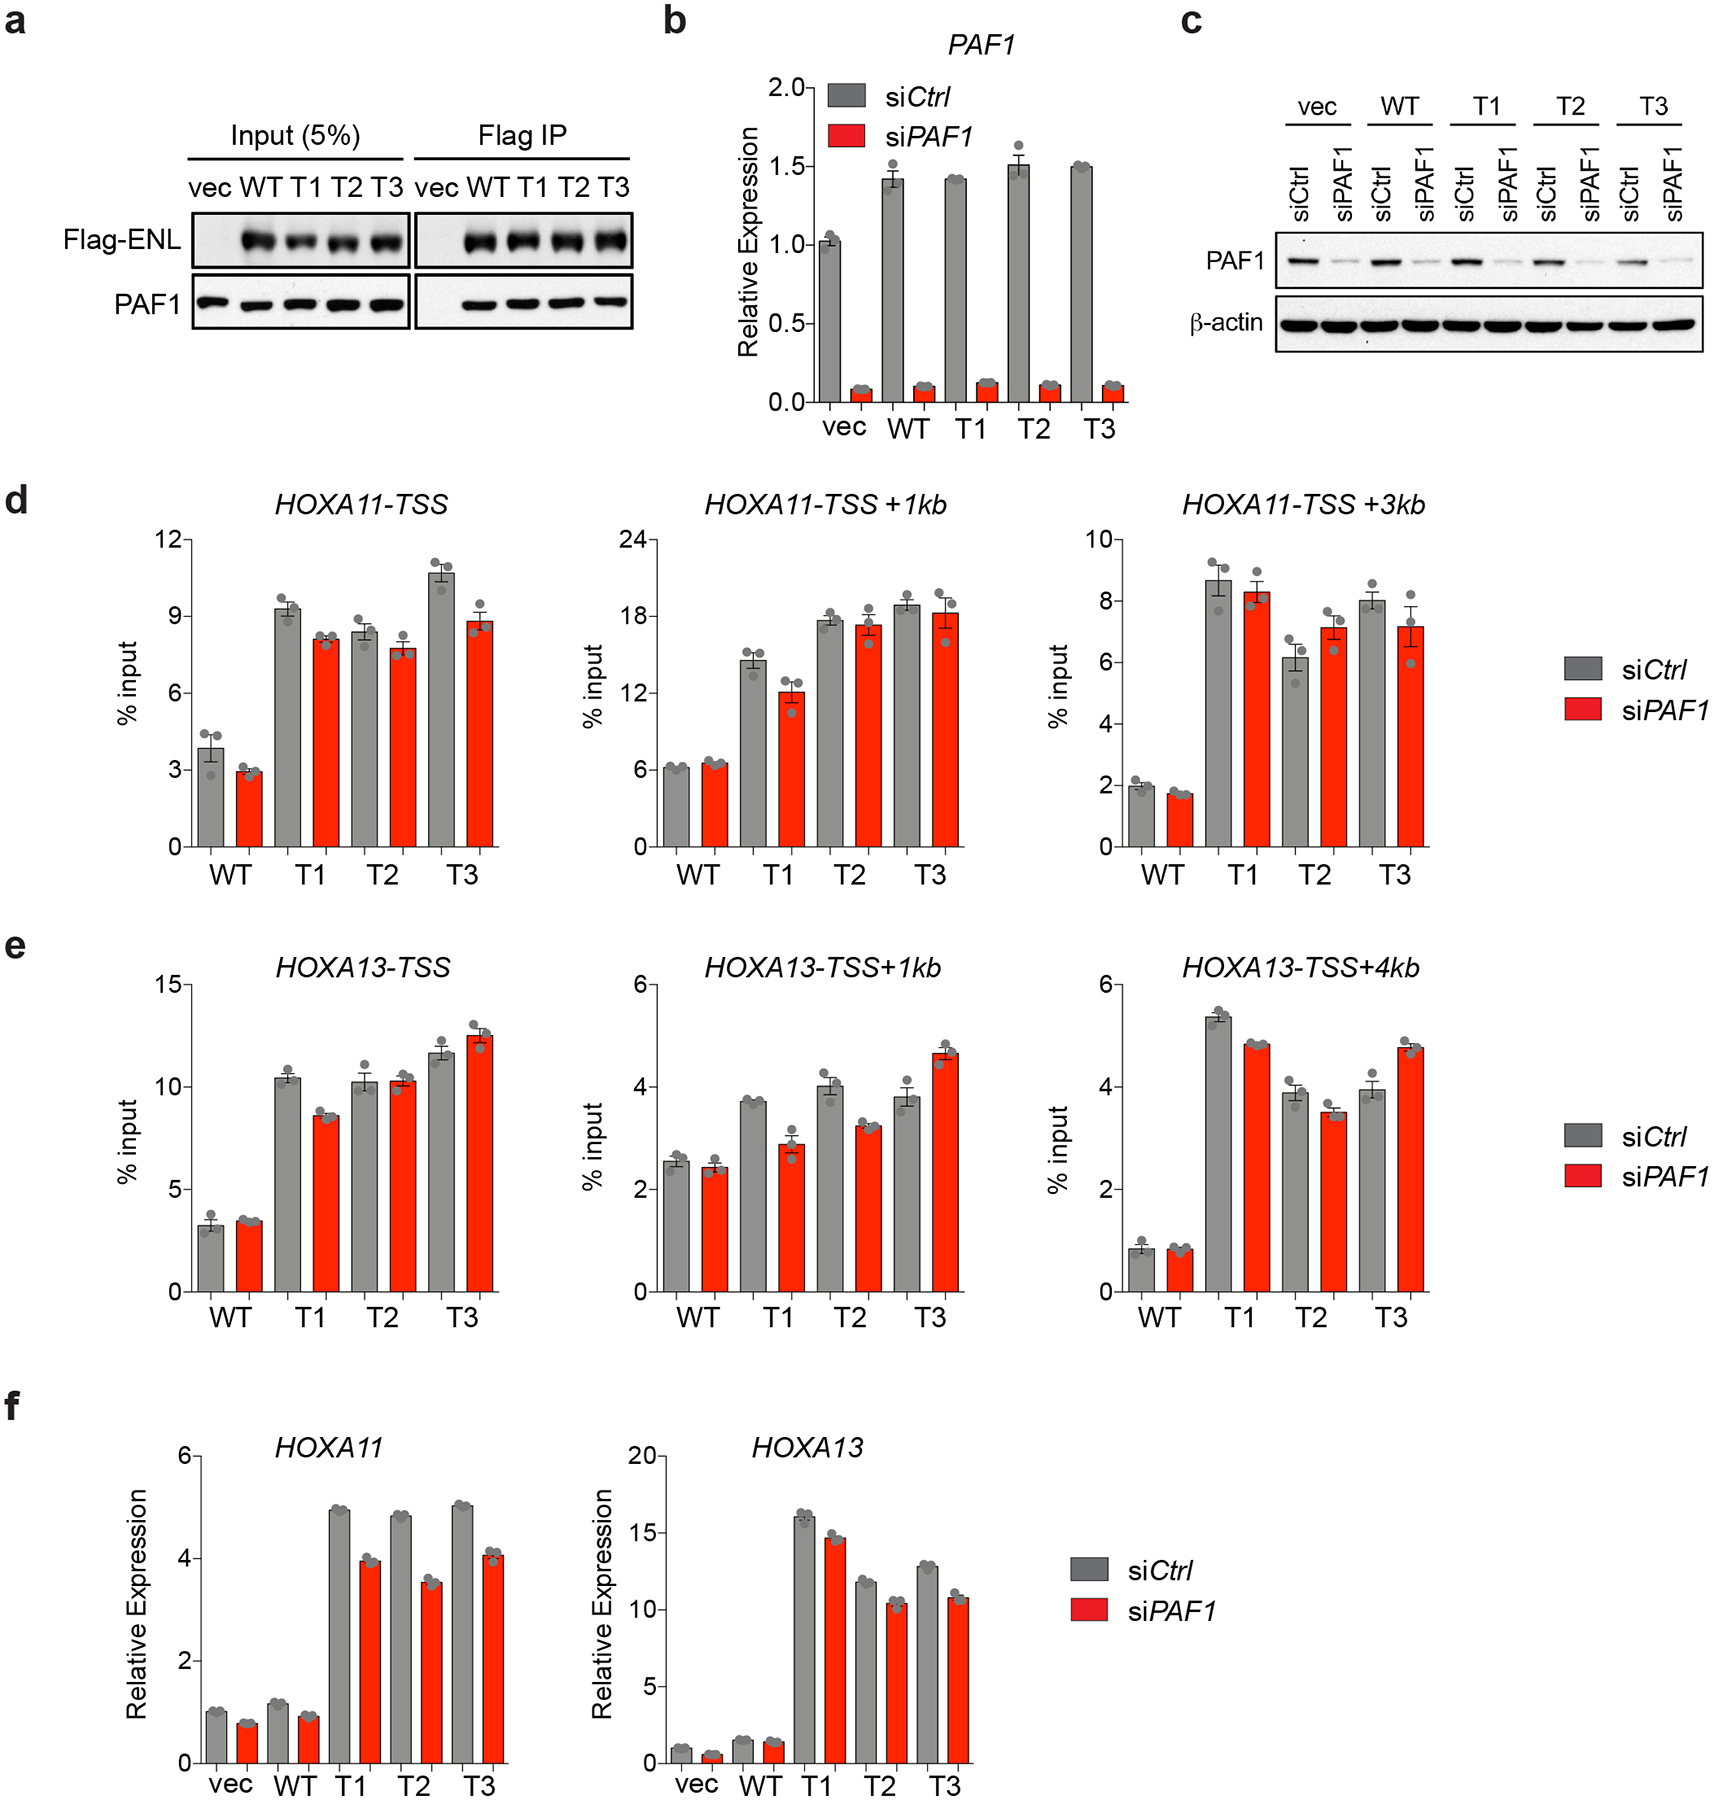
a, Western blot analysis of co-immunoprecipitation using the M2 anti-Flag antibody in lysates from HEK293T cells expressing the indicated Flag–ENL constructs. Results are representative of three independent experiments. b, c, mRNA expression (b) and western blot (c) analysis showing the knockdown efficiency of short interfering (si)RNAs that target PAF1 in HEK293 cells. Independent experiments were repeated twice with similar results. d, e, ChIP-qPCR analysis of Flag–ENL at selected ENL target genes in control (siCtrl) or PAF1 knockdown (siPAFl) HEK293 cells. f, mRNA expression analysis (normalized to GAPDH) of selected ENL target genes in control (siCtrl) or PAF1 knockdown (siPAFl) HEK293 cells. Data in d-f represent means ± s.e.m.; n = 3 technical replicates. For gel source data in panels a, c, see Supplementary Fig. 1.
Extended Data Fig. 8 |. Interaction with histone acylation is essential but not sufficient for chromatin occupancy by cancer-associated ENL mutants.
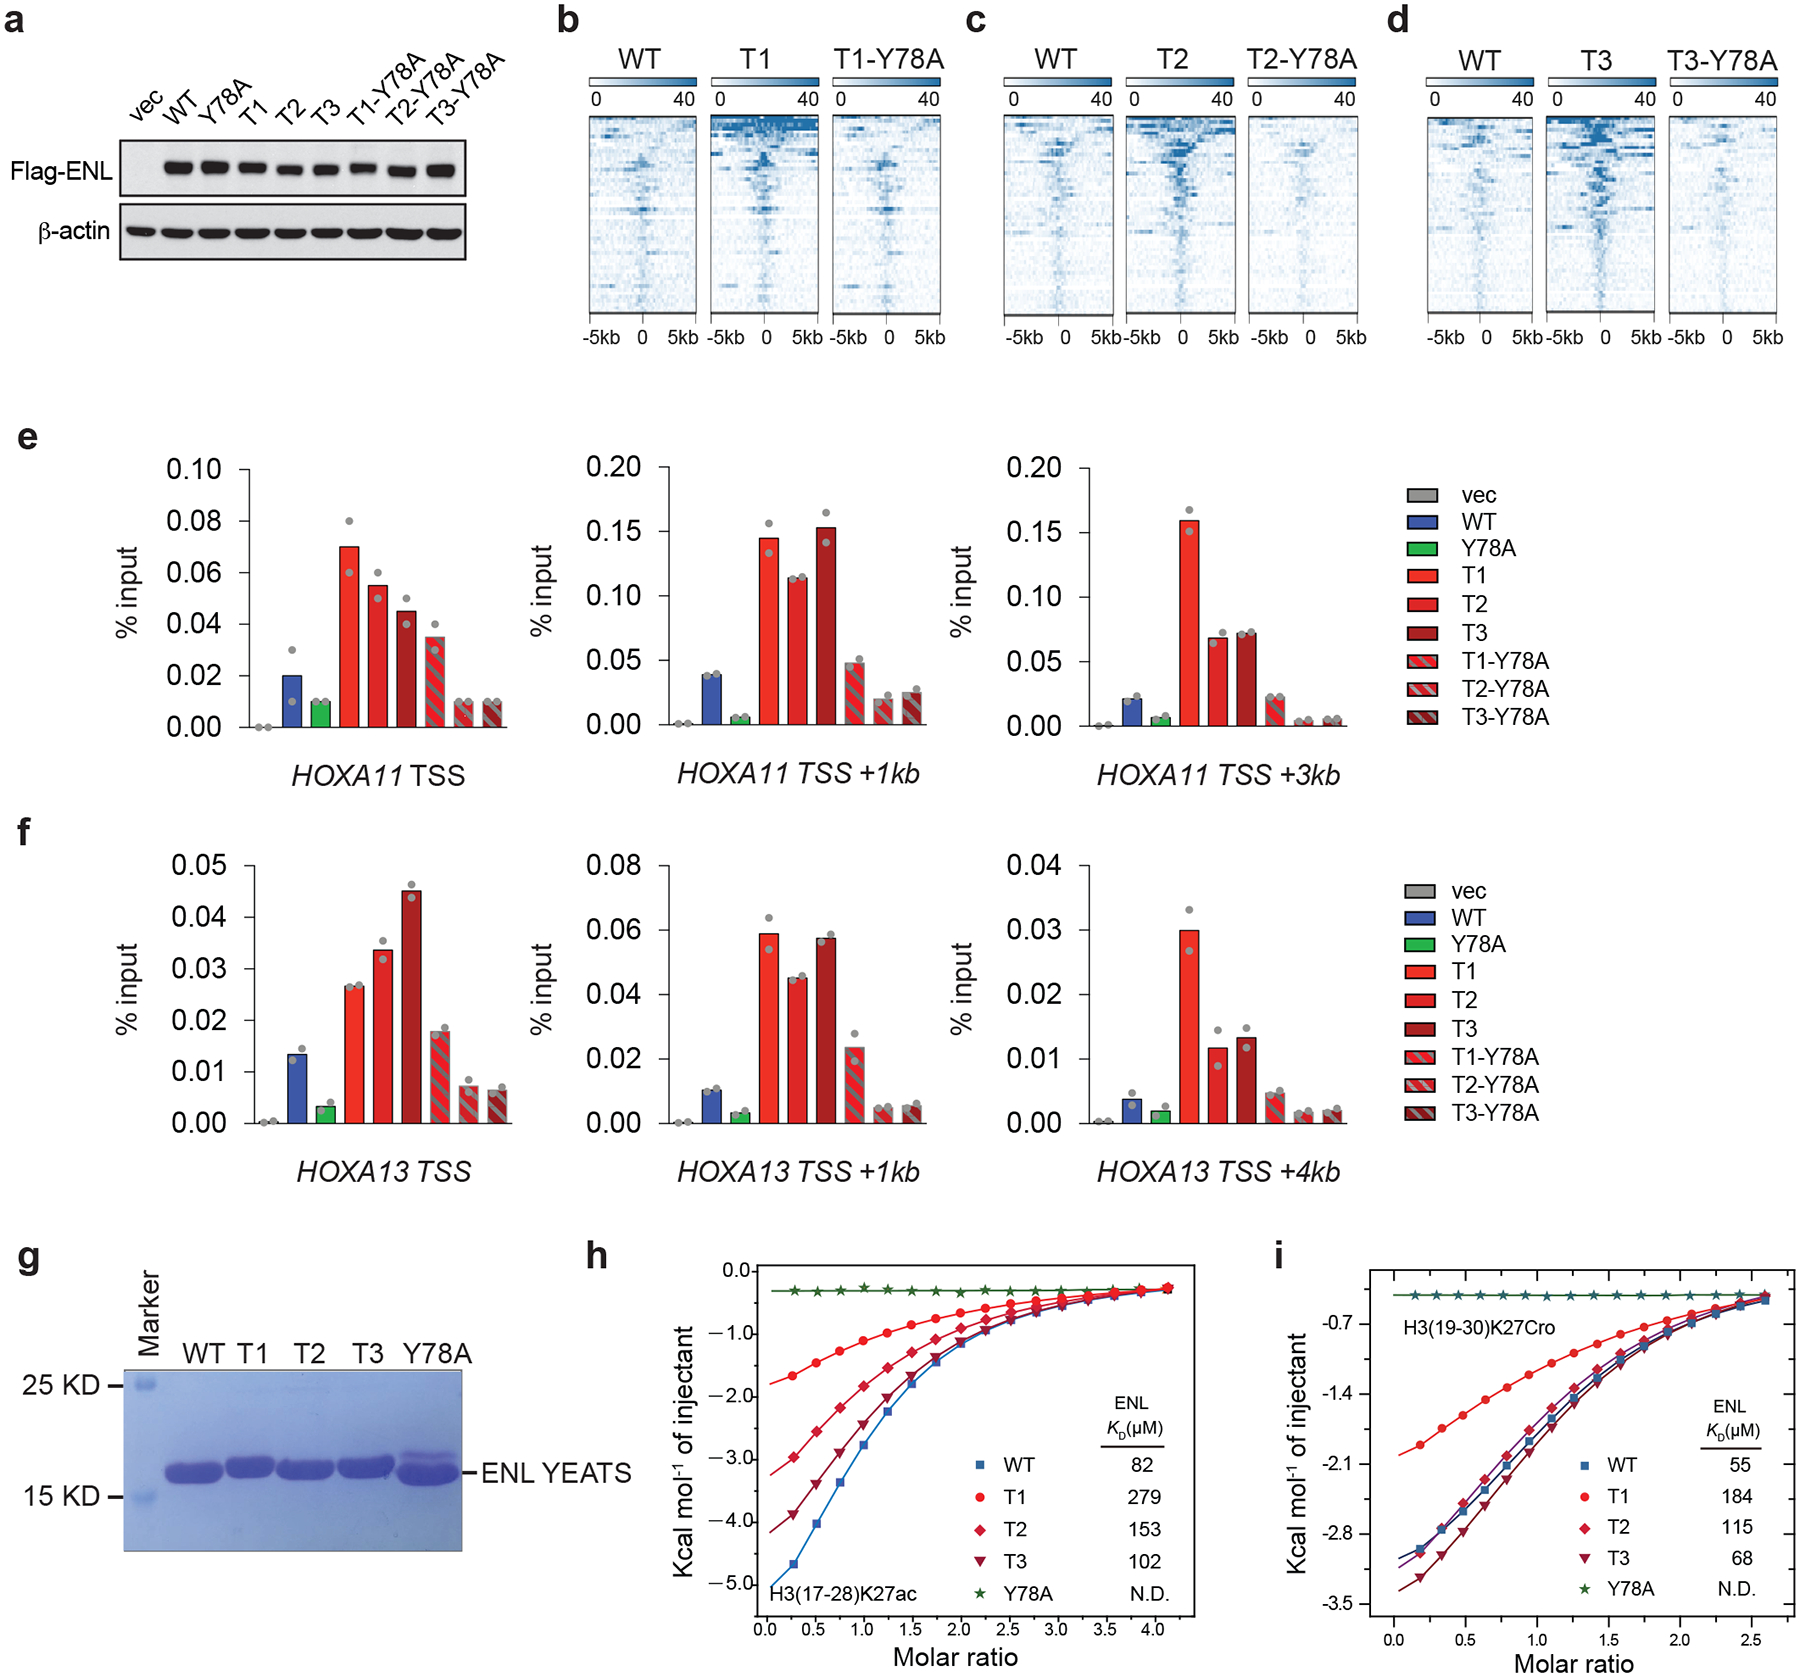
a, Western blot showing the protein levels of ectopically expressed WT or mutant Flag–ENL in HEK293 cells. Experiments were repeated twice with similar results. For source data, see Supplementary Fig. 1. b-d, Heat maps of normalized WT or mutant Flag–ENL ChIP–seq signals in HEK293 cells, centred on peaks that are enhanced in all three T mutants (as in Fig. 2a; n = 54) across a ± 5-kb window. e, f, ChIP-qPCR analysis of Flag–ENL at selected ENL target genes in HEK293 cells expressing the indicated constructs. Data represent means of n = 2 technical replicates. Independent experiments were repeated twice with similar results. g, Coomassie staining of purified WT ENL YEATS domain, and of YEATS domains with the indicated T mutations or a Y78A mutation. Data represent two independent experiments. h, i, ITC titration fitting curves for the indicated ENL YEATS domains (as in panel g), using a histone H3 peptide that is either acetylated at lysine 27 (H3(17–28)K27ac; h) or crotonylated at lysine 27 (H3(19–30)K27Cro; i).
Extended Data Fig. 9 |. Characterization of nuclear puncta formed by ectopically expressed ENL tumour mutants.
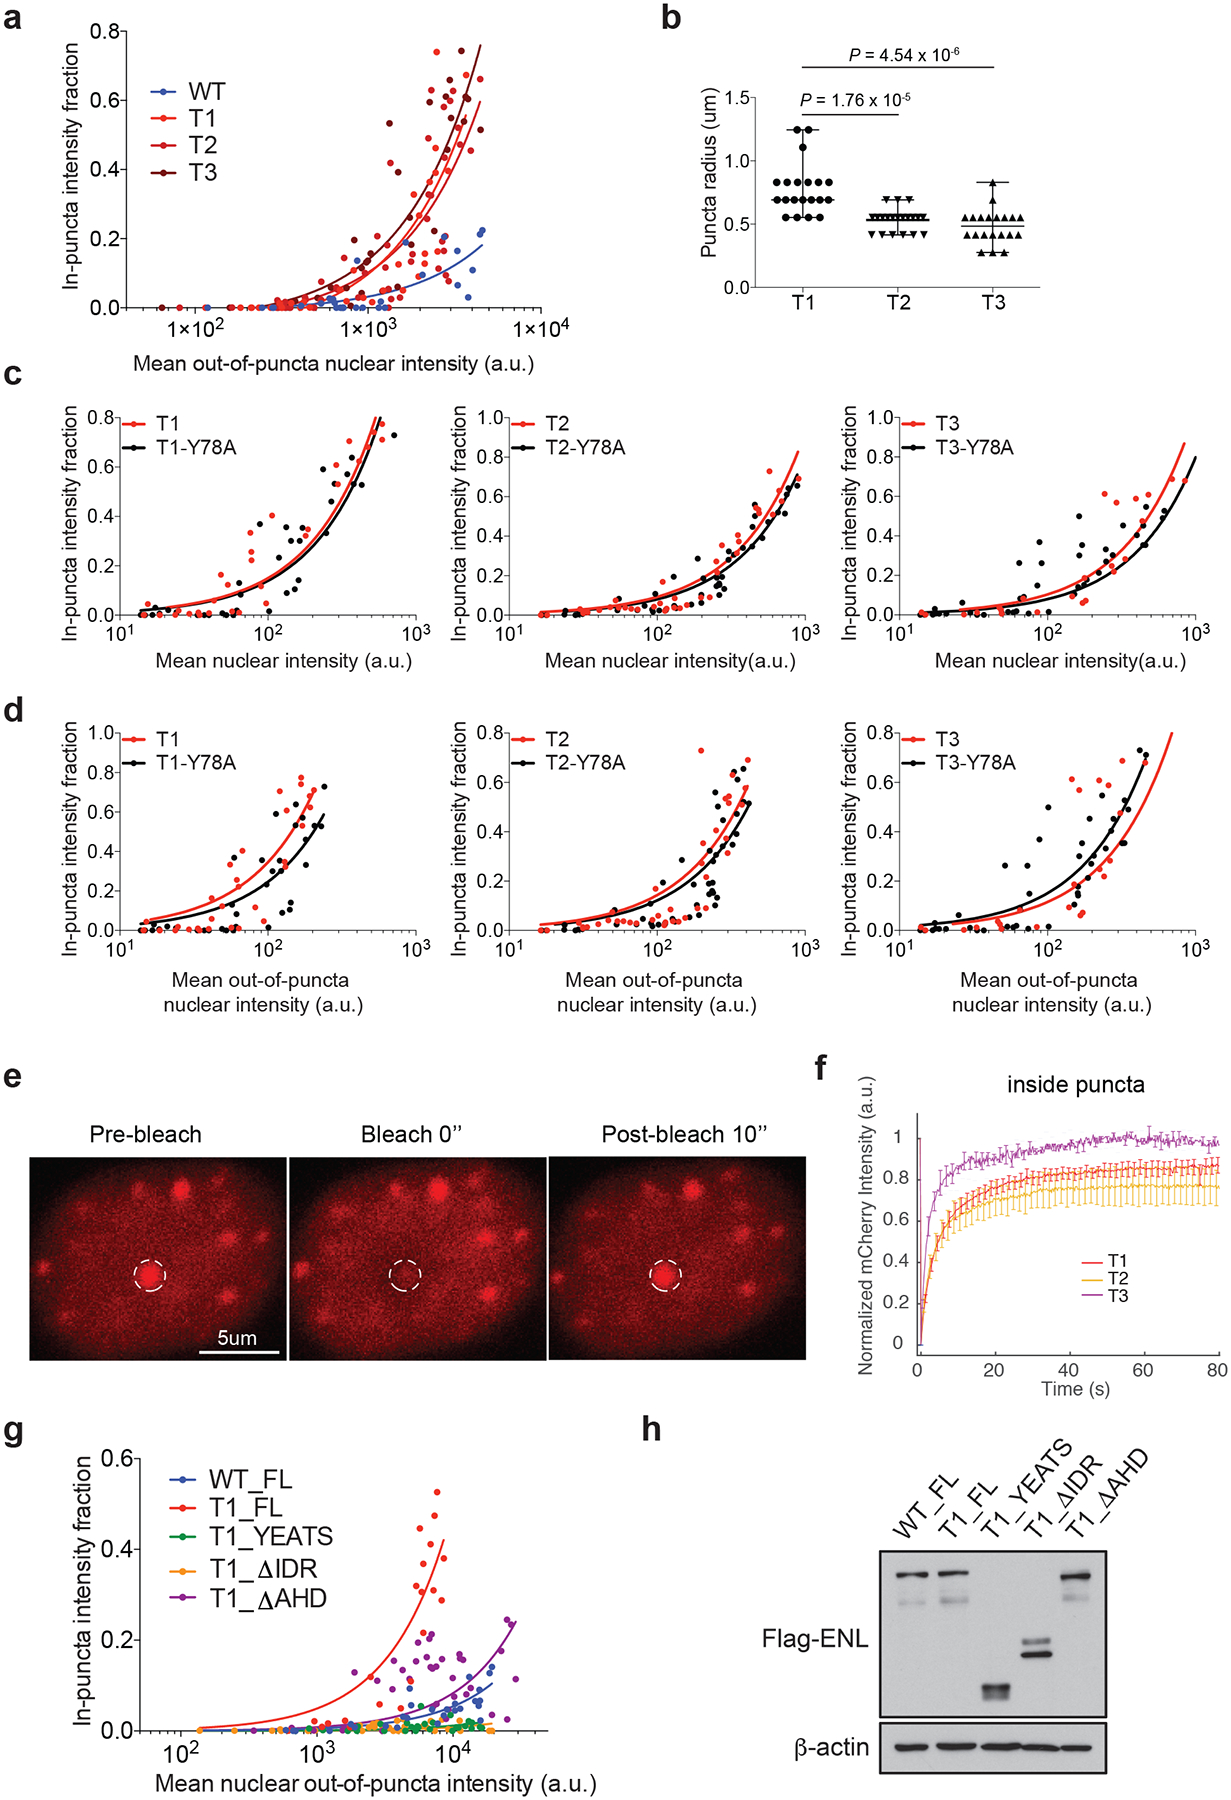
a, Fraction of in-puncta fluorescence intensity in the nucleus of HEK293 cells that express WT or mutant mCherry–ENL, as a function of mean out-of-puncta nuclear intensity. Each dot represents one cell (the same experiment as in Fig. 4e). b, Dot plots showing the radius of puncta in HEK293 cells that are expressing similar levels of the indicated mCherry–ENL proteins. n = 20 independent puncta, randomly selected from four different cells per group. P-values were obtained using two-tailed unpaired Student’s t-test. Centre lines represent medians; whiskers indicate the minimum to maximum range. c, d, Fraction of in-puncta mCherry–ENL intensity in the nucleus as a function of mean nuclear intensity (c) or mean out-of-puncta nuclear intensity (d) in HEK293 cells that express the indicated mCherry–ENL proteins. Each dot represents one cell. e, Representative images from fluorescence recovery after photobleaching (FRAP) analysis in HEK293 cells expressing T3 mutant mCherry–ENL. The white dashed circles indicate the punctum undergoing targeted bleaching. Images represent 14 FRAP experiments in total with T1/2/3 mCherry–ENL. f, Averaged FRAP curves from areas inside the mCherry–ENL puncta formed by the indicated ENL mutants. Bleaching occurs at t = 0 s. Data represent means ± s.e.m.; n = 6 (T1), 5 (T2) and 3 (T3) distinct puncta from multiple cells. g, Fraction of in-puncta fluorescence intensity in the nucleus of HEK293 cells that express the indicated mCherry–ENL constructs as a function of mean nuclear out-of-puncta intensity. Each dot represents one cell (same experiment as in Fig. 4g). h, Western blot showing the protein levels of ectopically expressed Flag–ENL in HEK293 cells. Experiments were repeated three times with similar results. For gel source data, see Supplementary Fig. 1.
Supplementary Material
Acknowledgements
We thank R. Nishinakamura, A. Taguchi and Z. Li for providing reagents and discussions related to kidney differentiation assays; M. Leboeuf for technical assistance; A. Soshnev for help with figure preparation; and members of the Allis and Wen laboratories for scientific input throughout the study. We thank the Rockefeller University Genomic Resource Center, the Bio-Imaging Resource Center, the Flow Cytometry Resource Center and the MD Anderson Science Park Next-Generation Sequencing Facility (Cancer Prevention and Research Institute of Texas (CPRIT), grant RP120348). The research was supported by funds from the National Cancer Institute (grant 5R01CA204639-03), the Leukaemia and Lymphoma Society (LLS-SCOR 7006-13), and the Rockefeller University and St Jude Children’s Research Hospital Collaborative on Chromatin Regulation in Pediatric Cancer (to C.D.A.); from CPRIT (grant RP160237) and the Van Andel Institute (to H.W.); and from the National Institutes of Health (NIH grants R01HG007538, R01CA193466 and R01CA228140, to W.L.). L.W. is supported by the Jane Coffin Childs Memorial Fund and an NIH Pathway to Independence Award (1K99CA226399-01). M.V.O. is supported by a K12 Award from the National Cancer Institute (K12CA184746).
Footnotes
Competing interests C.D.A. is a co-founder of Chroma Therapeutics and Constellation Pharmaceuticals and a Scientific Advisory Board member of EpiCypher.
Supplementary information is available for this paper at https://doi.org/10.1038/s41586-019-1842-7.
Publisher’s note Springer Nature remains neutral with regard to jurisdictional claims in published maps and institutional affiliations.
References
- 1.Wan L et al. ENL links histone acetylation to oncogenic gene expression in acute myeloid leukaemia. Nature 543, 265–269 (2017). [DOI] [PMC free article] [PubMed] [Google Scholar]
- 2.Gadd S et al. A children’s oncology group and TARGET initiative exploring the genetic landscape of Wilms tumor. Nat. Genet 49, 1487–1494 (2017). [DOI] [PMC free article] [PubMed] [Google Scholar]
- 3.Perlman EJ et al. MLLT1 YEATS domain mutations in clinically distinctive Favourable Histology Wilms tumours. Nat. Commun 6, 10013 (2015). [DOI] [PMC free article] [PubMed] [Google Scholar]
- 4.Erb MA et al. Transcription control by the ENL YEATS domain in acute leukaemia. Nature 543, 270–274 (2017). [DOI] [PMC free article] [PubMed] [Google Scholar]
- 5.Rivera MN & Haber DA Wilms’ tumour: connecting tumorigenesis and organ development in the kidney. Nat. Rev. Cancer 5, 699–712 (2005). [DOI] [PubMed] [Google Scholar]
- 6.Taguchi A et al. Redefining the in vivo origin of metanephric nephron progenitors enables generation of complex kidney structures from pluripotent stem cells. Stem Cells 14, 53–67 (2014). [DOI] [PubMed] [Google Scholar]
- 7.Ozdemir DD & Hohenstein P Wt1 in the kidney—a tale in mouse models. Pediatr. Nephrol 29, 687–693 (2014). [DOI] [PubMed] [Google Scholar]
- 8.Lin C et al. AFF4, a component of the ELL/P-TEFb elongation complex and a shared subunit of MLL chimeras, can link transcription elongation to leukemia. Mol. Cell 37, 429–437 (2010). [DOI] [PMC free article] [PubMed] [Google Scholar]
- 9.He N et al. HIV-1 Tat and host AFF4 recruit two transcription elongation factors into a bifunctional complex for coordinated activation of HIV-1 transcription. Mol. Cell 38, 428–438 (2010). [DOI] [PMC free article] [PubMed] [Google Scholar]
- 10.Yokoyama A, Lin M, Naresh A, Kitabayashi I & Cleary ML A higher-order complex containing AF4 and ENL family proteins with P-TEFb facilitates oncogenic and physiologic MLL-dependent transcription. Cancer Cell 17, 198–212 (2010). [DOI] [PMC free article] [PubMed] [Google Scholar]
- 11.Bitoun E, Oliver PL & Davies KE The mixed-lineage leukemia fusion partner AF4 stimulates RNA polymerase II transcriptional elongation and mediates coordinated chromatin remodeling. Hum. Mol. Genet 16 J92–106 (2007). [DOI] [PubMed] [Google Scholar]
- 12.Peterlin BM & Price DH Controlling the elongation phase of transcription with P-TEFb. Mol. Cell 23, 297–305 (2006). [DOI] [PubMed] [Google Scholar]
- 13.Chao SH & Price DH Flavopiridol inactivates P-TEFb and blocks most RNA polymerase II transcription in vivo. J. Biol. Chem 276, 31793–31799 (2001). [DOI] [PubMed] [Google Scholar]
- 14.Hetzner K, Garcia-Cuellar M-P, Büttner C & Slany RK The interaction of ENL with PAF1 mitigates polycomb silencing and facilitates murine leukemogenesis. Blood 131, 662–673 (2018). [DOI] [PubMed] [Google Scholar]
- 15.Li Y et al. Molecular coupling of histone crotonylation and active transcription by AF9 YEATS domain. Mol. Cell 62, 181–193 (2016). [DOI] [PMC free article] [PubMed] [Google Scholar]
- 16.Chong S et al. Imaging dynamic and selective low-complexity domain interactions that control gene transcription. Science 361, eaar2555 (2018). [DOI] [PMC free article] [PubMed] [Google Scholar]
- 17.Banani SF, Lee HO, Hyman AA & Rosen MK Biomolecular condensates: organizers of cellular biochemistry. Nat. Rev. Mol. Cell Biol 18, 285–298 (2017). [DOI] [PMC free article] [PubMed] [Google Scholar]
- 18.Sabari BR et al. Coactivator condensation at super-enhancers links phase separation and gene control. Science 361, eaar3958 (2018). [DOI] [PMC free article] [PubMed] [Google Scholar]
- 19.Cho W-K et al. Mediator and RNA polymerase II clusters associate in transcription-dependent condensates. Science 361, 412–415 (2018). [DOI] [PMC free article] [PubMed] [Google Scholar]
- 20.Chi P, Allis CD & Wang GG Covalent histone modifications—miswritten, misinterpreted and mis-erased in human cancers. Nat. Rev. Cancer 10, 457–469 (2010). [DOI] [PMC free article] [PubMed] [Google Scholar]
Associated Data
This section collects any data citations, data availability statements, or supplementary materials included in this article.
Supplementary Materials
Data Availability Statement
The ChIP–seq and RNA-seq data have been deposited in the Gene Expression Omnibus database under accession number GSE125186. All other raw data generated or analysed during this study are included in this paper, the Extended Data figures, and the Supplementary Information.