Abstract
Pancreatic ductal adenocarcinoma (PDAC) is a complex, heterogeneous, and genetically unstable disease. Its tumor microenvironment (TME) is complicated by heterogeneous cancer cell populations, and strong desmoplastic stroma. This complex and heterogeneous environment makes it challenging to discover and validate unique therapeutic targets. Reliable and relevant in vitro PDAC tumor models can significantly advance our understanding of the PDAC TME and may enable the discovery and validation of novel drug targets. In this study, an engineered tumor model is developed to mimic the PDAC TME. This biomimetic model, named ductal tumor-microenvironment-on-chip (dT-MOC), permits analysis and experimentation on epithelial-mesenchymal transition (EMT) and local invasion with intra-tumoral heterogeneity. This dT-MOC is a microfluidic platform where a duct of murine genetically engineered pancreatic cancer cells is embedded within a collagen matrix. The cancer cells used carry two of three mutations of KRAS, CDKN2A, and TP53, which are key driver mutations of human PDAC. The intra-tumoral heterogeneity is mimicked by co-culturing these cancer cells. Using the dT-MOC model, heterogeneous invasion characteristics, and response to transforming growth factor-beta1 (TGF-β1) are studied. A mechanism of EMT and local invasion caused by the interaction between heterogeneous cancer cell populations is proposed.
Keywords: PDAC, epithelial-mesenchymal transition, cancer cell invasion, intra-tumoral heterogeneity, microfluidic tumor model
Graphical Abstract
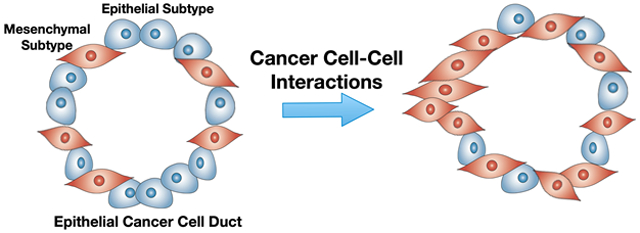
Heterogeneity tumor model of pancreatic cancer: A biomimetic tumor model is developed for pancreatic cancer research. This model recapitulates intra-tumoral heterogeneity by use of mouse pancreatic cancer cells isolated from genetically engineered mouse models with distinct genetic mutations.
1. Introduction
Pancreatic ductal adenocarcinoma (PDAC) is a complex, heterogeneous, and genetically unstable disease. PDAC is thought to arise from acinar-ductal metaplasia and develop into invasive carcinoma through pancreatic intraepithelial neoplasia lesions as key genetic mutations accumulate over a prolonged period.[1-3] These driver mutations include activation of the KRAS oncogene and inactivation of the tumor suppressor genes CDKN2A (encoding p16), TP53 (encoding p53) and SMAD4.[4-6] A strong desmoplastic stroma is associated with the progression of the disease. The stroma is primarily composed of carcinoma-associated fibroblasts (CAFs) and a dense extracellular matrix (ECM), including type I collagen and hyaluronic acid.[5, 7] This stroma accounts for up to 90% of the tumor volume[8, 9] and forms the complicated tumor microenvironment (TME).[10-12] Genotypic and phenotypic analysis of currently established pancreatic cancer cell (PCC) lines[13] suggests that no clear correlation exists between key genes and either the grade of differentiation[14] or biological behavior,[15] although p53 is thought to be associated with metastasis.[16] A recent genomic analysis of PDAC identifies its molecular subtypes with potential relevance to therapeutic response - two epithelial types and two stromal subtypes.[17, 18] In order to improve patient selection for current treatment options, and to develop new therapeutic strategies, the genotype-specific behaviors of PDAC need to be further studied.
In this context, current tumor models are inadequate to systematically study and compare different genotypes of PDAC and their TME. Although PDAC cell lines are valuable tools, the standard 2D-culture environment does not adequately mimic the complex nature of the PDAC TME.[13] The physical, chemical and mechanical microenvironments of cancer cells significantly affect cellular behaviors, including morphology, gene expression, and drug responsiveness.[19-21] Standard static in vitro 3D models, such as spheroids, are an improvement, but these models still fail to recapitulate the micro-structure of PDAC where cancer epithelial cell ducts interact with the surrounding stroma.[22-25] Small animal models, including mouse xenograft and allograft (heterotopic and orthotopic) models, provide the TME presenting cell-cell and cell-matrix interactions. However, the genetics and microanatomy of the tumors are frequently not representative of human PDAC.[26, 27] Genetically engineered mouse models (GEMMs) can recapitulate most histologic and genetic features of human PDAC, including key driver mutations, the epithelial duct structures, and the surrounding stromal tissue. Thus, GEMMs likely better predict drug efficacy when compared to xenograft or orthotopic models.[28, 29] However, GEMMs are expensive, and usually take 4-8 months to generate tumors, limiting their usefulness for evaluating the highly variable complexities associated with PDAC development. Thus, new tumor models that are capable of providing precise control of relevant TME conditions while maintaining the context of the in vivo PDAC TME are highly desired to understand the complex tumor-stroma interactions.
In this study, a new biomimetic PDAC tumor model was developed. This model, named ductal tumor-microenvironment-on-chip (dT-MOC), is a microfluidic platform where the ductal PCC epithelium is surrounded by the collagen matrix, which is the anatomical hallmark of PDAC. This microfluidic PDAC model was created using murine PCCs isolated from PDAC tissues of two different genotypes of GEMMs. These are the KPC genotype with KRAS and TP53 mutations, and two KIC genotypes with KRAS and CDKN2A mutations. The KIC genotypes show two distinct phenotypes – one epithelial-like and the other mesenchymal-like. The proliferation and local invasion of PCCs were characterized and compared using the dT-MOC model. The intra-tumoral heterogeneity was also mimicked by co-culturing these KPC and KIC lines. The results were further discussed to illustrate the potential usage of the models for cancer biology research and treatments.
2. Results
2.1. Design of Ductal Tumor-Environment-on-Chip (dT-MOC)
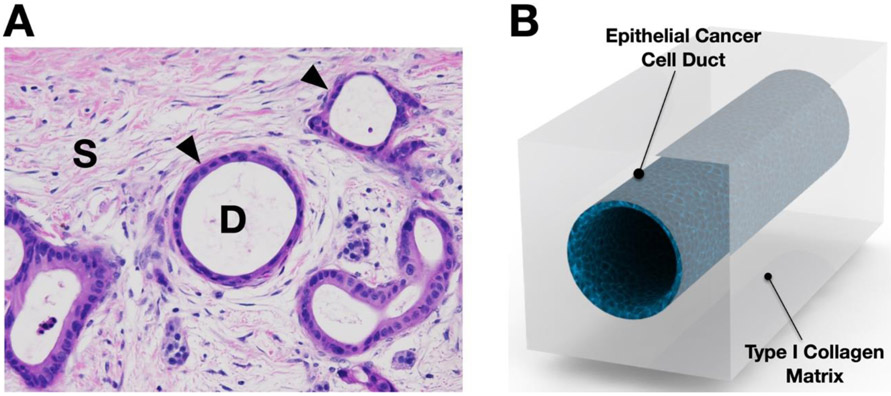
The design of dT-MOC mimics the microanatomy of PDAC to recapitulate PCC-ECM interactions. As illustrated in Figure 1A, the PDAC tumor consists of ducts of pancreatic epithelial cancer cells (noted with "D") surrounded by the stroma tissue (indicated with "S"). The size of normal pancreatic ducts is reported to range from approximately 200 ~ 380 um for interlobular ones to 1.2 ~ 2 mm for main pancreatic ducts.[30] The main cellular component of the lumen is epithelial cancer cells, whose basal side is interfaced with the stromal matrix. As shown in Figure 1B, the dT-MOC reconstitutes a PCC epithelial duct surrounded by the stromal matrix comprised of a perfused collagen matrix. The typical duct diameter in the dT-MOC model ranges 500 ~ 800 um, which mimics physiologically relevant pancreatic ducts. The ECM components of the PDAC stroma are highly complex, but primary components are Type I collagen and hyaluronic acids. The collagen concentration of the dT-MOC is about 6 mg/ml, which aims to mimic a high level of type I collagen in PDAC tissue. It was reported that the collagen level of human PDAC was 0.275 mg/g-total protein.[31] The present dT-MOC configuration resembles cancer cell growth, EMT, local invasion, and associated signaling pathways in the ductal shape. In addition to biochemical interactions, the dT-MOC model is capable of measuring biomechanical interactions between PCCs differing in genotype (KPC2 and eKIC) or phenotype (eKIC and mKIC), thus mimicking the heterogeneity found in PDAC.
Figure 1.
Design of ductal T-MOC platform. (A) The murine PDAC micrograph shows a cross section H&E staining of PCC ducts (noted with arrowheads and "D") and stroma tissue (noted with "S"). (B) The dT-MOC model is designed to mimic the microanatomy of PDAC tumors where PCC ducts are surrounded by stromal matrix.
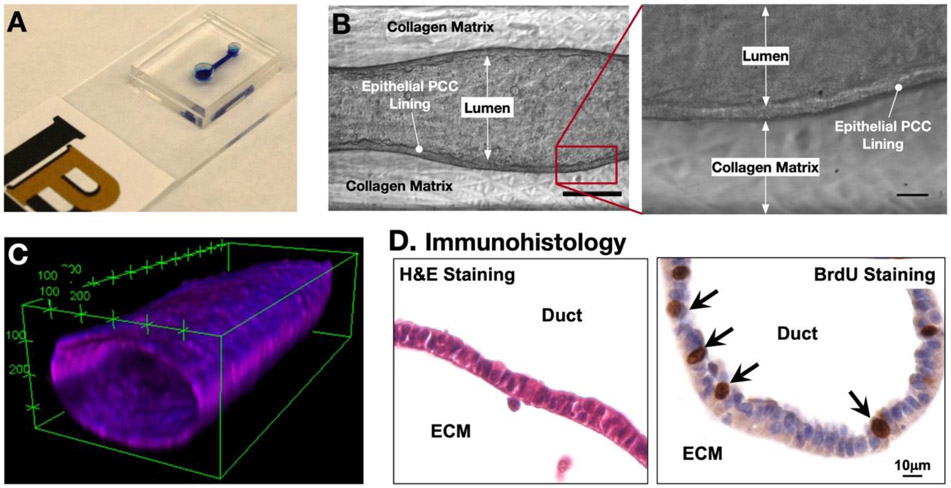
The dT-MOC platform has been microfabricated with polydimethylsiloxane (PDMS), and the fabricated platform is shown in Figure 2. The device consists of two layers of PDMS with an inlet and outlet joined by a microchannel (Figure 2A). One aspect of the dT-MOC model that sets it apart from current in vitro models of pancreatic cancer is the formation of a 3D pancreatic duct. Figure 2B show clearly the formation of a patent lumen, the epithelial cell layer, and the adjacent collagen matrix. The duct structure was verified using confocal microscopy (Figure 2C). The cells were cultured for 48 hours to ensure that a tightly packed epithelium had formed, after which the lumen was perfused with Hoechst and CellMask to stain the nuclei and cell membrane, respectively. The 3D reconstruction of confocal slices in Figure 2C shows a representative section of the ductal structure. After culture, the dT-MOC platforms can be analyzed for immunohistology (Figure 2D). In dT-MOC PCCs continued to proliferate (BrdU+), mimicking PCC growth in human PDAC tumors. The cellular viability and proliferation were also confirmed up to 7 days. Representative time-lapsed micrographs were provided in the Supplementary Information (Figure S4).
Figure 2.
Fabricated ductal T-MOC platform. (A) Photograph of a fabricated dT-MOC. (B) Brightfield micrographs showing the formation of the lumen structure with a distinct epithelial lining at Day 4. Scale bar is 250 μm. Zoom-in image of boxed area in (B) showing distinct epithelial lining of PCCs. Scale bar is 20 μm. (C) Confocal micrograph of a cancer cell duct on a typical dT-MOC. (D) Immunohistology micrograph showing H&E and BrdU stainings.
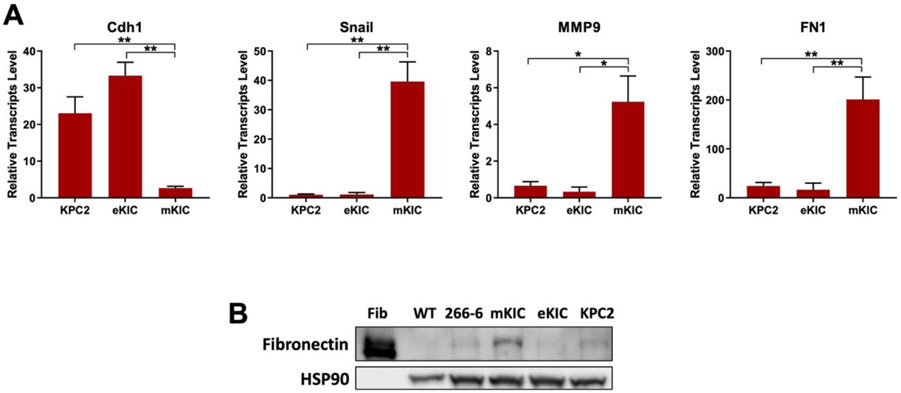
Molecular characteristics of all cancer cell lines (KPC2, eKIC, and mKIC) from mouse PDAC tumors are presented in Figure 3. The KPC2 and eKIC cells express high levels of E-cadherin (Cdh1) and low levels of the EMT marker Snail. In contrast, mKIC cells exhibit an exclusive mesenchymal phenotype that is characterized by a fibroblastic morphology and high levels of Snail, MMP9, and fibronectin (FN1) expression. All these cancer cell lines are highly tumorigenic in orthotopic xenograft models.[32-34]
Figure 3.
Molecular analysis of cells used in dT-MOC platform. (A) RT-qPCR results. Transcript levels of E-cadherin (Cdh1) (epithelial marker), and Snail and MMP9 (EMT and mesenchymal markers) show heterogeneous expression of these genes in the cancer cell lines studied. (*, p < 0.05 and **, p < 0.01). (B) Immnoblot analysis. Fibronectin (FN1) levels are confirmed in mKIC cells. The WT pancreas, acinar cell line (266-6), eKIC and KPC2 samples have neglectable levels of Fibronectin whereas mKIC exhibit high levels of Fibronectin protein. Note that pure Fibronectin protein (Fib) was used as a positive control.
2.2. Local Invasion of Cancer Cells
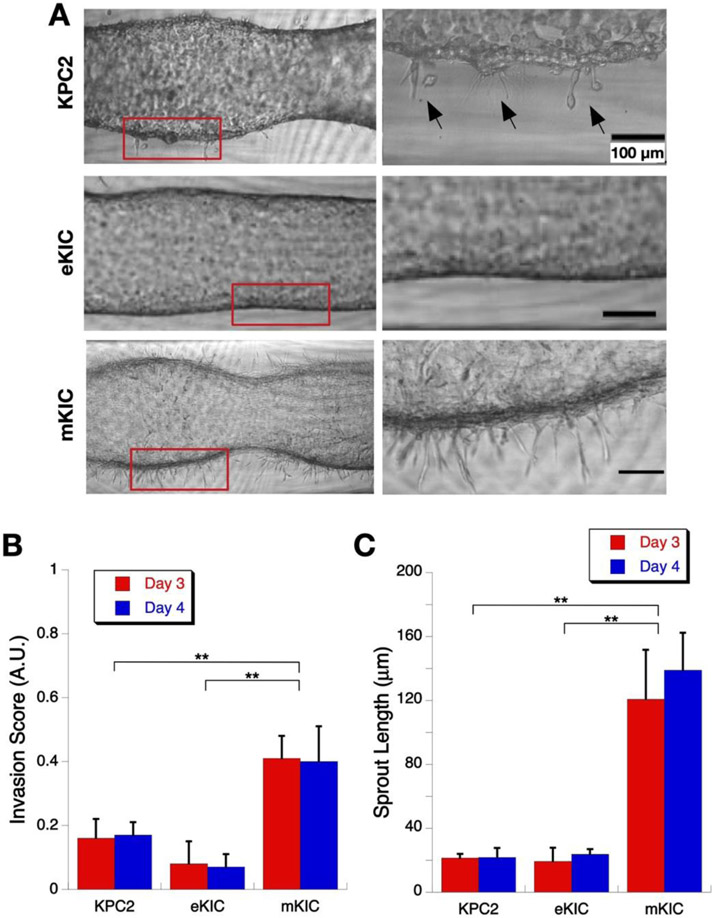
The dT-MOC platforms of three different PCC cell lines - KPC2, eKIC, and mKIC - are shown in Figure 4. All three cell lines grow well in the dT-MOC platforms, but there are notable differences. KPC2 and mKIC cells form a more distinct epithelial lining but develop many "sprouting" spots as the cells spread into the ECM (Figure 4A). To quantitatively compare the degree of invasion, local invasion scores were defined as "frequency of sprouting extensions per unit length of PCC ducts" and calculated for each treatment group (Figure 4B) as well as the mean sprout length (Figure 4C). In the case of KPC2, many of the sprouting extensions result in local invasion and migration of PCCs into the surrounding matrix (noted with arrows), closely resembling an EMT process. Some cells are even completely separate from the lumen. Significantly higher invasion scores and longer sprouts are observed in mKIC than KPC2 or eKIC. In contrast, eKIC cells only form a ductal lumen with a thin PCC-collagen interface and without notable sprouts.
Figure 4.
Local Invasion of cancer cells in the dT-MOC platforms. (A) Micrographs of growth and invasion of KPC2, eKIC, and mKIC cells. Zoomed-in images of boxed areas are shown at the right side. (B) Invasion score at Days 3 and 4. The mKIC line shows higher invasion score than other cell lines (**, p < 0.01). (C) Mean sprout length at Days 3 and 4. Again, the mKIC line shows longer sprouts than other cell lines (**, p < 0.01)
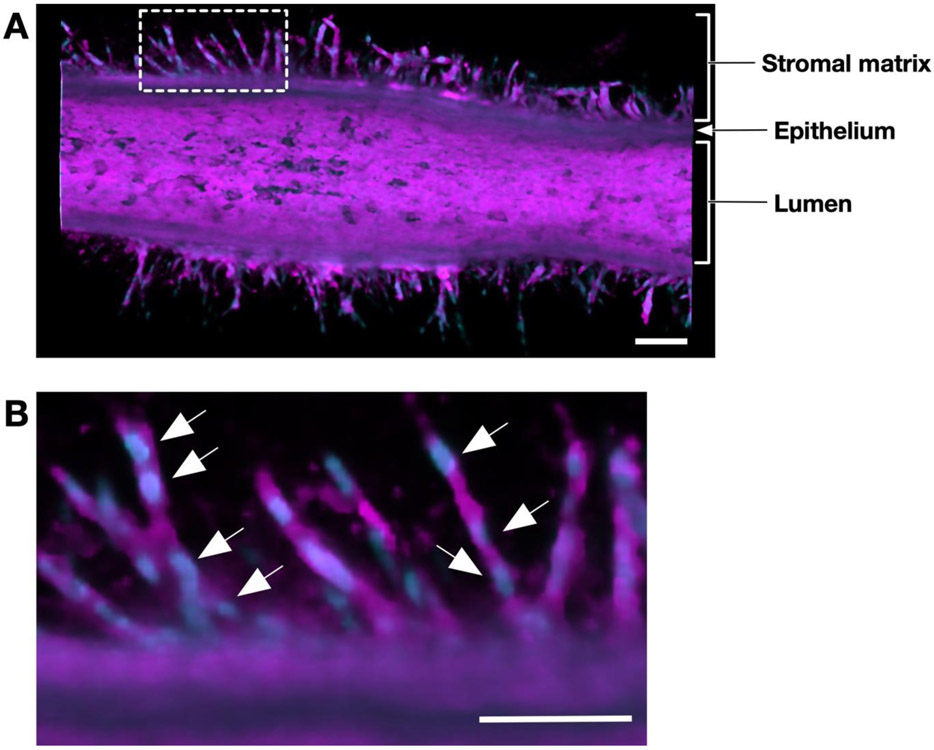
A representative confocal micrograph of an mKIC duct is shown in Figure 5. The micrograph was obtained by staining the cell membranes and nuclei of a 3-day mKIC dT-MOC sample. The figure shows a 3D rendering of half of the duct with an enlarged view of the invasions. Here, long sprouts invading into the matrix from all sides of the duct are readily observed. These invasions show morphological changes in the cells that are very similar to those that occur during EMT. A closer look at one region of this duct (i.e., boxed area) reveals that many of the sprouts consist of multiple cells based on the number of nuclei that can be identified within a sprout forming a chain of invading cells. This confirms that the mKIC cells were collectively invading as multicellular streams as opposed to single cells.
Figure 5.
Confocal micrographs of collective migration of cancer cells. (A) Confocal micrograph of an mKIC duct after 3 days culture stained for cell membranes (magenta) and nuclei (blue). (B) Confocal micrograph of the enlarged white boxed area. Arrows indicate individual cells which make up invading cell chains. Scale bars represent 100 μm.
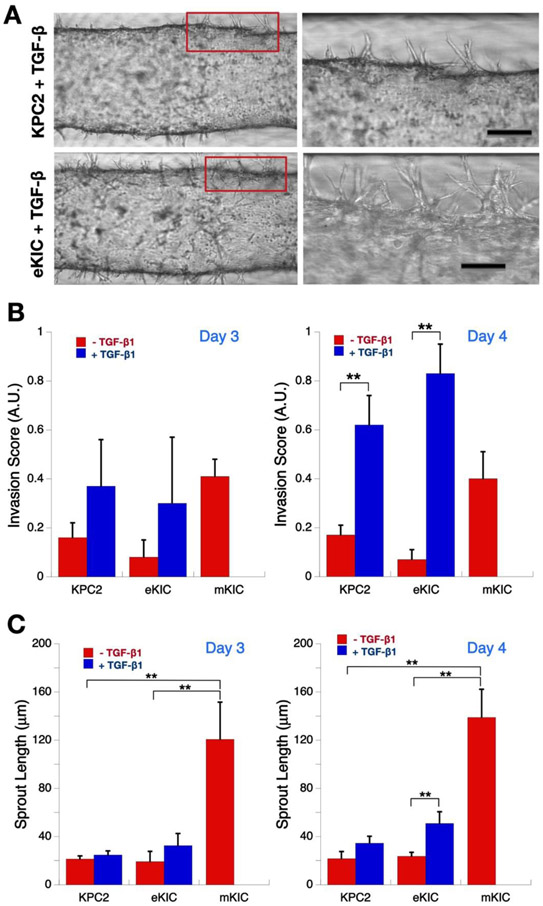
After 24 hours of pre-culture followed by 24 hours of serum starvation, both KPC2 and eKIC dT-MOC platforms were treated with 1.0 nM TGF-β1 for up to 48 hours. We chose to treat cells with TGF-β1 because TGF- β /SMAD is a well characterized signaling pathway that induces epithelial-mesenchymal transition (EMT) in a number of cancers, including PDAC, often leading to metastasis, invasion and chemoresistance.[35-37] EMT is modulated by complex regulatory networks involving a number of EMT-inducing transcription factors (SNAIL, ZEB, TWIST) as well as other transcriptional regulators through epigenetic modifications and microRNAs (miRNAs). The micrographs of TGF-β1 treated groups showed notably enhanced sprouts and local invasion for both KPC2 and eKIC cell genotypes (Figure 6A). Quantitatively, in both KPC2 and eKIC groups, the invasion score, which is a normalized number of sprouts, increases with TGF-β1 treatment compared to the untreated controls. It reaches to that of mKIC at Day 3 (Note that mKIC without TGF-β1 treatment was plotted to compare with other cell types with TGF-β1 treatment). The invasion scores of TGF-β1 treated groups further increase beyond that of mKIC on Day 4, and the difference with their untreated control groups becomes statistically significant (Figure 6B, p < 0.01).
Figure 6.
Enhancement of cancer cell invasion by TGF-β1. (A) Micrographs of invasion of KPC2 and eKIC cells with TGF-β1 treatment. Zoomed-in images of boxed areas are shown at the right side. Scale bars represent 100 μm. (B) Invasion score at Days 3 and 4. The invasion score of both KPC2 and eKIC increase with TGF-β1 treatment (**, p < 0.01). (C) Mean sprout length at Days 3 and 4. The mean sprout length also increases with TGF-β1 treatment. (**, p < 0.01).
Similar to the invasion score, the mean sprout length of both epithelial cancer cell groups increases with TGF-β1 treatment (Figure 6C). The statistical significance was observed in the eKIC groups (p < 0.01). In contrast to the invasion score, however, the mean sprout length of both epithelial cancer cell groups significantly shorter than that of mKIC (p < 0.01). Interestingly, a more notable enhancement of local invasion was observed in the eKIC cells than KPC2 with the mean sprout length exceeding a distance of 75 μm from the lumen. Without treatment, the KPC2 genotype showed a higher frequency of local invasion than the eKIC cells. However, the trend is reversed with TGF-β1 treatment. In other words, KPC2 cells were the more invasive cell genotype without TGF-β1, while eKIC cells became far more aggressive and invasive when subjected to in vivo-like conditions through TGF-β1 treatment.
2.3. Mimicry of Intra-tumoral Heterogeneity
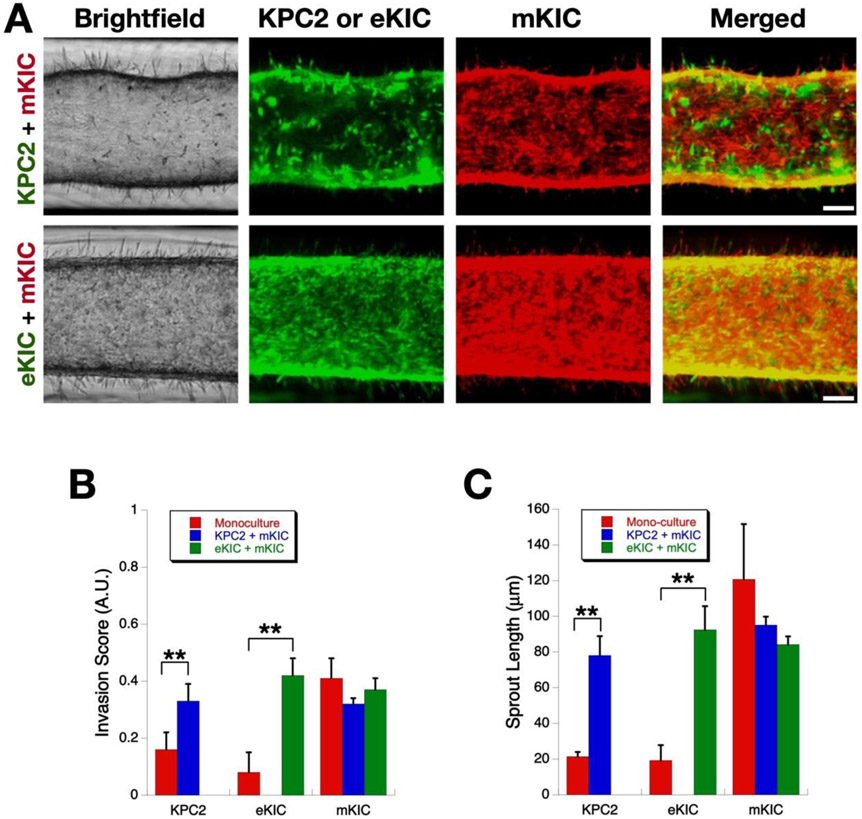
In order to study the effect that one cancer cell type has on another’s invasiveness, we tested two co-culture systems which include a mesenchymal-like cell (mKIC) and an epithelial-like cell (eKIC or KPC2), as shown in Figure 7. To differentiate between the two cell lines within the platform, we used cells specifically engineered to express either green fluorescent protein (GFP) or red fluorescent protein (RFP): nuclear GFP KPC2, GFP eKIC, and RFP mKIC. We first confirmed that mKIC cells are still invasive and no significant change was observed in either invasion score or sprout length as compared to the monoculture case. Although it is not statistically significant, compared to the monoculture, invasion measures of mKCI cells slightly decrease in co-culture groups. This decrease is thought to be caused by the competition between cancer cell subgroups for adhesion sites, which remain the same as the monoculture. However, when KPC-2 or eKIC were added to the mKIC culture, their invasion behaviors were altered. Specifically, both cell lines showed a significantly enhanced frequency of invasion as well as increased sprout lengths. The eKIC cells exhibited a more drastically increased invasion score as well as sprout length as compared to KPC2, which was similar to the results seen above when adding TGF-β1. These results suggest that the mKIC cancer cells can enhance the invasion characteristics of both epithelial-like cancer cells (Supplementary Video).
Figure 7.
Enhancement of cancer cell invasion by interactions between heterogenous cancer cells. (A) Micrographs of invasion of co-culture models. Scale bars represent 100 μm (B) Invasion score at Days 3 and 4. Both KPC2 and eKIC become more invasive after co-culture (**, p < 0.01). However, the invasiveness of mKIC line remain the same regardless of mono- or co-cultures. (C) Mean sprout length (**, p < 0.01).
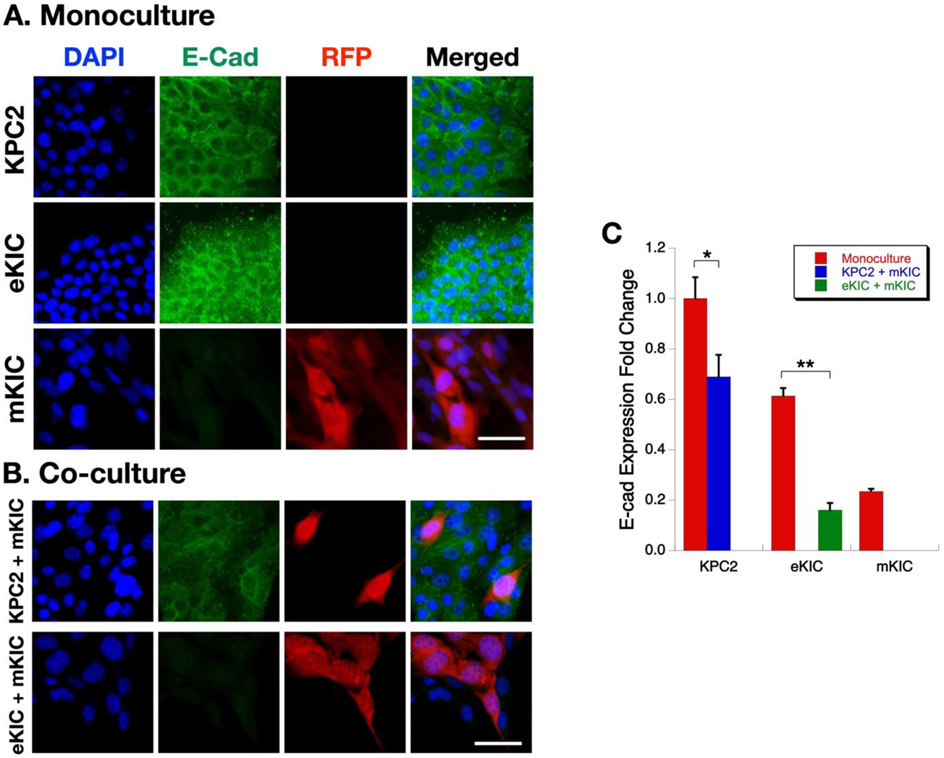
In order to understand the molecular mechanisms associated with changes in the invasiveness of the PCCs during co-culture, immunofluorescence microscopy was performed. The changes in E-cadherin expression were examined, whose decrease is an indicator of EMT of epithelial cancer cells.[38] Representative results are presented in Figure 8. As shown in Figure 8A, when mono-cultured, KPC2, and eKIC cells show a notably high expression of E-cadherin, but mKIC cells exhibit a very low level. This observation is well correlated with the transcript levels of Cdh1 in Figure 3A. It also concurs with the high invasiveness of mKIC cells compared to the other two epithelial type cancer cells. However, when the cells were co-cultured, the E-cadherin expression of KPC2 and eKIC are suppressed. For example, in the eKIC + mKIC co-culture, E-cadherin expression is almost completely suppressed (Figure 8B). This E-cadherin suppression suggests that mesenchymal subtypes of cancer cells may affect other epithelial subtypes and enhance the EMT of epithelial subtypes of cancer cells. Quantification of the E-cadherin fluorescence intensity strongly supports the observation of E-cadherin expression decrease (Figure 8C). These changes are also heterogeneous and more prominent at the eKIC-mKIC co-culture than KPC2-mKIC co-culture. The decrease of E-cadherin and associated EMT in the co-culture of cancer cell subtypes is a new observation. Previously, the EMT of epithelial cancer cells has been thought to be caused by TGF-β1 and other growth factors secreted by CAF. However, the present results suggest that there are additional EMT-inducing mechanisms by interaction among cancer cells.
Figure 8.
Immunostaining of E-cadherin in mono- and co-culture. (A) Immunofluroescence analysis of KPC2, eKIC, mKIC monocultures. (B) Immunofluorescence analysis of KPC2 + mKIC, and eKIC + mKIC co-cultures. DAPI (i.e., nuclei), E-cad, RFP (i.e., mKIC), and merged images are shown. Scale bar represents 50 μm. (C) Fold change of E-cadherin expression. (*, p < 0.05 and **, p < 0.01)
3. Discussion
Intra-tumoral heterogeneity is one of the most puzzling challenges in cancer research and treatment. The term of heterogeneity has multiple implications – heterogeneous subpopulations of cancer cells with distinct mutations within a given tumor (i.e., spatial heterogeneity) and/or temporal variations of these genetic and molecular characteristics (i.e., temporal heterogeneity).[39] It has been reported that PCCs carry an average of 63 genetic alterations per cancer, which can be grouped into 12 core signaling pathways.[1] Among these mutations, key driver mutations of human PDAC have been identified. Notably, KRAS and CDKN2A mutations occur in 90 to 95% of PDACs, and TP53 mutations occur in 75% of PDAC.[17, 18, 40] Thus, the cell lines studied here, which were isolated from GEMM with mutations of KRAS and TP53 (KPC2) or KRAS and CDKN2A (eKIC and mKIC), represent key mutational characteristics of human PDAC. These genetically engineered cells will allow us to elucidate interaction mechanisms among heterogeneous cancer cells, which are extremely difficult to study using established human PCC lines.
Creating tumor models that mimic this heterogeneity in a reliable manner is extremely challenging. Recent developments of engineered tumor models [41-48] show a great promise to recapitulate a 3D microenvironment to study the TME. However, many of these in vitro models have used isogenic cancer cells, which significantly hamper the capability of mimicking true heterogeneity found in the disease. Several recent studies have addressed this issue by mixing established cancer cell lines.[49] However, careful consideration and characterization of the genetic and molecular properties of cancer cells used are necessary. Patient-derived organoids[50, 51] may carry the heterogeneity, but it is difficult to control and maintain both the spatial and temporal nature of heterogeneity from patients. The present dT-MOC model suggests that this challenge can be addressed by integrating cancer cells whose genetics and molecular characteristics are carefully engineered. Recent developments of CRISPR and other gene-editing technologies will significantly advance engineered tumor models with precisely controlled intra-tumoral heterogeneity.
In addition to the anatomical resemblance, the present model recreates the biomechanical microenvironment of PDAC precisely. During the initiation and progression of PDAC, epithelial cancer cells interact with the stroma surrounding only at the basal side of the duct, but not at the luminal side. Interactions with neighboring cells are limited to lateral directions. These features are crucial aspects to regulate the biomechanical interactions between the cancer cells, and between the PCC epithelium and the stromal tissue. Other models without duct structure, including spheroids, organoids, and xenografts, do not provide this biomechanical microenvironment and are more suitable to represent the very late stage of the disease. The present dT-MOC model can also be used to decipher the mechanisms of EMT and local invasion in PDAC. EMT and local invasion of epithelial cancer cells have been thought of as a consequence of interactions between CAFs and cancer cells.[52-54] Stromal cells, including CAFs, inflammatory cells and macrophages, produce chemokines and cytokines that include fibroblast growth factors (FGFs), epidermal growth factor (EGF) receptor ligands, TGF-β isoforms, and connective tissue growth factor (CTGF).[55, 56] Among these growth factors, TGF-β signaling has been implicated in EMT, local invasion, and metastasis of PDAC.[55] After treatments of TGF-β, both genotypes of PCC showed significantly increased, and longer sprouts, which suggests a TGF-β induced EMT and local invasion event. In addition to CAF-induced EMT and local invasion, the present results strongly suggest that cancer cells with a mesenchymal phenotypic characteristic can induce EMT and enhance local invasion of other PCCs as illustrated in Figures 7 and 8. Future studies will focus on interrogating these complex pathways and molecular interactions using the dT-MOC platform.
Although the present dT-MOC model recapitulates intra-tumoral heterogeneity of the PDAC, it still warrants further research to better mimic other aspects of the PDAC TME. One of the limitations is the lack of CAF. The CAFs are the main cellular component of the desmoplastic stroma, which either directly interface with PCC at the duct periphery or distribute throughout the inter-ductal spaces. CAFs synthesize the matrix proteins and induce fibrosis. CAFs also regulate ECM degradation by expressing matrix metalloproteinases (MMPs), and by facilitating tumor growth, invasion and metastasis.[57] Also, the present dT-MOC primarily employed collagen, but other ECM components are noted in human PDAC. These are hyaluronic acid, fibronectin, and fibrin. HA accounts for approximately 30% of the ECM proteins of human PDAC tissues.[31, 58] In healthy pancreatic tissue, HA content is significantly low at 3% of the total proteins, as summarized previously.[44] Besides, fibrin is also reported in the PDAC tissue, which is associated with thrombin-mediated proteolysis of fibrinogen.[59]
Secondly, although only TGF-β1 was tested in the present study, the present model can be used to test the effects of various growth factors and their combinations on the EMT and local invasion of cancer cells including IL-6[60]and EGF.[61] In addition, for broader applications, it would be desired to have an in vitro model of normal epithelial duct. However, contrast to MCF10A cell lines for breast cancers, murine normal pancreatic duct epithelial or acinar cells are rarely available for in vitro culture. Cellular engineering of these cells for in vitro culture may enable normal pancreatic duct models.
4. Conclusion
We developed a new biomimetic tumor model of PDAC to mimic EMT and local invasion with intra-tumoral heterogeneity. This model was designed to recapitulate the microanatomy of PDAC, which a duct of epithelial cancer cells surrounded by the stromal matrix. In order to reconstitute the intra-tumoral heterogeneity, the model used murine PCC from genetically engineered mouse models, which carries key driver mutations of human PDAC including KRAS, CDKN2A, and TP53 mutations. The model showed that there are complex interactions even between cancer cells, and the interactions cause cancer cells more aggressive and invasive. The present study demonstrates the feasibility of constructing a PDAC model with controlled intra-tumoral heterogeneity. It is envisioned that the model can be further developed by incorporating patient-derived cancer and stromal cells.
5. Experimental Section
Cells and Reagents:
Three murine pancreatic cancer cell lines were isolated from PDAC tissues from GEMMs. KPC mice, containing LSL-KrasG12D/+, LSL-Trp53R172H, pdx1Cre alleles gave rise to the KPC2 tumor cell line.[34] Two KIC cell lines (eKIC and mKIC) were obtained from Dr. Murray Korc's laboratory at the Indiana University, which were established from mouse tumors derived from pancreata containing KrasG12D, Ink4a/Arffl/fl, and pdx1Cre alleles.[33] All cell lines were initially grown on polystyrene tissue culture treated flasks (Fisher Scientific, Hampton, NH) in HyClone RPMI 1640 medium with L-glutamine (GE Healthcare Life Sciences, Pittsburgh, PA) supplemented with 5% fetal bovine serum (FBS, Gibco, Carlsbad, CA) and 10,000 U/mL Penicillin-Streptomycin (Invitrogen, Carlsbad, CA). For use in experiments, cells were harvested at 70-80% confluence using 0.05% Trypsin-EDTA (Invitrogen, Carlsbad, CA). All cells were kept under passage 15.
Microfabrication of Ductal Tumor Microenvironment on Chip (dT-MOC):
A two-part polydimethylsiloxane (PDMS, Dow Corning, Midland, MI) solution was poured into a brass, micro-machined mold with a microchannel configuration and allowed to cure overnight. After removal from the mold, inlet and outlet ports of PDMS chips were cut using biopsy punches. The PDMS chips were bonded using a corona discharger and sterilized with UV. A solution of 6.0 mg/mL type I collagen (High Concentration Rat Tail Collagen, Corning, Corning, NY) was then prepared. Approximately 20 μL of collagen solution was added to the inlet port of the device. A single droplet of 20 μL of culture medium was placed at the inlet, forming a patent lumen through the collagen via viscous fingering.[62] The details of dT-MOC fabrication are provided in Supplement Information. The devices were then incubated at 37°C for 15-20 minutes. Pancreatic cancer cell suspensions were prepared at concentrations of 20,000 cells/μL. 10 μL of cell suspension was added to the inlet of the device, which was subsequently incubated at 37°C and 5% CO2 for 15 minutes. This process was repeated three times, rotating the device 90 degrees with each 10 μL added, until 40 μL of cell suspension had been added and a cell monolayer had formed. In co-culture groups, mixture of two types of cancer cells were seeded at once, or this loading procedure was repeated with the second cell line to create a bilayer duct composed of distinct monolayers of each cell type. Culture medium reservoirs were then placed at the inlet and outlet, and 750 μL of culture medium was perfused through the lumen. The device was placed in the incubator at 37°C and 5% CO2 and medium was changed every 24 hours for the duration of the experiment.
RT-qPCR:
Gene expression of cell lines were characterized by RT-qPCR before they were seeded. In addition, gene expression of each cell line cultured in dT-MOC was characterized. Cells from dT-MOC devices were extracted and total RNA was harvested using a miRNeasy Mini kit (Qiagen, Cat.217004, Hilden, Germany). Total RNA was then quantified and converted into cDNA using the iScript cDNA synthesis kit (Bio-Red, Cat 1708891, Hercules, CA). Quantitative RT-PCR was subsequently performed using SYBR green (Roche, cat. 04913850001, Indianapolis, IN) to assess the relative transcript levels of each gene. All genes were normalized to internal control 18S expression and each group represents a minimum of three biological replicates. Data were analyzed using the standard ΔΔCt method to determine the relative fold changes in each gene.
Immunoblotting:
WT mouse pancreas was cut and homogenized in standard RIPA buffer. Murine PDAC cells were isolated from their respective mouse PDAC tumors and cultured in RPMI 1640 medium with 10% FBS, 1% penicillin/streptomycin at 5% CO2 37°C. The cells were then lysed in standard RIPA buffer containing sodium vanadate (Cat. 450253, Sigma), protease inhibitor and phosphatase inhibitor (Cat P5726 and P0044, Roche). Proteins were separated using SDS gel electrophoresis and then transferred to PVDF membranes (Bio-Red, Cat 1620177) overnight at 4°C, followed by immunoblotting for Fibronectin (Santa Cruz, sc-9068, 1:100) and Hsp90 (Santa Cruz, SC-7947, 1:1000). Blots were developed using ECL (Thermo Scientific, Cat 32106).
Histology and Immunohistochemisty:
After culturing in dT-MOC devices for 48 hours, the samples were incubated with media containing 10 μM BrdU (5-bromo-2’-deoxyuridine) for 1.5 hours and subsequently subjected to fixation in 10% neutral buffered formalin at 4°C overnight. The dT-MOC samples were then filled with 15% native PAGE acrylamide gel for maintaining the dT-MOC structure. A scalpel was used to cut open the dT-MOC and expose the luminal collagen tissue. The dT-MOC tissues were then processed, embedded in paraffin, and sectioned using standard histological techniques. Sections were deparaffinized and retrieved using the 2100-retriever (Electron Microscopy Sciences, Hatfield, PA) with antigen unmasking solution (Vector Laboratories, Burlingame, CA). For BrdU IHC staining, dT-MOC sections were treated with 3% H2O2 for 5 mins to block endogenous peroxidase activity. The immunogen blocking step was subsequently performed using M.O.M blocking reagent (Vector Laboratories, Burlingame, CA) for 1 hour at room temperature followed by incubation with 1:250 BrdU antibody (Oncogene, NA20-100) and 1:200 Type IV collagen antibody (Abcam. Ab6586), or 1:100 E-cadherin antibody (Abcam, ab76055) for 1 hour at room temperature. Biotinylated secondary antibody was applied to the dT-MOC section at 1:200 dilution for 10 minutes at room temperature. Vector developing reagents and DAB (diamonibenzidine) peroxidase substrate (Vector Laboratories, Burlingame, CA) were used for IHC development. For E-cadherin, samples were incubated for 20 minutes with 1:200 Avidin–Alexa Fluor 488 (Cat. S11223, Invitrogen, Carlsbad, CA, USA) and 1:1000 DAPI.
Invasion Assay:
The extent of local invasion of cancer cells on the dT-MOC platform was characterized with and without TGF-β1 treatment. At 24 hours prior to the experiment, dT-MOC devices with KPC2 and eKIC mono-cultures were incubated in serum-starved medium (1% FBS). Then, a solution of 1.0 nM TGF-β1 (Fisher Scientific, Hampton, NH) was added and cells were cultured for 48 hours with images taken daily. Local invasion of cancer cells was characterized into two parameters - "local invasion score" and "mean sprout length." The invasion score is the number of sprouting sites per unit length of duct, which are further normalized across all samples. Mean sprout length was determined as the straight-line distance between the base and tip of the local invasion site. The details of image analysis are provided in Supplement Information. Briefly, image processing macros were developed using ImageJ (NIH, Bethesda, MD). Each image was binarized to delineate the lumen boundary and locally invading cells. After filtering for noise, the ImageJ "Skeletonize" function and "Analyze Skeleton" plugin was used to determine the number and length of sprouting from the lumen. The number of sprouting sites was normalized per unit length of duct across all samples, yielding a "local invasion score" between 0 and 1. Mean sprout length was determined as the straight-line distance between the base and tip of the local invasion site. The details of image analysis are provided in Supplement Information.
Statistical Analysis:
Relevant study groups in each experiment were compared by Student's t-test. A minimum of three samples were analyzed for each group. The minimum level for statistical significance was p-value < 0.05. Data is reported in the form of mean ± standard deviation.
Supplementary Material
Acknowledgements
This work is partially supported by grants from National Institutes of Health (U01 HL143403, UL1 TR002529 to BH, and R01 CA211098, R01 CA124586 to SFK), a Challenge Award from the Purdue University Center for Cancer Research (P30 CA023168), and the Walther Embedding Program in Physical Sciences in Oncology. The confocal images were obtained at the Purdue Imaging Facility at Bindley Bioscience Center. The authors are also very grateful to Dr. Murray Korc for providing two KIC cell lines.
Footnotes
Supporting Information
Supporting Information is available from the Wiley Online Library or from the author.
Contributor Information
Michael J. Bradney, School of Mechanical Engineering, Purdue University, West Lafayette, IN 47907, USA
Stephanie M. Venis, School of Mechanical Engineering, Purdue University, West Lafayette, IN 47907, USA
Yi Yang, Department of Biological Science, Purdue University, West Lafayette, IN, USA.
Stephen F. Konieczny, Department of Biological Science, Purdue University, West Lafayette, IN, USA
Bumsoo Han, School of Mechanical Engineering, Purdue University, West Lafayette, IN 47907, USA.
References
- [1].Campbell PJ; Yachida S; Mudie LJ; Stephens PJ; Pleasance ED; Stebbings LA; Morsberger LA; Latimer C; McLaren S; Lin M-L; McBride DJ; Varela I; Nik-Zainal SA; Leroy C; Jia M; Menzies A; Butler AP; Teague JW; Griffin CA; Burton J; Swerdlow H; Quail MA; Stratton MR; Iacobuzio-Donahue C; Futreal PA, Nature 2010, 467 (7319), 1109–1113. DOI 10.1038/nature09460. [DOI] [PMC free article] [PubMed] [Google Scholar]
- [2].Jones S; Zhang X; Parsons DW; Lin JCH; Leary RJ; Angenendt P; Mankoo P; Carter H; Kamiyama H; Jimeno A; Hong SM; Fu B; Lin MT; Calhoun ES; Kamiyama M; Walter K; Nikolskaya T; Nikolsky Y; Hartigan J; Smith DR; Hidalgo M; Leach SD; Klein AP; Jaffee EM; Goggins M; Maitra A; Iacobuzio-Donahue C; Eshleman JR; Kern SE; Hruban RH; Karchin R; Papadopoulos N; Parmigiani G; Vogelstein B; Velculescu VE; Kinzler KW, Science 2008, 321 (5897), 1801–1806. DOI 10.1126/science.1164368. [DOI] [PMC free article] [PubMed] [Google Scholar]
- [3].Yachida S; Jones S; Bozic I; Antal T; Leary R; Fu B; Kamiyama M; Hruban RH; Eshleman JR; Nowak MA; Velculescu VE; Kinzler KW; Vogelstein B; Iacobuzio-Donahue CA, Nature 2010, 467 (7319), 1114–1117. DOI 10.1038/nature09515. [DOI] [PMC free article] [PubMed] [Google Scholar]
- [4].Feldmann G; Dhara S; Fendrich V; Bedja D; Beaty R; Mullendore M; Karikari C; Alvarez H; Iacobuzio-Donahue C; Jimeno A; others, Cancer Res 2007, 67 (5), 2187–2196. [DOI] [PMC free article] [PubMed] [Google Scholar]
- [5].Morris JP; Wang SC; Hebrok M, Nature Reviews Cancer 2010, 10 (10), 683–695. DOI 10.1038/nrc2899. [DOI] [PMC free article] [PubMed] [Google Scholar]
- [6].Korc M, Cancer Biol Ther 2010, 10 (6), 588–591. DOI 10.4161/cbt.10.6.13128. [DOI] [PMC free article] [PubMed] [Google Scholar]
- [7].Erkan M; Hausmann S; Michalski CW; Fingerle AA; Dobritz M; Kleeff J; Friess H, Nature Reviews Gastroenterology and Hepatology 2012, 9, 454–467. [DOI] [PubMed] [Google Scholar]
- [8].Drifka CR; Tod J; Loeffler AG; Liu Y; Thomas GJ; Eliceiri KW; Kao WJ, Mod Pathol 2015, 28 (11), 1470–1480. DOI 10.1038/modpathol.2015.97. [DOI] [PubMed] [Google Scholar]
- [9].Neesse A; Michl P; Frese KK; Feig C; Cook N; Jacobetz MA; Lolkema MP; Buchholz M; Olive KP; Gress TM; Tuveson DA, Gut 2011, 60 (6), 861–868. DOI 10.1136/gut.2010.226092. [DOI] [PubMed] [Google Scholar]
- [10].Gore J; Korc M, Cancer Cell 2014, 25 (6), 711–712. DOI 10.1016/j.ccr.2014.05.026. [DOI] [PMC free article] [PubMed] [Google Scholar]
- [11].Mahadevan D; Von Hoff DD, Molecular Cancer Therapeutics 2007, 6 (4), 1186–1197. DOI 10.1158/1535-7163.MCT-06-0686. [DOI] [PubMed] [Google Scholar]
- [12].Xie D; Xie K, Genes & Diseases 2015, 2 (2), 133–143. DOI 10.1016/j.gendis.2015.01.002. [DOI] [PMC free article] [PubMed] [Google Scholar]
- [13].Deer EL; Gonzalez-Hernandez J; Coursen JD; Shea JE; Ngatia J; Scaife CL; Firpo MA; Mulvihill SJ, Pancreas 2010, 39 (4), 425–435. DOI 10.1097/MPA.0b013e3181c15963. [DOI] [PMC free article] [PubMed] [Google Scholar]
- [14].Sipos B; Möser S; Kalthoff H; Török V; Löhr M; Klöppel G, Virchows Arch. 2003, 442 (5), 444–452. DOI 10.1007/s00428-003-0784-4. [DOI] [PubMed] [Google Scholar]
- [15].Monti P; Marchesi F; Reni M; Mercalli A; Sordi V; Zerbi A; Balzano G; Di Carlo V; Allavena P; Piemonti L, Virchows Arch. 2004, 445 (3), 236–247. DOI 10.1007/s00428-004-1053-x. [DOI] [PubMed] [Google Scholar]
- [16].Loukopoulos P; Kanetaka K; Takamura M; Shibata T; Sakamoto M; Hirohashi S, Pancreas 2004, 29 (3), 193–203. [DOI] [PubMed] [Google Scholar]
- [17].Bailey P; Chang DK; Nones K; Johns AL; Patch A-M; Gingras M-C; Miller DK; Christ AN; Bruxner TJC; Quinn MC; Nourse C; Murtaugh LC; Harliwong I; Idrisoglu S; Manning S; Nourbakhsh E; Wani S; Fink L; Holmes O; Chin V; Anderson MJ; Kazakoff S; Leonard C; Newell F; Waddell N; Wood S; Xu Q; Wilson PJ; Cloonan N; Kassahn KS; Taylor D; Quek K; Robertson A; Pantano L; Mincarelli L; Sanchez LN; Evers L; Wu J; Pinese M; Cowley MJ; Jones MD; Colvin EK; Nagrial AM; Humphrey ES; Chantrill LA; Mawson A; Humphris J; Chou A; Pajic M; Scarlett CJ; Pinho AV; Giry-Laterriere M; Rooman I; Samra JS; Kench JG; Lovell JA; Merrett ND; Toon CW; Epari K; Nguyen NQ; Barbour A; Zeps N; Moran-Jones K; Jamieson NB; Graham JS; Duthie F; Oien K; Hair J; Grützmann R; Maitra A; Iacobuzio-Donahue CA; Wolfgang CL; Morgan RA; Lawlor RT; Corbo V; Bassi C; Rusev B; Capelli P; Salvia R; Tortora G; Mukhopadhyay D; Petersen GM; Munzy DM; Fisher WE; Karim SA; Eshleman JR; Hruban RH; Pilarsky C; Morton JP; Sansom OJ; Scarpa A; Musgrove EA; Bailey U-MH; Hofmann O; Sutherland RL; Wheeler DA; Gill AJ; Gibbs RA; Pearson JV; Waddell N; Biankin AV; Grimmond SM, Nature 2016, 531 (7592), 47–52. DOI 10.1038/nature16965. [DOI] [PubMed] [Google Scholar]
- [18].Kleeff J; Korc M; Apte M; La Vecchia C; Johnson CD; Biankin AV; Neale RE; Tempero M; Tuveson DA; Hruban RH; Neoptolemos JP, Nature Reviews Disease Primers 2016, 2, 16022 DOI 10.1038/nrdp.2016.22. [DOI] [PubMed] [Google Scholar]
- [19].Loessner D; Stok KS; Lutolf MP; Hutmacher DW; Clements JA; Rizzi SC, Biomaterials 2010, 31 (32), 8494–8506. DOI 10.1016/j.biomaterials.2010.07.064. [DOI] [PubMed] [Google Scholar]
- [20].Pampaloni F; Reynaud EG; Stelzer EHK, Nature Reviews 2007, 8 (October), 839–845. [DOI] [PubMed] [Google Scholar]
- [21].Weigelt B; Bissell MJ, Semin Cancer Biol 2008, 18, 311–321. [DOI] [PMC free article] [PubMed] [Google Scholar]
- [22].Huang L; Holtzinger A; Jagan I; BeGora M; Lohse I; Ngai N; Nostro C; Wang R; Muthuswamy LB; Crawford HC; Arrowsmith C; Kalloger SE; Renouf DJ; Connor AA; Cleary S; Schaeffer DF; Roehrl M; Tsao M-S; Gallinger S; Keller G; Muthuswamy SK, Nature Medicine 2015, advance online publication DOI 10.1038/nm.3973. [DOI] [Google Scholar]
- [23].Muranen T; Selfors LM; Worster DT; Iwanicki MP; Song L; Morales FC; Gao S; Mills GB; Brugge JS, Cancer Cell 2012, 21 (2), 227–239. DOI 10.1016/j.ccr.2011.12.024. [DOI] [PMC free article] [PubMed] [Google Scholar]
- [24].Sempere LF; Gunn JR; Korc M, Cancer Biol. Ther. 2011, 12 (3), 198–207. [DOI] [PMC free article] [PubMed] [Google Scholar]
- [25].Zanoni M; Piccinini F; Arienti C; Zamagni A; Santi S; Polico R; Bevilacqua A; Tesei A, Sci Rep 2016, 6 DOI 10.1038/srep19103. [DOI] [PMC free article] [PubMed] [Google Scholar]
- [26].Becher OJ; Holland EC, Cancer Res 2006, 66 (7), 3355–3359. DOI 10.1158/0008-5472.CAN-05-3827. [DOI] [PubMed] [Google Scholar]
- [27].HogenEsch H; Nikitin AY, Journal of Controlled Release 2012, 164 (2), 183–186. DOI 10.1016/j.jconrel.2012.02.031. [DOI] [PMC free article] [PubMed] [Google Scholar]
- [28].Olive KP; Jacobetz MA; Davidson CJ; Gopinathan A; McIntyre D; Honess D; Madhu B; Goldgraben MA; Caldwell ME; Allard D; Frese KK; Denicola G; Feig C; Combs C; Winter SP; Ireland-Zecchini H; Reichelt S; Howat WJ; Chang A; Dhara M; Wang L; Ruckert F; Grutzmann R; Pilarsky C; Izeradjene K; Hingorani SR; Huang P; Davies SE; Plunkett W; Egorin M; Hruban RH; Whitebread N; McGovern K; Adams J; Iacobuzio-Donahue C; Griffiths J; Tuveson DA, Science 2009, 324 (5933), 1457–61. DOI 10.1126/science.1171362 10.1126/science.1171362. Epub 2009 May 21.. [DOI] [PMC free article] [PubMed] [Google Scholar]
- [29].Singh M; Lima A; Molina R; Hamilton P; Clermont AC; Devasthali V; Thompson JD; Cheng JH; Bou Reslan H; Ho CCK; Cao TC; Lee CV; Nannini MA; Fuh G; Carano RAD; Koeppen H; Yu RX; Forrest WF; Plowman GD; Johnson L, Nat. Biotechnol 2010, 28 (6), 585–593. DOI 10.1038/nbt.1640. [DOI] [PubMed] [Google Scholar]
- [30].Carpino G; Renzi A; Cardinale V; Franchitto A; Onori P; Overi D; Rossi M; Berloco PB; Alvaro D; Reid LM; Gaudio E, Journal of Anatomy 2016, 228, 474–486. [DOI] [PMC free article] [PubMed] [Google Scholar]
- [31].Gress TM; Müller-Pillasch F; Lerch MM; Friess H; Büchler M; Adler G, Int J Cancer 1995, 62, 407–413. [DOI] [PubMed] [Google Scholar]
- [32].Jakubison BL; Schweickert PG; Moser SE; Yang Y; Gao H; Scully K; Itkin-Ansari P; Liu Y; Konieczny SF, Molecular Oncology 2018, 12 (7), 1104–1124. DOI 10.1002/1878-0261.12314. [DOI] [PMC free article] [PubMed] [Google Scholar]
- [33].Seeley ES; Carrière C; Goetze T; Longnecker DS; Korc M, Cancer Res 2009, 69 (2), 422–430. DOI 10.1158/0008-5472.CAN-08-1290. [DOI] [PMC free article] [PubMed] [Google Scholar]
- [34].Yang Y; Stang A; Schweickert PG; Lanman NA; Paul EN; Monia BP; Revenko AS; Palumbo JS; Mullins ES; Elzey BD; Janssen EM; Konieczny SF; Flick MJ, Cancer Res 2019, canres.3206.2018. DOI 10.1158/0008-5472.CAN-18-3206. [DOI] [PMC free article] [PubMed] [Google Scholar]
- [35].Khalafalla FG; Khan MW, Cancer growth and metastasis 2017, 10, 1179064417709287. [DOI] [PMC free article] [PubMed] [Google Scholar]
- [36].Otsuru T; Kobayashi S; Wada H; Takahashi T; Gotoh K; Iwagami Y; Yamada D; Noda T; Asaoka T; Serada S; Fujimoto M; Eguchi H; Mori M; Doki Y; Naka T, Cancer science 2019, 110, 985–996. [DOI] [PMC free article] [PubMed] [Google Scholar]
- [37].Wang S; Huang S; Sun YL, BioMed Research International 2017, 2017, 2646148. [DOI] [PMC free article] [PubMed] [Google Scholar]
- [38].Zeisberg M; Neilson EG, J Clin Invest 2009, 119 (6), 1429–1437. DOI 10.1172/JCI36183. [DOI] [PMC free article] [PubMed] [Google Scholar]
- [39].Dagogo-Jack I; Shaw AT, Nat Rev Clin Oncol 2018, 15 (2), 81–94. DOI 10.1038/nrclinonc.2017.166. [DOI] [PubMed] [Google Scholar]
- [40].Ryan DP; Hong TS; Bardeesy N, New England Journal of Medicine 2014, 371 (11), 1039–1049. [DOI] [PubMed] [Google Scholar]
- [41].Chen MB; Whisler JA; Fröse J; Yu C; Shin Y; Kamm RD, Nat Protoc 2017, 12 (5), 865–880. DOI 10.1038/nprot.2017.018. [DOI] [PMC free article] [PubMed] [Google Scholar]
- [42].Kwak B; Ozcelikkale A; Shin CS; Park K; Han B, Journal of Controlled Release 2014, 194, 157–167. DOI 10.1016/j.jconrel.2014.08.027. [DOI] [PMC free article] [PubMed] [Google Scholar]
- [43].Meng F; Meyer CM; Joung D; Vallera DA; McAlpine MC; Panoskaltsis-Mortari A, Advanced Materials 2019, 31 (10), 1806899 DOI 10.1002/adma.201806899. [DOI] [PMC free article] [PubMed] [Google Scholar]
- [44].Ozcelikkale A; Moon H.-r.; Linnes M; Han B, WIREs Nanomed Nanobiotechnol 2017, 9, e1460 DOI 10.1002/wnan.1460. [DOI] [PMC free article] [PubMed] [Google Scholar]
- [45].Ozcelikkale A; Shin K; Noe-Kim V; Elzey BD; Dong Z; Zhang J-T; Kim K; Kwon IC; Park K; Han B, Journal of Controlled Release 2017, 266, 129–139. DOI 10.1016/j.jconrel.2017.09.024. [DOI] [PMC free article] [PubMed] [Google Scholar]
- [46].Shin CS; Kwak B; Han B; Park K, Molecular Pharmaceutics 2013, 10, 2167–2175. [DOI] [PMC free article] [PubMed] [Google Scholar]
- [47].Shin K; Klosterhoff BS; Han B, Molecular Pharmaceutics 2016. DOI 10.1021/acs.molpharmaceut.6b00131. [DOI] [PMC free article] [PubMed] [Google Scholar]
- [48].Seo BR; DelNero P; Fischbach C, Adv Drug Deliv Rev 2014, 0, 205–216. DOI 10.1016/j.addr.2013.11.011. [DOI] [PMC free article] [PubMed] [Google Scholar]
- [49].Shin Y; Han S; Chung E; Chung S, Integr Biol (Camb) 2014, 6 (7), 654–661. DOI 10.1039/c4ib00022f. [DOI] [PubMed] [Google Scholar]
- [50].Baker LA; Tiriac H; Tuveson DA, Methods Mol. Biol. 2019, 1882, 97–115. DOI 10.1007/978-1-4939-8879-2_9. [DOI] [PubMed] [Google Scholar]
- [51].Tuveson D; Clevers H, Science 2019, 364 (6444), 952–955. DOI 10.1126/science.aaw6985. [DOI] [PubMed] [Google Scholar]
- [52].LeBleu VS; Kalluri R, Disease Models & Mechanisms 2018, 11 (4), dmm029447 DOI 10.1242/dmm.029447. [DOI] [PMC free article] [PubMed] [Google Scholar]
- [53].Öhlund D; Elyada E; Tuveson D, The Journal of Experimental Medicine 2014, 211 (8), 1503–1523. DOI 10.1084/jem.20140692. [DOI] [PMC free article] [PubMed] [Google Scholar]
- [54].von Ahrens D; Bhagat TD; Nagrath D; Maitra A; Verma A, Journal of Hematology & Oncology 2017, 10 (1). DOI 10.1186/s13045-017-0448-5. [DOI] [PMC free article] [PubMed] [Google Scholar]
- [55].Preis M; Korc M, Critical Reviews™ in Eukaryotic Gene Expression 2011, 21 (2). [DOI] [PubMed] [Google Scholar]
- [56].Stromnes IM; DelGiorno KE; Greenberg PD; Hingorani SR, Carcinogenesis 2014, 35 (7), 1451–1460. DOI 10.1093/carcin/bgu115. [DOI] [PMC free article] [PubMed] [Google Scholar]
- [57].Cho K; Matsuda Y; Ueda J; Uchida E; Naito Z; Ishiwata T, International Journal of Oncology 2012, 40, 1040–1048. [DOI] [PMC free article] [PubMed] [Google Scholar]
- [58].Theocharis AD; Tsara ME; Papageorgacopoulou N; Karavias DD; Theocharis DA, Biochim Biophys Acta 2000, 1502, 201–206. [DOI] [PubMed] [Google Scholar]
- [59].Obonai T; Fuchigami H; Furuya F; Kozuka N; Yasunaga M; Matsumura Y, Scientific Reports 2016, 6 (1). DOI 10.1038/srep23613. [DOI] [PMC free article] [PubMed] [Google Scholar]
- [60].Razidlo GL; Burton KM; McNiven MA, Journal of Biological Chemistry 2018, 293, 11143–11153. [DOI] [PMC free article] [PubMed] [Google Scholar]
- [61].Stock AM; Hahn SA; Troost G; Niggemann B; Zänker KS; Entschladen F, Exp Cell Res 2014, 326, 307–314. [DOI] [PubMed] [Google Scholar]
- [62].Bischel LL; Young EWK; Mader BR; Beebe DJ, Biomaterials 2013, 34 (5), 1471–1477. DOI 10.1016/j.biomaterials.2012.11.005. [DOI] [PMC free article] [PubMed] [Google Scholar]
Associated Data
This section collects any data citations, data availability statements, or supplementary materials included in this article.


