

Abstract
Objective
HIV cure research urgently needs to identify pre-Analytic Treatment Interruption (ATI) biomarkers of time-to-viral-rebound and viral setpoint to mitigate the risk of ATI and accelerate development of a cure. We previously reported that galactosylated IgG glycans, G2, negatively correlate with cell-associated HIV DNA and RNA during antiretroviral therapy (ART). We hypothesized that this and other plasma glycomic traits can predict time-to-viral-rebound and viral setpoint upon ART cessation.
Design
We profiled the circulating glycomes (plasma and bulk IgG) of two geographically-distinct cohorts: (1) Philadelphia Cohort – 24 HIV-infected, ART-suppressed individuals who had participated in an open-ended ATI study without concurrent immunomodulatory agents. (2) Johannesburg Cohort – 23 HIV-infected, ART-suppressed individuals who had participated in a two-week ATI.
Methods
Capillary electrophoresis and lectin microarray were used for glycomic analyses. Cox proportional-hazards model and log-rank test were used for statistical analyses.
Results
Higher pre-ATI levels of the IgG glycan, G2, were significantly associated with a longer time-to-viral-rebound (hazard ratio (HR)=0.12, P=0.05). In addition to G2, we identified several predictive glycomic traits in plasma, e.g., levels of FA2BG1, a non-sialylated, core-fucosylated glycan, associated with a longer time-to-viral-rebound (HR=0.023, P=0.05), whereas FA2G2S1, a sialylated glycan, associated with a shorter time-to-viral-rebound (HR=24.1, P=0.028). Additionally, pre-ATI plasma glycomic signatures associated with lower viral setpoint, e.g., T-antigen (Galβ1–3GalNAc) (r=0.75, P=0.0007), or higher viral setpoint, e.g., polylactosamine (r=−0.58, P=0.01). These results were initially validated in the Johannesburg Cohort.
Conclusions
We describe first-in-class, non-invasive, plasma and IgG glycomic biomarkers that inform time-to-viral-rebound and viral setpoint in two geographically-distinct cohorts.
Keywords: HIV cure, Viral rebound, Glycomic, Biomarkers, Analytic Treatment Interruption
INTRODUCTION
HIV cure research urgently needs to identify a set of clinically accessible pre-Analytic Treatment Interruption (ATI) biomarkers that can predict time-to-viral-rebound and viral setpoint to 1) improve the safety of ATI, 2) accelerate the development of curative strategies, and 3) provide biological clues into the molecular mechanistic underpinnings of HIV persistence [1]. Some virologic and immunophenotypic measurements have been associated with time-to-viral-rebound: levels of cell-associated HIV DNA [2] and RNA,[3] residual plasma RNA, and pre-antiretroviral therapy (ART) expression levels of CD4+ T cell exhaustion markers [4]. However, the associations between these measurements during ART and time-to-viral-rebound are generally weak.
Recent advances in the re-emerging field of glycomics may allow for the development of a novel perspective on host factors that contribute to HIV control during ART. In the general population, plasma glycomic alterations have been identified as biomarkers for multiple diseases, including cardiovascular disease, inflammatory bowel disease, systemic lupus erythematosus, colorectal cancer, and diabetes [5–11]. Beyond being used as a biomarker, the circulating glycome on plasma and antibodies (immunoglobulins G, IgG) has been shown to mediate and drive important immunological functions. Among these, are functions that play a role in HIV control, e.g., antibody-dependent cell-mediated cytotoxicity (ADCC), antibody-dependent cellular phagocytosis (ADCP), complement-dependent cytotoxicity (CDC), and anti-inflammatory activities [12–17].
We have previously reported a negative association between levels of di-galactosylated, non-fucosylated bulk IgG glycans (G2) and levels of PBMC and CD4+ T cell-associated HIV DNA and RNA during suppressive ART [18]. Galactosylated, non-fucosylated traits had been associated with immunological functions that may assist in viral clearance, in particular, increased ADCC and decreased inflammation [12–17]. Therefore, we hypothesized that G2 and other plasma glycomic traits may predict time-to-viral-rebound and viral setpoint upon ART cessation. To test this hypothesis, we profiled the plasma and bulk IgG glycomes from two geographically-distinct cohorts of HIV-infected, ART-suppressed individuals who participated in ATI studies. We identified plasma and bulk IgG glycomic signatures, measured pre-ATI, that inform post-ATI time-to-viral-rebound and viral setpoints, and can serve, in the future, as novel, non-invasive predictive biomarkers.
METHODS
Study cohorts
We profiled the circulating glycomic signatures (plasma and bulk IgG) from banked plasma samples from two geographically-distinct cohorts: (1) Philadelphia Cohort [19] - in this trial, individuals on suppressive ART were randomized to either 40 weeks of continuous ART with a final, open-ended ATI, or a repeated ATIs followed by an open-ended ATI. Because there was no difference between the two groups in time-to-viral-rebound or viral setpoint during the open-ended ATI [19], we used the full cohort for our glycomic analysis. This cohort had a wide distribution of viral rebound times (14 to 119 days; median=28) and viral setpoints (median=13,675 copies/ml) (Supplementary Figure 1). (2) Johannesburg Cohort, serving as a validation cohort [20] – it consisted of 23 HIV-infected, ART-suppressed individuals who had participated in a two-week ATI; of the 23 participants, four did not rebound within the interruption time (Supplementary Figure 2). Supplementary Tables 1 and 2 describe the demographic and clinical characteristics of each cohort, respectively. Glycomic analysis was performed on samples collected immediately before ATI in both cohorts.
IgG isolation
Bulk IgG was purified from plasma using Pierce™ Protein G Spin Plate (Thermo Fisher).
N-glycan analysis using capillary electrophoresis
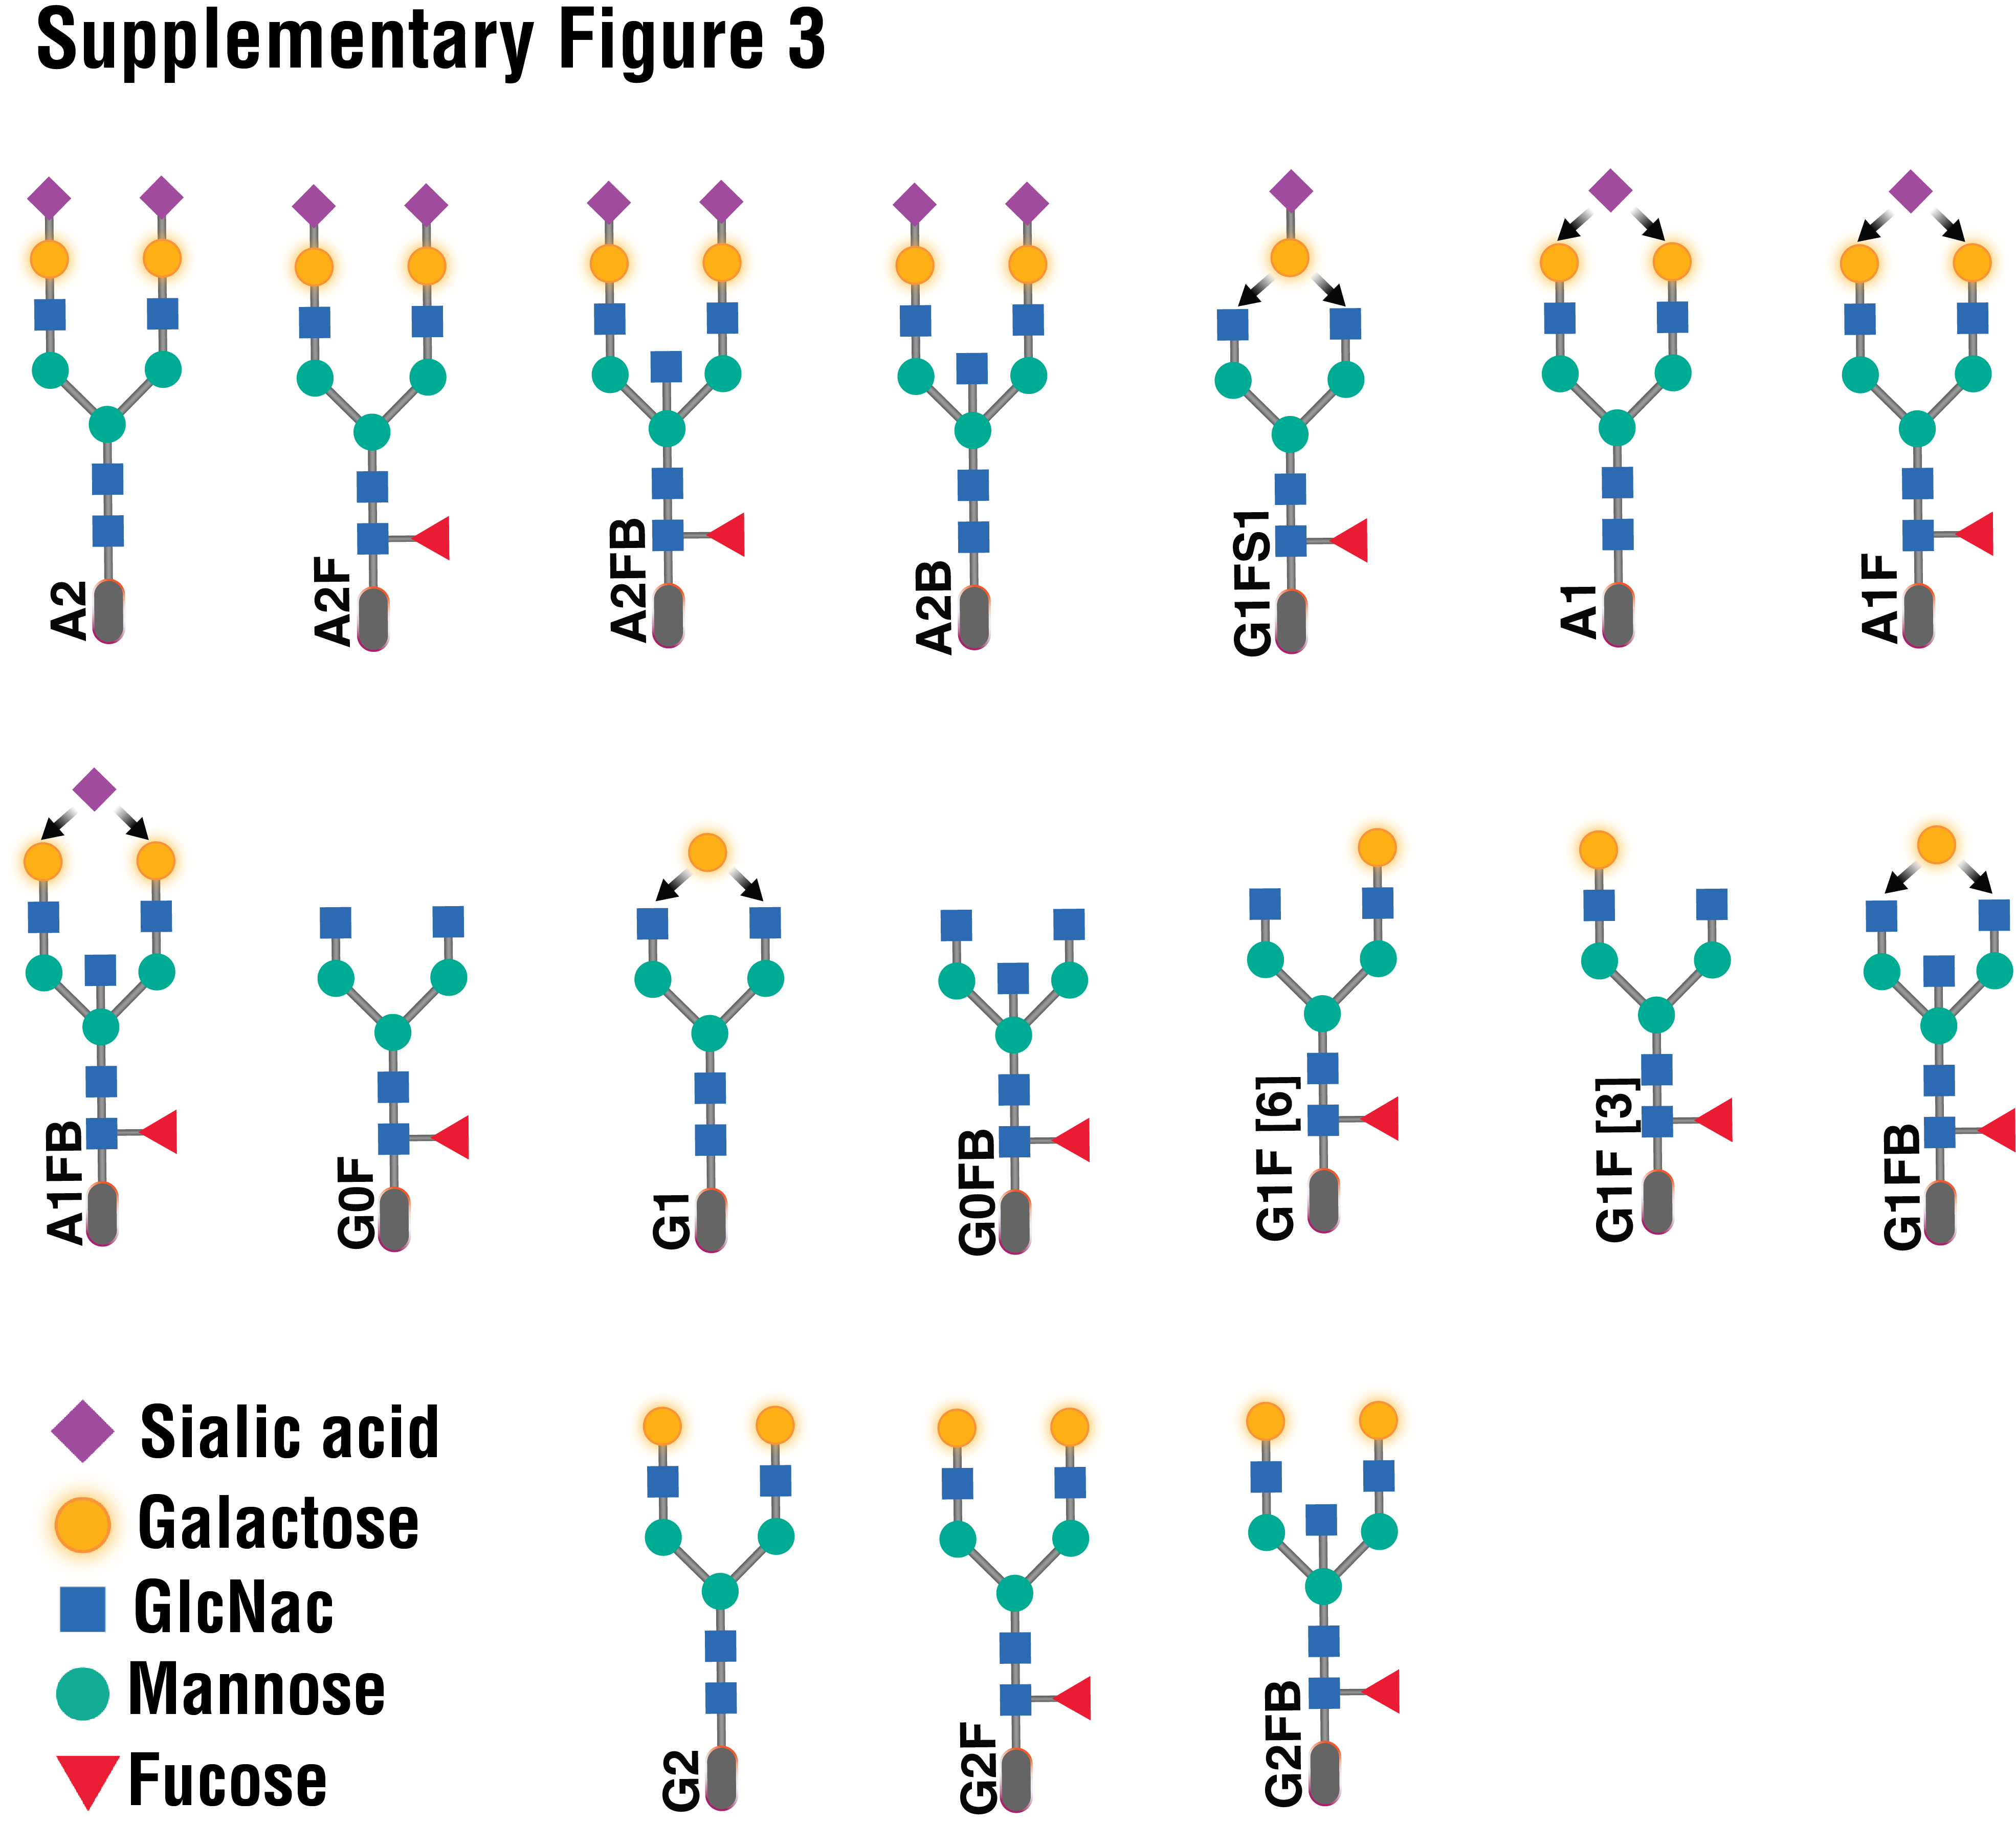
For both plasma and bulk IgG, N-glycans were released using peptide-N-glycosidase F (PNGase F) and labeled with 8-aminopyrene-1,3,6-trisulfonic acid (APTS) using the GlycanAssure APTS Kit (Thermo Fisher), following the manufacturer’s protocol. Labeled N-glycans were analyzed using the 3500 Genetic Analyzer capillary electrophoresis system. IgG N-glycan samples were separated into 17 peaks and total plasma N-glycans into 25 peaks (structures and names are in Supplementary Figures 3 and 4, respectively). Relative abundance of N-glycan structures was quantified by calculating the area under the curve of each glycan structure divided by the total glycans using the Applied Biosystems GlycanAssure Data Analysis Software Version 2.0.
Glycan analysis using lectin array
IgGs mostly contain N-linked glycans (IgG3 has O-linked glycans) [21], so capillary electrophoresis is mostly sufficient to profile the IgG glycomes. To profile plasma total glycome, we also used the lectin microarray as it enables analysis of multiple glycan structures; it employs a panel of 45 immobilized lectins with known glycan-binding specificity (the specific lectins immobilized in the chip and their glycan-binding specificity are in Supplementary Table 3). Plasma proteins were labeled with Cy3 and hybridized to the lectin microarray [22]. The resulting chips were scanned for fluorescence intensity on each lectin-coated spot using an evanescent-field fluorescence scanner GlycoStation Reader (GlycoTechnica Ltd.), and data were normalized using the global normalization method.
Statistical analysis
Cox proportional-hazards model and log-rank test for time-to-viral-rebound data, two-group t-test or Mann–Whitney test for two-group comparisons, Pearson correlation coefficient (for normally-distributed data sets) or Spearman’s rank correlation coefficient (for non-normally-distributed data sets) for bivariate correlation analysis, and Wilcoxon signed-rank test for matched-pairs comparison were used for statistical analyses. The Shapiro-Wilk test was used for normality. Statistical analyses were performed in R and Prism 7.0 (GraphPad).
RESULTS
Pre-ATI plasma and bulk IgG glycans associate with post-ATI time-to-viral-rebound in the Philadelphia Cohort
Using the Cox proportional-hazards model, we found that higher pre-ATI levels of the IgG glycan, G2, were significantly associated with a longer time-to-viral-rebound (hazard ratio (HR)=0.12, P=0.05) (Fig 1A). We also observed that G2 glycan levels were affected by viral rebound, being significantly lower at viral rebound (P=0.02) and viral setpoint (P=0.009) than at pre-ATI levels (Supplementary Figure 5). In addition to G2, we identified several predictive glycomic traits in plasma (Fig 1A), e.g., levels of FA2BG1, a non-sialylated, core-fucosylated glycomic trait, associated with a longer time-to-viral-rebound (HR=0.023, P=0.05), whereas FA2G2S1, a sialylated glycomic trait, associated with a shorter time-to-viral-rebound (HR=24.1, P=0.028). We also tested these 19 glycomic biomarkers using the Mantel-Cox survival test and the levels of two glycan traits [FA2G0 and EEL-binding glycans] significantly informed time-to-viral-rebound (Figure 1B). Several other glycans structures trended toward significance, including [FA2G1, G2F, FA2BG0, and A2G2S1] (Supplementary Figure 6).
Figure 1. Plasma and IgG glycomic biomarkers of time-to-viral-rebound and viral setpoint in the Philadelphia Cohort.

(A) Cox proportional-hazards model of glycomic biomarkers identified using samples from the Philadelphia Cohort. F=Fucose, G=Galactose, S=Sialic acid, B=Bisected GlcNac. Plasma* = data generated using lectin microarray; remaining data generated using capillary electrophoresis. (B) Mantel-Cox model illustrating two glycan structures from A. (C) Pre-ATI plasma glycomic signatures associated with a higher or a lower viral setpoints post-ATI in the Philadelphia Cohort. Pearson correlation coefficient.
Pre-ATI plasma glycomic signatures associate with post-ATI viral setpoint
Among the pre-ATI plasma glycomic signatures that informed a lower post-ATI viral setpoint was T-antigen (Galβ1–3GalNAc) (r=0.75, P=0.0007; Figure 1C; Full list of pre-ATI glycan structures associated with post-ATI viral setpoints is in Supplementary Table 4). Only one pre-ATI glycomic signature informed a higher post-ATI viral setpoint, polylactosamine (r=−0.58, P=0.017; Figure 1C).
Plasma and IgG viral rebound biomarkers are validated in an independent and geographically-distinct Cohort
To conduct an initial validation of our observations from the Philadelphia Cohort, we examined the plasma and bulk IgG glycomic profiles in the Johannesburg Cohort, in which four out of 23 individuals did not experience viral rebound within a two-week ATI. We found that pre-ATI levels of eight of the glycan signatures that associated with longer time-to-viral-rebound in the Philadelphia Cohort (from Figure 1A) were also higher in the Johannesburg Cohort non-rebound group than in the rebound group (P<0.05; Figure 2). Pre-ATI level of one glycan signature (EEL-binding glycans) that predicted shorter time-to-viral-rebound (from Figure 1A) also trended lower in the non-rebound group compared to the rebound group (Figure 2).
Figure 2. Initial validation of the glycomic signature in the Johannesburg Cohort.

Mann–Whitney test (for non-normally-distributed data sets) or unpaired t-test (for normally-distributed data sets). VL = viral load. Mean ± SEM.
DISCUSSION
We identified several novel and non-invasive pre-ATI plasma and bulk IgG glycomic biomarkers that inform time-to-viral-rebound and viral setpoint upon ART cessation. Out of the 19 glycan structures identified in the Philadelphia cohort, nine were initially validated in a geographically-distinct cohort, suggesting that these nine glycans (shown in Figure 2; including FA2G0, FA2BG0, G2, fucosylated glycans [AOL, LCA, and PSA-binding glycans], and EEL-binding glycans) are likely the most promising biomarkers. Currently, the only way to evaluate the efficacy of potential HIV curative strategies in clinical trials is by ATI. However, ATIs involve risks to the participants and can lead to viral transmission. Non-invasive, easy-to-measure, pre-ATI biomarkers, such as we have identified here, have the potential to inform outcomes of ATI during HIV curative clinical trials and mitigate some of the risk associated with ATI in those where biomarkers indicate a low likelihood of delayed viral rebound. Plasma and bulk IgG glycomic signatures are easily accessible for clinical monitoring using capillary electrophoresis and lectin-based assays. Specifically, lectin measures can be adapted to a simple ELISA format for fast, high-throughput screening of targeted glycomic signature. This screening could provide information on potential outcomes for participants in HIV curative clinical trials and could also allow targeted recruitment of participants that may be best suited to test HIV curative agents in trials including an ATI.
Plasma glycoproteins enter the circulation from organs through active secretion or leakage, and several studies have shown that glycosylation of such circulating glycoproteins can reflect the inflammatory states of these organs during chronic diseases [23]. Further investigation needs to examine whether the link between plasma glycomic signatures described here and time-to-viral-rebound is a reflection of systemic and/or organ-specific inflammatory status [12]. Independently of inflammation, several studies indicated that circulating glycomes (including on antibodies) can mechanistically regulate immune effector mechanisms. For example, non-fucosylated glycan traits (as G2, which associated with longer time-to-viral-rebound in our study) can mediate higher ADCC [13]. Galactose also has been shown to associate with higher ADCC [14], CDC [15], and ADCP [16]. However, the role of galactosylation in ADCC activity is controversial [24]. This controversy might be related to the location of the galactose on the glycan structure [16]. During HIV infection, lack of galactosylation was linked to enhanced natural killer cell activity in spontaneous controllers of HIV who control viral replication in the absence of ART [25]. During ART-suppression, we recently showed that levels of galactosylated glycans negatively associate with levels of CD4+ T cell-associated HIV DNA and RNA. Whether ART plays a role in this controversy warrants further investigation. Together, our glycomic signature warrants further examination of its potential steady-state impact on cellular anti-viral mechanisms during ART-suppressed HIV infection.
Neither of our cohorts received any immunomodulating agents that could confound our results. Although our pre-ATI glycomic signatures were initially validated in an independent geographically-distinct cohort, to inform outcomes of an ATI, our data do have limitations. Our study did not explicitly address the confounding effects of age, gender, duration-of-infection, duration-on-ART, ART-regimen, or comorbidities on glycomic signatures. Most of the Philadelphia cohort participants were males who received various ART-regimens, whereas most of the Johannesburg cohort participants were females who received the same ART-regimen, suggesting that the nine glycan structures in Figure 2 may not be gender- or ART-specific. However, we cannot explicitly exclude the potential impact of these two confounders on our results. Lastly, given the exploratory nature of our study, multiple comparisons correction was not used. Addressing the impact of confounders and further validating our signatures into predictive models using larger cohorts should be the subject of future studies. In conclusion, our proof-of-concept study provides first-in-class, non-invasive candidate plasma biomarkers, for clinical monitoring on ART, that may serve as predictors of time-to-viral-rebound and viral setpoint after treatment interruption to mitigate ATI risks and accelerate the progress toward a cure.
Supplementary Material
Supplementary Figure 1. (A) Times to viral-rebound and (B) viral-setpoints in the Philadelphia cohort. This cohort had a wide distribution of viral-rebound times (14 to 119 days; median=28) and viral-setpoints (median=13,675 copies/ml).
Supplementary Figure 2. Viral loads in the Johannesburg validation cohort.
Supplementary Figure 3. The structures and names of the N-glycans identified in IgG.
Supplementary Figure 4. The structures and names of the N-glycans identified in plasma.
Supplementary Figure 5. G2 glycan levels were significantly lower at viral-rebound and viral set-point compared to their pre-ATI levels. Wilcoxon matched-pairs signed-rank test. Mean ± SEM.
Supplementary Figure 6. (A) Mantel-Cox model of glycomic biomarkers identified in Figure 1A. (B-F) illustration of the glycan structures trended to significance from A. Plasma* = data generated using lectin microarray; remaining data generated using capillary electrophoresis.
Supplementary Table 1. Clinical and demographic data of the Philadelphia Cohort.
Supplementary Table 2. Clinical and demographic data of the Johannesburg Cohort.
Supplementary Table 3. Lectins used in the lectin microarray and their binding specificity.
Supplementary Table 4. List of pre-ATI plasma glycomic signatures predicted post-ATI viral setpoints
ACKNOWLEDGMENTS
We would like to thank Rachel E. Locke, Ph.D., for providing comments and editing.
FUNDING
MA-M is supported by the Foundation for AIDS Research (amfAR) Impact Grant # 109840-65-RGRL, and NIH grants (R21 AI143385, R21 AI129636, R21 NS106970, and R01 AG062383). LJM is supported by R01 AI48398 and U01 AI51986. Additional support was provided by the NIH-funded BEAT-HIV Martin Delaney Collaboratory to cure HIV-1 infection (1UM1Al126620), Kean Family Professorship, and the Philadelphia Foundation (Roberts I. Jacobs Fund).
Footnotes
COMPETING INTERESTS STATEMENT
Authors have no competing interests.
REFERENCES
- 1.Strategies for Management of Antiretroviral Therapy Study G, El-Sadr WM, Lundgren J, Neaton JD, Gordin F, Abrams D, et al. CD4+ count-guided interruption of antiretroviral treatment. The New England journal of medicine 2006; 355(22):2283–2296. [DOI] [PubMed] [Google Scholar]
- 2.Williams JP, Hurst J, Stohr W, Robinson N, Brown H, Fisher M, et al. HIV-1 DNA predicts disease progression and post-treatment virological control. Elife 2014; 3:e03821. [DOI] [PMC free article] [PubMed] [Google Scholar]
- 3.Li JZ, Etemad B, Ahmed H, Aga E, Bosch RJ, Mellors JW, et al. The size of the expressed HIV reservoir predicts timing of viral rebound after treatment interruption. Aids 2016; 30(3):343–353. [DOI] [PMC free article] [PubMed] [Google Scholar]
- 4.Hurst J, Hoffmann M, Pace M, Williams JP, Thornhill J, Hamlyn E, et al. Immunological biomarkers predict HIV-1 viral rebound after treatment interruption. Nature communications 2015; 6:8495. [DOI] [PMC free article] [PubMed] [Google Scholar]
- 5.Hu M, Lan Y, Lu A, Ma X, Zhang L. Glycan-based biomarkers for diagnosis of cancers and other diseases: Past, present, and future. Prog Mol Biol Transl Sci 2019; 162:1–24. [DOI] [PubMed] [Google Scholar]
- 6.Trbojević Akmačić I, Ventham NT, Theodoratou E, Vučković F, Kennedy NA, Krištić J, et al. Inflammatory bowel disease associates with proinflammatory potential of the immunoglobulin g glycome. Inflamm Bowel Dis 2015; 21(6):1237–1247. [DOI] [PMC free article] [PubMed] [Google Scholar]
- 7.Vučković F, Krištić J, Gudelj I, Artacho MT, Keser T, Pezer M, et al. Systemic lupus erythematosus associates with the decreased immunosuppressive potential of the IgG glycome. Arthritis & Rheumatology 2015; 67(11):2978–2989. [DOI] [PMC free article] [PubMed] [Google Scholar]
- 8.Vuckovic F, Theodoratou E, Thaci K, Timofeeva M, Vojta A, Stambuk J, et al. IgG Glycome in Colorectal Cancer. Clinical cancer research : an official journal of the American Association for Cancer Research 2016; 22(12):3078–3086. [DOI] [PMC free article] [PubMed] [Google Scholar]
- 9.Lemmers RFH, Vilaj M, Urda D, Agakov F, Simurina M, Klaric L, et al. IgG glycan patterns are associated with type 2 diabetes in independent European populations. Biochimica et biophysica acta 2017; 1861(9):2240–2249. [DOI] [PubMed] [Google Scholar]
- 10.Willerson JT, Ridker PM. Inflammation as a cardiovascular risk factor. Circulation 2004; 109(21 Suppl 1):II2–10. [DOI] [PubMed] [Google Scholar]
- 11.Akinkuolie AO, Buring JE, Ridker PM, Mora S. A novel protein glycan biomarker and future cardiovascular disease events. Journal of the American Heart Association 2014; 3(5):e001221. [DOI] [PMC free article] [PubMed] [Google Scholar]
- 12.Karsten CM, Pandey MK, Figge J, Kilchenstein R, Taylor PR, Rosas M, et al. Anti-inflammatory activity of IgG1 mediated by Fc galactosylation and association of FcgammaRIIB and dectin-1. Nature medicine 2012; 18(9):1401–1406. [DOI] [PMC free article] [PubMed] [Google Scholar]
- 13.Masuda K, Kubota T, Kaneko E, Iida S, Wakitani M, Kobayashi-Natsume Y, et al. Enhanced binding affinity for FcgammaRIIIa of fucose-negative antibody is sufficient to induce maximal antibody-dependent cellular cytotoxicity. Molecular immunology 2007; 44(12):3122–3131. [DOI] [PubMed] [Google Scholar]
- 14.Thomann M, Reckermann K, Reusch D, Prasser J, Tejada ML. Fc-galactosylation modulates antibody-dependent cellular cytotoxicity of therapeutic antibodies. Molecular immunology 2016; 73:69–75. [DOI] [PubMed] [Google Scholar]
- 15.Heyl KA, Karsten CM, Slevogt H. Galectin-3 binds highly galactosylated IgG1 and is crucial for the IgG1 complex mediated inhibition of C5aReceptor induced immune responses. Biochemical and biophysical research communications 2016; 479(1):86–90. [DOI] [PubMed] [Google Scholar]
- 16.Chung AW, Crispin M, Pritchard L, Robinson H, Gorny MK, Yu X, et al. Identification of antibody glycosylation structures that predict monoclonal antibody Fc-effector function. Aids 2014; 28(17):2523–2530. [DOI] [PMC free article] [PubMed] [Google Scholar]
- 17.Lu LL, Suscovich TJ, Fortune SM, Alter G. Beyond binding: antibody effector functions in infectious diseases. Nature reviews Immunology 2018; 18(1):46–61. [DOI] [PMC free article] [PubMed] [Google Scholar]
- 18.Vadrevu SK, Trbojevic-Akmacic I, Kossenkov AV, Colomb F, Giron LB, Anzurez A, et al. Frontline Science: Plasma and immunoglobulin G galactosylation associate with HIV persistence during antiretroviral therapy. Journal of leukocyte biology 2018. [DOI] [PMC free article] [PubMed] [Google Scholar]
- 19.Papasavvas E, Kostman JR, Mounzer K, Grant RM, Gross R, Gallo C, et al. Randomized, controlled trial of therapy interruption in chronic HIV-1 infection. PLoS medicine 2004; 1(3):e64. [DOI] [PMC free article] [PubMed] [Google Scholar]
- 20.Firnhaber C, Azzoni L, Foulkes AS, Gross R, Yin X, Van Amsterdam D, et al. Randomized trial of time-limited interruptions of protease inhibitor-based antiretroviral therapy (ART) vs. continuous therapy for HIV-1 infection. PloS one 2011; 6(6):e21450. [DOI] [PMC free article] [PubMed] [Google Scholar]
- 21.Plomp R, Dekkers G, Rombouts Y, Visser R, Koeleman CA, Kammeijer GS, et al. Hinge-Region O-Glycosylation of Human Immunoglobulin G3 (IgG3). Molecular & cellular proteomics : MCP 2015; 14(5):1373–1384. [DOI] [PMC free article] [PubMed] [Google Scholar]
- 22.Krishnamoorthy L, Mahal LK. Glycomic analysis: an array of technologies. ACS chemical biology 2009; 4(9):715–732. [DOI] [PMC free article] [PubMed] [Google Scholar]
- 23.Lauc G, Pezer M, Rudan I, Campbell H. Mechanisms of disease: The human N-glycome. Biochimica et biophysica acta 2016; 1860(8):1574–1582. [DOI] [PubMed] [Google Scholar]
- 24.Shinkawa T, Nakamura K, Yamane N, Shoji-Hosaka E, Kanda Y, Sakurada M, et al. The absence of fucose but not the presence of galactose or bisecting N-acetylglucosamine of human IgG1 complex-type oligosaccharides shows the critical role of enhancing antibody-dependent cellular cytotoxicity. The Journal of biological chemistry 2003; 278(5):3466–3473. [DOI] [PubMed] [Google Scholar]
- 25.Ackerman ME, Crispin M, Yu X, Baruah K, Boesch AW, Harvey DJ, et al. Natural variation in Fc glycosylation of HIV-specific antibodies impacts antiviral activity. J Clin Invest 2013; 123(5):2183–2192. [DOI] [PMC free article] [PubMed] [Google Scholar]
Associated Data
This section collects any data citations, data availability statements, or supplementary materials included in this article.
Supplementary Materials
Supplementary Figure 1. (A) Times to viral-rebound and (B) viral-setpoints in the Philadelphia cohort. This cohort had a wide distribution of viral-rebound times (14 to 119 days; median=28) and viral-setpoints (median=13,675 copies/ml).
Supplementary Figure 2. Viral loads in the Johannesburg validation cohort.
Supplementary Figure 3. The structures and names of the N-glycans identified in IgG.
Supplementary Figure 4. The structures and names of the N-glycans identified in plasma.
Supplementary Figure 5. G2 glycan levels were significantly lower at viral-rebound and viral set-point compared to their pre-ATI levels. Wilcoxon matched-pairs signed-rank test. Mean ± SEM.
Supplementary Figure 6. (A) Mantel-Cox model of glycomic biomarkers identified in Figure 1A. (B-F) illustration of the glycan structures trended to significance from A. Plasma* = data generated using lectin microarray; remaining data generated using capillary electrophoresis.
Supplementary Table 1. Clinical and demographic data of the Philadelphia Cohort.
Supplementary Table 2. Clinical and demographic data of the Johannesburg Cohort.
Supplementary Table 3. Lectins used in the lectin microarray and their binding specificity.
Supplementary Table 4. List of pre-ATI plasma glycomic signatures predicted post-ATI viral setpoints