

Abstract

Uncovering the mechanisms of virus infection and assembly is crucial for preventing the spread of viruses and treating viral disease. The technique of single-virus tracking (SVT), also known as single-virus tracing, allows one to follow individual viruses at different parts of their life cycle and thereby provides dynamic insights into fundamental processes of viruses occurring in live cells. SVT is typically based on fluorescence imaging and reveals insights into previously unreported infection mechanisms. In this review article, we provide the readers a broad overview of the SVT technique. We first summarize recent advances in SVT, from the choice of fluorescent labels and labeling strategies to imaging implementation and analytical methodologies. We then describe representative applications in detail to elucidate how SVT serves as a valuable tool in virological research. Finally, we present our perspectives regarding the future possibilities and challenges of SVT.
1. Introduction
Viruses are intracellular parasites that rely on host cells for completion of their life cycles. Most viruses are composed mainly of nucleic acids (RNA or DNA), structural proteins (e.g., capsid), and a lipid membrane (for enveloped viruses). The primary function of any virus is to reproduce in host cells. For this purpose, viruses should accomplish two major tasks: (i) to break through the barriers that block virus entry and transport into cell cytosol and (ii) to release their genome at the preferred sites within the cells for viral transcription and replication.1−4 The newly synthesized viral proteins and genomes are assembled in the infected cells to generate progeny viruses, which are then released to the extracellular space by exocytosis or by lysing the host cells. Additionally, viruses may take different pathways to infect host cells, and the complicated infection processes usually include multiple steps and intricate interactions between viral components and cellular structures.5−7 Thus, it is important to understand the complicated infection mechanisms of viruses in time and space for fighting against virus infection and preventing viral diseases.
Early researchers mainly utilized transmission electron microscopy (TEM) and biochemical experiments to investigate viral infection mechanisms in cells. TEM has played an essential role in studying the infection pathway of viruses, but it can only acquire static images from the scenario of virus infection in live cells. In vitro biochemical experiments commonly use the samples isolated from organisms to conduct ensemble measurements and deduce the effects. Conventional methods lack the ability to acquire dynamic information on individual viruses during the infection process, since the cellular events occur in a stochastic manner across spatial and temporal scales. The biggest challenge is how to realize the visualization of infection processes directly and dynamically in live cells and thereby uncover the mechanisms of infection and proliferation.
Fluorescence microscopy has had a great impact on cell biology ranging from the molecular to the organism scale. Initially, fluorescence was mainly used to visualize the intracellular distribution of proteins in fixed cells via antibodies.8,9 With improvements in microscopy, it has become possible to measure individual biomolecules as they perform their function in their native environment using single-particle tracking (SPT).10−17 SPT has successfully solved many basic biological questions and greatly enhances our repertoire of research approaches for investigating, for example, membrane organization,18−20 protein folding,21−23 molecular motor dynamics,24−26 and cell signal transduction.27−29 Thereinto, single-virus tracking (SVT) allows researchers to follow individual viruses, visualize their transport behaviors, dissect their dynamic interactions with the host cells, and reveal the underlying mechanisms of viral processes.30−33 In SVT studies, viruses are addressed independently, avoiding ensemble averaging and making it possible to investigate the dynamic behaviors of single viruses in their native, complex surroundings. Thus, time-dependent unsynchronized infection events can be monitored in real time. Hence, the SVT technique is a powerful approach for studying the real-time and in situ dynamics of viral processes in live cells, and it is attracting the attention of researchers. Until now, this method has revealed a variety of complicated infection mechanisms of various viruses including the mechanisms of viral entry, trafficking, and egress. SVT has also been used to follow the uptake and cellular distribution of artificial viruses and drug delivery carriers due to their similar nature.
In this review, we will first describe the historical retrospect of the SVT technique, and then discuss the fluorescent labels used for SVT, discuss the advantages and limitations of each kind of fluorescent labels, and describe how to use the fluorophores for virus labeling. Subsequently, we will elaborate on the various approaches for SVT, the imaging instruments, and data analysis methods for accurately extracting the dynamic information on virus infection from live-cell measurements. We then highlight a couple applications of SVT and finally propose the future possibilities and challenges of the SVT technique.
2. Historical Retrospect of Single-Virus Tracking
Single-virus tracking is a new and growing technique. It originates from single-particle techniques, which have each become a remarkable tool in biological fields. These techniques add new insights beyond conventional ensemble methods by providing dynamic information regarding the biological processes. There are a number of methods used to monitor the mobility of particles including fluorescence recovery after photobleaching (FRAP), fluorescence correlation spectroscopy (FCS), and single-particle tracking (SPT). FRAP was established in the 1970s to measure the mobility of molecules via the recovery speed of fluorescence intensity after photobleaching a given region.34,35 In the same decade, FCS was developed to detect and analyze the fluctuations of fluorescence intensity caused by fluorescent molecules entering and leaving the observation volume.36 The dynamic parameters, such as diffusion coefficient and average residence time, could be extracted from the autocorrelation analysis.37,38 Strictly speaking, FRAP and FCS measure the average behaviors of hundreds or even thousands of molecules, and the geometry of the photobleached volume or the point-spread-function (PSF) of the FCS excitation beam, respectively, needs to be known in detail. These techniques only provide limited dynamic information and do not truly reflect the kinetics of biological processes in time and space on the single particle level. SPT, however, is capable of monitoring the movements of individual molecules directly by optical microscopy, and it can detect subpopulations and event detection changes in diffusional behavior of a single particle. Hence, the technique is appealing for investigating dynamic events in live cells.
SPT dates back hundreds if not thousands of years. Galileo Galilei tracked the moons of Jupiter and contributed data that resulted in overturning the view of the universe at that time. SPT on the microscale began in the early 1970s, when Howard Berg built a microscope for tracking single bacteria.39,40 The first subcellular tracking experiments were performed at the beginning of the 1980s, when Barak et al. tracked individual low-density lipoprotein (LDL)-receptor complexes in live cells.41 These measurements opened up a new avenue for studying the dynamic mechanisms of individual biomolecules (Figure 1). Notably, advances in imaging instruments and algorithms greatly improved the imaging speed and accuracy of the SPT technique, which enabled the investigation of more complex processes with a better spatial-temporal resolution.42−48 Since then, the applications of SPT had a dramatic increase in the biological field. A major breakthrough in three-dimensional (3D) SPT occurred in 1994. Using a modified epifluorescence microscope where a weak cylindrical lens had been placed in the detection path, Kao et al. successfully tracked individual fluorescent particles and determined z positions from the image shape and orientation with a peak detection algorithm.49 Inspired by this research, many researchers made efforts to develop imaging methods and analyzing algorithms for 3D SPT.50−57 In recent years, a number of 3D SPT methods have become available to track the dynamic behaviors of biomolecules in the 3D environment. For recent reviews, we refer the reader to refs58−61.
Figure 1.

Timeline of the key developments of the single-virus tracking technique.
Viruses, due to their small size and the dramatic impact they have on human health, are an important and popular system for SPT experiments. Hence, SPT performed on viruses has come to be known as single-virus tracking (SVT). Already in the 1990s, SVT techniques began to show their talent at probing the dynamic mechanisms of virus infection. Originally, organic dyes were used to label viruses by antigen–antibody interactions in fixed cells.62,63 With the emergence and application of fluorescence video microscopy, organic dyes could be used to labeled viruses and the budding and fusion events of enveloped viruses monitored in live cells.64−66 From the early 2000s, the SVT technique started to play a more and more important role in studying infection mechanisms of viruses.67−75 One milestone in SVT was the experiments performed by the group of Bräuchle where they could follow the entry of adeno associated viruses labeled with a single organic fluorophore.69 In live-cell measurements, care has to be taken when labeling viruses to ensure that the labeling does not interfere with the function of the virus and a single fluorophore is the ultimate limit for fluorescent labeling. The laboratory of Zhuang also contributed significantly to SVT with beautiful investigations that visualized the infectious behaviors of viruses and systematically dissected the dynamic mechanisms of virus entry, virus transport, and genome release.72−74
Almost contemporaneously, fluorescent proteins (FPs) came to the fore as fluorescent labels in the biological field. The key feature of FPs is that they allow specific cellular or viral proteins to be labeled by genetic engineering. Once a fortuitous location had been determined for virus labeling, it no longer became necessary to check after each sample preparation whether the labeling had affected the infectivity of the virus. For these reasons, the use of FPs emerged in virology and contributed immensely to the study of virus–cell interactions. In 1995, the green fluorescent protein (GFP)76 was first introduced into the expression cassette of the potato virus X.77 Subsequently, different kinds of viral components, including envelope protein, tegument, and capsid, were genetically labeled with FPs, and many subsequent attempts were made to monitor individual FPs-labeled viruses in host cells using SVT.78−81 Especially the visualization of the transport behaviors of FPs-labeled viruses helped to accelerate our understanding of virus entry, fusion, and cell-to-cell transmission of human immunodeficiency virus (HIV).82−86 Moreover, the advances made in SPT were quickly applied to SVT, and real-time 3D tracking of FP-labeled viruses provided more accurate information regarding viral processes in live cells.87,88
As an alternative to organic dyes and FPs, quantum dots (QDs) have also become an important tool for SPT and SVT and are heavily utilized in the fields of biology, virology, and medicine. The excellent brightness and superior photostability of QDs enable them to be tracked for extended periods of time with low laser intensity, making them particularly favorable for acquiring time-series images or z-stacks for 3D reconstructions. In the early 2000s, QDs were first utilized to track glycine receptors on the plasma membrane.89 This stimulated the application of QDs in the SPT field and triggered the further development of imaging algorithms. In particular, special imaging algorithms were developed that overcome the drawbacks of QDs in SPT experiments, such as QDs blinking.90−92 After that, QDs-based SPT made great advances in the investigation of dynamic processes occurring on the plasma membrane and in intracellular/intercellular environments.93−97 In 2008, Joo et al. proposed a site-specific strategy to label the surface of lentiviruses with QDs, which pointed out a new way forward for QDs applications in virology.98 Diverse strategies emerged to label different viral components with QDs,99−106 and QD-labeled viruses were implemented for the long-term tracking of individual viruses during virus infection.107−110 Additionally, by combining QD-labeling strategies with 3D SVT, viral behavior could be followed over long time scales in three dimensions and new insights gained regarding virus infection.111,112 These results again ignited the enthusiasm of researchers to study the infection mechanisms of viruses by SVT.113−118 There is no denying that SVT has greatly improved our understanding of the infection mechanisms of viruses.
3. Fluorescent Labels for Single-Virus Tracking
The first step necessary for performing SVT experiments is to label viral components with fluorescent labels. Viruses are typically densely packed structures, and there can be limitations on the size and location of the tags that can be used as to not inhibit the functionality or even assembly of the virus. Hence, particular care needs to be taken in choosing the correct labeling approach and location on the virus, and proper controls need to be performed to verify that the functionality and infectivity of the virus is not hampered. Also, the assembly of viruses occurs directly in the living host cells such that in cellular labeling approaches are needed to visualize the early stages of assembly. These limitations make the labeling of viruses particularly challenging in comparison to the labeling of other objects such as nanoparticles used for therapeutic applications. In addition, one wishes to acquire image sequences with high spatiotemporal resolution and high signal-to-background ratio, which depends on the number and type of fluorescent labels and the imaging instrument. There is an intricate relationship among the optical characteristics of fluorescent labels, the duration of imaging and the spatial resolution and the accessible temporal sampling of imaging instruments. The brighter the labels are, the faster the time resolution can be and the higher the spatial resolution that can be achieved. Moreover, the more photostable the label is, the longer the virus can be tracked. A fluorescent label is evaluated by the relevant spectroscopic features. High brightness is one of the important properties for any fluorescent label, which means that a good fluorescent label should possess a strong ability to capture photons, such as a large molar absorption coefficient and a high fluorescence quantum yield. Meanwhile, the high photostability is the essential property belonging to the good fluorescent labels, which can endure many excitation–deexcitation cycles prior to photobleaching. This is the principal criterion for fluorescent labels used in the SVT field. It should be noted, however, that in some cases, viruses have a large number of components that can be labeled without deleterious effects. For example, the Gag protein of HIV can be labeled with FPs in a ratio of 1:1 without significantly altering its structure and infectivity.119 As HIV contains approximately 2400 Gag proteins, ∼1000 FPs are coupled to a single viral particle and the lower photophysical properties of the FP are compensated for by the sheer number of fluorophores.120
There are several types of fluorophores that have emerged for labeling viral structures in the SVT field, including organic dyes, FPs, and nanoparticles (Figure 2). Each type of fluorophore has its advantages and drawbacks that the researchers need to balance according to the requirements of SVT experiments.121 The focus of this section is to describe the recent developments and features of existing fluorescent labels and to highlight the prospective applications for future research in the SVT field.
Figure 2.

Comparison of the size scales of fluorescent labels and the spatial resolutions of biological imaging techniques.
3.1. Organic Dyes
As small fluorescent labels (<1 kDa), organic dyes have proven indispensable for fluorescence labeling of biological systems.122 The fluorescence properties of organic dyes are governed by both fluorophore structure and chemical environment and can be fine-tuned by elaborate design strategies. Beyond their small size, the major advantages of most organic dyes are their good photophysical properties, commercial availability, the availability of a multitude of reactive groups for various labeling strategies, and the wide spectral range of options.123 Compared with FPs, organic dyes have several excellent properties, such as higher brightness, smaller size, better photostability, and a wider color palette,10,122,124 which have been broadly used for single-virus imaging.31,125−127 According to their inherent nature and characteristics, organic dyes can be classified into three categories for virus labeling: covalent labeling dyes, lipophilic dyes, and intercalating dyes.
3.1.1. Covalent Labeling Dyes
Many organic dyes can be used to bind viral components covalently. During the development of the SVT technique, several families of fluorescent dyes have been used for labeling viruses. The photophysical properties of these dyes for single-virus imaging vary widely. More detailed information regarding the properties of the covalent labeling dyes is shown in Table 1.
Table 1. Covalent Labeling Dyes for Virus Imaging.

The color of emitted light.
Maximum excitation wavelength.
Maximum emission wavelength.
Extinction coefficient.
Fluorescence quantum yield.
Fluorescence lifetime.
Viral ribonucleoprotein.
Influenza virus.
Adeno-associated virus.
Seneca valley virus.
Poliovirus.
Rabies virus.
Semliki forest virus.
Vesicular stomatitis virus.
Simian virus 40.
Human papillomavirus.
Foot-and-mouth disease virus.
Murine polyoma virus.
Canine parvovirus.
Reovirus.
Uukuniemi virus.
Human adenovirus.
Not determined.
Information from Thermo Fisher.
Information from GE Healthcare.
Information from Atto-TEC.
Cyanine dyes have received wide attention for biomolecular labeling applications due to their high absorption cross sections, leading to high brightness and photostability. They consist of two quaternized heteroaromatic bases joined by a polymethine bridge. Their emission profiles extend from about 450 to 1000 nm, which can be tuned by the length of the polymethine bridge.147−149 Cy3 and Cy5 are the most popular cyanine dyes for SVT.119,129−133 It is worth pointing out that an epoch-making progress happened in 2001,69,150 when adeno-associated viruses (AAVs) labeled with a single Cy5 dye were tracked in real time to dissect the entry pathway of individual viruses in living cells (Figure 3). The detailed observation and quantitative description of viral behaviors paved a new road to illuminate virus–host cell interactions at single-virus level. Thereafter, the field paid more attention to the use of organic dyes to label various components of viruses for tracking. One also began to use environment-sensitive fluorophores, such as CypHer5, which is a pH-sensitive cyanine dye that has low fluorescence at basic pH and high fluorescence at acidic pH. Based on this property, it was applied to monitor the viral movements from the plasma membrane to acidic endosomes. The double labeling of viruses with Cy3 and CypHer5 made it possible to simultaneously monitor the transport and acidification processes of viruses.68,128
Figure 3.

Uptake of Cy5-labeled adeno-associated virus (AAV) by a live HeLa cell. (a) Representative trajectories of AAV particles in cells at different stages of the infection. (b) Zoom in of trajectory 2 showing several membrane interactions of the AAV at the cell surface. (c) Mean number of consecutive cell interactions derived for viruses that did not dock. (d–e) Distribution of adsorption times for (d) 137 nondocking and (e) 42 membrane penetrating trajectories. Adapted with permission from ref (69). Copyright 2001 The American Association for the Advancement of Science.
The Alexa Fluor family of organic dyes are synthesized though the sulfonation and modification of certain well-known dye classes such as rhodamine, fluorescein, and cyanine dyes. Due to the sulfonation, Alexa Fluor dyes are normally negatively charged and more hydrophilic than their precursors. With the aid of additional modifications, Alexa Fluor dyes are more photostable and less pH-sensitive than the original dyes.151,152 In the meanwhile, the emission spectra of the Alexa Fluor series span the visible spectrum and extend into the near-infrared region. These properties make them ideal for investigating the cellular uptake and endosomal transport of viruses. Thus, Alexa Fluor derivatives have been popularly applied to label viruses, including murine polyoma virus (MPV),139 canine parvovirus (CPV),142 vesicular stomatitis virus (VSV),134 simian virus 40 (SV40),135,141 human papillomavirus (HPV),137 foot-and-mouth disease virus (FMDV),138 AAV,136 and reovirus (RV).143 For example, by labeling RV with Alexa Fluor 647, Kirchhausen et al. found that individual RV particles were captured and internalized by clathrin-coated pits and vesicles, illustrating RV required access to endosomes for successful infection.143 Multiple-color imaging of Alexa Fluor-labeled VSV and a shorter, defective interfering particle indicated that the elongated shape of a VSV particle triggered the recruitment of actin filaments to complete the viral internalization process, and the cargo geometry was important for specifying the entry modes of the viruses (Figure 4).140
Figure 4.

Clathrin structures capture vesicular stomatitis viruses (VSVs) and defective interfering particles (DI-T) with similar kinetics. (a) Schematic of the clathrin-dependent virus internalization pathway. (b) VSVs and DI-T particles captured by clathrin structures in the same cell. BSC1 cells stably expressing s2-eGFP (green) were inoculated with Alexa Fluor 647-labeled DI-T (blue, blue arrowheads) and Alexa Fluor 568-labeled VSV (red, red arrowheads). Adapted with permission from ref (140). Copyright 2010 Public Library of Science.
There are other organic dyes used for labeling viruses such as fluorescein, Atto dyes, and Texas Red. Fluorescein, as a classical fluorescent reagent in biological research, possesses relatively high brightness, strong pH sensitivity, and poor photostability. Owing to the pH-sensitivity of fluorescein, the fluorescence of labeled viruses is quenched and undetectable under acidic conditions. Using the pH sensitivity, investigators could distinguish internalized fluorescein-labeled viruses from the extracellular viruses by changing the culture medium to pH 4.0.137,139,144 Texas Red is a conventional red fluorescent dye, and its derivative, Texas Red-X (TRX) succinimidyl ester, is commercially available and readily reactive for conjugating to viruses.67,145,146 Monitoring of TRX-labeled SV40 found that SV40 was internalized into cells by caveolae and transported to the endoplasmic reticulum by caveosomes.67 Atto dyes have enhanced photostability and longer fluorescence lifetime than either fluorescein or most cyanine dyes, and the emission profiles cover the visible and near-infrared wavelengths. These dyes have been used as fluorescent labels in a wide range of biological imaging experiments including SVT. For example, the unequivocal images of Atto 647N-labeled capsids of CPV demonstrated that CPV capsids had a relatively short residence time on the cell surface, which limited the efficiency of virus internalization.142
3.1.2. Lipophilic Dyes
The lipid membrane of enveloped viruses is derived from the plasma membrane or intracellular membrane of the host cells. Hence, virus labeling represents a significant application area for fluorescent membrane probes. Membrane probes include lipophilic organic dyes and fluorescent analogs of natural lipids. While some lipophilic dyes are particularly useful for SVT experiments, other lipid probes are scarcely used to label viruses. Lipophilic dyes are able to incorporate into the envelope of viruses by hydrophobic–lipophilic interactions (Table 2). For lipophilic dyes-based single-virus imaging, these dyes have an additional advantage in that they self-quench when they are incorporated into viral particles at high concentrations. At low pH levels or upon fusion where the viral and cellular membranes mix leading to a decrease in concentration, the lipophilic dyes dequench leading to a striking increase in fluorescence. Thus, the lipophilic dyes can detect the genome-release events of viruses, since the dequenching of the fluorescence signal could be considered as the sign of the occurrence of virus-endosome or virus-plasma membrane fusion. As one kind of early applied lipophilic dyes, rhodamine derivatives were used to study the kinetics of the virus-cell membrane fusion events on the membrane surface.65,153,154,161 For example, R110-labeled influenza viruses were used to investigate the real-time hemifusion and the pore formation of influenza viruses on a lipid bilayer. The occurrence of the hemifusion was indicated by the transient brightening of individual viruses caused by the fluorescence dequenching of R110.154
Table 2. Lipophilic Dyes and Intercalating Dyes for Single-Virus Imaging.

The color of emitted light.
Maximum excitation wavelength.
Maximum emission wavelength.
Extinction coefficient.
Fluorescence quantum yield.
Fluorescence lifetime.
Not determined.
Influenza virus.
Uukuniemi virus.
Human immunodeficiency viruses.
Ebolavirus.
Hepatitis B virus.
Vesicular stomatitis virus.
Dengue virus.
Hepatitis C virus.
Avian sarcoma and leukosis virus.
Chikungunya virus.
Poliovirus.
Human rhinovirus.
Information from Thermo Fisher.
With the emergence and development of fluorescence microscopy, researchers began to observe individual fluorescent viruses for obtaining more intuitive information about virus infection. Long-chain dialkylcarbocyanines (e.g., DiD, DiI, and DiO) with varying fluorescent excitations and emissions were widely adopted to label individual viruses for SVT. These dyes possess high extinction coefficients, moderate quantum yields, and short lifetimes in a hydrophobic environment. Their fluorescence is only detectable when they insert into lipid membranes. Owing to the strong autofluorescence of the cells (toward the blue end of the visible spectrum), the deep-red lipophilic dye (DiD) has been used extensively to track the infection behaviors and dissect the infection pathways of enveloped viruses, including influenza virus,68,72,74,128 dengue virus (DENV),73,75 hepatitis C virus (HCV),71 avian sarcoma and leukosis virus (ASLV),155 chikungunya virus (CHIKV),156 and HIV.82,83 The analogues of DiD, DiO (green) and DiI (red), have also been used to monitor the transport behaviors of viruses, such as HIV,157 ebola virus (EBOV),158 hepatitis B virus (HBV),159 and VSV.160 By quantitatively measuring the fluorescence intensity of individual viruses, the virus–endosome fusion events could be detected in real time (Figure 5).68 However, detection of the actual release of the interior content of the virus, as a prerequisite for virus infection, still requires more accurate approaches. In addition, owing to the self-quenching of lipophilic dyes in viruses, the number of viral particles that can be fluorescently detected is very low.73 When a large number of viruses bind to the cell surface, only 2% of viruses are indicated by DiD signals. This makes it challenging to efficiently and globally monitor the behavior of viruses in individual cells.99
Figure 5.

Tracking the transport and fusion of individual influenza viruses. (a) Trajectory of a DiD-labeled virus inside a cell. (b) Time trajectories of the velocity (black) and the DiD fluorescence intensity (blue) of a virus. (c–e) Histogram of the viral velocity in each stage. (Inset) Shown is the measured average mean square displacement (⟨Δr2⟩) vs time (Δt) for a virus. Adapted with permission from ref (68). Copyright 2003 National Academy of Sciences, U.S.A.
3.1.3. Intercalating Dyes
Generally, the viral genome is encapsulated into the intact virus particle, which is not accessible for dye attachment. However, several intercalating dyes can penetrate the outer components of viruses to label the viral genomes to a certain extent (Table 2). Ribogreen is an intercalating dye with little fluorescence and negligible absorbance. The dye is fluorogenic, meaning that its fluorescence intensity amplifies by several orders of magnitude when it binds to nucleic acids. This dye has been used for detecting and quantifying both RNA and DNA. By incubating ribogreen with the human rhinovirus (HRV), this dye contacted and bound with the viral genome during “capsid breathing”.166−168 Later, a metabolic labeling strategy was developed to label the viral genome during virus replication. For instance, acridine orange was incorporated into developing poliovirus (PV) to label the viral RNA.163−165 However, these dyes could rapidly inactivate the viral RNA upon illumination. SYTO dyes are a kind of cell-permeable nucleic acid dye, which binds to nucleic acids by passive diffusion through the plasma membrane. Each of these dyes possesses different characteristics including optical properties, nucleic acid binding preferences, cell permeability, and DNA/RNA selectivity and can be used to stain DNA and RNA in both live and dead eukaryotic cells.169 As an orange fluorescent nucleic acid binding dye, SYTO 82 has been successfully used to label the viral genome of RNA viruses, including PV and influenza virus.99,131,170 [Ru(phen)2(dppz)]2+ showed its potential to label the viral genomes of DNA viruses during viral self-assembly.171,172
3.2. Fluorescent Proteins
Green fluorescent protein (GFP) was discovered and purified from Aequorea victoria by Osamu Shimomura in the early 1960s. It began to be utilized as a tool for molecular biologists when the nucleotide sequence of GFP was reported and expressed in Escherichia coli and Caenorhabditis in 1994.173,174 The application of GFP as a genetically encoded fluorescence marker heralded a new era in cell biology.175 Thereafter, a broad range of genetic variants of fluorescent protein were developed by mutagenesis, and the diversity of excitation–emission spectra was further extended.76,176 In 2008, the Nobel Prize was awarded “for the discovery and development of the green fluorescent protein, GFP” to recognize the achievements of GFP labeling technology in the medical and biological sciences. More recently, GFP-like proteins from other species have been discovered with new optical properties, resulting in a further expansion of the color palette.177,178 Nowadays, there are more than 1000 FP variants reported, which cover the color range from blue to near-infrared spectrum (Figure 6).179−182 A representative list of FPs and their optical properties are given in Table 3.
Figure 6.

Characterization of near-infrared FPs. (a–c) Normalized excitation (a), emission (b), and full absorption spectra of different iRFPs. (d) Schematic representation of directed molecular evolution that led to iRFPs with distinct spectral properties. (e) Brightness of HeLa cells transiently transfected with iRFPs, normalized to the value for iRFP713-expressing cells. Adapted with permission from ref (181). Copyright 2013 Springer Nature.
Table 3. Optical Properties of Representative FPs.
| Protein | λexa(nm) | λemb(nm) | εabsc(M–1 cm–1) | Φfd(%) | pKa | Relative Brightnesse(% of EGFP) | refs |
|---|---|---|---|---|---|---|---|
| Sirius | 355 | 424 | 15,000 | 24 | <3.0 | 11 | (183) |
| EBFP2 | 383 | 448 | 32,000 | 56 | 4.5 | 53 | (184, 185) |
| TagBFP | 402 | 457 | 52,000 | 63 | 2.7 | 98 | (185) |
| mTurquoise | 434 | 474 | 30,000 | 84 | 4.5 | 75 | (186) |
| ECFP | 434 | 475 | 32,500 | 41 | 4.7 | 40 | (187) |
| TagCFP | 458 | 480 | 37,000 | 57 | 4.7 | 63 | (188) |
| mTFP1 | 462 | 492 | 64,000 | 85 | 4.3 | 162 | (187) |
| EGFP | 488 | 507 | 56,000 | 60 | 6.0 | 100 | (187) |
| mWasabi | 493 | 509 | 70,000 | 80 | 6.5 | 167 | (189) |
| mNeonGreen | 506 | 517 | 116,000 | 80 | 5.7 | 276 | (190) |
| EYFP | 514 | 527 | 84,000 | 61 | 6.5 | 153 | (191) |
| Citrine | 516 | 529 | 77,000 | 76 | 5.7 | 174 | (192) |
| mOrange | 548 | 562 | 71,000 | 69 | 6.5 | 146 | (178) |
| mKO2 | 551 | 565 | 63,800 | 57 | 5.5 | 108 | (193) |
| TagRFP | 555 | 584 | 100,000 | 48 | <4.0 | 143 | (194) |
| mRuby2 | 559 | 600 | 113,000 | 38 | 5.3 | 128 | (195) |
| mCherry | 587 | 610 | 72,000 | 22 | <4.5 | 47 | (178) |
| mKate2 | 588 | 633 | 62,500 | 40 | 5.4 | 74 | (196) |
| mNeptune | 600 | 650 | 67,000 | 20 | 5.4 | 40 | (197) |
| iRFP670 | 643 | 670 | 114,000 | 11 | 4.0 | 38 | (181) |
| TagRFP675 | 598 | 675 | 46,000 | 8 | 5.7 | 11 | (198) |
| iRFP702 | 673 | 702 | 93,000 | 8 | 4.5 | 23 | (181) |
| iRFP713 | 690 | 713 | 98,000 | 6 | 4.5 | 18 | (181) |
| iRFP720 | 702 | 720 | 96,000 | 6 | 4.5 | 17 | (181) |
| pH-sensitive FPs | |||||||
| Ecliptic pHluorin | 495 | 511 | NDf | ND | 7.1 | ND | (199) |
| Super-Ecliptic pHluorin | 495 | 512 | ND | ND | 7.2 | ND | (200) |
| pHuji | 566 | 598 | 31,000 | 22 | 7.7 | 20 | (200) |
| pHoran4 | 547 | 561 | 83,000 | 66 | 7.5 | 163 | (200) |
Maximum excitation wavelength.
Maximum emission wavelength.
Extinction coefficient.
Fluorescence quantum yield.
The relative brightness values were calculated from the product of the molar extinction coefficient and quantum yield, divided by the value for EGFP.
Not determined.
FPs are genetically encodable such that the cells and organisms can label themselves.201 Therefore, this method avoids additional procedures for purifying, tagging, and introducing labeled proteins into cells. However, the fluorescent intensity of FPs in live cells is not only relevant to the molecular brightness in themselves, but also to the number of FP molecules in their functional form. For GFP-like proteins, the fluorescence only can be observed after the chromophore has matured and the polypeptide chain has folded. Thus, the expression level is related to many factors, such as transcription and transfection efficiency, protein stability and folding, and chromophore maturation.202,203 Thus, although the labeling efficiency is near “100%”, the effective labeling can be much less. GFP and GFP derived proteins tend to have a high maturation efficiency (>85%), whereas red fluorescent proteins can be significantly lower, for example 40% for the case of mCherry.204 For SVT experiments, FPs are a convenient tag for labeling the relevant cellular structures and viral components, especially the internal components of viruses. However, viruses are very dense structures, and the relatively large size of FPs can make it a problem when using them to label viral proteins. Hence, the correct location for adding the FP to the viral genome needs to be found. Often, it is beneficial to spike the sample with a mixture of labeled and unlabeled components. In the case of adding a FP to the Gag protein of HIV-1, spiking with a ratio of 1:1 already restores wild-type like infectivity.119
To obtain FPs-labeled viruses, the recombinant gene technology should be used to fuse viral protein genes with FPs genes.177,205 When the recombinant cDNA clone was transfected into live cells, the viruses could be detected via their fluorescence. For single-virus labeling, FPs can be divided into three classes: autofluorescent proteins, pH-sensitive FPs, and phototransformable FPs.
3.2.1. Autofluorescent Proteins
The main feature of GFP and GFP-like proteins is that its fluorescence is encoded in the sequence and is typically preserved when fused with other proteins. This is a major breakthrough for specific fluorescent tagging of proteins in live cells using simple molecular biology. This discovery aroused the enthusiasm of many researchers to create GFP mutants with better brightness, faster folding, less propensity to oligomerize, or different excitation and emission wavelengths. Enhanced green fluorescent protein (EGFP) was one of the first enhanced variants, exhibiting more desirable characteristics for the practical use in mammalian cells. Wild-type GFP has unsatisfactory properties with respect to brightness (due to the chromophore being often in a dark, protonated state), folding properties, and excitation spectrum. Numerous GFP variants always emit fluorescence in the magic range of 442 to 529 nm.206 To break this limitation, efforts were devoted to cloning similar FPs from other organisms. So far, the whole palette of autofluorescent proteins spans the emission wavelength from blue to near-infrared spectrum. Both the spectral range as well as photophysical properties of FPs are being continuously expanded.
One of the most important applications of FPs is site-specific labeling of viral components for single-virus imaging in live cells, including the envelope,207−209 capsid,209−212 matrix,213 ribonucleoprotein (vRNP),207 and other components.82,84,214−216 For example, a GFP-labeled influenza virus was generated by carrying a GFP reporter in the NS segment to visualize the dynamics of infection progression (Figure 7).217 Tracking double-labeled rabies viruses (RABV) comprising a RFP-labeled envelope and an EGFP-labeled vRNP found that RABV was transported as a cargo in neurites of neuroblastoma cells in the retrograde direction.207
Figure 7.

Generation of recombinant influenza viruses carrying a GFP reporter. (a) Schematic representation of the NS segment of WT PR8 virus and NS1-GFP virus. (b) A549 cells were infected with recombinant PR8 virus carrying NS1-GFP. At 10 h postinfection, cells were fixed and stained for NP. NP staining is shown in red and NS1-GFP is shown in green. (c) Fluorescent micrographs of NS1-GFP virus plaques taken at 20× magnification. Adapted with permission from ref (217). Copyright 2010 National Academy of Sciences, U.S.A.
3.2.2. pH-Sensitive Fluorescent Proteins
By mutagenesis, researchers discovered many extremely useful mutants of wide-type FPs, which have various optical properties and environmental sensitivities.176,182 As protonation affects the photoproperties of the wild-type GFP chromophore, variants could be produced that were sensitive to the physiological pH in the cell and detect changes in pH. The optical parameters of representative pH-sensitive FPs are shown in Table 3. These proteins always display high fluorescence under neutral conditions, while the fluorescence signal markedly decreased under acidic conditions. Thus, they exhibit unique advantages for studying the transport mechanisms of endocytosis and exocytosis in live cells.218 Since many viruses need to hijack the endocytic pathway of host cells to realize the genome release for virus replication, targeted expression of pH-sensitive FPs to viruses allows for the real-time analysis of the virus-endosome fusion events in live cells. Thus, the pH-sensitive FPs are valuable fluorophores for investigating the virus infection mechanisms.214,215,219 For example, pHluorin, a pH-sensitive GFP variant, has been used to label HIV. By labeling the Gag protein and altering the external pH of the medium, the fission of newly assembled HIV particles could be detected.220 By labeling the surface of HIV, the fluorescent signal was used to monitor the uptake and delivery of HIV into acidic endosomes.214 Meanwhile, Hogue et al. captured the earliest viral exocytosis events and elucidated the intracellular transport pathways and egress mechanisms of alpha herpesvirus.221 Additionally, pHluorin and mKate2 (a pH-resistant FPs) were introduced to label the envelope and internal content of ASLV simultaneously. Live-cell imaging of infectious dual-labeled ASLV demonstrated the transport and fusion behaviors of ASLV were closely associated with early and intermediate endosomes (Figure 8).215
Figure 8.

Single ASLV-A entry into acidic endosomes and virus-endosome fusion. (a) Schematic diagram illustrating virus labeling and how the endosomal pH drops and subsequent ASLV-A fusion is visualized. (b) ASLV-A (yellow) fusion with TVA950 cells transiently expressing mKO-Rab5 (blue). Pseudoviruses were labeled with EcpH-ICAM (green) and Gag-mKate2 (red). The right top image panels show consecutive snapshots of the boxed region showing the virus prior to internalization (left), immediately after entry into acidic Rab5-positive endosomes (middle), and after fusion with early endosomes (right). The graph in panel (c) shows the fluorescence intensities of mKO-Rab5 and the viral EcpH-ICAM (green) and Gag-mKate2 (red) signals as a function of time. Adapted with permission from ref (215). Copyright 2014 BioMed Central Ltd.
3.2.3. Phototransformable Fluorescent Proteins
Another extremely powerful functionality of some FPs is that they can be activated or spectrally shifted using light.222,223 Phototransformable fluorescent proteins (PtFPs) have already attracted worldwide attention with their skyrocketing popularity for super-resolution microscopy in recent years.222,224 In 2002, Kaede, a GFP homologue, was discovered that was photoconvertible from green-to-red fluorescence emission under UV illumination.225 In the same year, using mutagenesis, a photoactivatable GFP variant (paGFP) was developed, which was initially irradiated by 413 nm light and then emitted strong fluorescence when excited with 488 nm light.226 Nowadays, a wide range of PtFPs have been developed to satisfy the requirements for different colors and modes of conversion, including photoactivatable, photoconvertible, and photoswitchable proteins. These proteins have been used for tracking the dynamics of cellular components in live cells (Figure 9).224,227,228 For example, photoactivated-localization microscopy (PALM), as a kind of single molecule-localization super-resolution microscopy,229 mainly relies on the amazing photophysical behaviors of PtFPs. This technique uses sequential activation of fluorophores and time-resolved localization to acquire high-resolution images,180,230,231 which has facilitated the investigation of the mechanisms of virus infection.232−234 Along with the development of SPT and SVT, which have provided subdiffraction resolution already in the 1980s, and superresolution microscopy, the combination of SPT and PALM (SPT-PALM) has been shown to be capable of visualizing multiple trajectories of viral proteins at high density in live cells.235
Figure 9.
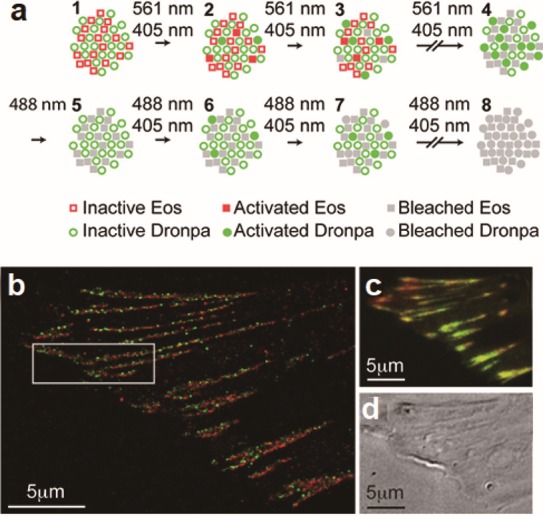
Use of PtFPs for investigating focal adhesions. (a) Protocol for dual-label super resolution imaging by PALM. (b) Dual-color PALM super resolution image overlay of paxillin (green) and zyxin (red). (c) Diffraction-limited, summed molecule, dual-color TIRF image. (d) DIC image. Adapted with permission from ref (228). Copyright 2007 National Academy of Sciences, U.S.A.
3.3. Fluorescent Nanoparticles
A major challenge in SVT is the development of fluorescent labels that combine small size with high brightness and photostability. To address this need and to enhance the imaging capabilities in SVT, researchers have pursued the development of biocompatible fluorescent nanoparticles for single-virus labeling. Compared with organic dyes and FPs, fluorescent nanoparticles usually show unique chemical and optical properties, such as higher brightness and photostability, which are highly preferable for single-virus tracking. Below, we will discuss commonly used nanoparticles: quantum dots and metal nanoparticles.
3.3.1. Quantum Dots
QDs, as a kind of semiconductor nanoparticles, have already attracted tremendous attention in biological applications.236−240 This is mainly due to the excellent optical properties of QDs, such as high quantum yield, photostability, and size-tunable narrow emission spectra.241−243 The spectral emission range of QDs covers the UV to infrared and can be adjusted by changing the size, shape, and composition of QDs.123,244−246 The high brightness of QDs (10–100 times higher than organic dyes or FPs) facilitates the detection sensitivity and allows high-contrast images to be obtained.123,247 In addition, the excellent photostability of QDs (100–1000 times higher than organic dyes or FPs) makes it possible to track single viruses over several hours with high temporal resolution.248 Moreover, QDs possess a wide excitation spectrum and a narrow emission spectrum, which makes them well suited for multicolor imaging where viral components and cellular structures can be tracked simultaneously.249,250 Based on the prominent properties mentioned above, QDs are broadly used in biolabeling,251−253 in bioimaging,254,255 and subsequently for single-particle tracking.256−259
In SVT experiments, the most available QDs are made of CdSe cores coated with a ZnS shell,260 which are usually prepared in the organic phase and covered with hydrophobic organic ligands (Figure 10). For biological applications, the solubilization and biofunctionalization of QDs are essential steps owing to the hydrophobic surface of QDs. A substantial amount of pioneering research has been performed regarding these steps, which has led to a strong boost in the number and variety of applications of QDs in the fields of biology and biophysics.237,243,260−263 So far, uniform, high-quality, biofunctionalized QDs are readily available via experimental synthesis or can be purchased commercially. In 2003, QDs were first applied to track individual glycine receptors on the neuronal membrane, which laid the cornerstone for exploring the dynamics of biomolecules in live cells by using QDs-based SPT.89 After that, a huge number of QDs-labeled biomolecules of interest were tracked dynamically in a wide variety of biological systems.94,238,264−267 In 2008, QDs were first successfully exploited to specifically label the envelope of viruses without significant effect on the infectivity of the virus, thereby allowing the uptake mechanism to be investigated in detail.98 This was considered a watershed moment for SVT. With the further development of labeling strategies, different components of viruses could be labeled with QDs.268 The detailed labeling strategies are described in detail in the section entitled Labeling Strategies for Nongenetically Encoded Fluorophores.
Figure 10.

Properties of QDs. (a) Schematic drawing of a core–shell QD and fluorescent images of QDs of different sizes under UV light. (b) Absorption (left) and emission (right) spectra of CdSe/ZnS QDs. All QD samples and data were obtained in the group of Pang.
At present, QDs-based SVT techniques have acquired spectacular achievements and researchers have elucidated multifarious infection mechanisms of viruses. For example, Pang et al. utilized this technique to analyze the infection behavior of influenza viruses and dissect the transport mechanism of influenza virus trafficking at different stages of infection. The results indicated that influenza viruses underwent a previously unknown five-stage process from the cytomembrane to the perinuclear region along microfilaments and microtubules. A “driver switchover” mechanism was proposed to answer the question of how the transport of influenza viruses switches from microfilaments to microtubules.108,110,114,115,118 In another example, Cui et al. designed QD-labeled transcription activator-like effectors to specifically target HIV proviral DNA sequences, and they identified single gene loci in the cell nucleus.116 By encapsulating QD-conjugated RNAs into influenza viruses, they monitored the uncoating process of individual viruses and revealed the mechanisms of uncoating and vRNP trafficking of influenza viruses.113
3.3.2. Metal Nanoparticles
In the middle of the 1980s, Brabander and colleagues visualized the movements of gold nanoparticles (AuNPs) with a size of 40 nm on the surface of live cells by using video-enhanced differential interference contrast microscopy.42,46 This is the first experiment using AuNPs-based SPT in live cells. Over the years, numerous researchers dedicated their efforts to develop suitable methods for data processing and modeling, and then AuNPs-based SPT was increasingly utilized to study the dynamic organization and heterogeneity of the cell membrane.269,270 One major advantage of AuNPs in SPT experiments is their high stability, because they have no photobleaching and less biodegradation. AuNPs possess unique optical properties due to the surface plasmon resonance and strong light scattering. The scattering light signal of AuNPs requires dark field microscopy or similar optical setup to be detected. The signal intensity is coupled to the illumination intensity, and thus good image contrast and high temporal resolution could be obtained. Experiments with AuNPs-labeled respiratory syncytial viruses (RSVs) demonstrated that the RSVs still maintain their virulence and could be successfully tracked over extended periods of time.271 However, the ability to detect multiple species via scattering light is very challenging and the limited availability of multiple labels restricted their application for SVT.
Metal nanoclusters (e.g., Au, Ag) are composed of a small number of atoms and typically have sizes below 2 nm. The emission wavelength of fluorescent metal nanoclusters covers the visible to near-infrared region of the electromagnetic spectrum.273,274 The fluorescence of metal nanoclusters can be tuned by a number of factors, such as size, composition, ligands, aggregation state, ionic strength, and pH value. Due to the unusual physicochemical and good optical properties, fluorescent metal nanoclusters have attracted increasing attention for biological and biomedical applications.274−276 To date, there are a number of applications in virus detection,277−279 but very few reports about virus labeling with nanoclusters. Marjomäki et al. developed site-specific protocols to target the enterovirus capsid with monodisperse gold nanoclusters (Figure 11). The end point dilution assay implied that the binding of gold nanoclusters to the viral surface did not lower the infectivity of the virus.272 Thus, site-specific labeling of enteroviruses with nanoclusters could facilitate the future structural studies of virus uncoating and become an important new tool for future SVT applications.
Figure 11.

Gold nanocluster labeling of enteroviruses. (a) Synthesis of the maleimide functionalized Au102(pMBA)44 clusters and their site-specific conjugation to enteroviruses. (b–c) TEM images of CVB3 viruses treated with functionalized gold clusters. (c) Control TEM image with conventional negative staining of a virus sample incubated with nonfunctionalized clusters. Adapted with permission from ref (272). Copyright 2014 National Academy of Sciences, U.S.A.
4. Labeling Strategies for Nongenetically Encoded Fluorophores
Organic dyes and nanoparticles, as nongenetically encoded fluorophores, can be advantageous over FPs owing to their superior brightness and photostability. However, most of these fluorophores can be used to target the viral components by direct chemical reactions or noncovalent interactions, but it is difficult to label viruses site-specifically. For many questions of interest, it is only necessary to label the viral particles and specific labeling of the virus is not important. Other questions require the labeling of specific viral components. For the following discussion of the several strategies that have been developed for attaching nongenetically encoded fluorophores to viral components, we will divide them into nonspecific and site-specific labeling approaches (Figure 12).
Figure 12.

Labeling strategies and labeling sites for fluorescent labels in SVT.
4.1. Nonspecific Labeling
In virtue of their intrinsic properties, it is possible to use hydrophobic–lipophilic interactions or intercalation for some organic dyes to label the viral envelope and genome, which have been described in detail in the previous section. For labeling the external components of viruses (including the envelope of enveloped viruses and the capsid of the nonenveloped viruses), many chemical labeling methods have been adopted for organic dyes and nanoparticles, such as cross-linking, click chemistry, and biotin–streptavidin interactions.
4.1.1. Cross-linking Reaction
Cross-linking reaction is the simplest and versatile method for labeling viral components with organic dyes or nanoparticles, which mainly conjugate proteins and biomolecules with fluorophores by a covalent bond. Many cross-linking reagents (called cross-linkers) have been characterized and can be synthesized to combine two or more reactive groups within one molecule. The reactive elements can then chemically attach to specific functional groups of proteins and other molecules on the viral surface.
Proteins are complex structures composed of a linear sequence constructed from 20 different amino acids. However, for labeling, there are typically only four functional groups of proteins that are targeted: primary amines (−NH2), which exist at the N-terminus of each peptide and the side chain of lysine; carboxyls (−COOH), which exist at the C-terminal of each peptide and the side chain of glutamic acid and aspartic acid; sulfhydryl (−SH), which exists in the side chain of cysteine; carbonyls (−CHO), which can exist in oxidized glycoproteins.280 Many chemical species can react with the four kinds of functional groups to form chemical bonds including isothiocyanates, acyl azides, N-hydroxysuccinimide (NHS) esters, sulfonyl chlorides, and imidoesters (Figure 13). A wide variety of cross-linkers are commercially available, which can be easily conjugated to proteins or other functional group-containing compounds based on the commercial protocols. Thus, any kind of viruses can be covalently labeled with organic dyes or nanoparticles by cross-linking techniques. Especially for nonenveloped viruses, where the capsid is exposed to the outside, covalent labeling is a desirable choice for labeling. For example, AAV was conjugated with QDs using an amino-carboxyl cross-linking reaction (Figure 14).136 A mild and clickable reaction between hydrazine and aldehyde was also used to label envelope proteins of viruses with QDs.101,281 The direct chemical labeling methods are flexible and easy to apply, by which QD-virus conjugates or organic dye-labeled viral particles are readily obtained for SVT experiments.
Figure 13.

Cross-linking reactions for conjugating fluorescent labels to viruses.
Figure 14.

Covalent attachment of QDs to AAV and characterization of the QD-AAV conjugates. (a) QD-AAV networks are generated by an amide bond formation between the carboxylic source on QDs and the primary amines from lysine residues on the AAV capsid via carbodiimide chemistry. (b) Transmission electron microscope (TEM) images of (left) unconjugated QD525, (middle) AAV only, and (right) QD525-labeled AAV. Adapted with permission from ref (136). Copyright 2011 American Chemical Society.
4.1.2. Click Reaction
“Click Chemistry” is a type of biocompatible small molecule reaction that is commonly used in bioconjugation with fast reaction rates, mild reaction conditions, high yields, simple procedure, and high selectivity. In 1963, Huisgen first discovered the unactivated azide–alkyne cycloaddition reaction, but this reaction was ignored for many years owing to the harsh experimental conditions.282 The term “Click Chemistry” was first put forward by Kolb et al. in 1998 and fully described in 2001, where they also introduced Cu(I) as a catalyst to realize the azide–alkyne cycloaddition reaction at room temperature with high chemical yield.283,284 The copper-catalyzed azide–alkyne cycloaddition reaction (CuAAC) is the most universal click reaction, but it is often incompatible with living systems due to the potential toxicity of Cu(I). Nowadays, there are several kinds of copper-free azide–alkyne cycloaddition reactions reported, such as the strain-promoted azide–alkyne cycloaddition (SPAAC),285,286 thiol–ene reaction,287 and strain-promoted inverse-electron-demand Diels–Alder cycloaddition (SPIEDAC).288 The copper-free approaches opened up the possibility of labeling particular biomolecules in living systems with click reactions. For instance, to detect DNA synthesis in vivo, a thymidine analogue 5-ethynyl-2′-deoxyuridine was incorporated into DNA during DNA replication, and the terminal alkyne group was labeled with a fluorescent azide by a click reaction.289 Similarly, RNA synthesis was detected by using a click reaction between a uridine analog 5-ethynyluridine and fluorescent azide.290 Researchers have also developed an unnatural sugar-based click labeling strategy.291−293 The azido-sugars were added into the cell medium for cell culture. After metabolism, the azido groups were incorporated into the glycans on the cell surface, which could be used to bind with fluorophores by click chemistry.
The viral surface has potential targets for biofunctional modification, which can be functionalized to add clickable groups for virus labeling.105,106,294,295 For example, Zhang et al. modified baculoviruses with a clickable group (4-dibenzocyclooctynols) and then labeled viruses with azido-derivatized multidentate-imidazole polymer ligands-modified QDs by copper-free click chemistry.106 Lin et al. established a site-specific click labeling strategy on the surface of hepatitis D virus (HDV). By incorporation of pyrrolysine analogues carrying various functional groups onto the envelope proteins of live HDV, they successfully exploited the subsequent click reaction to attach a biotin molecule onto the HDV surface (Figure 15).296 Additionally, by introducing azide and vinyl groups into proteins and the genome of viruses respectively, the envelope and genome of viruses could be labeled simultaneously via copper-free click chemistry and alkene-tetrazine ligation reactions.297 Ethynyl-modified nucleosides have also been utilized to label newly synthesized DNA of vaccinia virus, adenovirus, and herpes virus by copper(I)-catalyzed click reactions for tracking the viral genome in host cells at the single-molecule level.298
Figure 15.

Engineering the hepatitis D virus (HDV) assembly process for site-specific incorporation of unnatural amino acids (UAAs) into its surface envelope proteins. (a) Two-step procedure for the assembly of intact HDV carrying site-specifically incorporated UAA-recognized non-natural amino acids in human hepatocytes Huh-7 cells. (b) Structures of five Pyl analogues used in this study: PenK (Ne-pent-4-ynyloxycarbonyl-l-lysine), ACPK (Ne-((1R,2R)-2-azido-cyclopentyl oxy-carbonyl)-l-lysine), BCN (bicyclo[6.1.0]non-4-yn-9-ylmethanol), DiZPK (3-(3-methyl-3H-diazirine-3-yl)-propaminocarbonyl-Ne-l-lysine), and ONBK (o-nitrobenzyloxy carbonyl-Ne-lysine). Adapted with permission from ref (296). Copyright 2013 Wiley-VCH Verlag GmbH & Co. KGaA, Weinheim.
4.1.3. Biotin–Streptavidin Interaction
The biotin-(strept)avidin system is one of the strongest noncovalent biological interactions present in nature, which also shows high selectivity, fast reaction speed, and good resistance to extremes of temperature or pH.299 So far, this system has been used extensively in biomolecule detection, protein purification, and biological labeling, and there are a lot of biotinylation reagents available for developing different labeling methods. Therefore, the versatile approach is to covalently attach biotin to the biomolecule of interest and subsequently bind avidin, streptavidin, or neutravidin reagents. To label viruses with fluorophores, the viral components should be biotinylated chemically or enzymatically. Chemical biotinylation utilizes cross-linking reactions to generate nonspecific biotinylation of carboxylates, sulfhydryls, amines, and carbohydrates. Enzymatic biotinylation generates biotins in a specific lysine within a certain sequence of the viruses by a bacterial biotin ligase.98,300 Details will be described in the following Site-Specific Labeling section. Based on the biotin–streptavidin interaction, two strategies have been developed for labeling viruses.
A one-step labeling approach to virus labeling is to directly obtain fluorescent-labeled virus conjugates by the interaction between biotinylated viruses and streptavidin-modified fluorophores. The conjugates could aid researchers in investigating the interactions between viruses and the plasma membrane in the early stage of virus infection. However, these one-step labeling methods require tedious purification procedures to remove free fluorophores, such as size exclusion and ultrafiltration. These cumbersome steps usually bring about a significant loss in virus and have deleterious effects on the integrity and activity of the viruses. Especially QDs-labeled viruses cannot be preserved for a long time, since viruses can be degraded at room temperature and QDs are unstable or precipitate below freezing. Thus, the method is not well suited for performing many parallel experiments for gathering statistics.
A so-called two-step labeling approach initially incubates the host cells with biotinylated viruses and then the streptavidin-modified fluorophores are added. For QDs labeling, the two-step labeling strategy has been broadly adopted for SVT experiments. After biotinylation, the viruses are added to cells at low temperature and allowed to bind to the viral receptors and then incubated with streptavidin-QDs to fluorescently label the viruses (Figure 16).108,301,302 The whole process takes less than a half an hour and avoids tedious purification processes. A colocalization analysis indicated that nearly all viral envelopes could be labeled with QDs, and the infectivity of QDs-labeled viruses was still 86% of that of the native viruses.99 Thus, this method is easy to perform with high efficiency and low damage to the virus infectivity and has been widely used for studying the infection mechanisms of viruses, including influenza viruses and infectious hematopoietic necrosis virus (IHNV).99,107
Figure 16.

Schematic of a two-step labeling strategy of labeling virus with QDs via the biotin–streptavidin interaction. Adapted with permission from ref (108). Copyright 2012 American Chemical Society.
4.2. Site-Specific Labeling
The primary goal of viruses is to deliver their genome to the proper cellular compartment for transcription and replication. Only labeling external components is insufficient for following the whole infection pathway of a virus because the external components will be dissociated in the process of virus infection. Labeling the internal components of viruses is much more difficult, since fluorophores, especially fluorescent nanoparticles, are difficult to penetrate the external components of the viruses to enter the interior. This is where the use of FPs for fluorescence labeling has great advantages; when the appropriate location can be found that tolerates the tag, the viral genome can handle the increase in genomic size and there are enough copies to allow tracking over reasonable time periods. However, sometimes it would be great to combine the benefits of genetically encoded labels with the brightness and photostability of synthetic dyes or QDs. Thus, one big question is how to encapsulate nanoparticles or organic dyes into viruses and can it be done specifically.
In early 2006, Dixit and co-workers incorporated QDs into the capsids of the brome mosaic virus by self-assembly, and the generated virus-like particles (VLPs) had a similar size to the native virus.303 Later, combining with site-specific labeling strategies, such as peptide tag-mediated labeling and oligonucleotide-guided labeling, host cell-assisted methods have been extensively developed in recent years, which are an alternative approach to label the internal and external components of viruses during virus assembly.304−306 For virus labeling, the distinct advantage of host cell-assisted methods is that it is possible to avoid modification of the viral surface, thus minimizing the influence of labeling on the virus–receptor interactions. To date, host cell-assisted methods have played an important role in visualizing the infection behaviors in different infection stages of a variety of viruses including SV40, HIV, and PV.131,290,307,308
4.2.1. Peptide Tag-Mediated Labeling
Fluorescent proteins, as genetically encoded fluorescent labels, can be incorporated with high specificity but still suffer from relatively low brightness and poor photostability.309 Organic dyes and nanoparticles typically have much better photophysical attributes but cannot realize site-specific labeling in live cells. To combine the best of both worlds, another class of genetically encoded proteins has been developed that can catalyze the autoattachment of fluorescent ligands inside living cells.310 The proteins themselves are nonfluorescent but can be specifically labeled with fluorescent ligands.311 These tags can be much brighter, more stable, color-tunable, and more chromatically diverse312 and, similar to FPs, can also possess some specific properties such as environmental sensitivity and photoswitching but with better photophysical properties.313,314 For imaging experiments, the labeling is controllable in space and time, and the color of the target protein can be selected according to the experimental requirements.315 We will discuss two major site-specific approaches for labeling viruses with organic dyes or nanoparticles in live cells: self-labeling fusion tags and enzyme-targeted peptide tags (Table 4).316
Table 4. Tag-Mediated Site-Specific Labeling Methods.
| Tag | Size (amino acids) | Labeling reaction | Fluorophores demonstrated | Virus | Ref for Tag |
|---|---|---|---|---|---|
| Self-labeling fusion tags | |||||
| SNAP tag | 182 | Covalently binding with benzylguanine derivatives | TMRa, SiRb | HIVc,317,318 | (319−321) |
| CLIP tag | 182 | Covalently binding with benzylcytosine derivatives | TMR | HCVd,322 | (323) |
| Halo tag | 296 | Covalently binding with haloalkane derivatives | TMR | PrVe,324 | (325) |
| TMP tag | 157 | Engineered Escherichia coli dihydrofolate reductase noncovalently binding with trimethoprim (TMP)-fluorophore conjugates | Fluorescein, Atto dye | NDf | (326−329) |
| TC tag | 6–10 | Covalently binding with fluorogenic biarsenical compounds | FLAsH, ReAsH | HIV,330 VSV,g,331 IVh,332 | (333, 334) |
| His tag | 6 | Noncovalently binding with Ni-NTA-functionalized fluorophores | QDj | Prion,103 RSVi,335 | (336) |
| Enzyme-targeted peptide tags | |||||
| AP tag | 15 | Covalently binding with biotin or ketone analogs of biotin | QD, Fluorescein, Alexa Fluoro | HIV,98,116 Baculovirus300 | (337, 338) |
| LAP tag | 13–22 | Covalently binding with lipoic acid derivatives | QD, Cy3, Alexa Fluoro | HIV116 | (336, 339, 340) |
| Tub tag | 14 | Covalently binding with tyrosine derivative | Coumarin | ND | (341, 342) |
| S6/A1 tag | 11 | Covalently binding with coenzyme A derivatives | Texas red, Alexa Fluoro, Cy3 | ND | (343, 344) |
Tetramethylrhodamine.
Silicon rhodamine.
Human immunodeficiency virus.
Hepatitis C virus.
Pseudorabies virus.
Not determined.
Vesicular stomatitis virus.
Influenza virus.
Respiratory syncytial virus.
Quantum dot.
4.2.1.1. Self-Labeling Fusion Tags
Self-labeling fusion tags have recognition domains that offer the specific attachment of fluorescent ligands to the target proteins in live cells. In this approach, the target protein binds with a self-labeling fusion peptide or protein sequence. The protein is expressed in live cells and the specific fluorescent ligands are added for protein labeling. As the self-labeling fusion peptide or protein sequence is small, it is easy to create with a wide variety of fluorescent ligands, which can be optimized for the imaging instrumentation.
The SNAP tag, a 182 residues polypeptide (19.4 kDa), is an engineered version of human O6-alkylguanine-DNA alkyltransferase (hAGT).345 This protein catalyzes the attachment of O6-alkylguanine or O6-benzylguanine to one of its cysteines. To label the SNAP-tagged protein in live cells, the fluorescent membrane permeable O6-alkylguanine substrates are added into cells having expressed proteins fused with SNAP-tag.319,320 CLIP tag is a new variant of hAGT, which specifically reacts with O6-benzylcytosine substrates.323 The orthogonal relationship between the SNAP tag and the CLIP tag can be simultaneously exploited for dual-color labeling.346
The Halo tag is a modified haloalkane dehalogenase, which specifically binds the reactive primary alkyl halides and covalently attaches a modified fluorescent ligand to the active-site residue.325,347 The trimethoprim (TMP) tag was developed on the basis of the strong interaction between the folate analogue TMP and the Escherichia coli dihydrofolate reductase (eDHFR). The protein of interest is fused with eDHFR, expressed in live cells, and then the fluorophore-modified TMP is added into the cells and binds with eDHFR with high affinity and selectivity.326,348 So far, these tags have been widely used for protein imaging and trafficking in live cells. Based on reverse genetic technology, the halo-tag protein has been fused with the smallest pseudorabies virus (PrV) capsid protein VP26. The recombinant PrV was easily harvested and used directly for the virus tracking without further modification (Figure 17).324 These labeling systems have several obvious advantages. Fluorescence can be turned on when the fluorescent ligands are added into the cells and turned off using available blocking reagents. Alternatively, a ligand with a second dye can be added at a later time point such that the newly produced proteins of interest are labeled with a different color of dye.
Figure 17.

A schematic diagram for the generation of Halo tag-labeled pseudorabies viruses. Adapted with permission from ref (324). Copyright 2016 American Chemical Society.
One of the shortest peptide tags available is the tetracysteine (TC) motif (most commonly CCPGCC). The biarsenical dyes FlAsH (green fluorescence) and ReAsH (red fluorescence) specifically bind the TC tag in live cells. The TC tag is only 6 amino acids, and the protein of interest will fluoresce when the biarsenical dye binds. The smaller size and self-labeling capacity of the TC tag make it a very attractive tool for virus labeling. For example, Rudner et al. inserted a TC tag to the C terminus of HIV Gag and investigated the dynamic process of HIV by two-color imaging analysis.330 By fusing M protein with TC tags and P protein with EGFP, recombinant VSVs could be dually fluorescent-labeled. Time-sequence images confirmed the adsorption of VSV at the plasma membrane and illustrated that the entry and uncoating of VSV in the infected cells occurred with a half-life of approximately 28 min after virus adsorption.331 However, due to the interactions with other thiol-containing proteins, the background signal is much higher, and time-consuming washing procedures are required before imaging.
The His tag consists of at least six histidine (His) residues and shows a high affinity and selectivity for Ni2+. The (histidine)6-Ni2+-nitrilotriacetate (Ni-NTA) system has been widely utilized in protein purification. With the development of fluorescent Ni-NTA-based probes, the His tag has already been used for live-cell imaging.103,109,349 For example, PEG-interspersed Ni-NTA-functionalized QDs were developed to label prion proteins expressed on cell surfaces.103 Time-lapse imaging first demonstrated that the entire process of prion internalization could be divided into four discrete but connected stages and that lipid rafts played an important role in prion localization and internalization.109 Further, by conjugating the viral surface with specific polypeptide containing histidine residues, Huang et al. developed a Ni-NTA based progeny virus labeling strategy, which is noninvasive and can be used to label other enveloped viruses budding from the plasma membrane (Figure 18).335
Figure 18.

Scheme of the general strategy for in situ virus labeling during progeny virus assembly. The labeling procedure includes (1) infection of the host cells with the virus, (2) after 2 days’ cultivation, the proteins on the host cell surface were conjugated with polypeptides containing his-tags and carboxyl groups, (3) progeny viruses assemble and are released from the cell surface, incorporating the his-tags in the process, and (4) the progeny viruses are further tagged with Ni2+-NTA modified QDs. Adapted with permission from ref (335). Copyright 2016 The Royal Society of Chemistry.
4.2.1.2. Enzyme-Targeted Peptide Tags
An alternative method for site-specific labeling is the use of enzyme-targeted peptide tags. The enzymes can catalyze the attachment of a specific peptide sequence to a fluorescent substrate. Thus, the enzymes could help to realize the modification of the peptides with high site selectivity. There are several kinds of enzymes used for protein labeling, such as ligases and transferases.
Ligases, including biotin ligase, tubulin tyrosine ligase, and lipoic acid ligase, can bind specific peptide tags to a recognizable sequence.350 For example, the biotin acceptor peptide (AP)-tag, a 15 amino acids long peptide that is a substrate for biotin ligase (BirA), enables the conjugation of a biotin to a lysine side chain on the AP tag.351 After the BirA-catalyzed biotinylation, fluorescent labeling of the protein of interest can be achieved using the biotin–(strept)avidin interaction. By taking advantage of this site-specific labeling strategy, the viral envelope incorporated an AP tag and subsequently, streptavidin-conjugated QDs were attached to the surface of virion after the biotinylation of the AP tag happened.98,300 For example, the capsid protein VP39 of baculoviruses could be specifically labeled with streptavidin-modified QDs by modifying the protein with biotin by a genetic recombination technique during viral assembly in host cells.102 It is worth noting that the various components of viruses will disassociate at different stages of the infection process. To dissect their whole infection pathway, it is a prerequisite for SVT to be able to simultaneously follow the related external and internal components of viruses. Pang et al. developed a cell-assisted strategy to simultaneously label the envelope, capsid, and genome of baculoviruses with QDs, EGFP, and SYTO 82, respectively. Such a triple-labeled virus makes it possible to visualize the dissociation process of key viral components in real time.170
Similarly, a short lipoic acid ligase (LplA) acceptor peptide (LAP) tag is a 22 amino acids long peptide, which can be catalyzed by LplA to conjugate with lipoic acid derivatives in an ATP-dependent manner.352 The protein of interest can be fused with the LAP tag and labeled with fluorescent lipoic acid derivatives. The tub tag is a 14 amino acid hydrophilic recognition sequence. Using tubulin tyrosine ligase (TTL), it is possible to conjugate a tyrosine with the fluorescent tub tag.353 Some of these tags have been utilized to label viral components during virus infection. For example, Cui et al. used a pair of QD-labeled transcription activator-like effectors (TALEs) to image single genomic loci of HIV-1 provirus in the cell nucleus. One of the TALEs was fused with LAP tag, and labeled by tetrazine-conjugated red QDs via Diels–Alder cycloaddition chemistry. The other TALE was fused with an AP tag, biotinylated, and labeled with streptavidin-modified green QDs. The fluorescence colocalization of the two QD-TALEs demonstrates that there is a single HIV-1 provirus loci in live cells (Figure 19).116
Figure 19.

Labeling the HIV-1 proviral loci. Within the cytosol of a live cell, the TALEs fused with a short LplA acceptor peptide (LAP) are decorated with trans-cyclooctene and subsequently labeled with tetrazine-conjugated red QDs via Diels–Alder cycloaddition chemistry. The TALEs fused with an AP tag are biotinylated and labeled with streptavidin-conjugated green QDs. The two QD-TALEs bind to the target HIV-1 proviral DNA sequences, and their fluorescence colocalization demonstrates a single-copy HIV-1 provirus loci in the human chromosomes. Adapted with permission from ref (116). Copyright 2017 Springer Nature.
Transferases can transfer functional groups from a donor substrate to a specific amino acid in a peptide sequence. Phosphopantetheinyl transferases (PPTase), such as Sfp and AcpS, can catalyze the transfer of a phosphopantetheinyl group from coenzyme A (CoA) to a conserved serine. Sfp preferentially recognizes the S6-tag, and AcpS preferentially recognizes the A1-tag.353,354
4.2.2. Oligonucleotide-Guided Labeling
The base-pairing propensity of DNA and RNA oligonucleotides can be used to detect the presence of specific target sequences (i.e., complementary nucleic acid sequences) by hybridization. Short oligonucleotides can be synthesized and several different types of groups incorporated for fluorescently labeling the oligonucleotides. Organic dye- or QD-labeled oligonucleotides have been designed and transfected into infected host cells to bind the viral genome of interest in live cells. During virus assembly, fluorophores with oligonucleotides can be assembled into the interior of viruses. A paradigm is that QDs were conjugated with QD-labeled guide RNAs containing the sequence of a packing signal of the viral genome, and then the functionalized QDs would be encapsulated into the capsid of VSV glycoprotein pseudotyped lentivirus (PTLV) in living cells (Figure 20).355
Figure 20.

Working principle of encapsulating SA-QDs into HIV-based lentivirus in living cells. Adapted with permission from ref (355). Copyright 2013 American Chemical Society.
By labeling the viral oligonucleotides, it is possible to use SVT to follow the fate of the viral genome and where replication occurs. Several strategies have been developed to track the transport process of the viral genome in host cells. Fluorescence in situ hybridization (FISH) is a conventional nucleic acid recognition technique, which can be used to detect and localize endogenous or engineered DNA or RNA through Watson–Crick base pairing. However, FISH is performed in fixed specimens leading to a loss of dynamical information in comparison to tracking nucleic acids in live cells. For live-cell imaging, fluorescently labeled linear oligonucleotides were developed to visualize nucleic acids and allow investigations of trafficking or transient interactions. Using this hybridization approach, Molenaar et al. detected various endogenous nuclear RNAs in live cells without interfering with cell vitality.356 Often, hybridization techniques suffer from a high level of background fluorescence due to the lack of effective approaches to remove unbounded probes. Here, using nucleic hairpin structures with a fluorescence quencher has been developed to minimize the background fluorescence from nonbound beacons. Upon binding to the target nucleic acid sequence, the hairpin opens and the fluorescence signal increases. One such approach uses fluorescence resonance energy transfer (FRET) to quench the fluorescence signal of the donor and thus to significantly reduce the background fluorescence. Using FRET, a series of QD-labeled molecular beacons were developed with controllable QD valency. A nanobeacon with one conjugated DNA was favorable for labeling and imaging single RNA in live cells and was used for ultrasensitive detection of single HIV RNAs in HIV integrated cells.357
5. Optical Implementations for Single-Virus Tracking
Many viruses are on the order of 100–200 nm in size, just slightly smaller than the diffraction limit of a high-end microscope. Hence, it is also potentially possible to monitor some viruses directly without the need for labeling them. One label-free approach that has been applied successfully for tracking HIV particles is interferometric scattering microscopy (iSCAT).358 By using the interference of light reflected from the surface of the coverslip and that coming from the virus particle itself, it becomes possible to visualize the position of the virus and perform SVT with both high spatial and temporal resolution. Kukura and colleagues combined SPT with iSCAT to follow the diffusion of single Simian Virus 40 particles on supported bilayers with 8 ms temporal resolution and nanometer spatial resolution. By labeling the viruses with QDs, we could also measure the orientation of the virus and thus monitor the tumbling of the virus as it slides along the surface.359
Once viruses and/or viral components have been successfully labeled fluorescently, SVT measurements can be performed to investigate the various processes in the lifecycle of the virus. For this, fluorescence microscopy has become an indispensable tool. The basic function of a fluorescence microscope is to excite a sample with a specific band of wavelengths, separate the emitted fluorescence from the excitation wavelengths, and detect the fluorescence emission with high sensitivity. As only the emitted light reaches the observer’s eye or the detectors, high-contrast fluorescence images can be recorded on a dark background. In the early part of the 20th century, the first fluorescence microscopes were built by the companies of Carl Zeiss and Carl Reichert.360 Subsequently, Ellinger and Hirt developed “intravital microscopes” to visualize living organisms. They utilized UV light to excite the sample and put filters between the samples and eyes that would reflect the excitation light and transmit the emitted light. This provided the basic principle of modern fluorescence microscopy.361 Nowadays, lasers are typically used for excitation of the sample instead of lamps. When usage continues with wave lasers or nonfemtosecond pulsed lasers, the excitation wavelength can be limited to a very narrow region of the spectra and emission filters can be produced to efficiency block that specific wavelength while not blocking much of the fluorescence emission. In addition, many lasers provide a high-quality beam profile that simplifies the construction of the excitation pathway. The recent developments in lasers, optics, and detectors as well as the broad spectrum of available fluorophores and various labeling methods have resulted in a revolution in fluorescence microscopy and the worldwide use of fluorescence microscopes in various fields including cell biology, virology, and biophysics.33,362,363 There are several commonly used imaging modalities for single-virus tracking, which we will present below.364,365
5.1. Wide-Field Microscopy
The simplest optical implementation for SVT experiments relies on wide-field illumination and a highly sensitive camera. In wide-field microscopy, a large field of view is fully illuminated by the excitation light and the fluorescent structures of the sample can be captured quickly and easily by a single camera.366 To acquire a high amount of signal, objectives with an NA > 1.2 are typically used along with sharp fluorescence filters having a high transmission (>80%). For detection, a fast frame transfer, high-quantum yield camera is essential for SVT. Conventional charge coupled device (CCD)-based cameras have high sensitivity but slow read-out speeds whereas complementary metal oxide semiconductor (CMOS) cameras offer very fast frame rates but a narrow dynamic range. An electron-multiplied charge coupled device (EMCCD) detector performs the electron amplification on chip before read-out to decrease noise and combines fast read-out speed with high quantum yield and optimum resolution. A newly developed scientific complementary metal-oxide semiconductor (sCMOS) camera is based on a CMOS image sensor design and can also offer low noise, rapid frame rates, and high quantum yield. Both cameras are very suitable for quantitative measurements and dynamic imaging. For live-cell studies, an EMCCD camera is capable of obtaining discernible images with a lower number of photons. However, when fast, full-frame transfer rates are essential, sCMOS cameras are superior for fast imaging at speeds approaching or exceeding 1000 fps.367−369
The advantages of wide-field microscopy are the large excitation depth, large depth of focus, and low signal loss allowing the tracking of individual viruses in a large volume. However, there is no discrimination against out of focus light. For experiments with low autofluorescence and sparsely distributed fluorescence viruses, this approach works well. However, for experiments with a high background, such as investigations of the HIV assembly using FP-labeled Gag protein, the out-of-focus signals result in the low-contrast images.370 In addition, owing to the large depth of field, this microscopy modality is rarely used to acquire 3D data over a certain depth of the sample. Thus, wide-field microscopy is mostly limited to 2D SVT tracking.68
5.2. TIRF Microscopy
In 1956, E. J. Ambrose first proposed the idea to illuminate cells that contact a glass surface by using total internal reflection. Total internal reflection fluorescence (TIRF) microscopy was first realized by Daniel Axelrod at the beginning of the 1980s.371 The basic principle of TIRF microscopy is to use an evanescent wave to excite the sample near the glass–liquid interface. An evanescent wave is generated at the glass–liquid interface where the excitation light impinges on the glass-sample interface above the critical angle, at which point the light cannot physically propagate into the sample (typically buffer) and is thus totally reflected. The evanescent wave is a nonpropagating wave whose intensity decays exponentially with distance from the interface.372−374 There are two main approaches to producing TIR excitation at the glass–sample interface (Figure 21). The original approach, prism-based TIRF, utilizes an optical prism to couple the excitation light to the upper surface of the glass (typically quartz)–sample interface. Upon the development of objectives with a numerical aperture above 1.4, it became possible to focus light onto the coverslip–sample interface such that the incident beam reaches the glass–sample interface above the critical angle, creating an evanescent field.375 When using an inverted microscope, objective-type TIRF leaves the sample above the objective free and is thus more convenient and easier to use. Objective-type TIRF is the common modality used for live-cell imaging.376−379
Figure 21.

Schematic drawing of an objective-based TIRF and a prism-based TIRF.
Due to the exponentially decaying intensity of the evanescent wave, TIRF microscopy is only suitable for exciting fluorescent samples within a depth of ∼200 nm from the interface.371,377 Thus, TIRF largely reduces the thickness of the excitation plane and improves the image contrast significantly with respect to wide-field imaging (Figure 22). Combined with ultrasensitive and fast detectors, TIRF microscopy has empowered researchers to visualize biological events occurring on the plasma membrane of living cells.380 It is also possible to adjust the excitation beam such that it impinges on the sample just below the critical angle. The excitation beam then propagates into the sample at an inclined angle, which has the rough effect of only exciting a thin plane in the sample.381 This technique, known as highly inclined and laminated optical sheet microscopy (HILO) or affectionately as poor man’s TIRF, allows TIRF-like measurements to be performed internally in the cell.
Figure 22.

Live cell imaging of individual HIV-1 assembly sites. HeLa cell transfected with a mixture of pCHIV and pCHIVeGFP imaged at 25 h post transfection (a) in WF and (b) in TIRF mode. The scale bar represents 5 μm. Adapted with permission from ref (370). Copyright 2009 Public Library of Science.
Nowadays, most common SVT set-ups perform TIRF excitation by means of objective-based TIRF. In this configuration, it is easy to switch between wide-field to TIRF illumination modalities, even on a frame by frame basis.370 TIRF microscopy is powerful for investigating dynamics at the plasma membrane, such as clathrin-mediated endocytosis of VSV134 and the fusion event between viral and cellular membranes.382 A combination of TIRF microscopy and SVT identified different motional modes of MPV-like particles (VLPs) on the cell surface, and the particle trajectories provided new insights into the lateral mobility of membrane components and the heterogeneity of the plasma membrane.139
5.3. Confocal Microscopy
Marvin Minsky developed and patented the concept of confocal microscopy in the late 1950s with the aim of performing microscopy in thick tissues such as the brain. The basic principle of confocal microscopy is to use point illumination and a pinhole before the detector to eliminate the out-of-focus signals. For details regarding confocal microscopy, we refer the readers to ref (383). The excitation pinhole and the detection pinhole are both mounted in image planes of the microscope, thus “con-focal”. In this way, only the fluorescence from the focal plane reaches the detector. This microscopy modality has a thinner depth of field and higher resolution compared to wide-field microscopy. One of the demands that Minsky had on confocal microscopy is that it could image in real time, which, according to Minsky, may have significantly delayed the acceptance of confocal microscopy.384 Shortly after the development of the confocal microscope, lasers were invented. Lasers had high enough energy densities to perform confocal microscopy and, as light coming from the laser is collimated, an excitation pinhole was no longer needed. In addition to the laser, the development of computers and imaging software contributed to the rapid development of confocal microscopy and became commercially available in the late 1980s. There are two types of confocal microscopes (Figure 23).385 The laser-scanning confocal microscope (LSCM) scans the sample point-by-point. The sample can be scanned, typically using a piezo stage, or the excitation beam can be scanned using galvanometer mirrors (and nowadays also with resonant scanners) that can be used to increase the scanning speed. In either case, data is collected one pixel at a time and, even when the scanners have sufficient speed for imaging, one is often limited by the number of photons available per pixel. Thus, the typical image speed of a LSCM is limited to a couple of images per second and not suitable to track the dynamic behavior of quickly moving biomolecules in live cells. The second approach is to scan multiple volumes simultaneously, and a first apparatus was already built in the late 1960s.386 This is done using a Nipkow disk and is referred to as spinning-disk confocal microscopy (SDCM).385 The sample can be excited by multiple points simultaneously in the focal plane and an area detector such as an EMCCD can be used to collect the detected signals. SDCM and similar approaches can significantly improve the imaging speed. Thus, SDCM has become an indispensable tool for investigating the dynamic events of biomolecules in live cells. Furthermore, combining SDCM with a fast piezo z-scan device allows recording of fast three-dimensional images and has been used for 3D single-virus tracking in live cells.387,388
Figure 23.

Schematic drawing of (a) a laser scanning confocal microscope and (b) a spinning disk confocal microscope.
5.4. Light Sheet Microscopy
To obtain cellular resolution imaging in intact or in vivo tissues, imaging methods must achieve optical sections of the tissue. Since single-particle experiments are extremely sensitive to background fluorescence and photobleaching, optical sectioning schemes such as TIRF and confocal microscopy have already been widely used for single-particle tracking in live cells. Owing to the limited imaging depth of TIRF, it is not suitable for single-particle tracking in extended 3D samples. Confocal microscopy has limitations in speed when used for 3D volumetric imaging. In addition, a good portion of the sample is always illuminated during confocal microscopy leading to photobleaching of the sample even out of the focal plane. To avoid this difficulty and to allow SVT in large biological objects in three dimensions, light sheet microscopy has been introduced. In light sheet microscopy (LSM), a focused thin plan of light is used to illuminate the sample and the emission light is collected orthogonally with a standard microscope objective and imaged.389−391 The 3D volumetric image can be obtained by moving the coaligned excitation and detection plane relative to the sample.392 Thus, compared with confocal microscopy, LSM is able to image thicker tissues (>1 cm) and has already successfully been utilized to image complex organisms at single-cell resolution in three dimensions, e.g. embryos of C. elegans, zebrafish, Drosophila, and even mouse embryos.393−396 In addition, the plane that is illuminated by the light sheet is in the focal plane for detection and out-of-focus regions are not illuminated.
As the infection of viruses occurs in intricate 3D environments, the viral infection behavior exhibits diversified patterns in vivo, and consequently, the advent of light sheet microscopy will provide new insights regarding virus infection in living biological specimens.397 Recently, inspired by LSM, Bosse and colleagues developed what they called a “Ring light sheet” and used it to reveal the remodeling of the nuclear architecture upon infection with herpes simplex virus allowing the nuclear herpes virus capsids to reach the nuclear membranes by diffusion.398 Benefiting from the high spatiotemporal resolution provided by LSM, the tracking of rapid nuclear particle motility could be realized. The findings settled the question of how herpes virus capsids egress from the nucleus and illustrated a pathway for very large nuclear particles to cross the nuclear space by remodeling of the nuclear structure. Hoyer et al. developed a plane-scanning reversible saturable/switchable optical transitions light-sheet nanoscope (RESOLFT), which circumvents the diffraction limit of the light sheet fluorescence microscope in the axial dimension.399 It is believed that this charming microscopy will spark enormous interest notably in virus research because it is suitable for long-term three-dimensional imaging at high spatiotemporal resolution in living biological specimens.
5.5. SPT-PALM
In this review article, we have not discussed much about super-resolution microscopy in respect to SVT studies. One the one hand, viruses, being often slightly smaller than the diffraction limit, are excellent objects that profit greatly from the increase produced in resolution by super-resolution techniques. As such, super-resolution methods will play an important role for viral studies. For example, PALM229/stochastical optical reconstruction microscopy (STORM)400 microscopies were utilized to define spherical assembly sites of HIV (∼130 nm) in fixed cells, which is consistent with the size of mature virion particles232,401−403 and to investigate the structure of the endosomal sorting complex required for transport (ESCRT) complex involved in the release of HIV.404,405 On the other hand, SVT is, in a sense, a super-resolution technique as we are following a single object with nanometer spatial resolution. Thus, traditional SVT methods are more than sufficient for “super-resolution” tracking of individual viruses without the complications of the various super resolution methods, which typically have a low temporal resolution, have a high optical toxicity, and require heavy postacquisition processing. However, it should be noted that in recent years, super resolution techniques have already expanded to allow multicolor, three-dimensional single-particle tracking experiments in live cells.406,407
The one super-resolution approach that is of interest for SVT is SPT-PALM. By combining SPT and PALM, individual molecules present at high density can be tracked in live cells. In SPT-PALM, a small number of molecules are photoactivated in a live cell and followed using SPT. As the molecules are only sparsely activated, they can be easily tracked. After the molecules photobleach, new molecules can be photoactivated and tracked. SPT-PALM provides a large quantity of single-particle trajectories, though they are often very short due to the limited photostability of the photoactivatable FPs used for SPT-PALM. This technique has been successfully utilized to characterize the dynamics of biomolecules in a wide range of biological systems.408−410 With respect to SVT, SPT-PALM has been used to track VSVG tagged with EosFP, providing several orders of magnitude more trajectories per cells as compared to traditional SVT methods. Thereby the authors could generate a spatially resolved map of single-molecule motility within the cell provided information regarding the heterogeneity of the cellular environment (Figure 24).235
Figure 24.

SPT-PALM imaging of VSVG in COS7cells. (left) PALM image of VSVG tagged with EosFP. (middle) All SPT-PALM trajectories of localized VSVG molecules. (right) Diffusion map of individual EosFP-VSVG molecules in the cell. Adapted with permission from ref (235). Copyright 2008 Springer Nature.
Unfortunately, owing to the poor photophysical properties of autofluorescent proteins, the trajectories of molecules are very short and the localization accuracy is much lower in SPT-PALM experiments. The acquisition time also has a strong influence on the localization accuracy of particles, which is associated with several factors such as imaging modality, brightness of the tags, detector sensitivity and speed, etc. Thus, this technique is much more suited for detecting slow-diffusion events.
5.6. Orbital Tracking
Up until now, all tracking methods that we have been discussing involve ex post facto tracking. Movies are recorded in 2 or 3D and the tracking is performed afterward. These methods are mainly based on modified standard microscopes and achieve subpixel localization accuracy by 2D Gaussian fitting algorithm and 3D resolution using, for example, biplane411 or multifocal plane detection,54−56 a double-helix point spread function,412−414 or astigmatic imaging.415,416 Thanks to the emergence of spinning-disk confocal microscopy with high temporal resolution, it is also easy to implement z-stack imaging on a commercial confocal microscope.417 A distinct advantage of the image-based approaches is that many fluorescent particles can be tracked at the same time. However, these methods have a lower temporal resolution.
There is a second class of SPT methods that track single particles in real time using a feedback loop. This includes arranging four detection volumes in a tetrahedral geometry for locating the particle, championed by Werner,418 a guided confocal microscope using prisms (for lateral tracking) and a pinhole (for axial tracking) from Yang,419 or the newly developed MinFlux approach from Hell.420 We utilize the orbital tracking approach proposed originally by J. Enderlein in 2000 to monitor fluorescent molecules motilities within a 2D membrane421 and first realized in 2D and 3D by Gratton et al. in 2003.57 In the orbital tracking approach, the laser beam is orbited in a circular path around the fluorescent particle. When the particle is in the center of the orbit, the fluorescence intensity will stay constant throughout the orbit. When the molecule moves from the center of the orbit, the fluorescence signal will modulate with the orbit and the x-y position can be obtained from the phase and the modulation of the periodic fluorescence signal using a fast Fourier transform.422 For determining the z-position of the fluorescent particle, the difference is taken of the fluorescence intensity between two different z-planes separated by approximately half the axial width of the point-spread function. The localization method is fast and can be utilized in a fast feedback mechanism where the orbit is recentered on the fluorescent particle and the location of the particle is written to disk. Thus, this approach allows us to track individual particles in three dimensions in real time.58,423,424 The orbiting tracking system was used to monitor the assembly and egress of the matrix protein of Ebola virus. The researchers found that the actin coordinates the movement and assembly of VP40, a critical step in viral egress.213
Recently, Lamb et al. utilized a 3D orbital tracking microscope to track individual mitochondria in zebrafish embryos with nanometer precision and millisecond temporal resolution (Figure 25).425 This demonstrates the possibility of following individual objects with high precision in living organisms. With respect to SVT, the uptake and transport of artificial viruses has also been followed using orbital tracking.426 Orbital tracking exhibits several distinct advantages compared with image-based approaches. First of all, it has a very high spatial and temporal resolution (2–50 nm and 1–32 ms). Second, the fast Fourier transform as the localization algorithm is not sensitive to background noise and a single particle can be tracked in a scattering environment, although with a slightly lower precision. The main drawback of the orbital tracking approach is that it is not suitable to simultaneously tracking multiple particles in live cells. When particles are moving slowly, multiplexing can be performed, but in general, the approach only tracks one particle at one time. Thus, this approach is not convenient for collecting a high amount of statistics for rare events. On the other hand, as one is following the particle, one has the ability to measure various properties of that particle (e.g., spectra or lifetime427) or to photoactivate or manipulate that particle. In addition, the trajectory is written directly to disk in real time, which allows one to skip analysis steps 6.1 and 6.2 in the following section.
Figure 25.

3D orbital tracking. (a) Light microscopy transmission image of a zebrafish embryo and a zoom in on the tail with a typical Rohon–Beard neuron labeled by a membrane-targeted fluorescent protein (shown in yellow). (scale bar, 200 μm). (b) Schematic of the custom-built 3D real-time orbital tracking microscope consisting of a laser scanning confocal modality for tracking and a wide-field modality for simultaneous environmental observation. (c) (Upper image) Confocal reconstruction of a sensory neuron where both the membrane and the individual mitochondria are fluorescently labeled (scale bar, 100 μm). (Lower Image) Photoactivation of a single PA-GFP-labeled axonal mitochondrion (in yellow) (scale bar, 5 mm). (d) Schematic representation of the 3D orbital tracking approach. Different particle locations are indicated through spheres of varying color. Depending on the location of the particle, the phase and modulation of the signal vary. (e) Trajectory of an anterograde moving mitochondrion (100 Hz, 20,000 data points). (f) Autocorrelation carpet (top) of the angle between consecutive orbits and segregation of the trajectory into regions of directed transport (green) and stationary phases (red). Adapted with permission from ref (425). Copyright 2019 ELife Sciences Publications.
6. Data Analysis
The goal of SVT experiments is to quantitatively assess the dynamic properties of viruses during the infection process. After being able to fluorescently label the molecules and follow them using various SVT methods, the crucial procedure becomes how to extract the dynamic information from a time-series of diffraction-limited images of viruses acquired by fluorescence microscopy. For data analysis, the essential steps are to obtain the localization of each particle with subdiffraction resolution and then reconstruct single-virus trajectories by connecting the particle positions in each frame (Figure 26).428−430 In this part, several advanced algorithms have been developed to perform precise and accurate localization and unbiased tracking.365,431,432
Figure 26.

Schematic representation of single-virus tracking. (a) Time-series of images acquired using fluorescence microscopy. The optical spatial resolution is about 250 nm in the lateral direction and about 500 nm in the axial direction, although the localization of the particle can be determined with much higher precision. (b) Steps in SVT analysis. From the collected images, the location of the different particles is first determined, and then the same particle needs to be linked through the different frames. Once the trajectories have been determined, various analyses can be performed such as a mean-squared-displacement analysis.
Once the trajectories have been determined, various analyses can be performed to uncover the underlying biological mechanisms in live cells. Generally, to interpret and classify the dynamics of viral behavior, the mean-square displacement (MSD) curves are calculated and fitted to models according to different types of movements.270,433 The dynamic parameters obtained from curve fitting can be used to classify the types of the motional behaviors. As the type of motional behavior can also change, the instantaneous dynamic parameters (such as instantaneous speed and intensity) are also considered.269
6.1. Particle Detection
In SVT experiments, the raw data obtained by the various microscopy methods is typically a time series of diffraction-limited images containing fluorescent particles. In each frame of the series, the blurred spots denote fluorescent particles. Upon detection of the individual particles, we would like to determine the location of the particle with high precision. With SPT, we typically know that the detected signal is coming from a single object. Hence, it is sufficient to locate the center of the diffracted limited spot or PSF, which can be done to a much higher precision than the width of PSF or diffraction limited resolution. To locate the center position, it is first important to understand the intensity profile of the PSF. The intensity of each particle is given by the convolution of the particle shape with the PSF. The 3D diffraction pattern of single particles can be described as a 3D PSF from the Born–Wolf model.434
where  ,
,  ,
,  , a/f = NA/n, ρ = r/a. a, f, and r are the
radius of the exit pupil, the focal distance of the objective, and
the radial coordinate, respectively, n is the refractive
index of the medium, λ is the wavelength of light, NA is the numerical aperture, J0(vρ) is the Bessel function of zero order, and A is the amplitude.435 Various
algorithms have been developed to detect the particle center, which
can be divided into two categories: geometric-based methods and PSF
fitting methods.
, a/f = NA/n, ρ = r/a. a, f, and r are the
radius of the exit pupil, the focal distance of the objective, and
the radial coordinate, respectively, n is the refractive
index of the medium, λ is the wavelength of light, NA is the numerical aperture, J0(vρ) is the Bessel function of zero order, and A is the amplitude.435 Various
algorithms have been developed to detect the particle center, which
can be divided into two categories: geometric-based methods and PSF
fitting methods.
The simple and most straightforward method is the centroid method, which finds the particle positions by calculating the intensity centroid of the bright region. It can be written as50
where xjik is the coordinate of the pixel in the x direction and Iijk is the intensity at the pixel (xijk, yijk, zijk). The formulas for the y and z centroid positions are analogous.
This method has the advantage that it is fast and easy to program. However, the obvious disadvantage of this method is that the localization accuracy is very sensitive to the background noise and the area selected region for the calculation.
Since the intensity of an object taken by a microscope can be described by PSF, PSF-fitting methods are widely used for particle localization. Hereinto, the Gaussian model is commonly used, since the Airy disk can be well approximated by the Gaussian distribution. In SVT, the most common fitting method is the Gaussian nonlinear least-squares fitting method. This method utilizes the iterative fitting to search for the parameters, which can minimize the weighted square error between the fit and the data.59
where (xf,yf, zf) is the actual position of the particle. Sx, Sy and Sz are the widths of PSF in the x, y, and z directions, respectively. A and B are the amplitude and background noise, respectively.436
The Gaussian nonlinear least-squares fitting method possesses very high localization accuracy and has been widely used in localization-based super-resolution techniques such as STORM and PALM.432,437 However, this approach is very computationally expensive and not well suited for the large data volumes analyzed in 3D SPT. In addition, initial values are required to be set before Gaussian fitting, which can be very tedious, and inappropriate values can lead to a local minimum or, in the worst case, cause the calculation to crash.
The radial symmetry approach, as a new-type geometric-based method, has been proposed for localizing particle centers with subpixel resolution.435,438 This method utilizes the fact that the gradient line at each pixel surrounding the signal from a single particle in a 2D or 3D image should theoretically intersect the true center of the fluorescent particle. Considering the influence of background noise and optical aberrations, the gradient lines do not intersect and the center of the particle is estimated by selecting the point that minimizes the distance to all gradient lines. This method has no need for iterative, numerical fitting steps, so the computation speed of the method is about 2 orders of magnitude faster than that of the Gaussian fitting method and similar to that of the centroid method. Also, the radial symmetry approach has low edge sensitivity and subpixel accuracy, similar to that of the Gaussian nonlinear least-squares fitting method (Figure 27).435 These features make our algorithm an intensely competitive method for 3D SPT applications.
Figure 27.

Detection of the accurate position of particles with subdiffraction resolution. (a) Image generated by sampling the point spread function (PSF) of wide-field microscopy on a 3D grid with a lattice size of 20 nm. (b) 3D CCD image simulated from the PSF image (a) with a signal-to-noise ratio of 20. The blue crosses indicate the true center of the 3D particle. (c) 3D scatter plots of the errors illustrating the error ranges of the centroid (green), Gaussian fitting (blue), and radial symmetry algorithm (red), respectively. Adapted with permission from ref (435). Copyright 2013 Springer Nature.
6.2. Particle Linking
Once particles have been detected in the individual frames of a movie, the next step is to connect the localizations coming from the same particle from frame to frame and thereby reconstruct the particle trajectory. For data collected at low particle density, the nearest-neighbor algorithm is frequently used to identify localizations coming from the same particle in different frames. For each particle, the distances to all positions in the next frame are calculated and the minimum distance is taken as the most likely position for the same particle in the successive frame. These two positions are linked together. This procedure is repeated to link positions for as many particles in as many frames as possible and thereby obtain the entire trajectories for all the particles.439 However, to achieve this last step, the tracking algorithm has to overcome a lot of difficulties such as temporary particle disappearance, particle merging, and particle splitting. Thus, the results acquired from this algorithm are not very reliable and usually require additional input.440,441 In addition, it is always advisible to visually check the calculated trajectories and to manually correct them if necessary.
At high particle density, the occurrence of the interactions between particles greatly increases the difficulty of particle linking and makes the nearing-neighbor algorithms unsuitable for automatically reconstructing trajectories. Many algorithms have been developed to address tracking at high density and deal with the challenges caused by particle disappearance, merging, splitting, etc. Multiple-hypothesis tracking (MHT) is one of the most accurate methods to solve these problems.442 All the trajectories are simultaneously constructed for the entire movie. An optimization strategy is used to select the largest nonconflicting ensemble of trajectories where no two trajectories share the same position in any frame. This method is globally optimal in both time and space, but algorithms with high computational efficiency are required to just track a few tens of particles in a few tens of frames simultaneously. Therefore, several schemes have been developed to approximate the MHT solution.53,443−445 It is worth mentioning that Jaqaman et al. have provided a robust tracking algorithm for SPT under high-density conditions that can solve all the challenges mentioned above with high accuracy and computational feasibility. Based on one mathematical framework, this method initially links the detected positions in successive frames and then connects track segments to close the gap and detect merge and split events (Figure 28).446
Figure 28.

CD36 receptor aggregation activity depending on motion type. (a) Epifluorescence image of a macrophage where CD36 has been immunolabeled using a primary Fab fragment followed by a Cy3-conjugated secondary Fab fragment. (b) CD36 tracks in a control macrophage. (c and d) CD36 tracks in (c) a blebbistatin-treated and (d) a nocodazole-treated macrophage. Scale bars, 1 μm. (e) Bar plot showing the fraction of particles undergoing linear motion. (f) x coordinate, y coordinate, and amplitude of two sample trajectories as a function of time where merging events (green ovals), splitting events (purple ovals), and closed gaps (orange ovals) have been highlighted. Adapted with permission from ref (446). Copyright 2008 Springer Nature.
6.3. Trajectory Analysis
Once the individual trajectories have been collected, one can begin to extract the wealth of information such measurements provided. Some analyses are straightforward such as looking at colocalization and interactions between different cellular or viral components, or measuring the kinetics of viral assembly via the increase and saturation in fluorescence intensity. As mention in section 3.1.2, fluorescence intensity can also be used as a reporter of membrane fusion, especially when lipophilic dye-labeled viruses are used. Thus, the intensity vs time plot displays a distinct increase after fusion events.68
Other analyses can be performed to gain information with respect to the motional behavior of the viruses or viral components. The diffusion coefficient is determined by analyzing the mean square displacement (MSD), which is a measure of the spatial extent of random motion. The MSD is defined as
where r(Δt) is the particle position at the time point of Δt, Δt is the acquisition time of each frame, N is the total frames for the particle trajectory, and n and i are integers.269,447,448
How the MSD depends on the time lag (nΔt) depends on the motional behavior of the particle. For Brownian motion, the MSD depends linearly on the time lag:12,449
where d is the space dimensionality and D is the diffusion coefficient. Hence, the diffusion coefficient can be determined from the slope of the MSD plot.
Pure random or Brownian motion is the simplest type of stochastic process. However, the cell is a crowded heterogeneous environment where many interactions can potentially happen.12,17 In such a heterogeneous environment, particles often display anomalous diffusion. The relationship between MSD and nΔt for anomalous diffusion is given by
where α is anomalous diffusion exponent (α < 1).
Another type of motion that is often observed in live cells is confined diffusion. In confined diffusion, there is Brownian motion inside an enclosed environment from which the particle cannot easily escape. The dependence of MSD vs nΔt is related to the shape of the confined region and the spatial dimensionality. The formula of this type of motion in 2D for confinement in a square is given by
where L is the length of the side of the square.269,450,451
In live cells, viruses are often transported along the cytoskeleton. The cytoskeleton, such as microfilaments and microtubules, is the highway of the cells. Several molecular motors walk along the cytoskeletal filaments and transport their cargo. For directed motion with a diffusional component, the MSD is given by
where V is the constant velocity for directed transport.59 By fitting the MSD, the type of diffusional behavior can be determined as well other relevant information such as the diffusion coefficient, the velocity of directed transport, the size of confinement, or the degree of deviation from Brownian motion.
The MSD analysis is a statistical analysis and thereby very powerful but assumes the motional behavior is constant during the measurement. Often, viruses change their motional behavior, for example from 2D diffusion on the cell membrane to directed transport and then to 3D anomalous diffusion within the cytosol. In cases like this, the instantaneous speed of the particle is a useful way to characterize the transport behavior of the particle. It can clearly identify the obvious periods of directed transport of the particle and provide information on the types of motors involved in the transport process. Research has reported that the movements related to actin filaments have lower instantaneous speed in the range of 0.1–0.4 μm/s, and the instantaneous speeds associated with microtubules are one to several μm/s in live cells.97,130,452,453 The particles may experience several different motional modes in one trajectory. By means of the dependence of instantaneous speed vs time, the different motions from a trajectory can be distinguished and analyzed separately.
7. Viral Infection Mechanisms Revealed by Single-Virus Tracking
In the section below, we describe the current state of various applications of SVT in virology and elaborate the representative studies in detail to illustrate what information can be acquired and how SVT can be applied experimentally. The lifecycle of viruses, as obligatory intracellular parasites, is strongly coupled to interactions with the host cell. There are a number of processes that are needed for viral replication. The first encounter between viruses and host cells usually occurs via the attachment factors or receptors (such as a protein, an oligosaccharide, or a glycolipid, etc.) exposed on the cell surface. To overcome the barrier of the plasma membrane, numerous viruses hijack the endocytic pathway of host cells for internalization. Viruses are then trapped into membrane vesicles and transported to special regions for genome release. After the replication of viral components, new viruses are assembly and eventually egress to look for new cells to invade.454,455 There is an extensive amount of excellent work in the literature, and it is not possible to highlight all articles that have made significant contributions to the field or deserve special attention.
7.1. Virus-Receptor Interactions
For virus infection, viruses primarily binding nonspecifically to attachment factors on the cell surface and migrate along the cell surface until they recognize and bind to the specific receptors. The virus-receptor binding will activate the downstream signaling and trigger the internalization of viruses.3,5,454,456 The detailed processes of how viruses move on the cell surface to bind specific receptors is difficult to explore by conventional biochemical approaches. SVT can directly provide detailed kinetic information on this process and such studies have revolutionized our understanding of virus–receptor interactions.59,457
A recent study has highlighted the vital role of filopodia during virus infection.458 Filopodia are actin-rich bundles protruding from the plasma membranes and participate in probing the extracellular environment, promote cell motility, and facilitate cell-to-cell interactions. More and more pieces of research reported that filopodia were exploited during the initial step of virus infection and visualized movements of different viruses along filopodia.71,132,137,139,208,212,216 By tracking individual murine leukemia viruses (MLVs), the researchers found that MLV initially attached to the filopodia and underwent a rapid and actin-dependent lateral movement along the filopodia toward the cell body (Figure 29).208 Meanwhile, by monitoring the lateral motility of HPV on the cell surface, four modes of HPV mobility were discovered, and only the directed movement along actin protrusions (such as filopodia or retraction fibers) enhanced HPV infection.137 All these findings support the fact that viruses must bind to cellular receptors for promoting internalization into the cell body.
Figure 29.

Virus cell surfing along filopodia. (a) Individual murine leukemia virus (MLV) labeled with YFP (red) surfing along the filopodium of a HEK 293 cell transduced with mCAT-1-CFP (green). The time in the upper righthand corner is given in seconds, and the motion from two particles is summarized as white arrows in the right-most panel. (b) Image summarizing the overall movement of selected particles on filopodia of a single HEK 293 cell. (c) Thirty-one frames from a recorded movie superimposed to show the transport and photobleaching of MLVs during the SVT experiment (moving particles are highlighted in white). (d) To quantify virus cell surfing, the motility of 85 individual MLV particles was plotted over time where time point 0 represents the moment the virus attaches to a filopodium. Adapted with permission from ref (208). Copyright 2005 The Rockefeller University Press.
In addition, recent studies implied that viruses have different receptors for viral entry depending on cell types. The simultaneous tracking of ASLV and different receptors revealed that the infection efficiency was closely associated with the type of receptors the viruses bound to. Binding to lipid-anchored receptors may result in virus–cell membrane fusion where the genome is released into the cytosol. However, the transmembrane receptor accelerated virus uptake and provided a delay of the virus–endosome fusion event.155 As another example, sialic acids act as receptors for many viruses, including human and avian influenza viruses. Human and avian influenza viruses preferentially bind to sialic acid linked to galactose by α-2,6 linkage and α-2,3 linkage, respectively.459,460 The binding specificity of sialic acid receptors is an important barrier in cross-species transmission. SVT was utilized to explore the dynamic mechanisms of different receptors in live cells. These observations indicated that the infection behavior of viruses was determined by the transport behavior of the sialic acid receptors.112
7.2. Virus Internalization
To infect and replicate, viruses must enter the intracellular environment of the host cells. After viruses bind to the receptors on the cell surface, there are mainly two strategies for virus internalization: endocytosis-independent and endocytosis-dependent internalization. In the first strategy, viruses bind to the receptors on the cell surface and then directly fuse with the plasma membrane to enter the cell. It has been known that certain enveloped viruses, such as herpes simplex virus (HSV) and Sendai virus, are internalized into cells by fusing with the plasma membrane directly at neutral pH.454,461,462 It is considered an effective way for enveloped viruses to deliver viral genome into the cytosol. In this process, viruses first bind the specific receptors on the cell surface, which then promote the virus–membrane fusion event. On the other hand, endocytosis is hijacked by most viruses to enter the cells, which may occur via several different mechanisms, such as clathrin-mediated, caveolae-mediated, clathrin- and caveolae-independent endocytosis, and macropinocytosis.456,463,464
In the past, researchers investigated the endocytosis-dependent uptake of viruses by using conventional techniques such as TEM and inhibition experiments. A detailed understanding of the entry mechanisms and the dynamic processes involved in viral internalization is still lacking for most viruses. SVT has greatly contributed to our understanding of viral entry mechanisms in particular when combined with multicolor live-cell imaging. For example, by visualizing the interaction between the capsid of CPV and transferrin receptors on the cell surfaces, it became apparent that the interactions facilitate trapping of the viral capsid into clathrin-mediated endocytic structures by a rapid diffusion-based mechanism (Figure 30).142 By tracking the infection behaviors of influenza virus in living cells, the entry of influenza virus followed two distinct pathways: a clathrin-mediated pathway, and a clathrin- and caveolae-independent pathway.72 Simultaneous tracking of viruses and clathrin-coated pits indicate that most viruses promote the de novo formation of clathrin-coated pits around the viruses and exploit the clathrin-mediated pathway for virus internalization. In parallel, the remaining viruses enter the host cells by a clathrin- and caveolin-independent endocytic pathway with similar efficiency. Through the application of QD-based SVT and multicolor imaging, Pang’s lab revealed that dynamin is involved in the clathrin-mediated pathway of influenza virus uptake and participates in the maturation and membrane fission of clathrin-coated pits in this pathway.114 Macropinocytosis is usually considered as a nonspecific mechanism for virus entry. Several kinds of viruses have been reported to utilize macropinocytosis to infect the cells such as VV, HIV, and HSV.462
Figure 30.

Real-time imaging of clathrin-dependent CPV internalization. (a) Example of clathrin-dependent CPV endocytosis. Left panels, CRFK σ2-eGFP cells (green, AP-2) were inoculated with fluorescent capsids (red) and imaged as before. Right panel, diffusion path of the capsid shown at left. A color-coded line trace of the capsid diffusion path is overlaid onto the t = 51-s image. (b) Plot of the background-corrected AP-2 (green) and capsid (red) fluorescence intensities with respect to time for the event in panel a. For frames prior to pit initiation, the AP-2 fluorescence intensity was quantified at the eventual site of pit initiation. (c) Efficiency of clathrin-dependent CPV entry. (d) Examples of CPV dissociation from the cell surface. Time-lapse images showing the attachment (downward-facing arrows) of two capsids (red; no. 1, no. 2) and subsequent capsid dissociation (upward-facing arrows). (e) Residence time of CPV capsids that dissociated from CRFK cells. Adapted with permission from ref (142). Copyright 2012 American Society for Microbiology.
7.3. Virus Transport
As many viruses enter cells via an endocytosis pathway, they find themselves in intracellular vesicles and are transported to specific sites in the cell for genome release and replication. Endosomal transport along the cytoskeleton is assisted by several molecular motors including myosin, dynein, and kinesin. As a result, viral transport is a complex and multistep process, and viruses often follow several different pathways in the cytosol. With SVT, it is possible to monitor individual viruses in real time and dissect the infection behavior of each virus in living cells and thereby provide new mechanistic insights into the infection pathway of viruses. HIV has long been assumed to fuse at the plasma membrane and release the genome directly into the cytosol. However, by monitoring the early phase of viral infection, new evidence arose suggesting that the virus fused with endosomes in the cytosol of cells after receptor-mediated internalization (Figure 31).83 Furthermore, Cui et al. demonstrated that HIV was endocytosed and translocated into endosomes in a clathrin- and actin-dependent manner in macrophages and the viral core was released into the cytoplasm by endosomal fusion.157
Figure 31.

Identification of HIV-1 fusion sites by single-virus imaging. (a) Schematic presentation of redistribution of viral lipid and content markers upon fusion with a plasma membrane (left) and with an endosome (right). Viruses colabeled with membrane (red) and content (green) markers are pseudocolored yellow. (b and c) Partial fusion of JRFL with the plasma membrane of TZM-bl cells. The time from the beginning of imaging is shown. The two-dimensional projection of the particle’s trajectory (cyan) is overlaid on the last image. Changes in fluorescence intensities (in arbitrary units) of membrane (red) and content (green) markers, as well as the instantaneous velocity (blue trace) of the particle, are shown. Adapted with permission from ref (83). Copyright 2009 Elsevier.
There is plenty of evidence from SVT experiments that many viruses are transported in the cytosol in an actin filament- and microtubule-dependent manner, and microtubules assist viruses to move from the plasma membrane to the perinuclear region. This phenomenon has been reported for several kinds of viruses, including influenza virus,68,108 DENV,75,162 and adenovirus.70,465 Viral transportation is a highly regulated process in live cells. For example, SVT results indicated that influenza viruses follow a five-stage process during trafficking inside the cell: viruses attach to the cell surface initially, move slowly along the actin filaments in the cell periphery, and travel rapidly toward the cell nucleus in a microtubule-dependent manner, followed by interacting and fusing with late endosomes for genome release.108 Furthermore, the transport behavior of influenza viruses in the cytosol could be influenced by the microtubule structures. The microtubule configuration influences the destiny of individual viruses during viral transport in living cells.110 QDs-based SVT and multicolor imaging illustrated that the retrograde motor proteins, myosin VI and dynein, were responsible for the seamless transport of viruses from microfilaments to microtubules during virus transport.118 3D tracking of influenza virus demonstrated that the distinct transport behaviors of viruses were associated with early and late endosomes, and the transition from early to late endosomes occurred in the perinuclear region.111 Multicolor tracking of individual viruses and autophagosome provided an unambiguous dissection of the autophagic trafficking of viruses. Roughly one-fifth of the viruses found to enter the host cells did so through the autophagic pathway. The results provided dynamic and distinct insights into the relationship between autophagy and virus entry.115
7.4. Fusion and Genome Delivery of Viruses
After viruses are internalized into cells, the viral genome needs to be released into the cytosol for replication. Enveloped viruses usually enter cells via endocytosis, which has the advantage that they can easily be transported toward the nucleus, but they need to find a way to escape the endosomes. The fusion proteins of most viruses are commonly activated under acidic pH. For instance, in late endosomes, the acidic environment induces a conformational change in the hemagglutinin, a fusion protein of influenza viruses, which mediates virus–endosome fusion for genome release.466 Of course, not all viruses undergo pH-dependent release; nonenveloped viruses can escape the endosome for genome release through a fusion-independent manner and even for enveloped viruses. There are several pH-independent pathways and the molecular mechanisms underlying this portion of the virus life cycle remain only partially understood.
Some viruses fuse directly at the plasma membrane or can fuse either with the plasma membrane or with endosomes. Prototype foamy virus is thought to enter via both pathways. Using a dual-labeled variant of PFV, Lindemann and co-workers could visualize the fusion event in real time. Here, the envelop protein was labeled with mCherry and the capsid with eGFP. Before fusion, the virus was observable in both the eGFP and mCherry channels. Upon fusion, the eGFP from the capsid was observed to separate from the mCherry signal and was then transported into the cytoplasm (Figure 32).467
Figure 32.

Fusion of PFV. (a) Bright field image of a cell overlaid with the trajectory of a dual-color PFV virus during fusion at or near the plasma membrane. The dual-color signal is shown in yellow and the single-labeled capsid in green. (b) Tracking image correlation (TrIC) analysis of the fusion event observed in panel (a). (upper panel) The fluorescence intensity of the Gag-eGFP signal (green) and mCherry-Env (red) signal, (second panel) instantaneous velocity, (third panel) cross-correlation amplitude (blue) and randomized cross-correlation signal (black), and (lower panel) relative distance between the Gag-eGFP and mCherry-Env signals plotted as a function of time. (c) 3D relative trajectory of the Env-labeled envelop with respect to the Gag-capsid showing movement in the order of hundreds of nanometers between the two labels before the completion of the fusion process. Adapted with permission from ref (467). Copyright 2013 Elsevier.
By virtue of multicolor labeled HIV viruses, Melikyan et al. found that complete viral fusion occurred in endosomes and not at the plasma membrane.83 By labeling HIV integrase, Charneau and co-workers showed that cytosolic HIV complexes moved directly toward the cell nucleus in a microtubule and actin-dependent manner, then docked near the nuclear membrane, and eventually diffused inside the nucleus.87 In the case of PV, time-lapse imaging analysis indicated that the virus enters the host cell via a tyrosine- and actin-dependent endocytic pathway, and the genome release of PV occurs in the endosomes near the plasma membrane.131 This result settled a long-lasting debate regarding where PV releases its genome.
SVT measurements of the dynamic uncoating of individual influenza viruses indicated that approximately 30% of influenza virus particles undergo uncoating through fusion with late endosomes. After viral fusion and uncoating, vRNPs are released separately into the cytosol and, following a three-stage transport process, reach the vicinity of the cell nucleus. Visualization of the intranuclear dynamic behavior of the vRNPs revealed two diffusion patterns within the nucleus. Thus, SVT significantly contributed to our understanding of the uncoating and vRNP trafficking mechanisms of influenza virus (Figure 33)113 in particular and is helping to disperse the enigma of genome delivery in general.
Figure 33.

Real-time imaging of vRNP of influenza A viruses (IAV) release from a Rab7-positive endosome. (a) A fluorescence movie of a cell containing QD625-labeled influenza viruses (red) and Rab7-ECFP labeled endosomes (cyan) was recorded and SVT was performed. (b) Trajectories of the QD-labeled influenza virus colocalizing with the fluorescently labeled endosome from panel a. (c) Fluorescence image of an infected cell treated with NH4Cl. (d) Trajectories of the QD625 and ECFP fluorescent signals in NH4Cl-treated cells. (e) Model for IAV uncoating and vRNP dynamics. An IAV virion enters the host cell via endocytosis. Individual vRNPs finally undergo a three-stage active transport process to arrive at the cell nucleus and display two diffusion patterns within the nucleus. Adapted with permission from ref (113). Copyright 2019 National Academy of Sciences, U.S.A.
Furthermore, the viral genome of influenza virus is generally replicated in the cell nucleus and exported to the cytosol as vRNPs and transported to the plasma membrane for virus egress with an uncertainty.468,469 Live-cell tracking of fluorescent vRNPs showed that the cytoplasmic vRNPs accumulated in the recycling endosome vesicles with a Rab11 and microtubule-dependent manner470,471 and in the vRNP/Rab11 hotspots.
7.5. Assembly and Egress of Viruses
After genome replication and protein synthesis, the goal of virus infection is to assemble and release progeny virus particles. The newly synthesized components are transported to a specific site for virus assembly, and the progeny viruses can be released from the host cells by a variety of mechanisms such as exocytosis, lysis of the cell, or budding from the plasma membrane. Compared to virus entry and transport processes, it is more challenging to investigate the dynamic mechanisms of virus assembly and egress since it is hard to label newly synthesized viral components with fluorescence. Here, FP-labeling of individual components is powerful and, with labeled constructs, fluorescence fluctuation spectroscopy can play an important role where the motional behavior of a small number of proteins can be analyzed to gain insights into mobility and interactions between viral components or between virus and cellular components. Hendrix and co-workers used a number of correlation methods to elucidate the early cytosolic steps in HIV assembly.472 Nevertheless, there are also situations where SVT can be used to elucidate the molecular location, dynamics, and mechanisms during viral assembly and egress.473
Many enveloped viruses such as HIV are assembled and released from the plasma membrane of the host cell by the abscission of the viral envelope.474 The Gag proteins of HIV are necessary for the assembly and release of virus particles. Time-lapse imaging showed that HIV Gag is initially distributed in the perinuclear region of the cytosol and then travels to the plasma membrane.475 Using the photon counting histogram approach as well as a quantitative PALM analysis, the size and density of the HIV-Gag cluster during the assembly of virions could be calculated.476−478 To investigate the dynamic process of HIV genome packaging, HIV RNA was labeled with a photoconvertible Eos protein. TIRF imaging results indicated that the presence of the Gag protein distinctly increased the dwell time of HIV RNA near the plasma membrane.479 Furthermore, simultaneous measurement of F-actin and HIV particles revealed that there is no characteristic pattern nor transient recruitment of F-actin during the viral budding process. The result demonstrated that the actin filaments-dependent transport pathway was dispensable for HIV Gag assembly on the plasma membrane.480 By combining wide-field and TIRF microscopy, the assembly of the HIV protein shell was observed within ∼8–9 min after nucleation of an assembly site and virus particles were formed individually. HIV release occurred ∼25 min after nucleation of the viral assembly site.370 Moreover, the transient recruitment of the ATPase VPS4 (vacuolar protein sorting 4) to nascent HIV particles at HIV budding sites on the host cell plasma membrane was observed before viral release, indicating that VPS4A played a distinct role in membrane scission for HIV-1 release (Figure 34).481
Figure 34.

Recruitment of VPS4A to HIV assembly sites. (a) Wide-field image and time projections (5,926 s) from a TIRFM image series exemplifying frequent colocalization of eGFP-VPS4A bursts (green) with nascent HIV particles (magenta). (b) TIRFM images of the assembly and release of a HIV particle (top panel, arrows) and the corresponding eGFP-VPS4A channel (bottom panel, arrows). (c) Number of VPS4A bursts detected within 528 s (200 frames) in the presence of the indicated HIV derivatives (left) and number of HIV budding sites detected (right). (d) Wide-field image and time-projected TIRFM image of cells coexpressing eGFP-VPS4A (green) and the nonbudding HIV late minus mutant (magenta). All scale bars, 800 nm. Adapted with permission from ref (481). Copyright 2011 Springer Nature.
7.6. Cell-to-Cell Transmission of Viruses
Upon release of new viruses, the life-cycle continues with the infection of a new host cell. One mechanism for infection is cell-to-cell transmission. Nascent viruses reach a new host cell through direct cell–cell contacts, a pathway for infection that has been estimated to be 100–1000 times more efficient than the spread by cell-free dissemination.482,483 Significantly, this spread pathway is less susceptible to the external surroundings (e.g., neutralizing antibodies, antivirus drugs, etc.). Virological synapses,86,205,484 cell filopodia,208,212,458,485,486 and membrane nanotubes487−490 are three typical physical connections between cells which dramatically augment cell-to-cell transmission of many viruses. By means of SVT, the cell-to-cell transmission process can be visualized and the underlying mechanisms further uncovered by the dynamic evidence.
For instance, many viruses including HIV, HSV, and human T-lymphotropic virus (HTLV) tend to establish virological synapses between infected donor cells and uninfected target cells through cell-to-cell transmission.491−494 The direct translocation of HIV across the virological synapse was captured by continuous time-lapse monitoring of HIV. The dynamic information provided by quantitative, high-speed three-dimensional video microscopy indicated that HIVs dissemination between cells may be enhanced by virological synapse-mediated cell adhesion coupled with viral endocytosis.486 Additionally, retroviruses could establish filopodial bridges by connecting infected cells with noninfected cells, and virus particles budding from infected cells would move along the outer surface of the filopodial bridge toward noninfected cells.485 The whole process of transmission was visualized by SVT and clearly demonstrated that the cell filopodia could be exploited by retroviruses for the purpose of viral spread. Membrane nanotubes, as recently discovered membranous tethers between cells, facilitate direct intercellular communication, signaling, and the spread of pathogens.96,489,495,496 Compared with filopodial bridges, membrane nanotubes usually span over longer distances, which means that these structures can aid the spread of virus rapidly and efficiently. The movements of GFP-fused recombinant HIVs on nanotubes were recorded, indicating that the viruses moved along the nanotubes from the infected toward uninfected cell. The process of HIVs transported along membrane nanotubes was receptor-dependent with a speed of 0.08 ± 0.03 μm/s. The results showed that membrane nanotubes presented a novel route for the rapid spread of HIV between T cells (Figure 35).489
Figure 35.

Membrane nanotubes present a novel route for HIV-1 to spread between T cells. (a) Membrane nanotubes were formed after intercellular contact between an infected Jurkat T cell (red) and an uninfected Jurkat T cell. (b) The frequency of membrane nanotubes formed between uninfected and infected Jurkat T cells or between two populations of uninfected Jurkat T cells. (c) Time-lapse imaging of Gag-GFP (green), expressed in the context of the fully infectious virus, along a membrane nanotube connecting infected with uninfected Jurkat T cells (red). (d) The arrow indicates Gag-GFP within the cytoplasm of the initially uninfected T cell. (e) The position of Gag-GFP is plotted against time showing generally directed movement from uninfected to infected cells. Adapted with permission from ref (489). Copyright 2008 Springer Nature.
8. Conclusions and Perspectives
Single-virus tracking is a powerful tool for investigating complex dynamic processes of viruses and has become a standard lab technique now in the field of virology. The evolution and development of SVT in the past decades shed light on the mechanisms involved in the life-cycle of a variety of viruses including virus internalization, virus transport, genome delivery, and virus assembly. As an interdisciplinary technique, SVT required consecutive efforts from experts in chemistry, biology, virology, and physics. With the development of new fluorescent tags, better labeling strategies, and novel optical instruments, SVT is continuously undergoing rapid expansion. In this review, we have given practical considerations of how to perform SVT experiments in live cells, including the choice of fluorescent tags, labeling strategies, imaging instrumentation, and data analysis, and have demonstrated the power of SVT by mentioning a few applications.
SVT has been established nearly two decades ago, and this booming technique shows no signs of slowing down. However, there are still several issues that need to be ironed out for SVT in the future. First of all, the sizes of different kinds of viruses (10–300 nm) vary largely and fluorescent tags may impair the virus infectivity in varying degrees. To reduce the influence of fluorescent labeling, only a limited amount of fluorescent tags can be used to attach to the viral components. New organic dyes and FPs with better photophysical properties are being developed and will contribute to improve SVT. Even so, monitoring the viral infection processes continuously with high temporal resolution over the entire infection process remains a big challenge. QDs, with their excellent optical brightness and photostability, are a great option and have the potential of tracking the whole infection process of individual viruses in living cells. However, QDs also have some limitations such as their larger size, photoblinking, and potential interference with the functionality of the virus. Fortunately, in many cases, QDs have been shown to have minimal influence on the virus characteristics and do not affect the viral infectivity, although to what extent QDs labeling may affect the real behavior of viruses in living cells is unclear. SVT will certainly profit from the development of new-types of QDs with small size and nonblinking to circumvent these limitations.497−499 Smaller QDs will also most likely minimize any deleterious effects of the labeling process.
Second, the process of virus infection involves a vast number of interactions between host cells and viruses. Interactions often occurred between a small number of viral and cellular molecules. One of the future challenges will be visualizing these interactions. Here, multicolor labeling will be necessary. One possibility, as discussed above, is fluorescence fluctuation spectroscopy. A second approach is super-resolution imaging, which has developed extensively over the past ten years and allows researchers to delineate the cellular processes on the nanoscale.500 Super-resolution methods are commercially available and have pushed the optical resolution into the 20–100 nm range.230,501,502 This opens the avenue for investigating the virus infection mechanisms within a subcellular environment and with subviral resolution thereby making it possible to uncover the underlying mechanisms of virus infection. New imaging techniques are still in demand to combine single-virus tracking and super-resolution microscopy for capturing and quantitative understanding of the fundamental processes involved in virus infection at nanometer spatial resolution.
Lastly, single-virus tracking is currently only limited to investigations of the infection mechanism of viruses in cultured cells, which is a simplified model system. In vivo experiments are needed to fully comprehend the mechanisms of virus infection. By tracking individual viruses in live tissue and animals, it may be possible to dissect the processes involved in the cell-to-cell transmission of viruses and learn how viruses break through the defense barriers of the host. To date, several groups reported the noninvasive visualization of viruses in mice,503,504 but the real-time tracking of individual viruses in vivo still remains a challenge because of the limitations of current bioimaging techniques. Although optical microscopy has been a fundamental tool for biological researchers for more than three centuries, in vivo imaging is still restricted by light scattering. Recent advances in optical imaging techniques and in vivo microscopy allow images to be acquired at high resolution and unprecedented depths.505,506 Additionally, the use of near-infrared fluorescent tags allows researchers to enhance tissue penetration of light and minimize the interference of tissue autofluorescence in vivo.507−509 A series of near-infrared QDs were recently synthesized with an emission range from 800 to 1600 nm.244,510,511,512 Of particular interest are the ultrasmall near-infrared QDs with a size of ∼2 nm and low toxicity generated via quasi biosynthesis, for example by utilizing the GSH enzymatic pathway.245,246 Thus, enabled with these novel tools, new opportunities are becoming available for SVT to probe the dynamic interactions of viruses in vivo and thereby elucidate the mysteries of the infection processes.
Acknowledgments
This work was supported by the National Natural Science Foundation of China (Nos. 21535005, 21877102, 21977054, 91953107, and 21827808) and by the Ludwig-Maximilians-University Munich via the Center for NanoScience and the LMUInnovativ BioImaging Network.
Biographies
Shu-Lin Liu obtained her B.S. degree from Zhengzhou University (2007) and obtained her Ph.D. degree (2013) in Analytical Chemistry from Wuhan University. She worked as a postdoctoral researcher at University of Illinois at Chicago (2013–2017). After that, she worked as a professor at China University of Geosciences and now is a professor in Chemistry Department of Nankai University. Her research interests are mainly focused on single-virus tracking, lipid-mediated cell signaling, and developing new techniques for biological applications.
Zhi-Gang Wang received his B.S. degree (2005) and M.S. degree (2008) from the Department of Chemistry at Zhengzhou University. He obtained his Ph.D. degree (2014) in Analytical Chemistry from Wuhan University and finished his postdoctoral research at University of Illinois at Chicago during 2014–2017. Currently, he is an associate professor at School of Medicine, Nankai University. His main research interests include bioapplication of nanoparticles, single molecule/particle tracking, and signaling pathway and biosynthesis of QDs.
Hai-Yan Xie is a professor in the School of Life Sciences, Beijing Institute of Technology, China. She received her Ph.D. in Analytical Chemistry from Wuhan University in 2004. From 2013 to 2014, she worked as a visiting scholar in Stanford University. Her research focuses on the interdisciplinary work on biorthogonal chemistry, nanotechnology, and biomimetic biology for disease diagnosis and treatments.
An-An Liu received her bachelor’s degree from Nankai University in 2008 and her Ph.D. in analytical chemistry from Wuhan University in 2016. Then she carried out postdoctoral research on single molecule imaging at Kyoto University and Okinawa Institute of Science and Technology Graduate University in Japan. She joined Nankai University in 2019 as an assistant professor. Her research focuses on developing nanomaterials and nanoprobes for bioimaging.
Don C. Lamb is Professor for Biophysical Chemistry at the LMU Munich. He obtained his Ph.D. degree from the University of Illinois at Urbana–Champaign and was a research fellow at the Harvard Medical School, an Alexander von Humboldt Research Fellow at the TU Munich, a member of the Laboratory for Fluorescence Dynamics at the University of Illinois at Urbana–Champaign, and a visiting scientist at the University of Ulm. His research focused on ultrasensitive fluorescence methods, advanced microscopy methods, protein function and dynamics, fluorescence fluctuation spectroscopies, live-cell imaging, single particle tracking, single virus tracing, and DNA nanodevices.
Dai-Wen Pang graduated with a B.S. degree in chemistry from Wuhan University in 1982 and received his Ph.D. degree in electrochemistry from Wuhan University in 1992. He was a professor at Wuhan University from 1996 to 2018 and now is a distinguished professor at Nankai University. His research interest focuses on biomedical-used quantum dots (BioQDs, especially ultrasmall biocompatible NIR-fluorescent semiconductor nanocrystals), including space-time coupled living-cell synthesis of QDs, quasi-bio synthesis of QDs, single-virus tracking with QDs, photoluminescence mechanism of luminescent nanomaterials, and also backlight display with QDs. He was the Head of the Creative Research Group for Biomedical Probes of the National Natural Science Foundation of China (2006–2012) and 973 Chief Scientist appointed by the Ministry of Science and Technology of China for two projects of the National Key Scientific Program (2006–2015). He is now the Director of the Research Center for Analytical Sciences of Nankai University, member of the National Steering Committee for Nanotechnology, member of the Editorial Advisory Board of Analytical Chemistry, and Associate Editor for New Journal of Chemistry.
Author Contributions
# S.-L.L. and Z.-G.W. contributed equally to this work.
The authors declare no competing financial interest.
This article is made available for a limited time sponsored by ACS under the ACS Free to Read License, which permits copying and redistribution of the article for non-commercial scholarly purposes.
References
- Smith A. E.; Helenius A. How Viruses Enter Animal Cells. Science 2004, 304, 237–242. 10.1126/science.1094823. [DOI] [PubMed] [Google Scholar]
- Greber U. F.; Way M. A Superhighway to Virus Infection. Cell 2006, 124, 741–754. 10.1016/j.cell.2006.02.018. [DOI] [PubMed] [Google Scholar]
- Marsh M.; Helenius A. Virus Entry: Open Sesame. Cell 2006, 124, 729–740. 10.1016/j.cell.2006.02.007. [DOI] [PMC free article] [PubMed] [Google Scholar]
- Gruenberg J. Viruses and Endosome Membrane Dynamics. Curr. Opin. Cell Biol. 2009, 21, 582–588. 10.1016/j.ceb.2009.03.008. [DOI] [PubMed] [Google Scholar]
- Sun E.; He J.; Zhuang X. Live Cell Imaging of Viral Entry. Curr. Opin. Virol. 2013, 3, 34–43. 10.1016/j.coviro.2013.01.005. [DOI] [PMC free article] [PubMed] [Google Scholar]
- Pelkmans L.; Helenius A. Insider Information: What Viruses Tell Us about Endocytosis. Curr. Opin. Cell Biol. 2003, 15, 414–422. 10.1016/S0955-0674(03)00081-4. [DOI] [PubMed] [Google Scholar]
- Conner S. D.; Schmid S. L. Regulated Portals of Entry into the Cell. Nature 2003, 422, 37–44. 10.1038/nature01451. [DOI] [PubMed] [Google Scholar]
- Horan P. K.; Melnicoff M. J.; Jensen B. D.; Slezak S. E. Fluorescent Cell Labeling for in Vivo and in Vitro Cell Tracking. Methods Cell Biol. 1990, 33, 469–490. 10.1016/S0091-679X(08)60547-6. [DOI] [PubMed] [Google Scholar]
- Giepmans B. N. G. The Fluorescent Toolbox for Assessing Protein Location and Function. Science 2006, 312, 217–224. 10.1126/science.1124618. [DOI] [PubMed] [Google Scholar]
- Alcor D.; Gouzer G.; Triller A. Single-Particle Tracking Methods for the Study of Membrane Receptors Dynamics. Eur. J. Neurosci. 2009, 30, 987–997. 10.1111/j.1460-9568.2009.06927.x. [DOI] [PubMed] [Google Scholar]
- Cang H.; Shan Xu C.; Yang H. Progress in Single-Molecule Tracking Spectroscopy. Chem. Phys. Lett. 2008, 457, 285–291. 10.1016/j.cplett.2008.03.098. [DOI] [Google Scholar]
- Levi V.; Gratton E. Exploring Dynamics in Living Cells by Tracking Single Particles. Cell Biochem. Biophys. 2007, 48, 1–15. 10.1007/s12013-007-0010-0. [DOI] [PubMed] [Google Scholar]
- Shen H.; Tauzin L. J.; Baiyasi R.; Wang W.; Moringo N.; Shuang B.; Landes C. F. Single Particle Tracking: From Theory to Biophysical Applications. Chem. Rev. 2017, 117, 7331–7376. 10.1021/acs.chemrev.6b00815. [DOI] [PubMed] [Google Scholar]
- Xia T.; Li N.; Fang X. H. Single-Molecule Fluorescence Imaging in Living Cells. Annu. Rev. Phys. Chem. 2013, 64, 459–480. 10.1146/annurev-physchem-040412-110127. [DOI] [PubMed] [Google Scholar]
- Manzo C.; Garcia-Parajo M. F. A Review of Progress in Single Particle Tracking: from Methods to Biophysical Insights. Rep. Prog. Phys. 2015, 78, 124601. 10.1088/0034-4885/78/12/124601. [DOI] [PubMed] [Google Scholar]
- Miller H.; Zhou Z.; Shepherd J.; Wollman A. J. M.; Leake M. C. Single-Molecule Techniques in Biophysics: A Review of the Progress in Methods and Applications. Rep. Prog. Phys. 2018, 81, 024601 10.1088/1361-6633/aa8a02. [DOI] [PubMed] [Google Scholar]
- Wieser S.; Schutz G. J. Tracking Single Molecules in the Live Cell Plasma Membrane-Do’s and Don’t’s. Methods 2008, 46, 131–140. 10.1016/j.ymeth.2008.06.010. [DOI] [PubMed] [Google Scholar]
- Kusumi A.; Tsunoyama T. A.; Hirosawa K. M.; Kasai R. S.; Fujiwara T. K. Tracking Single Molecules at Work in Living Cells. Nat. Chem. Biol. 2014, 10, 524–532. 10.1038/nchembio.1558. [DOI] [PubMed] [Google Scholar]
- Kusumi A.; Shirai Y. M.; Koyama-Honda I.; Suzuki K. G. N.; Fujiwara T. K. Hierarchical Organization of the Plasma Membrane: Investigations by Single-Molecule Tracking vs. Fluorescence Correlation Spectroscopy. FEBS Lett. 2010, 584, 1814–1823. 10.1016/j.febslet.2010.02.047. [DOI] [PubMed] [Google Scholar]
- Kusumi A.; Fujiwara T. K.; Chadda R.; Xie M.; Tsunoyama T. A.; Kalay Z.; Kasai R. S.; Suzuki K. G. Dynamic Organizing Principles of the Plasma Membrane That Regulate Signal Transduction: Commemorating the Fortieth Anniversary of Singer and Nicolson’s Fluid-Mosaic Model. Annu. Rev. Cell Dev. Biol. 2012, 28, 215–250. 10.1146/annurev-cellbio-100809-151736. [DOI] [PubMed] [Google Scholar]
- Suzuki K. G.; Kasai R. S.; Hirosawa K. M.; Nemoto Y. L.; Ishibashi M.; Miwa Y.; Fujiwara T. K.; Kusumi A. Transient GPI-Anchored Protein Homodimers Are Units for Raft Organization and Function. Nat. Chem. Biol. 2012, 8, 774–783. 10.1038/nchembio.1028. [DOI] [PubMed] [Google Scholar]
- Zhang W.; Jiang Y.; Wang Q.; Ma X.; Xiao Z.; Zuo W.; Fang X.; Chen Y. G. Single-Molecule Imaging Reveals Transforming Growth Factor-Induced Type II Receptor Dimerization. Proc. Natl. Acad. Sci. U. S. A. 2009, 106, 15679–15683. 10.1073/pnas.0908279106. [DOI] [PMC free article] [PubMed] [Google Scholar]
- Kasai R. S.; Kusumi A. Single-Molecule Imaging Revealed Dynamic GPCR Dimerization. Curr. Opin. Cell Biol. 2014, 27, 78–86. 10.1016/j.ceb.2013.11.008. [DOI] [PubMed] [Google Scholar]
- Courty S.; Luccardini C.; Bellaiche Y.; Cappello G.; Dahan M. Tracking Individual Kinesin Motors in Living Cells Using Single Quantum-Dot Imaging. Nano Lett. 2006, 6, 1491–1495. 10.1021/nl060921t. [DOI] [PubMed] [Google Scholar]
- Nishikawa S.; Arimoto I.; Ikezaki K.; Sugawa M.; Ueno H.; Komori T.; Iwane A. H.; Yanagida T. Switch between Large Hand-over-Hand and Small Inchworm-Like Steps in Myosin VI. Cell 2010, 142, 879–888. 10.1016/j.cell.2010.08.033. [DOI] [PubMed] [Google Scholar]
- Pierobon P.; Achouri S.; Courty S.; Dunn A. R.; Spudich J. A.; Dahan M.; Cappello G. Velocity, Processivity, and Individual Steps of Single Myosin V Molecules in Live Cells. Biophys. J. 2009, 96, 4268–4275. 10.1016/j.bpj.2009.02.045. [DOI] [PMC free article] [PubMed] [Google Scholar]
- Liu S. L.; Wang Z. G.; Hu Y.; Xin Y.; Singaram I.; Gorai S.; Zhou X.; Shim Y.; Min J. H.; Gong L. W.; et al. Quantitative Lipid Imaging Reveals a New Signaling Function of Phosphatidylinositol-3,4-Bisphophate: Isoform- and Site-Specific Activation of Akt. Mol. Cell 2018, 71, 1092–1104. e5 10.1016/j.molcel.2018.07.035. [DOI] [PMC free article] [PubMed] [Google Scholar]
- Sheng R.; Chen Y.; Yung Gee H.; Stec E.; Melowic H. R.; Blatner N. R.; Tun M. P.; Kim Y.; Kallberg M.; Fujiwara T. K.; et al. Cholesterol Modulates Cell Signaling and Protein Networking by Specifically Interacting with PDZ Domain-Containing Scaffold Proteins. Nat. Commun. 2012, 3, 1249. 10.1038/ncomms2221. [DOI] [PMC free article] [PubMed] [Google Scholar]
- Komura N.; Suzuki K. G.; Ando H.; Konishi M.; Koikeda M.; Imamura A.; Chadda R.; Fujiwara T. K.; Tsuboi H.; Sheng R.; et al. Raft-Based Interactions of Gangliosides with a GPI-Anchored Receptor. Nat. Chem. Biol. 2016, 12, 402–410. 10.1038/nchembio.2059. [DOI] [PubMed] [Google Scholar]
- Liu S. L.; Wang Z. G.; Zhang Z. L.; Pang D. W. Tracking Single Viruses Infecting Their Host Cells Using Quantum Dots. Chem. Soc. Rev. 2016, 45, 1211–1224. 10.1039/C5CS00657K. [DOI] [PubMed] [Google Scholar]
- Brandenburg B.; Zhuang X. Virus Trafficking–Learning from Single-Virus Tracking. Nat. Rev. Microbiol. 2007, 5, 197–208. 10.1038/nrmicro1615. [DOI] [PMC free article] [PubMed] [Google Scholar]
- Huang L. L.; Xie H. Y. Progress on the Labeling and Single-Particle Tracking Technologies of Viruses. Analyst 2014, 139, 3336–3346. 10.1039/C4AN00038B. [DOI] [PubMed] [Google Scholar]
- Parveen N.; Borrenberghs D.; Rocha S.; Hendrix J. Single Viruses on the Fluorescence Microscope: Imaging Molecular Mobility, Interactions and Structure Sheds New Light on Viral Replication. Viruses 2018, 10, 250. 10.3390/v10050250. [DOI] [PMC free article] [PubMed] [Google Scholar]
- Axelrod D.; Koppel D. E.; Schlessinger J.; Elson E.; Webb W. W. Mobility Measurement by Analysis of Fluorescence Photobleaching Recovery Kinetics. Biophys. J. 1976, 16, 1055–1069. 10.1016/S0006-3495(76)85755-4. [DOI] [PMC free article] [PubMed] [Google Scholar]
- Simons K.; Gerl M. J. Revitalizing Membrane Rafts: New Tools and Insights. Nat. Rev. Mol. Cell Biol. 2010, 11, 688–699. 10.1038/nrm2977. [DOI] [PubMed] [Google Scholar]
- Magde D.; Elson E.; Webb W. W. Thermodynamic Fluctuations in a Reacting System-Measurement by Fluorescence Correlation Spectroscopy. Phys. Rev. Lett. 1972, 29, 705–708. 10.1103/PhysRevLett.29.705. [DOI] [Google Scholar]
- Hess S. T.; Huang S.; Heikal A. A.; Webb W. W. Biological and Chemical Applications of Fluorescence Correlation Spectroscopy: A Review. Biochemistry 2002, 41, 697–705. 10.1021/bi0118512. [DOI] [PubMed] [Google Scholar]
- Haustein E.; Schwille P. Ultrasensitive Investigations of Biological Systems by Fluorescence Correlation Spectroscopy. Methods 2003, 29, 153–166. 10.1016/S1046-2023(02)00306-7. [DOI] [PubMed] [Google Scholar]
- Berg H. C. How to Track Bacteria. Rev. Sci. Instrum. 1971, 42, 868–871. 10.1063/1.1685246. [DOI] [PubMed] [Google Scholar]
- Berg H. C.; Brown D. A. Chemotaxis in Escherichia Coli Analysed by Three-Dimensional Tracking. Nature 1972, 239, 500–504. 10.1038/239500a0. [DOI] [PubMed] [Google Scholar]
- Barak L. S.; Webb W. W. Diffusion of Low Density Lipoprotein-Receptor Complex on Human Fibroblasts. J. Cell Biol. 1982, 95, 846–852. 10.1083/jcb.95.3.846. [DOI] [PMC free article] [PubMed] [Google Scholar]
- De Brabander M.; Geuens G.; Nuydens R.; Moeremans M.; De Mey J. Probing Microtubule-Dependent Intracellular Motility with Nanometre Particle Video Ultramicroscopy (Nanovid Ultramicroscopy). Cytobios 1985, 43, 273–283. [PubMed] [Google Scholar]
- Lee G. M.; Ishihara A.; Jacobson K. A. Direct Observation of Brownian Motion of Lipids in a Membrane. Proc. Natl. Acad. Sci. U. S. A. 1991, 88, 6274–6278. 10.1073/pnas.88.14.6274. [DOI] [PMC free article] [PubMed] [Google Scholar]
- Gelles J.; Schnapp B. J.; Sheetz M. P. Tracking Kinesin-Driven Movements with Nanometre-Scale Precision. Nature 1988, 331, 450–453. 10.1038/331450a0. [DOI] [PubMed] [Google Scholar]
- Geerts H.; de Brabander M.; Nuydens R. Nanovid Microscopy. Nature 1991, 351, 765–766. 10.1038/351765a0. [DOI] [PubMed] [Google Scholar]
- Geerts H.; De Brabander M.; Nuydens R.; Geuens S.; Moeremans M.; De Mey J.; Hollenbeck P. Nanovid Tracking: A New Automatic Method for the Study of Mobility in Living Cells Based on Colloidal Gold and Video Microscopy. Biophys. J. 1987, 52, 775–782. 10.1016/S0006-3495(87)83271-X. [DOI] [PMC free article] [PubMed] [Google Scholar]
- Inoué S. Imaging of Unresolved Objects, Superresolution, and Precision of Distance Measurement with Video Microscopy. Methods Cell Biol. 1989, 30, 85–112. 10.1016/S0091-679X(08)60976-0. [DOI] [PubMed] [Google Scholar]
- Saxton M. J. Single-Particle Tracking: Models of Directed Transport. Biophys. J. 1994, 67, 2110–2019. 10.1016/S0006-3495(94)80694-0. [DOI] [PMC free article] [PubMed] [Google Scholar]
- Kao H. P.; Verkman A. S. Tracking of Single Fluorescent Particles in 3 Dimensions-Use of Cylindrical Optics to Encode Particle Position. Biophys. J. 1994, 67, 1291–1300. 10.1016/S0006-3495(94)80601-0. [DOI] [PMC free article] [PubMed] [Google Scholar]
- Patwardhan A. Subpixel Position Measurement Using 1D, 2D and 3D Centroid Algorithms with Emphasis on Applications in Confocal Microscopy. J. Microsc. 1997, 186, 246–257. 10.1046/j.1365-2818.1997.1970761.x. [DOI] [Google Scholar]
- Peters I. M.; van Kooyk Y.; van Vliet S. J.; de Grooth B. G.; Figdor C. G.; Greve J. 3D Single-Particle Tracking and Optical Trap Measurements on Adhesion Proteins. Cytometry 1999, 36, 189–194. 10.1002/(SICI)1097-0320(19990701)36:3<189::AID-CYTO7>3.0.CO;2-3. [DOI] [PubMed] [Google Scholar]
- Bacher C. P.; Reichenzeller M.; Athale C.; Herrmann H.; Eils R. 4-D Single Particle Tracking of Synthetic and Proteinaceous Microspheres Reveals Preferential Movement of Nuclear Particles Along Chromatin-Poor Tracks. BMC Cell Biol. 2004, 5, 45. 10.1186/1471-2121-5-45. [DOI] [PMC free article] [PubMed] [Google Scholar]
- Genovesio A.; Liedl T.; Emiliani V.; Parak W. J.; Coppey-Moisan M.; Olivo-Marin J. C. Multiple Particle Tracking in 3-D+T Microscopy: Method and Application to the Tracking of Endocytosed Quantum Dots. IEEE Trans. Image Process. 2006, 15, 1062–1070. 10.1109/TIP.2006.872323. [DOI] [PubMed] [Google Scholar]
- Ram S.; Kim D.; Ward E. S.; Ober R. J. Fast 3D Single Molecule Tracking with Multifocal Plane Microscopy in Polarized Epithelia Reveals a Novel Cellular Process of Intercellular Transfer. Biophys. J. 2013, 104, 535a. 10.1016/j.bpj.2012.11.2962. [DOI] [Google Scholar]
- Ram S.; Kim D.; Ober R. J.; Ward E. S. 3D Single Molecule Tracking with Multifocal Plane Microscopy Reveals Rapid Intercellular Transferrin Transport at Epithelial Cell Barriers. Biophys. J. 2012, 103, 1594–1603. 10.1016/j.bpj.2012.08.054. [DOI] [PMC free article] [PubMed] [Google Scholar]
- Ram S.; Prabhat P.; Chao J.; Ward E. S.; Ober R. J. High Accuracy 3D Quantum Dot Tracking with Multifocal Plane Microscopy for the Study of Fast Intracellular Dynamics in Live Cells. Biophys. J. 2008, 95, 6025–6043. 10.1529/biophysj.108.140392. [DOI] [PMC free article] [PubMed] [Google Scholar]
- Levi V.; Ruan Q.; Kis-Petikova K.; Gratton E. Scanning FCS, a Novel Method for Three-Dimensional Particle Tracking. Biochem. Soc. Trans. 2003, 31, 997–1000. 10.1042/bst0310997. [DOI] [PubMed] [Google Scholar]
- Dupont A.; Lamb D. C. Nanoscale Three-Dimensional Single Particle Tracking. Nanoscale 2011, 3, 4532–4541. 10.1039/c1nr10989h. [DOI] [PubMed] [Google Scholar]
- Ruthardt N.; Lamb D. C.; Brauchle C. Single-Particle Tracking as a Quantitative Microscopy-Based Approach to Unravel Cell Entry Mechanisms of Viruses and Pharmaceutical Nanoparticles. Mol. Ther. 2011, 19, 1199–1211. 10.1038/mt.2011.102. [DOI] [PMC free article] [PubMed] [Google Scholar]
- Hou S.; Johnson C.; Welsher K. Real-Time 3D Single Particle Tracking: Towards Active Feedback Single Molecule Spectroscopy in Live Cells. Molecules 2019, 24, 2826. 10.3390/molecules24152826. [DOI] [PMC free article] [PubMed] [Google Scholar]
- Montiel D.; Yang H. Real-Time Three-Dimensional Single-Particle Tracking Spectroscopy for Complex Systems. Laser Photonics Rev. 2010, 4, 374–385. 10.1002/lpor.200910012. [DOI] [Google Scholar]
- Walsh E. E.; Hruska J. Monoclonal Antibodies to Respiratory Syncytial Virus Proteins: Identification of the Fusion Protein. J. Virol. 1983, 47, 171–177. 10.1128/JVI.47.1.171-177.1983. [DOI] [PMC free article] [PubMed] [Google Scholar]
- Matlin K. S.; Reggio H.; Helenius A.; Simons K. Infectious Entry Pathway of Influenza Virus in a Canine Kidney Cell Line. J. Cell Biol. 1981, 91, 601–613. 10.1083/jcb.91.3.601. [DOI] [PMC free article] [PubMed] [Google Scholar]
- Bächi T. Direct Observation of the Budding and Fusion of an Enveloped Virus by Video Microscopy of Viable Cells. J. Cell Biol. 1988, 107, 1689–1695. 10.1083/jcb.107.5.1689. [DOI] [PMC free article] [PubMed] [Google Scholar]
- Lowy R. J.; Sarkar D. P.; Chen Y.; Blumenthal R. Observation of Single Influenza Virus-Cell Fusion and Measurement by Fluorescence Video Microscopy. Proc. Natl. Acad. Sci. U. S. A. 1990, 87, 1850–1854. 10.1073/pnas.87.5.1850. [DOI] [PMC free article] [PubMed] [Google Scholar]
- Georgi A.; Mottola-Hartshorn C.; Warner A.; Fields B.; Chen L. B. Detection of Individual Fluorescently Labeled Reovirions in Living Cells. Proc. Natl. Acad. Sci. U. S. A. 1990, 87, 6579–6583. 10.1073/pnas.87.17.6579. [DOI] [PMC free article] [PubMed] [Google Scholar]
- Pelkmans L.; Kartenbeck J.; Helenius A. Caveolar Endocytosis of Simian Virus 40 Reveals a New Two-Step Vesicular-Transport Pathway to the ER. Nat. Cell Biol. 2001, 3, 473–483. 10.1038/35074539. [DOI] [PubMed] [Google Scholar]
- Lakadamyali M.; Rust M. J.; Babcock H. P.; Zhuang X. Visualizing Infection of Individual Influenza Viruses. Proc. Natl. Acad. Sci. U. S. A. 2003, 100, 9280–9285. 10.1073/pnas.0832269100. [DOI] [PMC free article] [PubMed] [Google Scholar]
- Seisenberger G.; Ried M. U.; Endress T.; Buning H.; Hallek M.; Brauchle C. Real-Time Single-Molecule Imaging of the Infection Pathway of an Adeno-Associated Virus. Science 2001, 294, 1929–1932. 10.1126/science.1064103. [DOI] [PubMed] [Google Scholar]
- Suomalainen M.; Nakano M. Y.; Keller S.; Boucke K.; Stidwill R. P.; Greber U. F. Microtubule-Dependent Plus- and Minus End-Directed Motilities Are Competing Processes for Nuclear Targeting of Adenovirus. J. Cell Biol. 1999, 144, 657–672. 10.1083/jcb.144.4.657. [DOI] [PMC free article] [PubMed] [Google Scholar]
- Coller K. E.; Berger K. L.; Heaton N. S.; Cooper J. D.; Yoon R.; Randall G. RNA Interference and Single Particle Tracking Analysis of Hepatitis C Virus Endocytosis. PLoS Pathog. 2009, 5, e1000702 10.1371/journal.ppat.1000702. [DOI] [PMC free article] [PubMed] [Google Scholar]
- Rust M. J.; Lakadamyali M.; Zhang F.; Zhuang X. Assembly of Endocytic Machinery around Individual Influenza Viruses During Viral Entry. Nat. Struct. Mol. Biol. 2004, 11, 567–573. 10.1038/nsmb769. [DOI] [PMC free article] [PubMed] [Google Scholar]
- van der Schaar H. M.; Rust M. J.; Waarts B. L.; van der Ende-Metselaar H.; Kuhn R. J.; Wilschut J.; Zhuang X.; Smit J. M. Characterization of the Early Events in Dengue Virus Cell Entry by Biochemical Assays and Single-Virus Tracking. J. Virol. 2007, 81, 12019–12028. 10.1128/JVI.00300-07. [DOI] [PMC free article] [PubMed] [Google Scholar]
- Chen C.; Zhuang X. Epsin 1 Is a Cargo-Specific Adaptor for the Clathrin-Mediated Endocytosis of the Influenza Virus. Proc. Natl. Acad. Sci. U. S. A. 2008, 105, 11790–11795. 10.1073/pnas.0803711105. [DOI] [PMC free article] [PubMed] [Google Scholar]
- van der Schaar H. M.; Rust M. J.; Chen C.; van der Ende-Metselaar H.; Wilschut J.; Zhuang X.; Smit J. M. Dissecting the Cell Entry Pathway of Dengue Virus by Single-Particle Tracking in Living Cells. PLoS Pathog. 2008, 4, e1000244 10.1371/journal.ppat.1000244. [DOI] [PMC free article] [PubMed] [Google Scholar]
- Tsien R. Y. The Green Fluorescent Protein. Annu. Rev. Biochem. 1998, 67, 509–544. 10.1146/annurev.biochem.67.1.509. [DOI] [PubMed] [Google Scholar]
- Baulcombe D. C.; Chapman S.; Santa Cruz S. Jellyfish Green Fluorescent Protein as a Reporter for Virus Infections. Plant J. 1995, 7, 1045–1053. 10.1046/j.1365-313X.1995.07061045.x. [DOI] [PubMed] [Google Scholar]
- Elliott G.; O’Hare P. Live-Cell Analysis of a Green Fluorescent Protein-Tagged Herpes Simplex Virus Infection. J. Virol. 1999, 73, 4110–4119. 10.1128/JVI.73.5.4110-4119.1999. [DOI] [PMC free article] [PubMed] [Google Scholar]
- Cruz S. S.; Chapman S.; Roberts A. G.; Roberts I. M.; Prior D.; Oparka K. J. Assembly and Movement of a Plant Virus Carrying a Green Fluorescent Protein Overcoat. Proc. Natl. Acad. Sci. U. S. A. 1996, 93, 6286–6290. 10.1073/pnas.93.13.6286. [DOI] [PMC free article] [PubMed] [Google Scholar]
- Desai P.; Person S. Incorporation of the Green Fluorescent Protein into the Herpes Simplex Virus Type 1 Capsid. J. Virol. 1998, 72, 7563–7568. 10.1128/JVI.72.9.7563-7568.1998. [DOI] [PMC free article] [PubMed] [Google Scholar]
- Moradpour D.; Evans M. J.; Gosert R.; Yuan Z.; Blum H. E.; Goff S. P.; Lindenbach B. D.; Rice C. M. Insertion of Green Fluorescent Protein into Nonstructural Protein 5A Allows Direct Visualization of Functional Hepatitis C Virus Replication Complexes. J. Virol. 2004, 78, 7400–7409. 10.1128/JVI.78.14.7400-7409.2004. [DOI] [PMC free article] [PubMed] [Google Scholar]
- McDonald D.; Vodicka M. A.; Lucero G.; Svitkina T. M.; Borisy G. G.; Emerman M.; Hope T. J. Visualization of the Intracellular Behavior of HIV in Living Cells. J. Cell Biol. 2002, 159, 441–452. 10.1083/jcb.200203150. [DOI] [PMC free article] [PubMed] [Google Scholar]
- Miyauchi K.; Kim Y.; Latinovic O.; Morozov V.; Melikyan G. B. HIV Enters Cells via Endocytosis and Dynamin-Dependent Fusion with Endosomes. Cell 2009, 137, 433–444. 10.1016/j.cell.2009.02.046. [DOI] [PMC free article] [PubMed] [Google Scholar]
- Koch P.; Lampe M.; Godinez W. J.; Müller B.; Rohr K.; Kräusslich H.-G.; Lehmann M. J. Visualizing Fusion of Pseudotyped HIV-1 Particles in Real Time by Live Cell Microscopy. Retrovirology 2009, 6, 84. 10.1186/1742-4690-6-84. [DOI] [PMC free article] [PubMed] [Google Scholar]
- Endreß T.; Lampe M.; Briggs J. A. G.; Kräusslich H.-G.; Bräuchle C.; Müller B.; Lamb D. C. HIV-1–Cellular Interactions Analyzed by Single Virus Tracing. Eur. Biophys. J. 2008, 37, 1291–1301. 10.1007/s00249-008-0322-z. [DOI] [PubMed] [Google Scholar]
- Jolly C.; Kashefi K.; Hollinshead M.; Sattentau Q. J. HIV-1 Cell to Cell Transfer Across an Env-Induced, Actin-Dependent Synapse. J. Exp. Med. 2004, 199, 283–293. 10.1084/jem.20030648. [DOI] [PMC free article] [PubMed] [Google Scholar]
- Arhel N.; Genovesio A.; Kim K. A.; Miko S.; Perret E.; Olivo-Marin J. C.; Shorte S.; Charneau P. Quantitative Four-Dimensional Tracking of Cytoplasmic and Nuclear HIV-1 Complexes. Nat. Methods 2006, 3, 817–824. 10.1038/nmeth928. [DOI] [PubMed] [Google Scholar]
- Hubner W.; McNerney G. P.; Chen P.; Dale B. M.; Gordon R. E.; Chuang F. Y.; Li X. D.; Asmuth D. M.; Huser T.; Chen B. K. Quantitative 3D Video Microscopy of HIV Transfer Across T Cell Virological Synapses. Science 2009, 323, 1743–1747. 10.1126/science.1167525. [DOI] [PMC free article] [PubMed] [Google Scholar]
- Dahan M.; Levi S.; Luccardini C.; Rostaing P.; Riveau B.; Triller A. Diffusion Dynamics of Glycine Receptors Revealed by Single-Quantum Dot Tracking. Science 2003, 302, 442–445. 10.1126/science.1088525. [DOI] [PubMed] [Google Scholar]
- Bonneau S.; Dahan M.; Cohen L. D. Single Quantum Dot Tracking Based on Perceptual Grouping Using Minimal Paths in a Spatiotemporal Volume. IEEE T. Image Process 2005, 14, 1384–1395. 10.1109/TIP.2005.852794. [DOI] [PubMed] [Google Scholar]
- Bachir A. I.; Durisic N.; Hebert B.; Grütter P.; Wiseman P. W. Characterization of Blinking Dynamics in Quantum Dot Ensembles Using Image Correlation Spectroscopy. J. Appl. Phys. 2006, 99, 064503 10.1063/1.2175470. [DOI] [Google Scholar]
- Durisic N.; Bachir A. I.; Kolin D. L.; Hebert B.; Lagerholm B. C.; Grutter P.; Wiseman P. W. Detection and Correction of Blinking Bias in Image Correlation Transport Measurements of Quantum Dot Tagged Macromolecules. Biophys. J. 2007, 93, 1338–1346. 10.1529/biophysj.107.106864. [DOI] [PMC free article] [PubMed] [Google Scholar]
- He K.; Luo W.; Zhang Y.; Liu F.; Liu D.; Xu L.; Qin L.; Xiong C.; Lu Z.; Fang X. Intercellular Transportation of Quantum Dots Mediated by Membrane Nanotubes. ACS Nano 2010, 4, 3015–3022. 10.1021/nn1002198. [DOI] [PubMed] [Google Scholar]
- Chang Y.-P.; Pinaud F.; Antelman J.; Weiss S. Tracking Bio-Molecules in Live Cells Using Quantum Dots. J. Biophotonics 2008, 1, 287–298. 10.1002/jbio.200810029. [DOI] [PMC free article] [PubMed] [Google Scholar]
- Pinaud F.; Clarke S.; Sittner A.; Dahan M. Probing Cellular Events, One Quantum Dot at a Time. Nat. Methods 2010, 7, 275–285. 10.1038/nmeth.1444. [DOI] [PubMed] [Google Scholar]
- Wang Z. G.; Liu S. L.; Tian Z. Q.; Zhang Z. L.; Tang H. W.; Pang D. W. Myosin-Driven Intercellular Transportation of Wheat Germ Agglutinin Mediated by Membrane Nanotubes between Human Lung Cancer Cells. ACS Nano 2012, 6, 10033–10041. 10.1021/nn303729r. [DOI] [PubMed] [Google Scholar]
- Liu S. L.; Zhang Z. L.; Sun E. Z.; Peng J.; Xie M.; Tian Z. Q.; Lin Y.; Pang D. W. Visualizing the Endocytic and Exocytic Processes of Wheat Germ Agglutinin by Quantum Dot-Based Single-Particle Tracking. Biomaterials 2011, 32, 7616–7624. 10.1016/j.biomaterials.2011.06.046. [DOI] [PubMed] [Google Scholar]
- Joo K.-I.; Lei Y.; Lee C.-L.; Lo J.; Xie J.; Hamm-Alvarez S. F.; Wang P. Site-Specific Labeling of Enveloped Viruses with Quantum Dots for Single Virus Tracking. ACS Nano 2008, 2, 1553–1562. 10.1021/nn8002136. [DOI] [PMC free article] [PubMed] [Google Scholar]
- Liu S. L.; Tian Z. Q.; Zhang Z. L.; Wu Q. M.; Zhao H. S.; Ren B.; Pang D. W. High-Efficiency Dual Labeling of Influenza Virus for Single-Virus Imaging. Biomaterials 2012, 33, 7828–7833. 10.1016/j.biomaterials.2012.07.026. [DOI] [PubMed] [Google Scholar]
- Lv C.; Lin Y.; Liu A. A.; Hong Z. Y.; Wen L.; Zhang Z.; Zhang Z. L.; Wang H.; Pang D. W. Labeling Viral Envelope Lipids with Quantum Dots by Harnessing the Biotinylated Lipid-Self-Inserted Cellular Membrane. Biomaterials 2016, 106, 69–77. 10.1016/j.biomaterials.2016.08.013. [DOI] [PubMed] [Google Scholar]
- Hong Z. Y.; Lv C.; Liu A. A.; Liu S. L.; Sun E. Z.; Zhang Z. L.; Lei A. W.; Pang D. W. Clicking Hydrazine and Aldehyde: The Way to Labeling of Viruses with Quantum Dots. ACS Nano 2015, 9, 11750–11760. 10.1021/acsnano.5b03256. [DOI] [PubMed] [Google Scholar]
- Wen L.; Lin Y.; Zheng Z. H.; Zhang Z. L.; Zhang L. J.; Wang L. Y.; Wang H. Z.; Pang D. W. Labeling the Nucleocapsid of Enveloped Baculovirus with Quantum Dots for Single-Virus Tracking. Biomaterials 2014, 35, 2295–2301. 10.1016/j.biomaterials.2013.11.069. [DOI] [PubMed] [Google Scholar]
- Xie M.; Luo K.; Huang B.-H.; Liu S.-L.; Hu J.; Cui D.; Zhang Z.-L.; Xiao G.-F.; Pang D.-W. PEG-Interspersed Nitrilotriacetic Acid-Functionalized Quantum Dots for Site-Specific Labeling of Prion Proteins Expressed on Cell Surfaces. Biomaterials 2010, 31, 8362–8370. 10.1016/j.biomaterials.2010.07.063. [DOI] [PubMed] [Google Scholar]
- Wen L.; Zheng Z. H.; Liu A. A.; Lv C.; Zhang L. J.; Ao J.; Zhang Z. L.; Wang H. Z.; Lin Y.; Pang D. W. Tracking Single Baculovirus Retrograde Transportation in Host Cell via Quantum Dot-Labeling of Virus Internal Component. J. Nanobiotechnol. 2017, 15, 37. 10.1186/s12951-017-0270-9. [DOI] [PMC free article] [PubMed] [Google Scholar]
- Hao J.; Huang L. L.; Zhang R.; Wang H. Z.; Xie H. Y. A Mild and Reliable Method to Label Enveloped Virus with Quantum Dots by Copper-Free Click Chemistry. Anal. Chem. 2012, 84, 8364–8370. 10.1021/ac301918t. [DOI] [PubMed] [Google Scholar]
- Zhang P.; Liu S.; Gao D.; Hu D.; Gong P.; Sheng Z.; Deng J.; Ma Y.; Cai L. Click-Functionalized Compact Quantum Dots Protected by Multidentate-Imidazole Ligands: Conjugation-Ready Nanotags for Living-Virus Labeling and Imaging. J. Am. Chem. Soc. 2012, 134, 8388–8391. 10.1021/ja302367s. [DOI] [PubMed] [Google Scholar]
- Liu H.; Liu Y.; Liu S.; Pang D. W.; Xiao G. Clathrin-Mediated Endocytosis in Living Host Cells Visualized through Quantum Dot Labeling of Infectious Hematopoietic Necrosis virus. J. Virol. 2011, 85, 6252–6262. 10.1128/JVI.00109-11. [DOI] [PMC free article] [PubMed] [Google Scholar]
- Liu S. L.; Zhang Z. L.; Tian Z. Q.; Zhao H. S.; Liu H.; Sun E. Z.; Xiao G. F.; Zhang W.; Wang H. Z.; Pang D. W. Effectively and Efficiently Dissecting the Infection of Influenza Virus by Quantum-Dot-Based Single-Particle Tracking. ACS Nano 2012, 6, 141–150. 10.1021/nn2031353. [DOI] [PubMed] [Google Scholar]
- Luo K.; Li S.; Xie M.; Wu D.; Wang W.; Chen R.; Huang L.; Huang T.; Pang D.; Xiao G. Real-Time Visualization of Prion Transport in Single Live Cells Using Quantum Dots. Biochem. Biophys. Res. Commun. 2010, 394, 493–497. 10.1016/j.bbrc.2010.02.159. [DOI] [PubMed] [Google Scholar]
- Liu S. L.; Zhang L. J.; Wang Z. G.; Zhang Z. L.; Wu Q. M.; Sun E. Z.; Shi Y. B.; Pang D. W. Globally Visualizing the Microtubule-Dependent Transport Behaviors of Influenza Virus in Live Cells. Anal. Chem. 2014, 86, 3902–3908. 10.1021/ac500640u. [DOI] [PMC free article] [PubMed] [Google Scholar]
- Liu S. L.; Wu Q. M.; Zhang L. J.; Wang Z. G.; Sun E. Z.; Zhang Z. L.; Pang D. W. Three-Dimensional Tracking of Rab5- and Rab7-Associated Infection Process of Influenza Virus. Small 2014, 10, 4746–4753. 10.1002/smll.201400944. [DOI] [PubMed] [Google Scholar]
- Wang Z. G.; Liu S. L.; Zhang Z. L.; Tian Z. Q.; Tang H. W.; Pang D. W. Exploring Sialic Acid Receptors-Related Infection Behavior of Avian Influenza Virus in Human Bronchial Epithelial Cells by Single-Particle Tracking. Small 2014, 10, 2712–2720. 10.1002/smll.201303532. [DOI] [PubMed] [Google Scholar]
- Qin C.; Li W.; Li Q.; Yin W.; Zhang X.; Zhang Z.; Zhang X. E.; Cui Z. Real-Time Dissection of Dynamic Uncoating of Individual Influenza Viruses. Proc. Natl. Acad. Sci. U. S. A. 2019, 116, 2577–2582. 10.1073/pnas.1812632116. [DOI] [PMC free article] [PubMed] [Google Scholar]
- Sun E. Z.; Liu A. A.; Zhang Z. L.; Liu S. L.; Tian Z. Q.; Pang D. W. Real-Time Dissection of Distinct Dynamin-Dependent Endocytic Routes of Influenza A Virus by Quantum Dot-Based Single-Virus Tracking. ACS Nano 2017, 11, 4395–4406. 10.1021/acsnano.6b07853. [DOI] [PubMed] [Google Scholar]
- Wu Q. M.; Liu S. L.; Chen G.; Zhang W.; Sun E. Z.; Xiao G. F.; Zhang Z. L.; Pang D. W. Uncovering the Rab5-Independent Autophagic Trafficking of Influenza A Virus by Quantum-Dot-Based Single-Virus Tracking. Small 2018, 14, e1702841 10.1002/smll.201702841. [DOI] [PubMed] [Google Scholar]
- Ma Y.; Wang M.; Li W.; Zhang Z.; Zhang X.; Tan T.; Zhang X. E.; Cui Z. Live Cell Imaging of Single Genomic Loci with Quantum Dot-Labeled TALEs. Nat. Commun. 2017, 8, 15318. 10.1038/ncomms15318. [DOI] [PMC free article] [PubMed] [Google Scholar]
- Li Q.; Yin W.; Li W.; Zhang Z.; Zhang X.; Zhang X. E.; Cui Z. Encapsulating Quantum Dots within HIV-1 Virions through Site-Specific Decoration of the Matrix Protein Enables Single Virus Tracking in Live Primary Macrophages. Nano Lett. 2018, 18, 7457–7468. 10.1021/acs.nanolett.8b02800. [DOI] [PubMed] [Google Scholar]
- Zhang L. J.; Xia L.; Liu S. L.; Sun E. Z.; Wu Q. M.; Wen L.; Zhang Z. L.; Pang D. W. A ″Driver Switchover″ Mechanism of Influenza Virus Transport from Microfilaments to Microtubules. ACS Nano 2018, 12, 474–484. 10.1021/acsnano.7b06926. [DOI] [PubMed] [Google Scholar]
- Muller B.; Daecke J.; Fackler O. T.; Dittmar M. T.; Zentgraf H.; Krausslich H. G. Construction and Characterization of a Fluorescently Labeled Infectious Human Immunodeficiency Virus Type 1 Derivative. J. Virol. 2004, 78, 10803–10813. 10.1128/JVI.78.19.10803-10813.2004. [DOI] [PMC free article] [PubMed] [Google Scholar]
- Carlson L. A.; Briggs J. A. G.; Glass B.; Riches J. D.; Simon M. N.; Johnson M. C.; Muller B.; Grunewald K.; Krausslich H. G. Three-Dimensional Analysis of Budding Sites and Released Virus Suggests a Revised Model for HIV-1 Morphogenesis. Cell Host Microbe 2008, 4, 592–599. 10.1016/j.chom.2008.10.013. [DOI] [PMC free article] [PubMed] [Google Scholar]
- Sakin V.; Paci G.; Lemke E. A.; Muller B. Labeling of Virus Components for Advanced, Quantitative Imaging Analyses. FEBS Lett. 2016, 590, 1896–1914. 10.1002/1873-3468.12131. [DOI] [PubMed] [Google Scholar]
- Goncalves M. S. Fluorescent Labeling of Biomolecules with Organic Probes. Chem. Rev. 2009, 109, 190–212. 10.1021/cr0783840. [DOI] [PubMed] [Google Scholar]
- Resch-Genger U.; Grabolle M.; Cavaliere-Jaricot S.; Nitschke R.; Nann T. Quantum Dots versus Organic Dyes as Fluorescent Labels. Nat. Methods 2008, 5, 763–775. 10.1038/nmeth.1248. [DOI] [PubMed] [Google Scholar]
- Miyawaki A.; Sawano A.; Kogure T. Lighting Up Cells: Labelling Proteins with Fluorophores. Nat. Cell Biol. 2003, S1–S7. [PubMed] [Google Scholar]
- Sivaraman D.; Biswas P.; Cella L. N.; Yates M. V.; Chen W. Detecting RNA Viruses in Living Mammalian Cells by Fluorescence Microscopy. Trends Biotechnol. 2011, 29, 307–313. 10.1016/j.tibtech.2011.02.006. [DOI] [PubMed] [Google Scholar]
- Wang I. H.; Burckhardt C. J.; Yakimovich A.; Greber U. F. Imaging, Tracking and Computational Analyses of Virus Entry and Egress with the Cytoskeleton. Viruses 2018, 10, 166. 10.3390/v10040166. [DOI] [PMC free article] [PubMed] [Google Scholar]
- Rao J.; Dragulescu-Andrasi A.; Yao H. Fluorescence Imaging in Vivo: Recent Advances. Curr. Opin. Biotechnol. 2007, 18, 17–25. 10.1016/j.copbio.2007.01.003. [DOI] [PubMed] [Google Scholar]
- Lakadamyali M.; Rust M. J.; Zhuang X. Ligands for Clathrin-Mediated Endocytosis Are Differentially Sorted into Distinct Populations of Early Endosomes. Cell 2006, 124, 997–1009. 10.1016/j.cell.2005.12.038. [DOI] [PMC free article] [PubMed] [Google Scholar]
- Babcock H. P.; Chen C.; Zhuang X. Using Single-Particle Tracking to Study Nuclear Trafficking of Viral Genes. Biophys. J. 2004, 87, 2749–2758. 10.1529/biophysj.104.042234. [DOI] [PMC free article] [PubMed] [Google Scholar]
- Vaughan J. C.; Brandenburg B.; Hogle J. M.; Zhuang X. Rapid Actin-Dependent Viral Motility in Live Cells. Biophys. J. 2009, 97, 1647–1656. 10.1016/j.bpj.2009.07.011. [DOI] [PMC free article] [PubMed] [Google Scholar]
- Brandenburg B.; Lee L. Y.; Lakadamyali M.; Rust M. J.; Zhuang X.; Hogle J. M. Imaging Poliovirus Entry in Live Cells. PLoS Biol. 2007, 5, e183 10.1371/journal.pbio.0050183. [DOI] [PMC free article] [PubMed] [Google Scholar]
- Xu H.; Hao X.; Wang S.; Wang Z.; Cai M.; Jiang J.; Qin Q.; Zhang M.; Wang H. Real-Time Imaging of Rabies Virus Entry into Living Vero Cells. Sci. Rep. 2015, 5, 11753. 10.1038/srep11753. [DOI] [PMC free article] [PubMed] [Google Scholar]
- Vonderheit A.; Helenius A. Rab7 Associates with Early Endosomes to Mediate Sorting and Transport of Semliki Forest Virus to Late Endosomes. PLoS Biol. 2005, 3, e233 10.1371/journal.pbio.0030233. [DOI] [PMC free article] [PubMed] [Google Scholar]
- Johannsdottir H. K.; Mancini R.; Kartenbeck J.; Amato L.; Helenius A. Host Cell Factors and Functions Involved in Vesicular Stomatitis Virus Entry. J. Virol. 2009, 83, 440–453. 10.1128/JVI.01864-08. [DOI] [PMC free article] [PubMed] [Google Scholar]
- Engel S.; Heger T.; Mancini R.; Herzog F.; Kartenbeck J.; Hayer A.; Helenius A. Role of Endosomes in Simian Virus 40 Entry and Infection. J. Virol. 2011, 85, 4198–4211. 10.1128/JVI.02179-10. [DOI] [PMC free article] [PubMed] [Google Scholar]
- Joo K. I.; Fang Y.; Liu Y.; Xiao L.; Gu Z.; Tai A.; Lee C. L.; Tang Y.; Wang P. Enhanced Real-Time Monitoring of Adeno-Associated Virus Trafficking by Virus-Quantum Dot Conjugates. ACS Nano 2011, 5, 3523–3535. 10.1021/nn102651p. [DOI] [PMC free article] [PubMed] [Google Scholar]
- Schelhaas M.; Ewers H.; Rajamaki M. L.; Day P. M.; Schiller J. T.; Helenius A. Human Papillomavirus Type 16 Entry: Retrograde Cell Surface Transport along Actin-Rich Protrusions. PLoS Pathog. 2008, 4, e1000148 10.1371/journal.ppat.1000148. [DOI] [PMC free article] [PubMed] [Google Scholar]
- Martin-Acebes M. A.; Vazquez-Calvo A.; Gonzalez-Magaldi M.; Sobrino F. Foot-and-Mouth Disease Virus Particles Inactivated with Binary Ethylenimine Are Efficiently Internalized into Cultured Cells. Vaccine 2011, 29, 9655–9662. 10.1016/j.vaccine.2011.10.031. [DOI] [PubMed] [Google Scholar]
- Ewers H.; Smith A. E.; Sbalzarini I. F.; Lilie H.; Koumoutsakos P.; Helenius A. Single-Particle Tracking of Murine Polyoma Virus-Like Particles on Live Cells and Artificial Membranes. Proc. Natl. Acad. Sci. U. S. A. 2005, 102, 15110–15115. 10.1073/pnas.0504407102. [DOI] [PMC free article] [PubMed] [Google Scholar]
- Cureton D. K.; Massol R. H.; Whelan S. P.; Kirchhausen T. The Length of Vesicular Stomatitis Virus Particles Dictates a Need for Actin Assembly During Clathrin-Dependent Endocytosis. PLoS Pathog. 2010, 6, e1001127 10.1371/journal.ppat.1001127. [DOI] [PMC free article] [PubMed] [Google Scholar]
- Pelkmans L.; Puntener D.; Helenius A. Local Actin Polymerization and Dynamin Recruitment in SV40-Induced Internalization of Caveolae. Science 2002, 296, 535–539. 10.1126/science.1069784. [DOI] [PubMed] [Google Scholar]
- Cureton D. K.; Harbison C. E.; Cocucci E.; Parrish C. R.; Kirchhausen T. Limited Transferrin Receptor Clustering Allows Rapid Diffusion of Canine Parvovirus into Clathrin Endocytic Structures. J. Virol. 2012, 86, 5330–5340. 10.1128/JVI.07194-11. [DOI] [PMC free article] [PubMed] [Google Scholar]
- Ehrlich M.; Boll W.; Van Oijen A.; Hariharan R.; Chandran K.; Nibert M. L.; Kirchhausen T. Endocytosis by Random Initiation and Stabilization of Clathrin-Coated Pits. Cell 2004, 118, 591–605. 10.1016/j.cell.2004.08.017. [DOI] [PubMed] [Google Scholar]
- Damm E. M.; Pelkmans L.; Kartenbeck J.; Mezzacasa A.; Kurzchalia T.; Helenius A. Clathrin- and Caveolin-1-Independent Endocytosis: Entry of Simian Virus 40 into Cells Devoid of Caveolae. J. Cell Biol. 2005, 168, 477–488. 10.1083/jcb.200407113. [DOI] [PMC free article] [PubMed] [Google Scholar]
- Meier R.; Franceschini A.; Horvath P.; Tetard M.; Mancini R.; Von Mering C.; Helenius A.; Lozach P.-Y. Genome-Wide Small Interfering RNA Screens Reveal VAMP3 as a Novel Host Factor Required for Uukuniemi Virus Late Penetration. J. Virol. 2014, 88, 8565–8578. 10.1128/JVI.00388-14. [DOI] [PMC free article] [PubMed] [Google Scholar]
- Kalin S.; Amstutz B.; Gastaldelli M.; Wolfrum N.; Boucke K.; Havenga M.; DiGennaro F.; Liska N.; Hemmi S.; Greber U. F. Macropinocytotic Uptake and Infection of Human Epithelial Cells with Species B2 Adenovirus Type 35. J. Virol. 2010, 84, 5336–5350. 10.1128/JVI.02494-09. [DOI] [PMC free article] [PubMed] [Google Scholar]
- Mishra A.; Behera R. K.; Behera P. K.; Mishra B. K.; Behera G. B. Cyanines During the 1990s: A Review. Chem. Rev. 2000, 100, 1973–2011. 10.1021/cr990402t. [DOI] [PubMed] [Google Scholar]
- Kvach M. V.; Ustinov A. V.; Stepanova I. A.; Malakhov A. D.; Skorobogatyi M. V.; Shmanai V. V.; Korshun V. A. A Convenient Synthesis of Cyanine Dyes: Reagents for the Labeling of Biomolecules. Eur. J. Org. Chem. 2008, 2008, 2107–2117. 10.1002/ejoc.200701190. [DOI] [Google Scholar]
- Yang X.; Shi C.; Tong R.; Qian W.; Zhau H. E.; Wang R.; Zhu G.; Cheng J.; Yang V. W.; Cheng T.; et al. Near IR Heptamethine Cyanine Dye-Mediated Cancer Imaging. Clin. Cancer Res. 2010, 16, 2833–2844. 10.1158/1078-0432.CCR-10-0059. [DOI] [PMC free article] [PubMed] [Google Scholar]
- Brauchle C.; Seisenberger G.; Endress T.; Ried M. U.; Buning H.; Hallek M. Single Virus Tracing: Visualization of the Infection Pathway of a Virus into a Living Cell. ChemPhysChem 2002, 3, 299–303. 10.1002/1439-7641(20020315)3:3<299::AID-CPHC299>3.0.CO;2-R. [DOI] [PubMed] [Google Scholar]
- Berlier J. E.; Rothe A.; Buller G.; Bradford J.; Gray D. R.; Filanoski B. J.; Telford W. G.; Yue S.; Liu J. X.; Cheung C. Y.; et al. Quantitative Comparison of Long-Wavelength Alexa Fluor Dyes to Cy Dyes: Fluorescence of the Dyes and Their Bioconjugates. J. Histochem. Cytochem. 2003, 51, 1699–1712. 10.1177/002215540305101214. [DOI] [PubMed] [Google Scholar]
- Mahmoudian J.; Hadavi R.; Jeddi-Tehrani M.; Mahmoudi A. R.; Bayat A. A.; Shaban E.; Vafakhah M.; Darzi M.; Tarahomi M.; Ghods R. Comparison of the Photobleaching and Photostability Traits of Alexa Fluor 568-and Fluorescein Isothiocyanate- Conjugated Antibody. Cell J. 2011, 13, 169–172. [PMC free article] [PubMed] [Google Scholar]
- Hoekstra D.; de Boer T.; Klappe K.; Wilschut J. Fluorescence Method for Measuring the Kinetics of Fusion between Biological Membranes. Biochemistry 1984, 23, 5675–5681. 10.1021/bi00319a002. [DOI] [PubMed] [Google Scholar]
- Floyd D. L.; Ragains J. R.; Skehel J. J.; Harrison S. C.; van Oijen A. M. Single-Particle Kinetics of Influenza Virus Membrane Fusion. Proc. Natl. Acad. Sci. U. S. A. 2008, 105, 15382–15387. 10.1073/pnas.0807771105. [DOI] [PMC free article] [PubMed] [Google Scholar]
- Jha N. K.; Latinovic O.; Martin E.; Novitskiy G.; Marin M.; Miyauchi K.; Naughton J.; Young J. A.; Melikyan G. B. Imaging Single Retrovirus Entry through Alternative Receptor Isoforms and Intermediates of Virus-Endosome Fusion. PLoS Pathog. 2011, 7, e1001260 10.1371/journal.ppat.1001260. [DOI] [PMC free article] [PubMed] [Google Scholar]
- Hoornweg T. E.; van Duijl-Richter M. K. S.; Ayala Nunez N. V.; Albulescu I. C.; van Hemert M. J.; Smit J. M. Dynamics of Chikungunya Virus Cell Entry Unraveled by Single-Virus Tracking in Living Cells. J. Virol. 2016, 90, 4745–4756. 10.1128/JVI.03184-15. [DOI] [PMC free article] [PubMed] [Google Scholar]
- Li Q.; Li W.; Yin W.; Guo J.; Zhang Z. P.; Zeng D.; Zhang X.; Wu Y.; Zhang X. E.; Cui Z. Single-Particle Tracking of Human Immunodeficiency Virus Type 1 Productive Entry into Human Primary Macrophages. ACS Nano 2017, 11, 3890–3903. 10.1021/acsnano.7b00275. [DOI] [PubMed] [Google Scholar]
- Nanbo A.; Imai M.; Watanabe S.; Noda T.; Takahashi K.; Neumann G.; Halfmann P.; Kawaoka Y. Ebolavirus Is Internalized into Host Cells via Macropinocytosis in a Viral Glycoprotein-Dependent Manner. PLoS Pathog. 2010, 6, e1001121 10.1371/journal.ppat.1001121. [DOI] [PMC free article] [PubMed] [Google Scholar]
- Hao X.; Shang X.; Wu J. Z.; Shan Y. P.; Cai M. J.; Jiang J. G.; Huang Z.; Tang Z. Y.; Wang H. D. Single-Particle Tracking of Hepatitis B Virus-Like Vesicle Entry into Cells. Small 2011, 7, 1212–1218. 10.1002/smll.201002020. [DOI] [PubMed] [Google Scholar]
- Le Blanc I.; Luyet P. P.; Pons V.; Ferguson C.; Emans N.; Petiot A.; Mayran N.; Demaurex N.; Faure J.; Sadoul R.; et al. Endosome-to-Cytosol Transport of Viral Nucleocapsids. Nat. Cell Biol. 2005, 7, 653–664. 10.1038/ncb1269. [DOI] [PMC free article] [PubMed] [Google Scholar]
- Lozach P.-Y.; Kühbacher A.; Meier R.; Mancini R.; Bitto D.; Bouloy M.; Helenius A. DC-SIGN as a Receptor for Phleboviruses. Cell Host Microbe 2011, 10, 75–88. 10.1016/j.chom.2011.06.007. [DOI] [PubMed] [Google Scholar]
- Ayala-Nuñez N. V.; Wilschut J.; Smit J. M. Monitoring Virus Entry into Living Cells Using DiD-Labeled Dengue Virus Particles. Methods 2011, 55, 137–143. 10.1016/j.ymeth.2011.07.009. [DOI] [PubMed] [Google Scholar]
- Crowther D.; Melnick J. L. The Incorporation of Neutral Red and Acridine Orange into Developing Poliovirus Particles Making Them Photosensitive. Virology 1961, 14, 11–21. 10.1016/0042-6822(61)90127-1. [DOI] [PubMed] [Google Scholar]
- Wilson J. N.; Cooper P. D. Aspects of the Growth of Poliovirus as Revealed by the Photodynamic Effects of Neutral Red and Acridine Orange. Virology 1963, 21, 135–145. 10.1016/0042-6822(63)90249-6. [DOI] [PubMed] [Google Scholar]
- Glynn T. J.; Power S.; Ryder A. G.; Morrison J. J.. Time-Domain Measurement of Fluorescence Lifetime Variation with pH. Proc. SPIE-Int. Soc. Opt. Eng.; Society of Photo-optical Instrumentation Engineers: 2001. [Google Scholar]
- Kremser L.; Okun V. M.; Nicodemou A.; Blaas D.; Kenndler E. Binding of Fluorescent Dye to Genomic RNA inside Intact Human Rhinovirus after Viral Capsid Penetration Investigated by Capillary Electrophoresis. Anal. Chem. 2004, 76, 882–887. 10.1021/ac034898x. [DOI] [PubMed] [Google Scholar]
- Kremser L.; Petsch M.; Blaas D.; Kenndler E. Labeling of Capsid Proteins and Genomic RNA of Human Rhinovirus with Two Different Fluorescent Dyes for Selective Detection by Capillary Electrophoresis. Anal. Chem. 2004, 76, 7360–7365. 10.1021/ac048999m. [DOI] [PubMed] [Google Scholar]
- Jones L. J.; Yue S. T.; Cheung C. Y.; Singer V. L. RNA Quantitation by Fluorescence-Based Solution Assay: RiboGreen Reagent Characterization. Anal. Biochem. 1998, 265, 368–374. 10.1006/abio.1998.2914. [DOI] [PubMed] [Google Scholar]
- Lin Y.-W.; Chiu T.-C.; Chang H.-T. Laser-Induced Fluorescence Technique for DNA and Proteins Separated by Capillary Electrophoresis. J. Chromatogr. B: Anal. Technol. Biomed. Life Sci. 2003, 793, 37–48. 10.1016/S1570-0232(03)00363-5. [DOI] [PubMed] [Google Scholar]
- Wen L.; Lin Y.; Zhang Z. L.; Lu W.; Lv C.; Chen Z. L.; Wang H. Z.; Pang D. W. Intracellular Self-Assembly Based Multi-Labeling of Key Viral Components: Envelope, Capsid and Nucleic Acids. Biomaterials 2016, 99, 24–33. 10.1016/j.biomaterials.2016.04.038. [DOI] [PubMed] [Google Scholar]
- Zhou P.; Zheng Z.; Lu W.; Zhang F.; Zhang Z.; Pang D.; Hu B.; He Z.; Wang H. Multicolor Labeling of Living-Virus Particles in Live Cells. Angew. Chem., Int. Ed. 2012, 51, 670–674. 10.1002/anie.201105701. [DOI] [PubMed] [Google Scholar]
- Huang L. L.; Zhou P.; Wang H. Z.; Zhang R.; Hao J.; Xie H. Y.; He Z. K. A New Stable and Reliable Method for Labeling Nucleic Acids of Fully Replicative Viruses. Chem. Commun. 2012, 48, 2424–2426. 10.1039/c2cc17069h. [DOI] [PubMed] [Google Scholar]
- Shimomura O.; Johnson F. H.; Saiga Y. Extraction, Purification and Properties of Aequorin, a Bioluminescent Protein from the Luminous Hydromedusan, Aequorea. J. Cell. Comp. Physiol. 1962, 59, 223–239. 10.1002/jcp.1030590302. [DOI] [PubMed] [Google Scholar]
- Chalfie M. Green Fluorescent Protein as a Marker for Gene Expression. Trends Genet. 1994, 10, 151. 10.1016/0168-9525(94)90088-4. [DOI] [PubMed] [Google Scholar]
- Lippincott-Schwartz J.; Patterson G. H. Development and Use of Fluorescent Protein Markers in Living Cells. Science 2003, 300, 87–91. 10.1126/science.1082520. [DOI] [PubMed] [Google Scholar]
- Day R. N.; Davidson M. W. The Fluorescent Protein Palette: Tools for Cellular Imaging. Chem. Soc. Rev. 2009, 38, 2887–2921. 10.1039/b901966a. [DOI] [PMC free article] [PubMed] [Google Scholar]
- Wiedenmann J.; Oswald F.; Nienhaus G. U. Fluorescent Proteins for Live Cell Imaging: Opportunities, Limitations, and Challenges. IUBMB Life 2009, 61, 1029–1042. 10.1002/iub.256. [DOI] [PubMed] [Google Scholar]
- Shaner N. C.; Campbell R. E.; Steinbach P. A.; Giepmans B. N.; Palmer A. E.; Tsien R. Y. Improved Monomeric Red, Orange and Yellow Fluorescent Proteins Derived from Discosoma sp. Red Fluorescent Protein. Nat. Biotechnol. 2004, 22, 1567–1572. 10.1038/nbt1037. [DOI] [PubMed] [Google Scholar]
- Shkrob M. A.; Yanushevich Y. G.; Chudakov D. M.; Gurskaya N. G.; Labas Y. A.; Poponov S. Y.; Mudrik N. N.; Lukyanov S.; Lukyanov K. A. Far-Red Fluorescent Proteins Evolved From a Blue Chromoprotein from Actinia Equina. Biochem. J. 2005, 392, 649–654. 10.1042/BJ20051314. [DOI] [PMC free article] [PubMed] [Google Scholar]
- Nienhaus K.; Nienhaus G. U. Fluorescent Proteins for Live-Cell Imaging with Super-Resolution. Chem. Soc. Rev. 2014, 43, 1088–1106. 10.1039/C3CS60171D. [DOI] [PubMed] [Google Scholar]
- Shcherbakova D. M.; Verkhusha V. V. Near-Infrared Fluorescent Proteins for Multicolor in Vivo Imaging. Nat. Methods 2013, 10, 751–754. 10.1038/nmeth.2521. [DOI] [PMC free article] [PubMed] [Google Scholar]
- Shcherbakova D. M.; Subach O. M.; Verkhusha V. V. Red Fluorescent Proteins: Advanced Imaging Applications and Future Design. Angew. Chem., Int. Ed. 2012, 51, 10724–10738. 10.1002/anie.201200408. [DOI] [PMC free article] [PubMed] [Google Scholar]
- Tomosugi W.; Matsuda T.; Tani T.; Nemoto T.; Kotera I.; Saito K.; Horikawa K.; Nagai T. An Ultramarine Fluorescent Protein with Increased Photostability and pH Insensitivity. Nat. Methods 2009, 6, 351–353. 10.1038/nmeth.1317. [DOI] [PubMed] [Google Scholar]
- Ai H. W.; Shaner N. C.; Cheng Z.; Tsien R. Y.; Campbell R. E. Exploration of New Chromophore Structures Leads to the Identification of Improved Blue Fluorescent Proteins. Biochemistry 2007, 46, 5904–5910. 10.1021/bi700199g. [DOI] [PubMed] [Google Scholar]
- Subach O. M.; Gundorov I. S.; Yoshimura M.; Subach F. V.; Zhang J.; Grüenwald D.; Souslova E. A.; Chudakov D. M.; Verkhusha V. V. Conversion of Red Fluorescent Protein into a Bright Blue Probe. Chem. Biol. 2008, 15, 1116–1124. 10.1016/j.chembiol.2008.08.006. [DOI] [PMC free article] [PubMed] [Google Scholar]
- Goedhart J.; van Weeren L.; Hink M. A.; Vischer N. O.; Jalink K.; Gadella T. W. Jr. Bright Cyan Fluorescent Protein Variants Identified by Fluorescence Lifetime Screening. Nat. Methods 2010, 7, 137–139. 10.1038/nmeth.1415. [DOI] [PubMed] [Google Scholar]
- Ai H. W.; Henderson J. N.; Remington S. J.; Campbell R. E. Directed Evolution of a Monomeric, Bright and Photostable Version of Clavularia Cyan Fluorescent Protein: Structural Characterization and Applications in Fluorescence Imaging. Biochem. J. 2006, 400, 531–540. 10.1042/BJ20060874. [DOI] [PMC free article] [PubMed] [Google Scholar]
- Samarkina O. N.; Popova A. G.; Gvozdik E. Y.; Chkalina A. V.; Zvyagin I. V.; Rylova Y. V.; Rudenko N. V.; Lusta K. A.; Kelmanson I. V.; Gorokhovatsky A. Y.; et al. Universal and Rapid Method for Purification of GFP-Like Proteins by the Ethanol Extraction. Protein Expression Purif. 2009, 65, 108–113. 10.1016/j.pep.2008.11.008. [DOI] [PubMed] [Google Scholar]
- Ai H. W.; Olenych S. G.; Wong P.; Davidson M. W.; Campbell R. E. Hue-Shifted Monomeric Variants of Clavularia Cyan Fluorescent Protein: Identification of the Molecular Determinants of Color and Applications in Fluorescence Imaging. BMC Biol. 2008, 6, 13. 10.1186/1741-7007-6-13. [DOI] [PMC free article] [PubMed] [Google Scholar]
- Shaner N. C.; Lambert G. G.; Chammas A.; Ni Y.; Cranfill P. J.; Baird M. A.; Sell B. R.; Allen J. R.; Day R. N.; Israelsson M. A Bright Monomeric Green Fluorescent Protein Derived from Branchiostoma Lanceolatum. Nat. Methods 2013, 10, 407–409. 10.1038/nmeth.2413. [DOI] [PMC free article] [PubMed] [Google Scholar]
- Miyawaki A.; Griesbeck O.; Heim R.; Tsien R. Y. Dynamic and Quantitative Ca2+ Measurements Using Improved Cameleons. Proc. Natl. Acad. Sci. U. S. A. 1999, 96, 2135–2140. 10.1073/pnas.96.5.2135. [DOI] [PMC free article] [PubMed] [Google Scholar]
- Griesbeck O.; Baird G. S.; Campbell R. E.; Zacharias D. A.; Tsien R. Y. Reducing the Environmental Sensitivity of Yellow Fluorescent Protein Mechanism and Applications. J. Biol. Chem. 2001, 276, 29188–29194. 10.1074/jbc.M102815200. [DOI] [PubMed] [Google Scholar]
- Sakaue-Sawano A.; Kurokawa H.; Morimura T.; Hanyu A.; Hama H.; Osawa H.; Kashiwagi S.; Fukami K.; Miyata T.; Miyoshi H. Visualizing Spatiotemporal Dynamics of Multicellular Cell-Cycle Progression. Cell 2008, 132, 487–498. 10.1016/j.cell.2007.12.033. [DOI] [PubMed] [Google Scholar]
- Merzlyak E. M.; Goedhart J.; Shcherbo D.; Bulina M. E.; Shcheglov A. S.; Fradkov A. F.; Gaintzeva A.; Lukyanov K. A.; Lukyanov S.; Gadella T. W.; et al. Bright Monomeric Red Fluorescent Protein with an Extended Fluorescence Lifetime. Nat. Methods 2007, 4, 555–557. 10.1038/nmeth1062. [DOI] [PubMed] [Google Scholar]
- Lam A. J.; St-Pierre F.; Gong Y.; Marshall J. D.; Cranfill P. J.; Baird M. A.; McKeown M. R.; Wiedenmann J.; Davidson M. W.; Schnitzer M. J.; et al. Improving FRET Dynamic Range with Bright Green and Red Fluorescent Proteins. Nat. Methods 2012, 9, 1005–1012. 10.1038/nmeth.2171. [DOI] [PMC free article] [PubMed] [Google Scholar]
- Shcherbo D.; Murphy C. S.; Ermakova G. V.; Solovieva E. A.; Chepurnykh T. V.; Shcheglov A. S.; Verkhusha V. V.; Pletnev V. Z.; Hazelwood K. L.; Roche P. M.; et al. Far-Red Fluorescent Tags for Protein Imaging in Living Tissues. Biochem. J. 2009, 418, 567–574. 10.1042/BJ20081949. [DOI] [PMC free article] [PubMed] [Google Scholar]
- Lin M. Z.; McKeown M. R.; Ng H. L.; Aguilera T. A.; Shaner N. C.; Campbell R. E.; Adams S. R.; Gross L. A.; Ma W.; Alber T.; et al. Autofluorescent Proteins with Excitation in the Optical Window for Intravital Imaging in Mammals. Chem. Biol. 2009, 16, 1169–1179. 10.1016/j.chembiol.2009.10.009. [DOI] [PMC free article] [PubMed] [Google Scholar]
- Piatkevich K. D.; Malashkevich V. N.; Morozova K. S.; Nemkovich N. A.; Almo S. C.; Verkhusha V. V. Extended Stokes Shift in Fluorescent Proteins: Chromophore-Protein Interactions in a Near-Infrared TagRFP675 Variant. Sci. Rep. 2013, 3, 1847. 10.1038/srep01847. [DOI] [PMC free article] [PubMed] [Google Scholar]
- Sankaranarayanan S.; De Angelis D.; Rothman J. E.; Ryan T. A. The Use of pHluorins for Optical Measurements of Presynaptic Activity. Biophys. J. 2000, 79, 2199–2208. 10.1016/S0006-3495(00)76468-X. [DOI] [PMC free article] [PubMed] [Google Scholar]
- Shen Y.; Rosendale M.; Campbell R. E.; Perrais D. pHuji, A pH-Sensitive Red Fluorescent Protein for Imaging of Exo- and Endocytosis. J. Cell Biol. 2014, 207, 419–432. 10.1083/jcb.201404107. [DOI] [PMC free article] [PubMed] [Google Scholar]
- Rodriguez E. A.; Campbell R. E.; Lin J. Y.; Lin M. Z.; Miyawaki A.; Palmer A. E.; Shu X.; Zhang J.; Tsien R. Y. The Growing and Glowing Toolbox of Fluorescent and Photoactive Proteins. Trends Biochem. Sci. 2017, 42, 111–129. 10.1016/j.tibs.2016.09.010. [DOI] [PMC free article] [PubMed] [Google Scholar]
- Shaner N. C.; Steinbach P. A.; Tsien R. Y. A Guide to Choosing Fluorescent Proteins. Nat. Methods 2005, 2, 905–909. 10.1038/nmeth819. [DOI] [PubMed] [Google Scholar]
- Chudakov D. M.; Matz M. V.; Lukyanov S.; Lukyanov K. A. Fluorescent Proteins and Their Applications in Imaging Living Cells and Tissues. Physiol. Rev. 2010, 90, 1103–1163. 10.1152/physrev.00038.2009. [DOI] [PubMed] [Google Scholar]
- Foo Y. H.; Naredi-Rainer N.; Lamb D. C.; Ahmed S.; Wohland T. Factors Affecting the Quantification of Biomolecular Interactions by Fluorescence Cross-Correlation Spectroscopy. Biophys. J. 2012, 102, 1174–1183. 10.1016/j.bpj.2012.01.040. [DOI] [PMC free article] [PubMed] [Google Scholar]
- McDonald D.; Wu L.; Bohks S. M.; KewalRamani V. N.; Unutmaz D.; Hope T. J. Recruitment of HIV and Its Receptors to Dendritic Cell-T Cell Junctions. Science 2003, 300, 1295–1297. 10.1126/science.1084238. [DOI] [PubMed] [Google Scholar]
- Zacharias D. A.; Tsien R. Y. Molecular Biology and Mutation of Green Fluorescent Protein. Methods Biochem. Anal. 2005, 47, 83–120. 10.1002/0471739499.ch5. [DOI] [PubMed] [Google Scholar]
- Klingen Y.; Conzelmann K. K.; Finke S. Double-Labeled Rabies Virus: Live Tracking of Enveloped Virus Transport. J. Virol. 2008, 82, 237–245. 10.1128/JVI.01342-07. [DOI] [PMC free article] [PubMed] [Google Scholar]
- Lehmann M. J.; Sherer N. M.; Marks C. B.; Pypaert M.; Mothes W. Actin- and Myosin-Driven Movement of Viruses along Filopodia Precedes Their Entry into Cells. J. Cell Biol. 2005, 170, 317–325. 10.1083/jcb.200503059. [DOI] [PMC free article] [PubMed] [Google Scholar]
- Sugimoto K.; Uema M.; Sagara H.; Tanaka M.; Sata T.; Hashimoto Y.; Kawaguchi Y. Simultaneous Tracking of Capsid, Tegument, and Envelope Protein Localization in Living Cells Infected with Triply Fluorescent Herpes Simplex Virus 1. J. Virol. 2008, 82, 5198–5211. 10.1128/JVI.02681-07. [DOI] [PMC free article] [PubMed] [Google Scholar]
- Liesche J.; Ziomkiewicz I.; Schulz A. Super-Resolution Imaging with Pontamine Fast Scarlet 4BS Enables Direct Visualization of Cellulose Orientation and Cell Connection Architecture in Onion Epidermis Cells. BMC Plant Biol. 2013, 13, 226. 10.1186/1471-2229-13-226. [DOI] [PMC free article] [PubMed] [Google Scholar]
- Melikyan G. B.; Barnard R. J.; Abrahamyan L. G.; Mothes W.; Young J. A. Imaging Individual Retroviral Fusion Events: From Hemifusion to Pore Formation and Growth. Proc. Natl. Acad. Sci. U. S. A. 2005, 102, 8728–8733. 10.1073/pnas.0501864102. [DOI] [PMC free article] [PubMed] [Google Scholar]
- Dixit R.; Tiwari V.; Shukla D. Herpes Simplex Virus Type 1 Induces Filopodia in Differentiated P19 Neural Cells to Facilitate Viral Spread. Neurosci. Lett. 2008, 440, 113–118. 10.1016/j.neulet.2008.05.031. [DOI] [PMC free article] [PubMed] [Google Scholar]
- Adu-Gyamfi E.; Digman M. A.; Gratton E.; Stahelin R. V. Single-Particle Tracking Demonstrates That Actin Coordinates the Movement of the Ebola Virus Matrix Protein. Biophys. J. 2012, 103, L41–143. 10.1016/j.bpj.2012.09.026. [DOI] [PMC free article] [PubMed] [Google Scholar]
- Miyauchi K.; Marin M.; Melikyan G. B. Visualization of Retrovirus Uptake and Delivery into Acidic Endosomes. Biochem. J. 2011, 434, 559–569. 10.1042/BJ20101588. [DOI] [PMC free article] [PubMed] [Google Scholar]
- Padilla-Parra S.; Marin M.; Kondo N.; Melikyan G. B. Pinpointing Retrovirus Entry Sites in Cells Expressing Alternatively Spliced Receptor Isoforms by Single Virus Imaging. Retrovirology 2014, 11, 47. 10.1186/1742-4690-11-47. [DOI] [PMC free article] [PubMed] [Google Scholar]
- Mercer J.; Helenius A. Vaccinia Virus Uses Macropinocytosis and Apoptotic Mimicry to Enter Host Cells. Science 2008, 320, 531–535. 10.1126/science.1155164. [DOI] [PubMed] [Google Scholar]
- Manicassamy B.; Manicassamy S.; Belicha-Villanueva A.; Pisanelli G.; Pulendran B.; Garcia-Sastre A. Analysis of in Vivo Dynamics of Influenza Virus Infection in Mice Using a GFP Reporter Virus. Proc. Natl. Acad. Sci. U. S. A. 2010, 107, 11531–11536. 10.1073/pnas.0914994107. [DOI] [PMC free article] [PubMed] [Google Scholar]
- Bencina M. Illumination of the Spatial Order of Intracellular pH by Genetically Encoded pH-Sensitive Sensors. Sensors 2013, 13, 16736–16758. 10.3390/s131216736. [DOI] [PMC free article] [PubMed] [Google Scholar]
- Hogue I. B.; Bosse J. B.; Engel E. A.; Scherer J.; Hu J. R.; Del Rio T.; Enquist L. W. Fluorescent Protein Approaches in Alpha Herpesvirus Research. Viruses 2015, 7, 5933–5961. 10.3390/v7112915. [DOI] [PMC free article] [PubMed] [Google Scholar]
- Jouvenet N.; Bieniasz P. D.; Simon S. M. Imaging the Biogenesis of Individual HIV-1 Virions in Live Cells. Nature 2008, 454, 236–240. 10.1038/nature06998. [DOI] [PMC free article] [PubMed] [Google Scholar]
- Hogue I. B.; Bosse J. B.; Hu J. R.; Thiberge S. Y.; Enquist L. W. Cellular Mechanisms of Alpha Herpesvirus Eegress: Live Cell Fluorescence Microscopy of Pseudorabies Virus Exocytosis. PLoS Pathog. 2014, 10, e1004535 10.1371/journal.ppat.1004535. [DOI] [PMC free article] [PubMed] [Google Scholar]
- Adam V.; Berardozzi R.; Byrdin M.; Bourgeois D. Phototransformable Fluorescent Proteins: Future Challenges. Curr. Opin. Chem. Biol. 2014, 20, 92–102. 10.1016/j.cbpa.2014.05.016. [DOI] [PubMed] [Google Scholar]
- Chudakov D. M.; Verkhusha V. V.; Staroverov D. B.; Souslova E. A.; Lukyanov S.; Lukyanov K. A. Photoswitchable Cyan Fluorescent Protein for Protein Tracking. Nat. Biotechnol. 2004, 22, 1435–1439. 10.1038/nbt1025. [DOI] [PubMed] [Google Scholar]
- Nemet I.; Ropelewski P.; Imanishi Y. Applications of Phototransformable Fluorescent Proteins for Tracking the Dynamics of Cellular Components. Photochem. Photobiol. Sci. 2015, 14, 1787–1806. 10.1039/C5PP00174A. [DOI] [PMC free article] [PubMed] [Google Scholar]
- Ando R.; Hama H.; Yamamoto-Hino M.; Mizuno H.; Miyawaki A. An Optical Marker Based on the UV-Induced Green-to-Red Photoconversion of a Fluorescent Protein. Proc. Natl. Acad. Sci. U. S. A. 2002, 99, 12651–12656. 10.1073/pnas.202320599. [DOI] [PMC free article] [PubMed] [Google Scholar]
- Patterson G. H.; Lippincott-Schwartz J. A Photoactivatable GFP for Selective Photolabeling of Proteins and Cells. Science 2002, 297, 1873–1877. 10.1126/science.1074952. [DOI] [PubMed] [Google Scholar]
- Zhou X. X.; Lin M. Z. Photoswitchable Fluorescent Proteins: Ten Years of Colorful Chemistry and Exciting Applications. Curr. Opin. Chem. Biol. 2013, 17, 682–690. 10.1016/j.cbpa.2013.05.031. [DOI] [PMC free article] [PubMed] [Google Scholar]
- Shroff H.; Galbraith C. G.; Galbraith J. A.; White H.; Gillette J.; Olenych S.; Davidson M. W.; Betzig E. Dual-Color Superresolution Imaging of Genetically Expressed Probes within Individual Adhesion Complexes. Proc. Natl. Acad. Sci. U. S. A. 2007, 104, 20308–20313. 10.1073/pnas.0710517105. [DOI] [PMC free article] [PubMed] [Google Scholar]
- Betzig E.; Patterson G. H.; Sougrat R.; Lindwasser O. W.; Olenych S.; Bonifacino J. S.; Davidson M. W.; Lippincott-Schwartz J.; Hess H. F. Imaging Intracellular Fluorescent Proteins at Nanometer Resolution. Science 2006, 313, 1642–1645. 10.1126/science.1127344. [DOI] [PubMed] [Google Scholar]
- Fernandez-Suarez M.; Ting A. Y. Fluorescent Probes for Super-Resolution Imaging in Living Cells. Nat. Rev. Mol. Cell Biol. 2008, 9, 929–943. 10.1038/nrm2531. [DOI] [PubMed] [Google Scholar]
- Bourgeois D.; Adam V. Reversible Photoswitching in Fluorescent Proteins: A Mechanistic View. IUBMB Life 2012, 64, 482–491. 10.1002/iub.1023. [DOI] [PubMed] [Google Scholar]
- Muranyi W.; Malkusch S.; Muller B.; Heilemann M.; Krausslich H. G. Super-Resolution Microscopy Reveals Specific Recruitment of HIV-1 Envelope Proteins to Viral Assembly Sites Dependent on the Envelope C-Terminal Tail. PLoS Pathog. 2013, 9, e1003198 10.1371/journal.ppat.1003198. [DOI] [PMC free article] [PubMed] [Google Scholar]
- Muller B.; Heilemann M. Shedding New Light on Viruses: Super-Resolution Microscopy for Studying Human Immunodeficiency Virus. Trends Microbiol. 2013, 21, 522–533. 10.1016/j.tim.2013.06.010. [DOI] [PubMed] [Google Scholar]
- Grove J. Super-Resolution Microscopy: A Virus’ Eye View of the Cell. Viruses 2014, 6, 1365–1378. 10.3390/v6031365. [DOI] [PMC free article] [PubMed] [Google Scholar]
- Manley S.; Gillette J. M.; Patterson G. H.; Shroff H.; Hess H. F.; Betzig E.; Lippincott-Schwartz J. High-Density Mapping of Single-Molecule Trajectories with Photoactivated Localization Microscopy. Nat. Methods 2008, 5, 155–157. 10.1038/nmeth.1176. [DOI] [PubMed] [Google Scholar]
- Gao X.; Cui Y.; Levenson R. M.; Chung L. W. K.; Nie S. In Vivo Cancer Targeting and Imaging with Semiconductor Quantum Dots. Nat. Biotechnol. 2004, 22, 969–976. 10.1038/nbt994. [DOI] [PubMed] [Google Scholar]
- Algar W. R.; Susumu K.; Delehanty J. B.; Medintz I. L. Semiconductor Quantum Dots in Bioanalysis: Crossing the Valley of Death. Anal. Chem. 2011, 83, 8826–8837. 10.1021/ac201331r. [DOI] [PubMed] [Google Scholar]
- Wegner K. D.; Hildebrandt N. Quantum Dots: Bright and Versatile in Vitro and in Vivo Fluorescence Imaging Biosensors. Chem. Soc. Rev. 2015, 44, 4792–4834. 10.1039/C4CS00532E. [DOI] [PubMed] [Google Scholar]
- Chen G.; Zhu J. Y.; Zhang Z. L.; Zhang W.; Ren J. G.; Wu M.; Hong Z. Y.; Lv C.; Pang D. W.; Zhao Y. F. Transformation of Cell-Derived Microparticles into Quantum-Dot-Labeled Nanovectors for Antitumor siRNA Delivery. Angew. Chem., Int. Ed. 2015, 54, 1036–1040. 10.1002/anie.201410223. [DOI] [PubMed] [Google Scholar]
- Rosenthal S. J.; Chang J. C.; Kovtun O.; McBride J. R.; Tomlinson I. D. Biocompatible Quantum Dots for Biological Applications. Chem. Biol. 2011, 18, 10–24. 10.1016/j.chembiol.2010.11.013. [DOI] [PMC free article] [PubMed] [Google Scholar]
- Jethi L.; Mack T. G.; Kambhampati P. Extending Semiconductor Nanocrystals from the Quantum Dot Regime to the Molecular Cluster Regime. J. Phys. Chem. C 2017, 121, 26102–26107. 10.1021/acs.jpcc.7b08439. [DOI] [Google Scholar]
- Zhou J.; Liu Y.; Tang J.; Tang W. Surface Ligands Engineering of Semiconductor Quantum Dots for Chemosensory and Biological Applications. Mater. Today 2017, 20, 360–376. 10.1016/j.mattod.2017.02.006. [DOI] [Google Scholar]
- Zhou J.; Yang Y.; Zhang C. Y. Toward Biocompatible Semiconductor Quantum Dots: From Biosynthesis and Bioconjugation to Biomedical Application. Chem. Rev. 2015, 115, 11669–11717. 10.1021/acs.chemrev.5b00049. [DOI] [PubMed] [Google Scholar]
- Zhang M.; Yue J.; Cui R.; Ma Z.; Wan H.; Wang F.; Zhu S.; Zhou Y.; Kuang Y.; Zhong Y.; et al. Bright Quantum Dots Emitting at Approximately 1,600 nm in the NIR-IIb Window for Deep Tissue Fluorescence Imaging. Proc. Natl. Acad. Sci. U. S. A. 2018, 115, 6590–6595. 10.1073/pnas.1806153115. [DOI] [PMC free article] [PubMed] [Google Scholar]
- Zhao J. Y.; Chen G.; Gu Y. P.; Cui R.; Zhang Z. L.; Yu Z. L.; Tang B.; Zhao Y. F.; Pang D. W. Ultrasmall Magnetically Engineered Ag2Se Quantum Dots for Instant Efficient Labeling and Whole-Body High-Resolution Multimodal Real-Time Tracking of Cell-Derived Microvesicles. J. Am. Chem. Soc. 2016, 138, 1893–1903. 10.1021/jacs.5b10340. [DOI] [PubMed] [Google Scholar]
- Gu Y. P.; Cui R.; Zhang Z. L.; Xie Z. X.; Pang D. W. Ultrasmall Near-Infrared Ag2Se Quantum Dots with Tunable Fluorescence for in Vivo Imaging. J. Am. Chem. Soc. 2012, 134, 79–82. 10.1021/ja2089553. [DOI] [PubMed] [Google Scholar]
- Alivisatos A. P.; Gu W. W.; Larabell C. Quantum Dots as Cellular Probes. Annu. Rev. Biomed. Eng. 2005, 7, 55–76. 10.1146/annurev.bioeng.7.060804.100432. [DOI] [PubMed] [Google Scholar]
- Gao X.; Yang L.; Petros J. A.; Marshall F. F.; Simons J. W.; Nie S. In Vivo Molecular and Cellular Imaging with Quantum Dots. Curr. Opin. Biotechnol. 2005, 16, 63–72. 10.1016/j.copbio.2004.11.003. [DOI] [PubMed] [Google Scholar]
- Bruchez M.; Moronne M.; Gin P.; Weiss S.; Alivisatos A. P. Semiconductor Nanocrystals as Fluorescent Biological Labels. Science 1998, 281, 2013–2016. 10.1126/science.281.5385.2013. [DOI] [PubMed] [Google Scholar]
- Smith A. M.; Duan H. W.; Mohs A. M.; Nie S. M. Bioconjugated Quantum Dots for in Vivo Molecular and Cellular Imaging. Adv. Drug Delivery Rev. 2008, 60, 1226–1240. 10.1016/j.addr.2008.03.015. [DOI] [PMC free article] [PubMed] [Google Scholar]
- Lidke D. S.; Nagy P.; Heintzmann R.; Arndt-Jovin D. J.; Post J. N.; Grecco H. E.; Jares-Erijman E. A.; Jovin T. M. Quantum Dot Ligands Provide New Insights into erbB/HER Receptor–Mediated Signal Transduction. Nat. Biotechnol. 2004, 22, 198–203. 10.1038/nbt929. [DOI] [PubMed] [Google Scholar]
- Srinivasan C.; Lee J.; Papadimitrakopoulos F.; Silbart L. K.; Zhao M.; Burgess D. J. Labeling and Intracellular Tracking of Functionally Active Plasmid DNA with Semiconductor Quantum Dots. Mol. Ther. 2006, 14, 192–201. 10.1016/j.ymthe.2006.03.010. [DOI] [PubMed] [Google Scholar]
- Wu X.; Liu H.; Liu J.; Haley K. N.; Treadway J. A.; Larson J. P.; Ge N.; Peale F.; Bruchez M. P. Immunofluorescent Labeling of Cancer Marker Her2 and Other Cellular Targets with Semiconductor Quantum Dots. Nat. Biotechnol. 2003, 21, 41–46. 10.1038/nbt764. [DOI] [PubMed] [Google Scholar]
- Chen C.; Peng J.; Xia H.; Wu Q.; Zeng L.; Xu H.; Tang H.; Zhang Z.; Zhu X.; Pang D.; et al. Quantum-Dot-Based Immunofluorescent Imaging of HER2 and ER Provides New Insights into Breast Cancer Heterogeneity. Nanotechnology 2010, 21, 095101 10.1088/0957-4484/21/9/095101. [DOI] [PubMed] [Google Scholar]
- Chen C.; Xia H. S.; Gong Y. P.; Peng J.; Peng C. W.; Hu M. B.; Zhu X. B.; Pang D. W.; Sun S. R.; Li Y. The Quantitative Detection of Total HER2 Load by Quantum Dots and the Identification of a New Subtype of Breast Cancer with Different 5-Year Prognosis. Biomaterials 2010, 31, 8818–8825. 10.1016/j.biomaterials.2010.07.091. [DOI] [PubMed] [Google Scholar]
- Chen C.; Liu S. L.; Cui R.; Huang B. H.; Tian Z. Q.; Jiang P.; Pang D. W.; Zhang Z. L. Diffusion Behaviors of Water-Soluble CdSe/ZnS Core/Shell Quantum Dots Investigated by Single-Particle Tracking. J. Phys. Chem. C 2008, 112, 18904–18910. 10.1021/jp807074t. [DOI] [Google Scholar]
- Gao X.; Wang T.; Wu B.; Chen J.; Chen J.; Yue Y.; Dai N.; Chen H.; Jiang X. Quantum Dots for Tracking Cellular Transport of Lectin-Functionalized Nanoparticles. Biochem. Biophys. Res. Commun. 2008, 377, 35–40. 10.1016/j.bbrc.2008.09.077. [DOI] [PubMed] [Google Scholar]
- Rajan S. S.; Liu H. Y.; Vu T. Q. Ligand-Bound Quantum Dot Probes for Studying the Molecular Scale Dynamics of Receptor Endocytic Trafficking in Live Cells. ACS Nano 2008, 2, 1153–1166. 10.1021/nn700399e. [DOI] [PubMed] [Google Scholar]
- Murcia M. J.; Minner D. E.; Mustata G. M.; Ritchie K.; Naumann C. A. Design of Quantum Dot-Conjugated Lipids for Long-Term, High-Speed Tracking Experiments on Cell Surfaces. J. Am. Chem. Soc. 2008, 130, 15054–15062. 10.1021/ja803325b. [DOI] [PMC free article] [PubMed] [Google Scholar]
- Medintz I. L.; Uyeda H. T.; Goldman E. R.; Mattoussi H. Quantum Dot Bioconjugates for Imaging, Labelling and Sensing. Nat. Mater. 2005, 4, 435–446. 10.1038/nmat1390. [DOI] [PubMed] [Google Scholar]
- Michalet X.; Pinaud F. F.; Bentolila L. A.; Tsay J. M.; Doose S.; Li J. J.; Sundaresan G.; Wu A. M.; Gambhir S. S.; Weiss S. Quantum Dots for Live Cells, in Vivo Imaging, and Diagnostics. Science 2005, 307, 538–544. 10.1126/science.1104274. [DOI] [PMC free article] [PubMed] [Google Scholar]
- Bentolila L. A.; Ebenstein Y.; Weiss S. Quantum Dots for in Vivo Small-Animal Imaging. J. Nucl. Med. 2009, 50, 493–496. 10.2967/jnumed.108.053561. [DOI] [PMC free article] [PubMed] [Google Scholar]
- Zrazhevskiy P.; Sena M.; Gao X. Designing Multifunctional Quantum Dots for Bioimaging, Detection, and Drug Delivery. Chem. Soc. Rev. 2010, 39, 4326–4354. 10.1039/b915139g. [DOI] [PMC free article] [PubMed] [Google Scholar]
- Ruan G.; Agrawal A.; Marcus A. I.; Nie S. Imaging and Tracking of Tat Peptide-Conjugated Quantum Dots in Living Cells: New Insights into Nanoparticle Uptake, Intracellular Transport, and Vesicle Shedding. J. Am. Chem. Soc. 2007, 129, 14759–14766. 10.1021/ja074936k. [DOI] [PubMed] [Google Scholar]
- Bruchez M. P. Quantum Dots Find Their Stride in Single Molecule Tracking. Curr. Opin. Chem. Biol. 2011, 15, 775–780. 10.1016/j.cbpa.2011.10.011. [DOI] [PMC free article] [PubMed] [Google Scholar]
- Tada H.; Higuchi H.; Wanatabe T. M.; Ohuchi N. In Vivo Real-Time Tracking of Single Quantum Dots Conjugated with Monoclonal Anti-HER2 Antibody in Tumors of Mice. Cancer Res. 2007, 67, 1138–1144. 10.1158/0008-5472.CAN-06-1185. [DOI] [PubMed] [Google Scholar]
- Wells N. P.; Lessard G. A.; Werner J. H. Confocal, Three-Dimensional Tracking of Individual Quantum Dots in High-Background Environments. Anal. Chem. 2008, 80, 9830–9834. 10.1021/ac8021899. [DOI] [PMC free article] [PubMed] [Google Scholar]
- Cui Z. Q.; Ren Q.; Wei H. P.; Chen Z.; Deng J. Y.; Zhang Z. P.; Zhang X. E. Quantum Dot-Aptamer Nanoprobes for Recognizing and Labeling Influenza A Virus Particles. Nanoscale 2011, 3, 2454–2457. 10.1039/c1nr10218d. [DOI] [PubMed] [Google Scholar]
- Saxton M. J.; Jacobson K. Single-Particle Tracking: Applications to Membrane Dynamics. Annu. Rev. Biophys. Biomol. Struct. 1997, 26, 373–399. 10.1146/annurev.biophys.26.1.373. [DOI] [PubMed] [Google Scholar]
- Kusumi A.; Sako Y.; Yamamoto M. Confined Lateral Diffusion of Membrane Receptors as Studied by Single Particle Tracking (Nanovid Microscopy). Effects of Calcium-Induced Differentiation in Cultured Epithelial Cells. Biophys. J. 1993, 65, 2021–2040. 10.1016/S0006-3495(93)81253-0. [DOI] [PMC free article] [PubMed] [Google Scholar]
- Wan X. Y.; Zheng L. L.; Gao P. F.; Yang X. X.; Li C. M.; Li Y. F.; Huang C. Z. Real-Time Light Scattering Tracking of Gold Nanoparticles- Bioconjugated Respiratory Syncytial Virus Infecting HEp-2 Cells. Sci. Rep. 2015, 4, 4529. 10.1038/srep04529. [DOI] [PMC free article] [PubMed] [Google Scholar]
- Marjomaki V.; Lahtinen T.; Martikainen M.; Koivisto J.; Malola S.; Salorinne K.; Pettersson M.; Hakkinen H. Site-Specific Targeting of Enterovirus Capsid by Functionalized Monodisperse Gold Nanoclusters. Proc. Natl. Acad. Sci. U. S. A. 2014, 111, 1277–1281. 10.1073/pnas.1310973111. [DOI] [PMC free article] [PubMed] [Google Scholar]
- Wan X. K.; Xu W. W.; Yuan S. F.; Gao Y.; Zeng X. C.; Wang Q. M. A Near-Infrared-Emissive Alkynyl-Protected Au24 Nanocluster. Angew. Chem., Int. Ed. 2015, 54, 9683–9686. 10.1002/anie.201503893. [DOI] [PubMed] [Google Scholar]
- Jin R.; Zeng C.; Zhou M.; Chen Y. Atomically Precise Colloidal Metal Nanoclusters and Nanoparticles: Fundamentals and Opportunities. Chem. Rev. 2016, 116, 10346–10413. 10.1021/acs.chemrev.5b00703. [DOI] [PubMed] [Google Scholar]
- Zhang L. B.; Wang E. K. Metal Nanoclusters: New Fluorescent Probes for Sensors and Bioimaging. Nano Today 2014, 9, 132–157. 10.1016/j.nantod.2014.02.010. [DOI] [Google Scholar]
- Shang L.; Dong S. J.; Nienhaus G. U. Ultra-Small Fluorescent Metal Nanoclusters: Synthesis and Biological Applications. Nano Today 2011, 6, 401–418. 10.1016/j.nantod.2011.06.004. [DOI] [Google Scholar]
- Draz M. S.; Fang B. A.; Li L. J.; Chen Z.; Wang Y. J.; Xu Y. H.; Yang J.; Killeen K.; Chen F. F. Hybrid Nanocluster Plasmonic Resonator for Lmmunological Detection of Hepatitis B Virus. ACS Nano 2012, 6, 7634–7643. 10.1021/nn3034056. [DOI] [PubMed] [Google Scholar]
- Shokri E.; Hosseini M.; Faridbod F.; Rahaie M. Rapid Pre-Symptomatic Recognition of Tristeza Viral RNA by a Novel Fluorescent Self-Dimerized DNA-Silver Nanocluster probe. RSC Adv. 2016, 6, 99437–99443. 10.1039/C6RA15199J. [DOI] [Google Scholar]
- Tao Y.; Li M.; Ren J.; Qu X. Metal Nanoclusters: Novel Probes for Diagnostic and Therapeutic Applications. Chem. Soc. Rev. 2015, 44, 8636–8663. 10.1039/C5CS00607D. [DOI] [PubMed] [Google Scholar]
- Basle E.; Joubert N.; Pucheault M. Protein Chemical Modification on Endogenous Amino Acids. Chem. Biol. 2010, 17, 213–227. 10.1016/j.chembiol.2010.02.008. [DOI] [PubMed] [Google Scholar]
- Hong Z. Y.; Zhang Z. L.; Tang B.; Ao J.; Wang C.; Yu C.; Pang D. W. Equipping Inner Central Components of Influenza A Virus with Quantum Dots. Anal. Chem. 2018, 90, 14020–14028. 10.1021/acs.analchem.8b03995. [DOI] [PubMed] [Google Scholar]
- Huisgen R. 1.3-Dipolare Cycloadditionen Rückschau und Ausblick. Angew. Chem. 1963, 75, 604–637. 10.1002/ange.19630751304. [DOI] [Google Scholar]
- Kolb H. C.; Finn M. G.; Sharpless K. B. Click Chemistry: Diverse Chemical Function from a Few Good Reactions. Angew. Chem., Int. Ed. 2001, 40, 2004–2021. 10.1002/1521-3773(20010601)40:11<2004::AID-ANIE2004>3.0.CO;2-5. [DOI] [PubMed] [Google Scholar]
- Nwe K.; Brechbiel M. W. Growing Applications of ″Click Chemistry″ for Bioconjugation in Contemporary Biomedical Research. Cancer Biother.Radiopharm. 2009, 24, 289–302. 10.1089/cbr.2008.0626. [DOI] [PMC free article] [PubMed] [Google Scholar]
- Codelli J. A.; Baskin J. M.; Agard N. J.; Bertozzi C. R. Second-Generation Difluorinated Cyclooctynes for Copper-Free Click Chemistry. J. Am. Chem. Soc. 2008, 130, 11486–11493. 10.1021/ja803086r. [DOI] [PMC free article] [PubMed] [Google Scholar]
- Baskin J. M.; Prescher J. A.; Laughlin S. T.; Agard N. J.; Chang P. V.; Miller I. A.; Lo A.; Codelli J. A.; Bertozzi C. R. Copper-Free Click Chemistry for Dynamic in Vivo Imaging. Proc. Natl. Acad. Sci. U. S. A. 2007, 104, 16793–16797. 10.1073/pnas.0707090104. [DOI] [PMC free article] [PubMed] [Google Scholar]
- Hoyle C. E.; Bowman C. N. Thiol-Ene Click Chemistry. Angew. Chem., Int. Ed. 2010, 49, 1540–1573. 10.1002/anie.200903924. [DOI] [PubMed] [Google Scholar]
- Nikic I.; Plass T.; Schraidt O.; Szymanski J.; Briggs J. A.; Schultz C.; Lemke E. A. Minimal Tags for Rapid Dual-Color Live-Cell Labeling and Super-Resolution Microscopy. Angew. Chem., Int. Ed. 2014, 53, 2245–2249. 10.1002/anie.201309847. [DOI] [PubMed] [Google Scholar]
- Salic A.; Mitchison T. J. A Chemical Method for Fast and Sensitive Detection of DNA Synthesis in Vivo. Proc. Natl. Acad. Sci. U. S. A. 2008, 105, 2415–2420. 10.1073/pnas.0712168105. [DOI] [PMC free article] [PubMed] [Google Scholar]
- Jao C. Y.; Salic A. Exploring RNA Transcription and Turnover in Vivo by Using Click Chemistry. Proc. Natl. Acad. Sci. U. S. A. 2008, 105, 15779–15784. 10.1073/pnas.0808480105. [DOI] [PMC free article] [PubMed] [Google Scholar]
- Jewett J. C.; Bertozzi C. R. Cu-Free Click Cycloaddition Reactions in Chemical Biology. Chem. Soc. Rev. 2010, 39, 1272–1279. 10.1039/b901970g. [DOI] [PMC free article] [PubMed] [Google Scholar]
- Rubino F. A.; Oum Y. H.; Rajaram L.; Chu Y.; Carrico I. S. Chemoselective Modification of Viral Surfaces via Bioorthogonal Click Chemistry. J. Visualized Exp. 2012, e4246 10.3791/4246. [DOI] [PMC free article] [PubMed] [Google Scholar]
- Oum Y. H.; Desai T. M.; Marin M.; Melikyan G. B. Click Labeling of Unnatural Sugars Metabolically Incorporated into Viral Envelope Glycoproteins Enables Visualization of Single Particle Fusion. J. Virol. Methods 2016, 233, 62–71. 10.1016/j.jviromet.2016.02.016. [DOI] [PMC free article] [PubMed] [Google Scholar]
- Huang L. L.; Lu G. H.; Hao J.; Wang H. Z.; Yin D. L.; Xie H. Y. Enveloped Virus Labeling via Both Intrinsic Biosynthesis and Metabolic Incorporation of Phospholipids in Host Cells. Anal. Chem. 2013, 85, 5263–5270. 10.1021/ac4008144. [DOI] [PubMed] [Google Scholar]
- Hou W.; Li Y.; Kang W.; Wang X.; Wu X.; Wang S.; Liu F. Real-Time Analysis of Quantum Dot Labeled Single Porcine Epidemic Diarrhea Virus Moving along the Microtubules Using Single Particle Tracking. Sci. Rep. 2019, 9, 1307. 10.1038/s41598-018-37789-9. [DOI] [PMC free article] [PubMed] [Google Scholar]
- Lin S.; Yan H.; Li L.; Yang M.; Peng B.; Chen S.; Li W.; Chen P. R. Site-Specific Engineering of Chemical Functionalities on the Surface of Live Hepatitis D Virus. Angew. Chem., Int. Ed. 2013, 52, 13970–13974. 10.1002/anie.201305787. [DOI] [PubMed] [Google Scholar]
- Huang L. L.; Liu K.; Zhang Q.; Xu J.; Zhao D.; Zhu H.; Xie H. Y. Integrating Two Efficient and Specific Bioorthogonal Ligation Reactions with Natural Metabolic Incorporation in One Cell for Virus Dual Labeling. Anal. Chem. 2017, 89, 11620–11627. 10.1021/acs.analchem.7b03043. [DOI] [PubMed] [Google Scholar]
- Wang I. H.; Suomalainen M.; Andriasyan V.; Kilcher S.; Mercer J.; Neef A.; Luedtke N. W.; Greber U. F. Tracking Viral Genomes in Host Cells at Single-Molecule Resolution. Cell Host Microbe 2013, 14, 468–480. 10.1016/j.chom.2013.09.004. [DOI] [PubMed] [Google Scholar]
- Green N. M.Avidin and Streptavidin. Methods Enzymol; Elsevier: 1990; Vol. 184, pp 51–67. [DOI] [PubMed] [Google Scholar]
- Zhang F.; Zheng Z.; Liu S. L.; Lu W.; Zhang Z.; Zhang C.; Zhou P.; Zhang Y.; Long G.; He Z.; et al. Self-Biotinylation and Site-Specific Double Labeling of Baculovirus Using Quantum Dots for Single-Virus in-Situ Tracking. Biomaterials 2013, 34, 7506–7518. 10.1016/j.biomaterials.2013.06.030. [DOI] [PubMed] [Google Scholar]
- Liu J.; Xu M.; Tang B.; Hu L.; Deng F.; Wang H.; Pang D. W.; Hu Z.; Wang M.; Zhou Y. Single-Particle Tracking Reveals the Sequential Entry Process of the Bunyavirus Severe Fever with Thrombocytopenia Syndrome Virus. Small 2019, 15, e1803788 10.1002/smll.201803788. [DOI] [PubMed] [Google Scholar]
- Liu J.; Yu C.; Gui J. F.; Pang D. W.; Zhang Q. Y. Real-Time Dissecting the Entry and Intracellular Dynamics of Single Reovirus Particle. Front. Microbiol. 2018, 9, 2797. 10.3389/fmicb.2018.02797. [DOI] [PMC free article] [PubMed] [Google Scholar]
- Dixit S. K.; Goicochea N. L.; Daniel M. C.; Murali A.; Bronstein L.; De M.; Stein B.; Rotello V. M.; Kao C. C.; Dragnea B. Quantum Dot Encapsulation in Viral Capsids. Nano Lett. 2006, 6, 1993–1999. 10.1021/nl061165u. [DOI] [PubMed] [Google Scholar]
- Huang B. H.; Lin Y.; Zhang Z. L.; Zhuan F.; Liu A. A.; Xie M.; Tian Z. Q.; Zhang Z.; Wang H.; Pang D. W. Surface Labeling of Enveloped Viruses Assisted by Host Cells. ACS Chem. Biol. 2012, 7, 683–688. 10.1021/cb2001878. [DOI] [PubMed] [Google Scholar]
- You J. O.; Liu Y. S.; Liu Y. C.; Joo K. I.; Peng C. A. Incorporation of Quantum Dots on Virus in Polycationic Solution. Int. J. Nanomedicine 2006, 1, 59–64. 10.2147/nano.2006.1.1.59. [DOI] [PMC free article] [PubMed] [Google Scholar]
- Chen Y. H.; Wang C. H.; Chang C. W.; Peng C. A. In Situ Formation of Viruses Tagged with Quantum Dots. Integr. Biol. 2010, 2, 258–264. 10.1039/b926852a. [DOI] [PubMed] [Google Scholar]
- Li F.; Zhang Z. P.; Peng J.; Cui Z. Q.; Pang D. W.; Li K.; Wei H. P.; Zhou Y. F.; Wen J. K.; Zhang X. E. Imaging Viral Behavior in Mammalian Cells with Self-Assembled Capsid-Quantum-Dot Hybrid Particles. Small 2009, 5, 718–726. 10.1002/smll.200801303. [DOI] [PubMed] [Google Scholar]
- Johnson H. E.; Haugh J. M. Quantitative Analysis of Phosphoinositide 3-Kinase (PI3K) Signaling Using Live-Cell Total Internal Reflection Fluorescence (TIRF) Microscopy. Curr. Protoc. Cell Biol. 2013, 61, 14.14.1–14.14.24. 10.1002/0471143030.cb1414s61. [DOI] [PubMed] [Google Scholar]
- Chen I.; Ting A. Y. Site-Specific Labeling of Proteins with Small Molecules in Live Cells. Curr. Opin. Biotechnol. 2005, 16, 35–40. 10.1016/j.copbio.2004.12.003. [DOI] [PubMed] [Google Scholar]
- Gong Y. K.; Pan L. F. Recent Advances in Bioorthogonal Reactions for Site-Specific Protein Labeling and Engineering. Tetrahedron Lett. 2015, 56, 2123–2132. 10.1016/j.tetlet.2015.03.065. [DOI] [Google Scholar]
- Zhang G.; Zheng S. Q.; Liu H. P.; Chen P. R. Illuminating Biological Processes through Site-Specific Protein Labeling. Chem. Soc. Rev. 2015, 44, 3405–3417. 10.1039/C4CS00393D. [DOI] [PubMed] [Google Scholar]
- Jing C.; Cornish V. W. Chemical Tags for Labeling Proteins inside Living Cells. Acc. Chem. Res. 2011, 44, 784–792. 10.1021/ar200099f. [DOI] [PMC free article] [PubMed] [Google Scholar]
- Klein T.; Loschberger A.; Proppert S.; Wolter S.; van de Linde S.; Sauer M. Live-Cell dSTORM with SNAP-Tag Fusion Proteins. Nat. Methods 2011, 8, 7–9. 10.1038/nmeth0111-7b. [DOI] [PubMed] [Google Scholar]
- Chen Z.; Cornish V. W.; Min W. Chemical Tags: Inspiration for Advanced Imaging Techniques. Curr. Opin. Chem. Biol. 2013, 17, 637–643. 10.1016/j.cbpa.2013.05.018. [DOI] [PubMed] [Google Scholar]
- Wombacher R.; Cornish V. W. Chemical Tags: Applications in Live Cell Fluorescence Imaging. J. Biophotonics 2011, 4, 391–402. 10.1002/jbio.201100018. [DOI] [PubMed] [Google Scholar]
- Specht E. A.; Braselmann E.; Palmer A. E. A Critical and Comparative Review of Fluorescent Tools for Live-Cell Imaging. Annu. Rev. Physiol. 2017, 79, 93–117. 10.1146/annurev-physiol-022516-034055. [DOI] [PMC free article] [PubMed] [Google Scholar]
- Eckhardt M.; Anders M.; Muranyi W.; Heilemann M.; Krijnse-Locker J.; Muller B. A SNAP-Tagged Derivative of HIV-1--A Versatile Tool to Study Virus-Cell Interactions. PLoS One 2011, 6, e22007 10.1371/journal.pone.0022007. [DOI] [PMC free article] [PubMed] [Google Scholar]
- Hanne J.; Gottfert F.; Schimer J.; Anders-Osswein M.; Konvalinka J.; Engelhardt J.; Muller B.; Hell S. W.; Krausslich H. G. Stimulated Emission Depletion Nanoscopy Reveals Time-Course of Human Immunodeficiency Virus Proteolytic Maturation. ACS Nano 2016, 10, 8215–8222. 10.1021/acsnano.6b03850. [DOI] [PubMed] [Google Scholar]
- Sun X.; Zhang A.; Baker B.; Sun L.; Howard A.; Buswell J.; Maurel D.; Masharina A.; Johnsson K.; Noren C. J.; et al. Development of SNAP-Tag Fluorogenic Probes for Wash-Free Fluorescence Imaging. ChemBioChem 2011, 12, 2217–2226. 10.1002/cbic.201100173. [DOI] [PMC free article] [PubMed] [Google Scholar]
- Keppler A.; Pick H.; Arrivoli C.; Vogel H.; Johnsson K. Labeling of Fusion Proteins with Synthetic Fluorophores in Live Cells. Proc. Natl. Acad. Sci. U. S. A. 2004, 101, 9955–9959. 10.1073/pnas.0401923101. [DOI] [PMC free article] [PubMed] [Google Scholar]
- Lavis L. D. Teaching Old Dyes New Tricks: Biological Probes Built from Fluoresceins and Rhodamines. Annu. Rev. Biochem. 2017, 86, 825–843. 10.1146/annurev-biochem-061516-044839. [DOI] [PubMed] [Google Scholar]
- Ross-Thriepland D.; Mankouri J.; Harris M. Serine Phosphorylation of the Hepatitis C Virus NS5A Protein Controls the Establishment of Replication Complexes. J. Virol. 2015, 89, 3123–3135. 10.1128/JVI.02995-14. [DOI] [PMC free article] [PubMed] [Google Scholar]
- Gautier A.; Juillerat A.; Heinis C.; Correa I. R. Jr.; Kindermann M.; Beaufils F.; Johnsson K. An Engineered Protein Tag for Multiprotein Labeling in Living Cells. Chem. Biol. 2008, 15, 128–136. 10.1016/j.chembiol.2008.01.007. [DOI] [PubMed] [Google Scholar]
- Liu A. A.; Zhang Z.; Sun E. Z.; Zheng Z.; Zhang Z. L.; Hu Q.; Wang H.; Pang D. W. Simultaneous Visualization of Parental and Progeny Viruses by a Capsid-Specific HaloTag Labeling Strategy. ACS Nano 2016, 10, 1147–1155. 10.1021/acsnano.5b06438. [DOI] [PubMed] [Google Scholar]
- Los G. V.; Encell L. P.; McDougall M. G.; Hartzell D. D.; Karassina N.; Zimprich C.; Wood M. G.; Learish R.; Ohana R. F.; Urh M.; et al. HaloTag: A Novel Protein Labeling Technology for Cell Imaging and Protein Analysis. ACS Chem. Biol. 2008, 3, 373–382. 10.1021/cb800025k. [DOI] [PubMed] [Google Scholar]
- Chen Z.; Jing C.; Gallagher S. S.; Sheetz M. P.; Cornish V. W. Second-Generation Covalent TMP-Tag for Live Cell Imaging. J. Am. Chem. Soc. 2012, 134, 13692–13699. 10.1021/ja303374p. [DOI] [PMC free article] [PubMed] [Google Scholar]
- Gallagher S. S.; Jing C.; Peterka D. S.; Konate M.; Wombacher R.; Kaufman L. J.; Yuste R.; Cornish V. W. A Trimethoprim-Based Chemical Tag for Live Cell Two-Photon Imaging. ChemBioChem 2010, 11, 782–784. 10.1002/cbic.200900731. [DOI] [PMC free article] [PubMed] [Google Scholar]
- Wombacher R.; Heidbreder M.; van de Linde S.; Sheetz M. P.; Heilemann M.; Cornish V. W.; Sauer M. Live-Cell Super-Resolution Imaging with Trimethoprim Conjugates. Nat. Methods 2010, 7, 717–719. 10.1038/nmeth.1489. [DOI] [PubMed] [Google Scholar]
- Miller L. W.; Cai Y.; Sheetz M. P.; Cornish V. W. In Vivo Protein Labeling with Trimethoprim Conjugates: A Flexible Chemical Tag. Nat. Methods 2005, 2, 255–257. 10.1038/nmeth749. [DOI] [PubMed] [Google Scholar]
- Rudner L.; Nydegger S.; Coren L. V.; Nagashima K.; Thali M.; Ott D. E. Dynamic Fluorescent Imaging of Human Immunodeficiency Virus Type 1 Gag in Live Cells by Biarsenical Labeling. J. Virol. 2005, 79, 4055–4065. 10.1128/JVI.79.7.4055-4065.2005. [DOI] [PMC free article] [PubMed] [Google Scholar]
- Das S. C.; Panda D.; Nayak D.; Pattnaik A. K. Biarsenical Labeling of Vesicular Stomatitis Virus Encoding Tetracysteine-Tagged M Protein Allows Dynamic Imaging of M Protein and Virus Uncoating in Infected Cells. J. Virol. 2009, 83, 2611–2622. 10.1128/JVI.01668-08. [DOI] [PMC free article] [PubMed] [Google Scholar]
- Li Y.; Lu X.; Li J.; Berube N.; Giest K. L.; Liu Q.; Anderson D. H.; Zhou Y. Genetically Engineered, Biarsenically Labeled Influenza Virus Allows Visualization of Viral NS1 Protein in Living Cells. J. Virol. 2010, 84, 7204–7213. 10.1128/JVI.00203-10. [DOI] [PMC free article] [PubMed] [Google Scholar]
- Martin B. R.; Giepmans B. N.; Adams S. R.; Tsien R. Y. Mammalian Cell-Based Optimization of the Biarsenical-Binding Tetracysteine Motif for Improved Fluorescence and Affinity. Nat. Biotechnol. 2005, 23, 1308–1314. 10.1038/nbt1136. [DOI] [PubMed] [Google Scholar]
- Adams S. R.; Campbell R. E.; Gross L. A.; Martin B. R.; Walkup G. K.; Yao Y.; Llopis J.; Tsien R. Y. New Biarsenical Ligands and Tetracysteine Motifs for Protein Labeling in Vitro and in Vivo: Synthesis and Biological Applications. J. Am. Chem. Soc. 2002, 124, 6063–6076. 10.1021/ja017687n. [DOI] [PubMed] [Google Scholar]
- Zheng L. L.; Li C. M.; Zhen S. J.; Li Y. F.; Huang C. Z. His-Tag Based in Situ Labelling of Progeny Viruses for Real-Time Single Virus Tracking in Living Cells. Nanoscale 2016, 8, 18635–18639. 10.1039/C6NR05806J. [DOI] [PubMed] [Google Scholar]
- Guignet E. G.; Hovius R.; Vogel H. Reversible Site-Selective Labeling of Membrane Proteins in Live Cells. Nat. Biotechnol. 2004, 22, 440–444. 10.1038/nbt954. [DOI] [PubMed] [Google Scholar]
- Chen I.; Howarth M.; Lin W.; Ting A. Y. Site-Specific Labeling of Cell Surface Proteins with Biophysical Probes Using Biotin Ligase. Nat. Methods 2005, 2, 99–104. 10.1038/nmeth735. [DOI] [PubMed] [Google Scholar]
- Howarth M.; Ting A. Y. Imaging Proteins in Live Mammalian Cells with Biotin Ligase and Monovalent Streptavidin. Nat. Protoc. 2008, 3, 534–545. 10.1038/nprot.2008.20. [DOI] [PMC free article] [PubMed] [Google Scholar]
- Uttamapinant C.; White K. A.; Baruah H.; Thompson S.; Fernandez-Suarez M.; Puthenveetil S.; Ting A. Y. A Fluorophore Ligase for Site-Specific Protein Labeling inside Living Cells. Proc. Natl. Acad. Sci. U. S. A. 2010, 107, 10914–10919. 10.1073/pnas.0914067107. [DOI] [PMC free article] [PubMed] [Google Scholar]
- Fernandez-Suarez M.; Baruah H.; Martinez-Hernandez L.; Xie K. T.; Baskin J. M.; Bertozzi C. R.; Ting A. Y. Redirecting Lipoic Acid Ligase for Cell Surface Protein Labeling with Small-Molecule Probes. Nat. Biotechnol. 2007, 25, 1483–1487. 10.1038/nbt1355. [DOI] [PMC free article] [PubMed] [Google Scholar]
- Schumacher D.; Helma J.; Mann F. A.; Pichler G.; Natale F.; Krause E.; Cardoso M. C.; Hackenberger C. P.; Leonhardt H. Versatile and Efficient Site-Specific Protein Functionalization by Tubulin Tyrosine Ligase. Angew. Chem., Int. Ed. 2015, 54, 13787–13791. 10.1002/anie.201505456. [DOI] [PubMed] [Google Scholar]
- Schumacher D.; Lemke O.; Helma J.; Gerszonowicz L.; Waller V.; Stoschek T.; Durkin P. M.; Budisa N.; Leonhardt H.; Keller B. G.; et al. Broad Substrate Tolerance of Tubulin Tyrosine Ligase Enables One-Step Site-Specific Enzymatic Protein Labeling. Chem. Sci. 2017, 8, 3471–3478. 10.1039/C7SC00574A. [DOI] [PMC free article] [PubMed] [Google Scholar]
- Zhou Z.; Cironi P.; Lin A. J.; Xu Y.; Hrvatin S.; Golan D. E.; Silver P. A.; Walsh C. T.; Yin J. Genetically Encoded Short Peptide Tags for Orthogonal Protein Labeling by Sfp and AcpS Phosphopantetheinyl Transferases. ACS Chem. Biol. 2007, 2, 337–346. 10.1021/cb700054k. [DOI] [PubMed] [Google Scholar]
- Yin J.; Straight P. D.; McLoughlin S. M.; Zhou Z.; Lin A. J.; Golan D. E.; Kelleher N. L.; Kolter R.; Walsh C. T. Genetically Encoded Short Peptide Tag for Versatile Protein Labeling by Sfp Phosphopantetheinyl Transferase. Proc. Natl. Acad. Sci. U. S. A. 2005, 102, 15815–15820. 10.1073/pnas.0507705102. [DOI] [PMC free article] [PubMed] [Google Scholar]
- Crivat G.; Taraska J. W. Imaging Proteins inside Cells with Fluorescent Tags. Trends Biotechnol. 2012, 30, 8–16. 10.1016/j.tibtech.2011.08.002. [DOI] [PMC free article] [PubMed] [Google Scholar]
- Hoehnel S.; Lutolf M. P. Capturing Cell-Cell Interactions via SNAP-tag and CLIP-tag Technology. Bioconjugate Chem. 2015, 26, 1678–1686. 10.1021/acs.bioconjchem.5b00268. [DOI] [PubMed] [Google Scholar]
- Liss V.; Barlag B.; Nietschke M.; Hensel M. Self-Labelling Enzymes as Universal Tags for Fluorescence Microscopy, Super-Resolution Microscopy and Rectron Microscopy. Sci. Rep. 2016, 5, 17740. 10.1038/srep17740. [DOI] [PMC free article] [PubMed] [Google Scholar]
- Jing C.; Cornish V. W. A Fluorogenic TMP-Tag for High Signal-to-Background Intracellular Live Cell Imaging. ACS Chem. Biol. 2013, 8, 1704–1712. 10.1021/cb300657r. [DOI] [PMC free article] [PubMed] [Google Scholar]
- Lai Y. T.; Chang Y. Y.; Hu L.; Yang Y.; Chao A.; Du Z. Y.; Tanner J. A.; Chye M. L.; Qian C.; Ng K. M.; et al. Rapid Labeling of Intracellular His-Tagged Proteins in Living Cells. Proc. Natl. Acad. Sci. U. S. A. 2015, 112, 2948–2953. 10.1073/pnas.1419598112. [DOI] [PMC free article] [PubMed] [Google Scholar]
- Stephanopoulos N.; Francis M. B. Choosing an Effective Protein Bioconjugation Strategy. Nat. Chem. Biol. 2011, 7, 876–884. 10.1038/nchembio.720. [DOI] [PubMed] [Google Scholar]
- Howarth M.; Takao K.; Hayashi Y.; Ting A. Y. Targeting Quantum Dots to Surface Proteins in Living Cells with Biotin Ligase. Proc. Natl. Acad. Sci. U. S. A. 2005, 102, 7583–7588. 10.1073/pnas.0503125102. [DOI] [PMC free article] [PubMed] [Google Scholar]
- Cohen J. D.; Zou P.; Ting A. Y. Site-Specific Protein Modification Using Lipoic Acid Ligase and Bis-Aryl Hydrazone Formation. ChemBioChem 2012, 13, 888–894. 10.1002/cbic.201100764. [DOI] [PMC free article] [PubMed] [Google Scholar]
- Lotze J.; Reinhardt U.; Seitz O.; Beck-Sickinger A. G. Peptide-Tags for Site-Specific Protein Labelling in Vitro and in Vivo. Mol. BioSyst. 2016, 12, 1731–1745. 10.1039/C6MB00023A. [DOI] [PubMed] [Google Scholar]
- Sunbul M.; Yen M.; Zou Y.; Yin J. Enzyme Catalyzed Site-Specific Protein Labeling and Cell Imaging with Quantum Dots. Chem. Commun. 2008, 5927–5929. 10.1039/b812162a. [DOI] [PubMed] [Google Scholar]
- Zhang Y.; Ke X.; Zheng Z.; Zhang C.; Zhang Z.; Zhang F.; Hu Q.; He Z.; Wang H. Encapsulating Quantum Dots into Enveloped Virus in Living Cells for Tracking Virus Infection. ACS Nano 2013, 7, 3896–3904. 10.1021/nn305189n. [DOI] [PubMed] [Google Scholar]
- Molenaar C.; Marras S. A.; Slats J. C.; Truffert J. C.; Lemaitre M.; Raap A. K.; Dirks R. W.; Tanke H. J. Linear 2’ O-Methyl RNA Probes for the Visualization of RNA in Living Cells. Nucleic Acids Res. 2001, 29, E89–9. 10.1093/nar/29.17.e89. [DOI] [PMC free article] [PubMed] [Google Scholar]
- Ma Y.; Mao G.; Huang W.; Wu G.; Yin W.; Ji X.; Deng Z.; Cai Z.; Zhang X. E.; He Z.; et al. Quantum Dot Nanobeacons for Single RNA Labeling and Imaging. J. Am. Chem. Soc. 2019, 141, 13454–13458. 10.1021/jacs.9b04659. [DOI] [PubMed] [Google Scholar]
- Ortega-Arroyo J.; Kukura P. Interferometric Scattering Microscopy (iSCAT): New Frontiers in Ultrafast and Ultrasensitive Optical Microscopy. Phys. Chem. Chem. Phys. 2012, 14, 15625–15636. 10.1039/c2cp41013c. [DOI] [PubMed] [Google Scholar]
- Kukura P.; Ewers H.; Muller C.; Renn A.; Helenius A.; Sandoghdar V. High-Speed Nanoscopic Tracking of the Position and Orientation of a Single Virus. Nat. Methods 2009, 6, 923–927. 10.1038/nmeth.1395. [DOI] [PubMed] [Google Scholar]
- Renz M. Fluorescence Microscopy-A Historical and Technical Perspective. Cytometry, Part A 2013, 83, 767–779. 10.1002/cyto.a.22295. [DOI] [PubMed] [Google Scholar]
- Lorenz K. S.; Salama P.; Dunn K. W.; Delp E. J. Digital Correction of Motion Artefacts in Microscopy Image Sequences Collected from Living Animals Using Rigid and Nonrigid Registration. J. Microsc. 2012, 245, 148–160. 10.1111/j.1365-2818.2011.03557.x. [DOI] [PMC free article] [PubMed] [Google Scholar]
- Combs C. A.; Shroff H. Fluorescence Microscopy: A Concise Guide to Current Imaging Methods. Curr. Protoc. Neurosci. 2017, 79, 2.1.1–2.1.25. 10.1002/cpns.29. [DOI] [PubMed] [Google Scholar]
- Masters B. R. Fluorescence Microscopy: from Principles to Biological Applications. J. Biomed. Opt. 2014, 19, 049901 10.1117/1.JBO.19.4.049901. [DOI] [Google Scholar]
- Ma Y. Y.; Wang X.; Liu H.; Wei L.; Xiao L. H. Recent Advances in Optical Microscopic Methods for Single-Particle Tracking in Biological Samples. Anal. Bioanal. Chem. 2019, 411, 4445–4463. 10.1007/s00216-019-01638-z. [DOI] [PubMed] [Google Scholar]
- Deschout H.; Cella Zanacchi F.; Mlodzianoski M.; Diaspro A.; Bewersdorf J.; Hess S. T.; Braeckmans K. Precisely and Accurately Localizing Single Emitters in Fluorescence Microscopy. Nat. Methods 2014, 11, 253–266. 10.1038/nmeth.2843. [DOI] [PubMed] [Google Scholar]
- Lichtman J. W.; Conchello J. A. Fluorescence Microscopy. Nat. Methods 2005, 2, 910–919. 10.1038/nmeth817. [DOI] [PubMed] [Google Scholar]
- Beier H. T.; Ibey B. L. Experimental Comparison of the High-Speed Imaging Performance of an EM-CCD and sCMOS Camera in a Dynamic Live-Cell Imaging Test Case. PLoS One 2014, 9, e84614 10.1371/journal.pone.0084614. [DOI] [PMC free article] [PubMed] [Google Scholar]
- Long F.; Zeng S.; Huang Z. L. Localization-Based Super-Resolution Microscopy with an sCMOS Camera Part II: Experimental Methodology for Comparing sCMOS with EMCCD Cameras. Opt. Express 2012, 20, 17741–17759. 10.1364/OE.20.017741. [DOI] [PubMed] [Google Scholar]
- Fullerton S. A Guide to Choosing and Using Scientific Imaging Cameras. Laser Focus World 2014, 50, 37–40. [Google Scholar]
- Ivanchenko S.; Godinez W. J.; Lampe M.; Krausslich H. G.; Eils R.; Rohr K.; Brauchle C.; Muller B.; Lamb D. C. Dynamics of HIV-1 Assembly and Release. PLoS Pathog. 2009, 5, e1000652 10.1371/journal.ppat.1000652. [DOI] [PMC free article] [PubMed] [Google Scholar]
- Axelrod D. Cell-Substrate Contacts Illuminated by Total Internal Reflection Fluorescence. J. Cell Biol. 1981, 89, 141–145. 10.1083/jcb.89.1.141. [DOI] [PMC free article] [PubMed] [Google Scholar]
- Axelrod D. Total Internal Reflection Fluorescence Microscopy in Cell Biology. Traffic 2001, 2, 764–774. 10.1034/j.1600-0854.2001.21104.x. [DOI] [PubMed] [Google Scholar]
- Reichert W. M.; Truskey G. A. Total Internal Reflection Fluorescence (TIRF) Microscopy. I. Modelling Cell Contact Region Fluorescence. J. Cell Sci. 1990, 96, 219–230. [DOI] [PubMed] [Google Scholar]
- Johnson C.Spectroscopy and Dynamics of Single Molecules: Methods and Applications; Elsevier: 2019. [Google Scholar]
- Tokunaga M.; Kitamura K.; Saito K.; Iwane A. H.; Yanagida T. Single Molecule Imaging of Fluorophores and Enzymatic Reactions Achieved by Objective-Type Total Internal Reflection Fluorescence Microscopy. Biochem. Biophys. Res. Commun. 1997, 235, 47–53. 10.1006/bbrc.1997.6732. [DOI] [PubMed] [Google Scholar]
- Parhamifar L.; Moghimi S. M. Total Internal Reflection Fluorescence (TIRF) Microscopy for Real-Time Imaging of Nanoparticle-Cell Plasma Membrane Interaction. Methods Mol. Biol. 2012, 906, 473–482. 10.1007/978-1-61779-953-2_38. [DOI] [PubMed] [Google Scholar]
- Fish K. N. Total Internal Reflection Fluorescence (TIRF) Microscopy. Curr. Protoc. Cytom. 2009, 12, 12–18. 10.1002/0471142956.cy1218s50. [DOI] [PMC free article] [PubMed] [Google Scholar]
- Mattheyses A. L.; Simon S. M.; Rappoport J. Z. Imaging with Total Internal Reflection Fluorescence Microscopy for the Cell Biologist. J. Cell Sci. 2010, 123, 3621–3628. 10.1242/jcs.056218. [DOI] [PMC free article] [PubMed] [Google Scholar]
- Johnson D. S.; Jaiswal J. K.; Simon S. Total Internal Reflection Fluorescence (TIRF) Microscopy Illuminator for Improved Imaging of Cell Surface Events. Curr. Protoc. Cytom. 2012, 12, 12–29. 10.1002/0471142956.cy1229s61. [DOI] [PubMed] [Google Scholar]
- Ewers H.; Schelhaas M. Analysis of Virus Entry and Cellular Membrane Dynamics by Single Particle Tracking. Methods Enzymol. 2012, 506, 63–80. 10.1016/B978-0-12-391856-7.00028-7. [DOI] [PubMed] [Google Scholar]
- Tokunaga M.; Imamoto N.; Sakata-Sogawa K. Highly Inclined Thin Illumination Enables Clear Single-Molecule Imaging in Cells. Nat. Methods 2008, 5, 159–161. 10.1038/nmeth1171. [DOI] [PubMed] [Google Scholar]
- Schmidt F. I.; Kuhn P.; Robinson T.; Mercer J.; Dittrich P. S. Single-Virus Fusion Experiments Reveal Proton Influx into Vaccinia Virions and Hemifusion Lag Times. Biophys. J. 2013, 105, 420–431. 10.1016/j.bpj.2013.06.016. [DOI] [PMC free article] [PubMed] [Google Scholar]
- Naredi-Rainer N.; Prescher J.; Hartschuh A.; Lamb D. C. Confocal Microscopy. Fluorescence Microscopy 2013, 1075, 175–213. 10.1002/9783527671595.ch5. [DOI] [Google Scholar]
- Minsky M. Memoir on Inventing the Confocal Scanning Microscope. Scanning 1988, 10, 128–138. 10.1002/sca.4950100403. [DOI] [Google Scholar]
- Graf R.; Rietdorf J.; Zimmermann T. Live Cell Spinning Disk Microscopy. Adv. Biochem. Eng./Biotechnol. 2005, 95, 57–75. 10.1007/b102210. [DOI] [PubMed] [Google Scholar]
- Egger M. D.; Petran M. New Reflected-Light Microscope for Viewing Unstained Brain and Ganglion Cells. Science 1967, 157, 305–307. 10.1126/science.157.3786.305. [DOI] [PubMed] [Google Scholar]
- Andersson S. B. Tracking a Single Fluorescent Molecule with a Confocal Microscope. Appl. Phys. B: Lasers Opt. 2005, 80, 809–816. 10.1007/s00340-005-1801-x. [DOI] [Google Scholar]
- Han J. J.; Kiss C.; Bradbury A. R. M.; Werner J. H. Time-Resolved, Confocal Single-Molecule Tracking of Individual Organic Dyes and Fluorescent Proteins in Three Dimensions. ACS Nano 2012, 6, 8922–8932. 10.1021/nn302912j. [DOI] [PubMed] [Google Scholar]
- Krzic U.; Gunther S.; Saunders T. E.; Streichan S. J.; Hufnagel L. Multiview Light-Sheet Microscope for Rapid in toto Imaging. Nat. Methods 2012, 9, 730–733. 10.1038/nmeth.2064. [DOI] [PubMed] [Google Scholar]
- Vettenburg T.; Dalgarno H. I. C.; Nylk J.; Coll-Llado C.; Ferrier D. E. K.; Cizmar T.; Gunn-Moore F. J.; Dholakia K. Light-Sheet Microscopy Using An Airy Beam. Nat. Methods 2014, 11, 541–544. 10.1038/nmeth.2922. [DOI] [PubMed] [Google Scholar]
- Pitrone P. G.; Schindelin J.; Stuyvenberg L.; Preibisch S.; Weber M.; Eliceiri K. W.; Huisken J.; Tomancak P. OpenSPIM: An Open-Access Light-Sheet Microscopy Platform. Nat. Methods 2013, 10, 598–599. 10.1038/nmeth.2507. [DOI] [PMC free article] [PubMed] [Google Scholar]
- Li Y.; Hu Y.; Cang H. Light Sheet Microscopy for Tracking Single Molecules on the Apical Surface of Living Cells. J. Phys. Chem. B 2013, 117, 15503–15511. 10.1021/jp405380g. [DOI] [PubMed] [Google Scholar]
- Keller P. J.; Schmidt A. D.; Wittbrodt J.; Stelzer E. H. Reconstruction of Zebrafish Early Embryonic Development by Scanned Light Sheet Microscopy. Science 2008, 322, 1065–1069. 10.1126/science.1162493. [DOI] [PubMed] [Google Scholar]
- Ritter J. G.; Veith R.; Veenendaal A.; Siebrasse J. P.; Kubitscheck U. Light Sheet Microscopy for Single Molecule Tracking in Living Tissue. PLoS One 2010, 5, e11639 10.1371/journal.pone.0011639. [DOI] [PMC free article] [PubMed] [Google Scholar]
- Wan Y.; McDole K.; Keller P. J. Light-Sheet Microscopy and Its Potential for Understanding Developmental Processes. Annu. Rev. Cell Dev. Biol. 2019, 35, 655–681. 10.1146/annurev-cellbio-100818-125311. [DOI] [PubMed] [Google Scholar]
- Hillman E. M. C.; Voleti V.; Li W.; Yu H. Light-Sheet Microscopy in Neuroscience. Annu. Rev. Neurosci. 2019, 42, 295–313. 10.1146/annurev-neuro-070918-050357. [DOI] [PMC free article] [PubMed] [Google Scholar]
- Stelzer E. H. K. Light-Sheet Fluorescence Microscopy for Quantitative Biology. Nat. Methods 2015, 12, 23–26. 10.1038/nmeth.3219. [DOI] [PubMed] [Google Scholar]
- Bosse J. B.; Hogue I. B.; Feric M.; Thiberge S. Y.; Sodeik B.; Brangwynne C. P.; Enquist L. W. Remodeling Nuclear Architecture Allows Efficient Transport of Herpesvirus Capsids by Diffusion. Proc. Natl. Acad. Sci. U. S. A. 2015, 112, E5725–E5733. 10.1073/pnas.1513876112. [DOI] [PMC free article] [PubMed] [Google Scholar]
- Hoyer P.; de Medeiros G.; Balazs B.; Norlin N.; Besir C.; Hanne J.; Krausslich H. G.; Engelhardt J.; Sahl S. J.; Hell S. W.; et al. Breaking the Diffraction Limit of Light-Sheet Fluorescence Microscopy by RESOLFT. Proc. Natl. Acad. Sci. U. S. A. 2016, 113, 3442–3446. 10.1073/pnas.1522292113. [DOI] [PMC free article] [PubMed] [Google Scholar]
- Rust M. J.; Bates M.; Zhuang X. Sub-Diffraction-Limit Imaging by Stochastic Optical Reconstruction Microscopy (STORM). Nat. Methods 2006, 3, 793–795. 10.1038/nmeth929. [DOI] [PMC free article] [PubMed] [Google Scholar]
- Malkusch S.; Muranyi W.; Muller B.; Krausslich H. G.; Heilemann M. Single-Molecule Coordinate-Based Analysis of the Morphology of HIV-1 Assembly Sites with Near-Molecular Spatial Resolution. Histochem. Cell Biol. 2013, 139, 173–179. 10.1007/s00418-012-1014-4. [DOI] [PubMed] [Google Scholar]
- Lehmann M.; Rocha S.; Mangeat B.; Blanchet F.; Uji I. H.; Hofkens J.; Piguet V. Quantitative Multicolor Super-Resolution Microscopy Reveals Tetherin HIV-1 Interaction. PLoS Pathog. 2011, 7, e1002456 10.1371/journal.ppat.1002456. [DOI] [PMC free article] [PubMed] [Google Scholar]
- Inamdar K.; Floderer C.; Favard C.; Muriaux D. Monitoring HIV-1 Assembly in Living Cells: Insights from Dynamic and Single Molecule Microscopy. Viruses 2019, 11, 72. 10.3390/v11010072. [DOI] [PMC free article] [PubMed] [Google Scholar]
- Bleck M.; Itano M. S.; Johnson D. S.; Thomas V. K.; North A. J.; Bieniasz P. D.; Simon S. M. Temporal and Spatial Organization of ESCRT Protein Recruitment During HIV-1 Budding. Proc. Natl. Acad. Sci. U. S. A. 2014, 111, 12211–12216. 10.1073/pnas.1321655111. [DOI] [PMC free article] [PubMed] [Google Scholar]
- Prescher J.; Baumgartel V.; Ivanchenko S.; Torrano A. A.; Brauchle C.; Muller B.; Lamb D. C. Super-Resolution Imaging of ESCRT-Proteins at HIV-1 Assembly Sites. PLoS Pathog. 2015, 11, e1004677 10.1371/journal.ppat.1004677. [DOI] [PMC free article] [PubMed] [Google Scholar]
- Shao L.; Kner P.; Rego E. H.; Gustafsson M. G. Super-Resolution 3D Microscopy of Live Whole Cells Using Structured Illumination. Nat. Methods 2011, 8, 1044–1046. 10.1038/nmeth.1734. [DOI] [PubMed] [Google Scholar]
- Jones S. A.; Shim S. H.; He J.; Zhuang X. Fast, Three-Dimensional Super-Resolution Imaging of Live Cells. Nat. Methods 2011, 8, 499–508. 10.1038/nmeth.1605. [DOI] [PMC free article] [PubMed] [Google Scholar]
- Nair D.; Hosy E.; Petersen J. D.; Constals A.; Giannone G.; Choquet D.; Sibarita J. B. Super-Resolution Imaging Reveals That AMPA Receptors Inside Synapses Are Dynamically Organized in Nanodomains Regulated by PSD95. J. Neurosci. 2013, 33, 13204–13224. 10.1523/JNEUROSCI.2381-12.2013. [DOI] [PMC free article] [PubMed] [Google Scholar]
- Izeddin I.; Recamier V.; Bosanac L.; Cisse I. I.; Boudarene L.; Dugast-Darzacq C.; Proux F.; Benichou O.; Voituriez R.; Bensaude O.; et al. Single-Molecule Tracking in Live Cells Reveals Distinct Target-Search Strategies of Transcription Factors in the Nucleus. eLife 2014, 3, e02230 10.7554/eLife.02230. [DOI] [PMC free article] [PubMed] [Google Scholar]
- Yang L.; Dun A. R.; Martin K. J.; Qiu Z.; Dunn A.; Lord G. J.; Lu W.; Duncan R. R.; Rickman C. Secretory Vesicles Are Preferentially Targeted to Areas of Low Molecular SNARE Density. PLoS One 2012, 7, e49514 10.1371/journal.pone.0049514. [DOI] [PMC free article] [PubMed] [Google Scholar]
- Juette M. F.; Gould T. J.; Lessard M. D.; Mlodzianoski M. J.; Nagpure B. S.; Bennett B. T.; Hess S. T.; Bewersdorf J. Three-Dimensional Sub-100 nm Resolution Fluorescence Microscopy of Thick Samples. Nat. Methods 2008, 5, 527–529. 10.1038/nmeth.1211. [DOI] [PubMed] [Google Scholar]
- Pavani S. R.; Thompson M. A.; Biteen J. S.; Lord S. J.; Liu N.; Twieg R. J.; Piestun R.; Moerner W. E. Three-Dimensional, Single-Molecule Fluorescence Imaging Beyond the Diffraction Limit by Using a Double-Helix Point Spread Function. Proc. Natl. Acad. Sci. U. S. A. 2009, 106, 2995–2999. 10.1073/pnas.0900245106. [DOI] [PMC free article] [PubMed] [Google Scholar]
- Thompson M. A.; Lew M. D.; Badieirostami M.; Moerner W. E. Localizing and Tracking Single Nanoscale Emitters in Three Dimensions with High Spatiotemporal Resolution Using a Double-Helix Point Spread Function. Nano Lett. 2010, 10, 211–218. 10.1021/nl903295p. [DOI] [PMC free article] [PubMed] [Google Scholar]
- Yu B.; Yu J.; Li W.; Cao B.; Li H.; Chen D.; Niu H. Nanoscale Three-Dimensional Single Particle Tracking by Light-Sheet-Based Double-Helix Point Spread Function Microscopy. Appl. Opt. 2016, 55, 449–453. 10.1364/AO.55.000449. [DOI] [PubMed] [Google Scholar]
- Holtzer L.; Meckel T.; Schmidt T. Nanometric Three-Dimensional Tracking of Individual Quantum Dots in Cells. Appl. Phys. Lett. 2007, 90, 053902 10.1063/1.2437066. [DOI] [Google Scholar]
- Huang B.; Wang W.; Bates M.; Zhuang X. Three-Dimensional Super-Resolution Imaging by Stochastic Optical Reconstruction Microscopy. Science 2008, 319, 810–813. 10.1126/science.1153529. [DOI] [PMC free article] [PubMed] [Google Scholar]
- Lange S.; Katayama Y.; Schmid M.; Burkacky O.; Brauchle C.; Lamb D. C.; Jansen R. P. Simultaneous Transport of Different Localized mRNA Species Revealed by Live-Cell Imaging. Traffic 2008, 9, 1256–1267. 10.1111/j.1600-0854.2008.00763.x. [DOI] [PubMed] [Google Scholar]
- Wells N. P.; Lessard G. A.; Goodwin P. M.; Phipps M. E.; Cutler P. J.; Lidke D. S.; Wilson B. S.; Werner J. H. Time-Resolved Three-Dimensional Molecular Tracking in Live Cells. Nano Lett. 2010, 10, 4732–4737. 10.1021/nl103247v. [DOI] [PMC free article] [PubMed] [Google Scholar]
- Cang H.; Xu C. S.; Montiel D.; Yang H. Guiding a Confocal Microscope by Single Fluorescent Nanoparticles. Opt. Lett. 2007, 32, 2729–2731. 10.1364/OL.32.002729. [DOI] [PubMed] [Google Scholar]
- Balzarotti F.; Eilers Y.; Gwosch K. C.; Gynna A. H.; Westphal V.; Stefani F. D.; Elf J.; Hell S. W. Nanometer Resolution Imaging and Tracking of Fluorescent Molecules with Minimal Photon Fluxes. Science 2017, 355, 606–612. 10.1126/science.aak9913. [DOI] [PubMed] [Google Scholar]
- Enderlein J. Tracking of Fluorescent Molecules Diffusing within Membranes. Appl. Phys. B: Lasers Opt. 2000, 71, 773–777. 10.1007/s003400000409. [DOI] [Google Scholar]
- Kis-Petikova K.; Gratton E. Distance Measurement by Circular Scanning of the Excitation Beam in the Two-Photon Microscope. Microsc. Res. Tech. 2004, 63, 34–49. 10.1002/jemt.10417. [DOI] [PubMed] [Google Scholar]
- Lessard G. A.; Goodwin P. M.; Werner J. H. Three-Dimensional Tracking of Individual Quantum Dots. Appl. Phys. Lett. 2007, 91, 224106. 10.1063/1.2819074. [DOI] [Google Scholar]
- Verdeny-Vilanova I.; Wehnekamp F.; Mohan N.; Alvarez A. S.; Borbely J. S.; Otterstrom J. J.; Lamb D. C.; Lakadamyali M. 3D Motion of Vesicles along Microtubules Helps Them to Circumvent Obstacles in Cells. J. Cell Sci. 2017, 130, 1904–1916. 10.1242/jcs.201178. [DOI] [PMC free article] [PubMed] [Google Scholar]
- Wehnekamp F.; Plucinska G.; Thong R.; Misgeld T.; Lamb D. C. Nanoresolution Real-Time 3D Orbital Tracking for Studying Mitochondrial Trafficking in Vertebrate Axons in Vivo. eLife 2019, 8, e46059 10.7554/eLife.46059. [DOI] [PMC free article] [PubMed] [Google Scholar]
- Katayama Y.; Burkacky O.; Meyer M.; Brauchle C.; Gratton E.; Lamb D. C. Real-Time Nanomicroscopy via Three-Dimensional Single-Particle Tracking. ChemPhysChem 2009, 10, 2458–2464. 10.1002/cphc.200900436. [DOI] [PMC free article] [PubMed] [Google Scholar]
- Hellriegel C.; Gratton E. Real-Time Multi-Parameter Spectroscopy and Localization in Three-Dimensional Single-Particle Tracking. J. R. Soc., Interface 2009, 6, S3–S14. 10.1098/rsif.2008.0313.focus. [DOI] [PMC free article] [PubMed] [Google Scholar]
- Liu Z.; Lavis L. D.; Betzig E. Imaging Live-Cell Dynamics and Structure at the Single-Molecule Level. Mol. Cell 2015, 58, 644–659. 10.1016/j.molcel.2015.02.033. [DOI] [PubMed] [Google Scholar]
- Saxton M. J. Single-Particle Tracking: Connecting the Dots. Nat. Methods 2008, 5, 671–672. 10.1038/nmeth0808-671. [DOI] [PubMed] [Google Scholar]
- Carter B. C.; Shubeita G. T.; Gross S. P. Tracking Single Particles: A User-Friendly Quantitative Evaluation. Phys. Biol. 2005, 2, 60–72. 10.1088/1478-3967/2/1/008. [DOI] [PubMed] [Google Scholar]
- Thompson R. E.; Larson D. R.; Webb W. W. Precise Nanometer Localization Analysis for Individual Fluorescent Probes. Biophys. J. 2002, 82, 2775–2783. 10.1016/S0006-3495(02)75618-X. [DOI] [PMC free article] [PubMed] [Google Scholar]
- Small A.; Stahlheber S. Fluorophore Localization Algorithms for Super-Resolution Microscopy. Nat. Methods 2014, 11, 267–279. 10.1038/nmeth.2844. [DOI] [PubMed] [Google Scholar]
- Ernst D.; Kohler J. How the Number of Fitting Points for the Slope of the Mean-Square Displacement Influences the Experimentally Determined Particle Size Distribution from Single-Particle Tracking. Phys. Chem. Chem. Phys. 2013, 15, 3429–3432. 10.1039/c3cp44391d. [DOI] [PubMed] [Google Scholar]
- Born M.; Wolf E.. Principles of Optics: Electromagnetic Theory of Propagation, Interference and Diffraction of Light; Elsevier: 2013. [Google Scholar]
- Liu S. L.; Li J.; Zhang Z. L.; Wang Z. G.; Tian Z. Q.; Wang G. P.; Pang D. W. Fast and High-Accuracy Localization for Three-Dimensional Single-Particle Tracking. Sci. Rep. 2013, 3, 2462. 10.1038/srep02462. [DOI] [PMC free article] [PubMed] [Google Scholar]
- Qu X. H.; Wu D.; Mets L.; Scherer N. F. Nanometer-Localized Multiple Single-Molecule Fluorescence Microscopy. Proc. Natl. Acad. Sci. U. S. A. 2004, 101, 11298–11303. 10.1073/pnas.0402155101. [DOI] [PMC free article] [PubMed] [Google Scholar]
- Hess S. T.; Girirajan T. P.; Mason M. D. Ultra-High Resolution Imaging by Fluorescence Photoactivation Localization Microscopy. Biophys. J. 2006, 91, 4258–4272. 10.1529/biophysj.106.091116. [DOI] [PMC free article] [PubMed] [Google Scholar]
- Parthasarathy R. Rapid, Accurate Particle Tracking by Calculation of Radial Symmetry Centers. Nat. Methods 2012, 9, 724–726. 10.1038/nmeth.2071. [DOI] [PubMed] [Google Scholar]
- Sage D.; Neumann F. R.; Hediger F.; Gasser S. M.; Unser M. Automatic Tracking of Individual Fluorescence Particles: Application to the Study of Chromosome Dynamics. IEEE Trans. Image Process. 2005, 14, 1372–1383. 10.1109/TIP.2005.852787. [DOI] [PubMed] [Google Scholar]
- Godinez W. J.; Lampe M.; Worz S.; Muller B.; Eils R.; Rohr K. Deterministic and Probabilistic Approaches for Tracking Virus Particles in Time-Lapse Fluorescence Microscopy Image Sequences. Med. Image Anal. 2009, 13, 325–342. 10.1016/j.media.2008.12.004. [DOI] [PubMed] [Google Scholar]
- Chenouard N.; Smal I.; de Chaumont F.; Maska M.; Sbalzarini I. F.; Gong Y.; Cardinale J.; Carthel C.; Coraluppi S.; Winter M.; et al. Objective Comparison of Particle Tracking Methods. Nat. Methods 2014, 11, 281–289. 10.1038/nmeth.2808. [DOI] [PMC free article] [PubMed] [Google Scholar]
- Reid D. An Algorithm for Tracking Multiple Targets. IEEE Trans. Autom. Control 1979, 24, 843–854. 10.1109/TAC.1979.1102177. [DOI] [Google Scholar]
- Veenman C. J.; Reinders M. J.; Backer E. Resolving Motion Correspondence for Densely Moving Points. IEEE T. Pattern Anal. 2001, 23, 54–72. 10.1109/34.899946. [DOI] [Google Scholar]
- Jiang S.; Zhou X.; Kirchhausen T.; Wong S. T. Tracking Molecular Particles in Live Cells Using Fuzzy Rule-Based System. Cytometry, Part A 2007, 71, 576–584. 10.1002/cyto.a.20411. [DOI] [PubMed] [Google Scholar]
- Shafique K.; Shah M. A Noniterative Greedy Algorithm for Multiframe Point Correspondence. IEEE Trans. Pattern Anal. Mach. Intell. 2005, 27, 51–65. 10.1109/TPAMI.2005.1. [DOI] [PubMed] [Google Scholar]
- Jaqaman K.; Loerke D.; Mettlen M.; Kuwata H.; Grinstein S.; Schmid S. L.; Danuser G. Robust Single-Particle Tracking in Live-Cell Time-Lapse Sequences. Nat. Methods 2008, 5, 695–702. 10.1038/nmeth.1237. [DOI] [PMC free article] [PubMed] [Google Scholar]
- Saxton M. J. Single-Particle Tracking: The Distribution of Diffusion Coefficients. Biophys. J. 1997, 72, 1744–1753. 10.1016/S0006-3495(97)78820-9. [DOI] [PMC free article] [PubMed] [Google Scholar]
- Dahan M. From Analog to Digital: Exploring Cell Dynamics with Single Quantum Dots. Histochem. Cell Biol. 2006, 125, 451–456. 10.1007/s00418-005-0105-x. [DOI] [PubMed] [Google Scholar]
- Dupont A.; Gorelashvili M.; Schuller V.; Wehnekamp F.; Arcizet D.; Katayama Y.; Lamb D. C.; Heinrich D. Three-Dimensional Single-Particle Tracking in Live Cells: News from the Third Dimension. New J. Phys. 2013, 15, 075008 10.1088/1367-2630/15/7/075008. [DOI] [Google Scholar]
- Bannai H.; Lévi S.; Schweizer C.; Dahan M.; Triller A. Imaging the Lateral Diffusion of Membrane Molecules with Quantum Dots. Nat. Protoc. 2006, 1, 2628–2634. 10.1038/nprot.2006.429. [DOI] [PubMed] [Google Scholar]
- Saxton M. J. Single-Particle Tracking: Effects of Corrals. Biophys. J. 1995, 69, 389–398. 10.1016/S0006-3495(95)79911-8. [DOI] [PMC free article] [PubMed] [Google Scholar]
- Rock R. S. Myosin VI Is a Processive Motor with a Large Step Size. Proc. Natl. Acad. Sci. U. S. A. 2001, 98, 13655–13659. 10.1073/pnas.191512398. [DOI] [PMC free article] [PubMed] [Google Scholar]
- Ma S.; Chisholm R. L. Cytoplasmic Dynein-Associated Structures Move Bidirectionally in Vivo. J. Cell Sci. 2002, 115, 1453–1460. [DOI] [PubMed] [Google Scholar]
- Sieczkarski S. B.; Whittaker G. R. Dissecting Virus Entry via Endocytosis. J. Gen. Virol. 2002, 83, 1535–1545. 10.1099/0022-1317-83-7-1535. [DOI] [PubMed] [Google Scholar]
- Boulant S.; Stanifer M.; Lozach P. Y. Dynamics of Virus-Receptor Interactions in Virus Binding, Signaling, and Endocytosis. Viruses 2015, 7, 2794–2815. 10.3390/v7062747. [DOI] [PMC free article] [PubMed] [Google Scholar]
- Mudhakir D.; Harashima H. Learning from the Viral Journey: How to Enter Cells and How to Overcome Intracellular Barriers to Reach the Nucleus. AAPS J. 2009, 11, 65–77. 10.1208/s12248-009-9080-9. [DOI] [PMC free article] [PubMed] [Google Scholar]
- Damm E. M.; Pelkmans L. Systems Biology of Virus Entry in Mammalian Cells. Cell. Microbiol. 2006, 8, 1219–1227. 10.1111/j.1462-5822.2006.00745.x. [DOI] [PMC free article] [PubMed] [Google Scholar]
- Chang K.; Baginski J.; Hassan S. F.; Volin M.; Shukla D.; Tiwari V. Filopodia and Vruses: An Analysis of Membrane Processes in Entry Mechanisms. Front. Microbiol. 2016, 7, 300. 10.3389/fmicb.2016.00300. [DOI] [PMC free article] [PubMed] [Google Scholar]
- Shinya K.; Ebina M.; Yamada S.; Ono M.; Kasai N.; Kawaoka Y. Avian Flu: Influenza Virus Receptors in the Human Airway. Nature 2006, 440, 435–436. 10.1038/440435a. [DOI] [PubMed] [Google Scholar]
- Ibricevic A.; Pekosz A.; Walter M. J.; Newby C.; Battaile J. T.; Brown E. G.; Holtzman M. J.; Brody S. L. Influenza Virus Receptor Specificity and Cell Tropism in Mouse and Human Airway Epithelial Cells. J. Virol. 2006, 80, 7469–7480. 10.1128/JVI.02677-05. [DOI] [PMC free article] [PubMed] [Google Scholar]
- Lakadamyali M.; Rust M. J.; Zhuang X. Endocytosis of Influenza Viruses. Microbes Infect. 2004, 6, 929–936. 10.1016/j.micinf.2004.05.002. [DOI] [PMC free article] [PubMed] [Google Scholar]
- Mercer J.; Schelhaas M.; Helenius A. Virus Entry by Endocytosis. Annu. Rev. Biochem. 2010, 79, 803–833. 10.1146/annurev-biochem-060208-104626. [DOI] [PubMed] [Google Scholar]
- Nisole S.; Saib A. Early Steps of Retrovirus Replicative Cycle. Retrovirology 2004, 1, 9. 10.1186/1742-4690-1-9. [DOI] [PMC free article] [PubMed] [Google Scholar]
- Spear P. G.; Eisenberg R. J.; Cohen G. H. Three Classes of Cell Surface Receptors for Alphaherpesvirus Entry. Virology 2000, 275, 1–8. 10.1006/viro.2000.0529. [DOI] [PubMed] [Google Scholar]
- Bailey C. J.; Crystal R. G.; Leopold P. L. Association of Adenovirus with the Microtubule Organizing Center. J. Virol. 2003, 77, 13275–13287. 10.1128/JVI.77.24.13275-13287.2003. [DOI] [PMC free article] [PubMed] [Google Scholar]
- Kielian M.; Rey F. A. Virus Membrane-Fusion Proteins: More Than One Way to Make a Hairpin. Nat. Rev. Microbiol. 2006, 4, 67–76. 10.1038/nrmicro1326. [DOI] [PMC free article] [PubMed] [Google Scholar]
- Dupont A.; Stirnnagel K.; Lindemann D.; Lamb D. C. Tracking Image Correlation: Combining Single-Particle Tracking and Image Correlation. Biophys. J. 2013, 104, 2373–2382. 10.1016/j.bpj.2013.04.005. [DOI] [PMC free article] [PubMed] [Google Scholar]
- Alenquer M.; Vale-Costa S.; Etibor T. A.; Ferreira F.; Sousa A. L.; Amorim M. J. Influenza A Virus Ribonucleoproteins Form Liquid Organelles at Endoplasmic Reticulum Exit Sites. Nat. Commun. 2019, 10, 1629. 10.1038/s41467-019-09549-4. [DOI] [PMC free article] [PubMed] [Google Scholar]
- Jo S.; Kawaguchi A.; Takizawa N.; Morikawa Y.; Momose F.; Nagata K. Involvement of Vesicular Trafficking System in Membrane Targeting of the Progeny Influenza Virus Genome. Microbes Infect. 2010, 12, 1079–1084. 10.1016/j.micinf.2010.06.011. [DOI] [PubMed] [Google Scholar]
- Avilov S. V.; Moisy D.; Naffakh N.; Cusack S. Influenza A Virus Progeny vRNP Trafficking in Live Infected Cells Studied with the Virus-Encoded Fluorescently Tagged PB2 Protein. Vaccine 2012, 30, 7411–7417. 10.1016/j.vaccine.2012.09.077. [DOI] [PubMed] [Google Scholar]
- Amorim M. J.; Bruce E. A.; Read E. K. C.; Foeglein A.; Mahen R.; Stuart A. D.; Digard P. A Rab11-and Microtubule-Dependent Mechanism for Cytoplasmic Transport of Influenza A Virus Viral RNA. J. Virol. 2011, 85, 4143–4156. 10.1128/JVI.02606-10. [DOI] [PMC free article] [PubMed] [Google Scholar]
- Hendrix J.; Baumgartel V.; Schrimpf W.; Ivanchenko S.; Digman M. A.; Gratton E.; Krausslich H. G.; Muller B.; Lamb D. C. Live-Cell Observation of Cytosolic HIV-1 Assembly onset Reveals RNA-Interacting Gag Oligomers. J. Cell Biol. 2015, 210, 629–646. 10.1083/jcb.201504006. [DOI] [PMC free article] [PubMed] [Google Scholar]
- Jose J.; Tang J.; Taylor A. B.; Baker T. S.; Kuhn R. J. Fluorescent Protein-Tagged Sindbis Virus E2 Glycoprotein Allows Single Particle Analysis of Virus Budding from Live Cells. Viruses 2015, 7, 6182–6199. 10.3390/v7122926. [DOI] [PMC free article] [PubMed] [Google Scholar]
- Baumgartel V.; Muller B.; Lamb D. C. Quantitative Live-Cell Imaging of Human Immunodeficiency Virus (HIV-1) Assembly. Viruses 2012, 4, 777–799. 10.3390/v4050777. [DOI] [PMC free article] [PubMed] [Google Scholar]
- Perlman M.; Resh M. D. Identification of an Intracellular Trafficking and Assembly Pathway for HIV-1 Gag. Traffic 2006, 7, 731–745. 10.1111/j.1398-9219.2006.00428.x. [DOI] [PubMed] [Google Scholar]
- Gunzenhauser J.; Olivier N.; Pengo T.; Manley S. Quantitative Super-Resolution Imaging Reveals Protein Stoichiometry and Nanoscale Morphology of Assembling HIV-Gag Virions. Nano Lett. 2012, 12, 4705–4710. 10.1021/nl3021076. [DOI] [PubMed] [Google Scholar]
- Fogarty K. H.; Chen Y.; Grigsby I. F.; Macdonald P. J.; Smith E. M.; Johnson J. L.; Rawson J. M.; Mansky L. M.; Mueller J. D. Characterization of Cytoplasmic Gag-Gag Interactions by Dual-Color z-Scan Fluorescence Fluctuation Spectroscopy. Biophys. J. 2011, 100, 1587–1595. 10.1016/j.bpj.2011.02.008. [DOI] [PMC free article] [PubMed] [Google Scholar]
- Chen Y.; Wu B.; Musier-Forsyth K.; Mansky L. M.; Mueller J. D. Fluorescence Fluctuation Spectroscopy on Viral-Like Particles Reveals Variable Gag Stoichiometry. Biophys. J. 2009, 96, 1961–1969. 10.1016/j.bpj.2008.10.067. [DOI] [PMC free article] [PubMed] [Google Scholar]
- Sardo L.; Hatch S. C.; Chen J.; Nikolaitchik O.; Burdick R. C.; Chen D.; Westlake C. J.; Lockett S.; Pathak V. K.; Hu W. S. Dynamics of HIV-1 RNA Near the Plasma Membrane during Virus Assembly. J. Virol. 2015, 89, 10832–10840. 10.1128/JVI.01146-15. [DOI] [PMC free article] [PubMed] [Google Scholar]
- Rahman S. A.; Koch P.; Weichsel J.; Godinez W. J.; Schwarz U.; Rohr K.; Lamb D. C.; Krausslich H. G.; Muller B. Investigating the Role of F-Actin in Human Immunodeficiency Virus Assembly by Live-Cell Microscopy. J. Virol. 2014, 88, 7904–7914. 10.1128/JVI.00431-14. [DOI] [PMC free article] [PubMed] [Google Scholar]
- Baumgartel V.; Ivanchenko S.; Dupont A.; Sergeev M.; Wiseman P. W.; Krausslich H. G.; Brauchle C.; Muller B.; Lamb D. C. Live-Cell Visualization of Dynamics of HIV Budding Site Interactions with an ESCRT Component. Nat. Cell Biol. 2011, 13, 469–474. 10.1038/ncb2215. [DOI] [PubMed] [Google Scholar]
- Dimitrov D. S.; Willey R. L.; Sato H.; Chang L. J.; Blumenthal R.; Martin M. A. Quantitation of Human Immunodeficiency Virus Type 1 Infection Kinetics. J. Virol. 1993, 67, 2182–2190. 10.1128/JVI.67.4.2182-2190.1993. [DOI] [PMC free article] [PubMed] [Google Scholar]
- Johnson D. C.; Huber M. T. Directed Egress of Animal Viruses Promotes Cell-to-Cell Spread. J. Virol. 2002, 76, 1–8. 10.1128/JVI.76.1.1-8.2002. [DOI] [PMC free article] [PubMed] [Google Scholar]
- Sattentau Q. Avoiding the Void: Cell-to-Cell Spread of Human Viruses. Nat. Rev. Microbiol. 2008, 6, 815–826. 10.1038/nrmicro1972. [DOI] [PubMed] [Google Scholar]
- Sherer N. M.; Lehmann M. J.; Jimenez-Soto L. F.; Horensavitz C.; Pypaert M.; Mothes W. Retroviruses Can Establish Filopodial Bridges for Efficient Cell-to-Cell Transmission. Nat. Cell Biol. 2007, 9, 310–315. 10.1038/ncb1544. [DOI] [PMC free article] [PubMed] [Google Scholar]
- Mothes W.; Sherer N. M.; Jin J.; Zhong P. Virus Cell-to-Cell Transmission. J. Virol. 2010, 84, 8360–8368. 10.1128/JVI.00443-10. [DOI] [PMC free article] [PubMed] [Google Scholar]
- Eugenin E. A.; Gaskill P. J.; Berman J. W. Tunneling Nanotubes (TNT) Are Induced by HIV-Infection of Macrophages: A Potential Mechanism for Intercellular HIV Trafficking. Cell. Immunol. 2009, 254, 142–148. 10.1016/j.cellimm.2008.08.005. [DOI] [PMC free article] [PubMed] [Google Scholar]
- Gousset K.; Schiff E.; Langevin C.; Marijanovic Z.; Caputo A.; Browman D. T.; Chenouard N.; de Chaumont F.; Martino A.; Enninga J.; et al. Prions Hijack Tunnelling Nanotubes for Intercellular Spread. Nat. Cell Biol. 2009, 11, 328–336. 10.1038/ncb1841. [DOI] [PubMed] [Google Scholar]
- Sowinski S.; Jolly C.; Berninghausen O.; Purbhoo M. A.; Chauveau A.; Köhler K.; Oddos S.; Eissmann P.; Brodsky F. M.; Hopkins C. Membrane Nanotubes Physically Connect T Cells over Long Distances Presenting a Novel Route for HIV-1 Transmission. Nat. Cell Biol. 2008, 10, 211–219. 10.1038/ncb1682. [DOI] [PubMed] [Google Scholar]
- Kumar A.; Kim J. H.; Ranjan P.; Metcalfe M. G.; Cao W.; Mishina M.; Gangappa S.; Guo Z.; Boyden E. S.; Zaki S.; et al. Influenza Virus Exploits Tunneling Nanotubes for Cell-to-Cell Spread. Sci. Rep. 2017, 7, 40360. 10.1038/srep40360. [DOI] [PMC free article] [PubMed] [Google Scholar]
- Nzounza P.; Chazal M.; Guedj C.; Schmitt A.; Masse J. M.; Randriamampita C.; Pique C.; Ramirez B. C. The Scaffolding Protein Dlg1 Is a Negative Regulator of Cell-Free Virus Infectivity but Not of Cell-to-Cell HIV-1 Transmission in T Cells. PLoS One 2012, 7, e30130 10.1371/journal.pone.0030130. [DOI] [PMC free article] [PubMed] [Google Scholar]
- Igakura T.; Stinchcombe J. C.; Goon P. K.; Taylor G. P.; Weber J. N.; Griffiths G. M.; Tanaka Y.; Osame M.; Bangham C. R. Spread of HTLV-I between Lymphocytes by Virus-Induced Polarization of the Cytoskeleton. Science 2003, 299, 1713–1716. 10.1126/science.1080115. [DOI] [PubMed] [Google Scholar]
- Barnard A. L.; Igakura T.; Tanaka Y.; Taylor G. P.; Bangham C. R. Engagement of Specific T-Cell Surface Molecules Regulates Cytoskeletal Polarization in HTLV-1–Infected Lymphocytes. Blood 2005, 106, 988–995. 10.1182/blood-2004-07-2850. [DOI] [PubMed] [Google Scholar]
- Johnson D. C.; Webb M.; Wisner T. W.; Brunetti C. Herpes Simplex Virus gE/gI Sorts Nascent Virions to Epithelial Cell Junctions, Promoting Virus Spread. J. Virol. 2001, 75, 821–833. 10.1128/JVI.75.2.821-833.2001. [DOI] [PMC free article] [PubMed] [Google Scholar]
- Rustom A.; Saffrich R.; Markovic I.; Walther P.; Gerdes H. H. Nanotubular Highways for Intercellular Organelle Transport. Science 2004, 303, 1007–1010. 10.1126/science.1093133. [DOI] [PubMed] [Google Scholar]
- Davis D. M.; Sowinski S. Membrane Nanotubes: Dynamic Long-Distance Connections between Animal Cells. Nat. Rev. Mol. Cell Biol. 2008, 9, 431–436. 10.1038/nrm2399. [DOI] [PubMed] [Google Scholar]
- Efros A. L.; Nesbitt D. J. Origin and Control of Blinking in Quantum Dots. Nat. Nanotechnol. 2016, 11, 661–671. 10.1038/nnano.2016.140. [DOI] [PubMed] [Google Scholar]
- Marchuk K.; Guo Y.; Sun W.; Vela J.; Fang N. High-Precision Tracking with Non-Blinking Quantum Dots Resolves Nanoscale Vertical Displacement. J. Am. Chem. Soc. 2012, 134, 6108–6111. 10.1021/ja301332t. [DOI] [PubMed] [Google Scholar]
- Keller A. M.; Ghosh Y.; DeVore M. S.; Phipps M. E.; Stewart M. H.; Wilson B. S.; Lidke D. S.; Hollingsworth J. A.; Werner J. H. 3-Dimensional Tracking of Non-blinking ’Giant’ Quantum Dots in Live Cells. Adv. Funct. Mater. 2014, 24, 4796–4803. 10.1002/adfm.201400349. [DOI] [PMC free article] [PubMed] [Google Scholar]
- Patterson G.; Davidson M.; Manley S.; Lippincott-Schwartz J. Superresolution Imaging Using Single-Molecule Localization. Annu. Rev. Phys. Chem. 2010, 61, 345–367. 10.1146/annurev.physchem.012809.103444. [DOI] [PMC free article] [PubMed] [Google Scholar]
- Lee A.; Tsekouras K.; Calderon C.; Bustamante C.; Presse S. Unraveling the Thousand Word Picture: An Introduction to Super-Resolution Data Analysis. Chem. Rev. 2017, 117, 7276–7330. 10.1021/acs.chemrev.6b00729. [DOI] [PMC free article] [PubMed] [Google Scholar]
- Huang B.; Bates M.; Zhuang X. Super-Resolution Fluorescence Microscopy. Annu. Rev. Biochem. 2009, 78, 993–1016. 10.1146/annurev.biochem.77.061906.092014. [DOI] [PMC free article] [PubMed] [Google Scholar]
- Pan W.; Dong Z.; Li F.; Meng W.; Feng L.; Niu X.; Li C.; Luo Q.; Li Z.; Sun C.; et al. Visualizing Influenza Virus Infection in Living Mice. Nat. Commun. 2013, 4, 2369. 10.1038/ncomms3369. [DOI] [PMC free article] [PubMed] [Google Scholar]
- Pan H.; Zhang P.; Gao D.; Zhang Y.; Li P.; Liu L.; Wang C.; Wang H.; Ma Y.; Cai L. Noninvasive Visualization of Respiratory Viral Infection Using Bioorthogonal Conjugated Near-Infrared-Emitting Quantum Dots. ACS Nano 2014, 8, 5468–5477. 10.1021/nn501028b. [DOI] [PubMed] [Google Scholar]
- Zong W.; Wu R.; Li M.; Hu Y.; Li Y.; Li J.; Rong H.; Wu H.; Xu Y.; Lu Y.; et al. Fast High-Resolution Miniature Two-Photon Microscopy for Brain Imaging in Freely Behaving Mice. Nat. Methods 2017, 14, 713–719. 10.1038/nmeth.4305. [DOI] [PubMed] [Google Scholar]
- Wang K.; Sun W.; Richie C. T.; Harvey B. K.; Betzig E.; Ji N. Direct Wavefront Sensing for High-Resolution in Vivo Imaging in Scattering Tissue. Nat. Commun. 2015, 6, 7276. 10.1038/ncomms8276. [DOI] [PMC free article] [PubMed] [Google Scholar]
- Hong G.; Antaris A. L.; Dai H. Near-Infrared Fluorophores for Biomedical Imaging. Nat. Biomed. Eng. 2017, 1, 0010 10.1038/s41551-016-0010. [DOI] [Google Scholar]
- Ding F.; Zhan Y. B.; Lu X. J.; Sun Y. Recent Advances in Near-Infrared II Fluorophores for Multifunctional Biomedical Imaging. Chem. Sci. 2018, 9, 4370–4380. 10.1039/C8SC01153B. [DOI] [PMC free article] [PubMed] [Google Scholar]
- Smith A. M.; Mancini M. C.; Nie S. Bioimaging: Second Window for in Vivo Imaging. Nat. Nanotechnol. 2009, 4, 710. 10.1038/nnano.2009.326. [DOI] [PMC free article] [PubMed] [Google Scholar]
- Zhang J. J.; Lin Y.; Zhou H.; He H.; Ma J. J.; Luo M. Y.; Zhang Z. L.; Pang D. W. Cell Membrane-Camouflaged NIR II Fluorescent Ag2Te Quantum Dots-Based Nanobioprobes for Enhanced in Vivo Homotypic Tumor Imaging. Adv. Healthcare Mater. 2019, 8, e1900341 10.1002/adhm.201900341. [DOI] [PubMed] [Google Scholar]
- Hong G.; Robinson J. T.; Zhang Y.; Diao S.; Antaris A. L.; Wang Q.; Dai H. In Vivo Fluorescence Imaging with Ag2S Quantum Dots in the Second Near-Infrared Region. Angew. Chem., Int. Ed. 2012, 51, 9818–9821. 10.1002/anie.201206059. [DOI] [PubMed] [Google Scholar]
- Jiang P.; Zhu C. N.; Zhang Z. L.; Tian Z. Q.; Pang D. W. Water-Soluble Ag2S Quantum Dots for Near-Infrared Fluorescence Imaging in Vivo. Biomaterials 2012, 33, 5130–5135. 10.1016/j.biomaterials.2012.03.059. [DOI] [PubMed] [Google Scholar]