. 2020 Mar 4;9:e50434. doi: 10.7554/eLife.50434

Figure 2. Generation of the Arl13bV358A/V358A mouse.

(A) Schematic of Arl13b gene and donor oligo (orange bar) at exon 8 used to generate the V358A causing point mutation. Arrows indicate primers used for allele validation. (B) Arl13b DNA and relevant amino acid sequence with the RVEP sequence in the orange box and the T-to-C mutation highlighted in pink. (C) Confocal images of cilia marker IFT88 (green) and ARL13B (magenta; NeuroMab) staining in neural tube of E10.5 somite-matched embryos. ARL13B-positive cilia are visible in Arl13b+/+ and Arl13bV358A/+, but not in Arl1bV358A/V358A embryos. (See Figure 2—figure supplement 1 for images of neural tube cilia under saturating conditions.) At least 5 embryos per genotype across five litters were examined. Scale bars are 50 μm. (D) ARL13B western blot of E10.5 whole embryo lysates, wild type (+/+), Arl13bV358A/+ (A/+) and Arl13bV358A/V358A (A/A) and (E) quantification presented as average intensity normalized to total protein ± standard deviation. Representative blot of whole embryo lysates (n = 3 embryos per genotype with technical duplicate of each). *p<0.05, one-way ANOVA and Tukey’s multiple comparison.
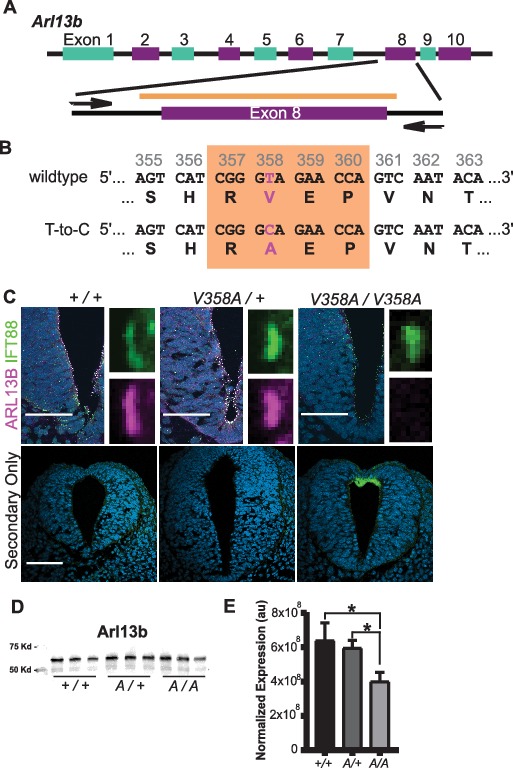
Figure 2—source data 1. ARL13B western blot quantification.

Figure 2.

Figure 2—figure supplement 1. Overexposure of Arl13bV358A/V358A cilia in E10.5 neural tube reveals no clear ARL13BV358A presence in cilia.
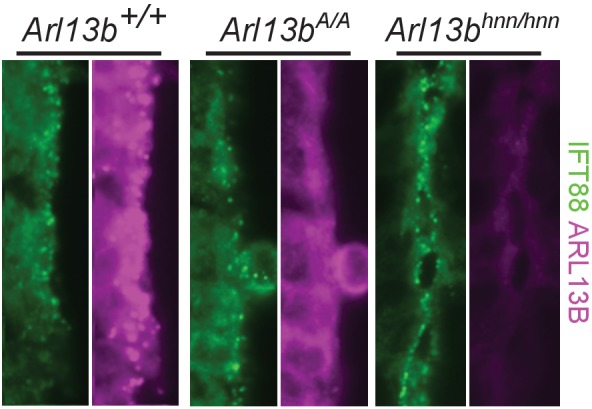
Figure 2—figure supplement 1.

Overexposure of cilia in E10.5 Arl13b+/+, Arl13bV358A/V358A, and Arl13bhnn/hnn embryonic neural tube, stained for IFT88 and ARL13B (NeuroMab). The ARL13B channel was overexposed for four seconds instead of one second.
Figure 2—figure supplement 2. Overexposure of Arl13bV358A/V358A cilia in MEFs reveals no clear ARL13BV358A presence in cilia.
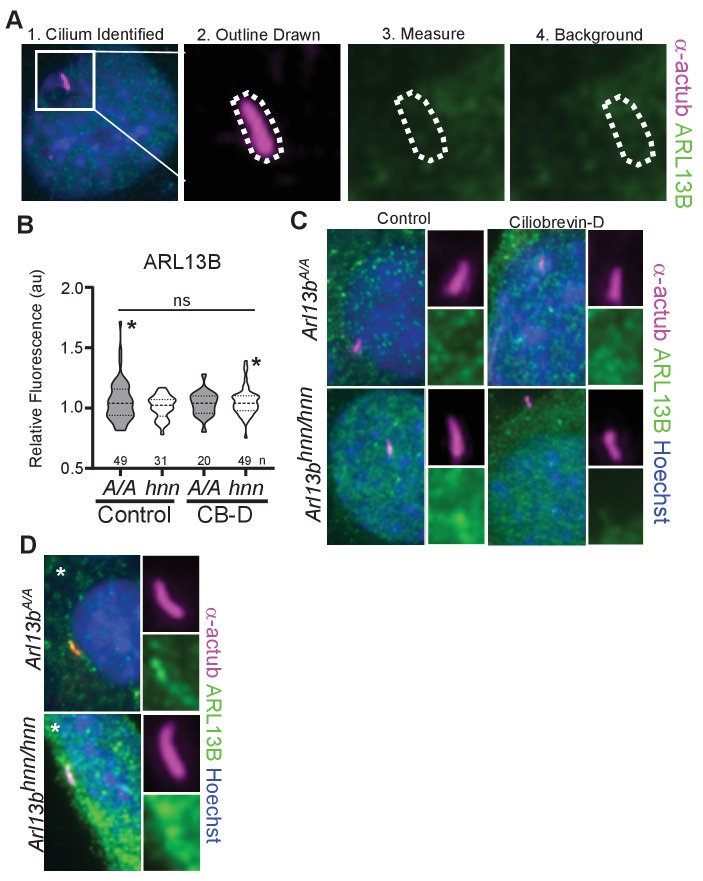
Figure 2—figure supplement 2.

(A) We identified acetylated α-tubulin positive cilia and used the marker to outline the area of the cilium. We quantified ARL13B immunofluorescence detected by Caspary lab polyclonal anti-ARL13B antibody (Caspary et al., 2007) and used the same trace to measure background levels in a different area of the cell body. (B) Arl13bV358A/V358A (A/A) and Arl13bhnn/hnn (hnn) MEFs treated with control or ciliobrevin-D 0.5% FBS Media. Samples were overexposed five times longer than normal, saturating the detector in the ARL13B channel. We measured no difference in ciliary ARL13B immunofluorescence between control and ciliobrevin-D treated Arl13bV358A/V358A and Arl13bhnn/hnn MEFs. Data presented as violin plots and analyzed by one-way ANOVA. Respective number of cilia listed below each plot. Cilia that had ARL13B immunofluorescent readings above background (*) are shown in panel D. (C) Representative images of over exposed Arl13bV358A/V358A and Arl13bhnn/hnn MEFs in control and ciliobrevin-D treatment conditions. (D) Representative images of cilia with ARL13B levels above background, marked by * in panel B.