

Abstract
The chemical- and photo- toxicity of chromophore retinal on cells have long been debated. Although we recently showed that retinal and blue light exposure interrupt cellular signaling, a comprehensive study examining molecular underpinnings of this perturbation and its consequences to cellular fate is lacking. Here, we report molecular evidence for blue light excited-retinal induced oxidative damage of polyunsaturated lipid anchors in membrane-interacting signaling molecules and DNA damage in cells using live-cell imaging and in vitro experimentation. The incurred molecular damage irreversibly disrupted subcellular localization of these molecules, a crucial criterion for their signaling. We further show retinal accumulation in lipid-bilayers of cell membranes could enhance the lifetime of retinal in cells. Comparative response-signatures suggest that retinal triggers reactions upon photoexcitation similar to photodynamic therapy agents and generate reactive oxygen species in cells. Additionally, data also shows that exposing retinal-containing cells to sunlight induces substantial cytotoxicity. Collectively, our results explain a likely in vivo mechanism and reaction conditions under which bio-available retinal in physiological light conditions damages cells.
Keywords: Retinal, blue light, reactive oxygen species, singlet oxygen, rose bengal, lipid peroxidation, G proteins, Ras, signal transduction, PIP2, farnesyl, geranylgeranyl
1. Introduction
Toxicity of all-trans-retinal (ATR or retinal) has been implicated in vision disorders (1–3). Though ATR and its condensation products (lipofuscins) are considered as factors for light-induced oxidative stress (4–6) and subsequent ocular photodamage (7–10), their molecular underpinnings require investigation. ATR mediated NADPH oxidase activation, and the resultant reactive oxygen species (ROS) generation are attributed to oxidative mitochondrial damage in retinal pigment epithelial cells (1) while antioxidants have been shown to reduce the phototoxicity (5,6). Additionally, ligand-binding G-protein coupled receptor (GPCR) activation by ATR, though an unknown mechanism, was proposed for oxidative DNA and mitochondrial damage (1,11). Recently, we showed evidence for Blue-Light-Excited-retinal (BLE-retinal) induced distortion of phosphatidylinositol 4,5 bisphosphate (PIP2) on the plasma membrane (PM), and subsequent cellular signaling perturbation (12).
The possibility of ATR accumulation in lipid bilayers of photoreceptor disk-membranes, despite efficient retinal transport mechanisms, is likely to allow continuous exposure of cells to photoexcited retinal (13). Additionally, defects in the retinal clearance mechanism may also allow ATR accumulation in RPE (14). Non-visual cells of the body such as skin-cells are also exposed to retinal that enters circulation, although at much lower concentrations (15,16). Retinal is also synthesized in situ in some cells via enzymatic conversion of retinol (vitamin A), which is abundant in the blood through dietary intake (17). Therefore, cells in peripheral tissues can also be influenced by photoexcited retinal.
Ultraviolet (UV) light has sufficient energy to excite and damage a minor fraction of DNA in exposed cells, triggering sunburn and causing conditions including melanoma (18–21). Blue light, with its relatively lower energy than UV, however, has been shown to induce cellular, physiological and behavioral complications in animals, including macular degeneration, skin aging, and sleep-deprivation (22–24). In addition, indoor-tanning associated extensive UV and blue light exposure are directly linked to non-melanoma and melanoma skin cancers (25). Though blue light is extensively used in dentistry, polymer composites in implant medicine and in curing adhesives, potential health implications of such light exposures are yet to be investigated (26). The upsurge of smartphones and digital screen usage is a major public concern since these devices emit blue light to generate color images, and causes conditions including insomnia and Transient Smartphone Blindness (TSB) (27). However, whether the prolonged-usage of these devices induces permanent vision damage is unclear.
Free retinal absorbs light spanning across far-UV to blue light with an absorption maximum of 381 nm (12). Therefore, the blue region of visible light and the absorption spectrum of retinal significantly overlap. Unlike UV, neither cornea nor lens of the eye block this blue spectral window, and thus likely facilitates photoexcitation of bioavailable retinal. Therefore, molecular underpinnings of BLE-retinal in living cells are essential to comprehend the long-debated cytotoxic effects of retinal as well as blue light.
Here, we report mechanisms and reaction conditions for retinal photoexcitation upon blue light illumination in the cellular environment. Our results indicate that, upon blue-light-exposure, retinal perturbs subcellular localization of selected lipidated G-proteins including farnesylated Gγ and Ras G-proteins that may contribute to cellular photodamage. We also show retinal and blue light-induced ROS generation in lipid-bilayers of cell membranes induces peroxidation of polyunsaturated lipid anchors of signaling proteins. Additionally, we demonstrate extensive phototoxicity in cells exposed to sunlight, a natural source of blue light, only in the presence of retinal. Overall, the data presented here elaborate molecular underpinnings of cytotoxicity associated with blue light excitation of retinal in living cells and its broader physiological consequences.
2. Material and methods
2.1. Materials
All-trans retinal, Dihydroethidium (DHE), 4,5-Diaminofluorescein diacetate (DAF-2DA), JC-1, Farnesyl alcohol, and Geranylgeranyl Alcohol (Cayman Chemicals, Ann Arbor, MI, USA), rose bengal and ascorbic acid (Chem Impex, Wood Dale, IL, USA), BODIPY/C11, MitoTracker™ Red FM (Thermofisher Scientific, Waltham, MA, USA), Yohimbine hydrochloride (Tocris biosciences, MN, USA), Norepinephrine bitartrate, α-tocopherol, glutathione ethyl ester, HPLC-grade water, methanol and ethanol (Sigma-Aldrich, St. Louis, MO, USA), TUNEL assay kit (AATbioquest, Sunnyvale, CA, USA), Staurosporine (LC labs, Woburn, MA, USA), Hank’s balanced salt solution (HBSS) and Phosphate Buffered Saline (PBS), 4-(2-hydroxyethyl)-1-piperazineethanesulfonic acid (HEPES), Dulbecco’s Phosphate Buffered Saline (DPBS) (Gibco Life Technologies, CA, USA), were purchased. DHE, DAF-2DA, BODIPY-C11, Yohimbine hydrochloride, glutathione ethyl ester and α-tocopherol were dissolved in DMSO as per manufacturers’ recommendations. Stock solutions of Norepinephrine (40 mM) and Ascorbic acid (200 mM) were prepared in water. Stock solutions of rose bengal (50 mM) were prepared in water and methanol. Stock solutions of ATR (50 mM), farnesyl alcohol (50 mM) and geranylgeranyl alcohol (50 mM) were prepared in ethanol. Retinal concentrations were measured by either UV-VIS spectrometer (UV-1800, Shimadzu Corporation, Kyoto, Japan) or HPLC (CBM-20A with UV detector, Shimadzu, USA) before live-cell imaging experiments. Calibration curves were plotted using ATR standards.
2.2. Cell culture
HeLa cells (ATCC, Manassas, VA) were cultured in minimum essential medium (MEM) supplemented with 10% dialyzed fetal bovine serum (DFBS) and penicillin-streptomycin (1%) in 60 mm/100 mm tissue culture dishes in a 5% CO2 humidified incubator at 37 °C. Cells were sub-cultured at 70–80% confluency, using versene-EDTA (Lonza) as the detachment reagent according to manufacturers’ protocol. Briefly, cells were incubated with versine-EDTA for 3 minutes at 37 °C, detached, and centrifuged at 1000×g for 3 minutes. Versene-EDTA was aspirated, and fresh cell culture medium was added to resuspend the cell pellet at a cell density of 1×10⁶ cells/mL. Retinal pigment epithelium (ARPE-19) cells (ATCC, Manassas, VA) were cultured in DMEM-F12 (50:50)/10% FBS/1% penicillin-streptomycin as described above. For live-cell imaging experiments, cells were cultured on 35 mm glass-bottom dishes with 1×10⁵ cells/mL cell density.
2.3. Transfection of cells
HeLa cells were transfected using Lipofectamine2000 (Thermo Fisher Scientific, USA) or PolyJet® (Signagen) according to manufacturers’ protocol. The following recombinant DNA plasmids were used; mCherry-PH, YFP-PH, mCherry-γ9, mCherry-γ3, GFP-γ9, α2AR-CFP, YFP-γ1, YFP-γ2, mCherry-KRas, mCherry-MRas, GFP-Lact-C2, αO-mCherry, mCherry-β1, mCherry-GPI. Constructs mCherry-PH, YFP-PH, and mCherry-KRas have been described previously (28,29). Additional details of plasmids are in the supplementary information.
2.4. Live-cell imaging, image analysis, and data processing
Detailed procedures and equipment were explained previously (12). Briefly, live-cell imaging experiments were performed using spatially confined light exposure on cells in regions of interest (ROI). Confocal images were captured on a 512 × 512 pixel EMCCD (16 X 16 μm2 pixel size). Pixel depths: active area (180,000 e-) and gain register (800,000 e-), EM gain: 300 and image acquisition: 50 ms exposure with 4-frame averaging. Light exposure and photobleaching experiments were performed using a laser combiner with 40–100 mW 445, 488, 515, and 594 nm solid-state lasers equipped with an Andor FRAP-PA (fluorescence recovery after photobleaching and photoactivation) unit in real-time, controlled by Andor iQ 3.1 software (Andor Technologies, Belfast, United Kingdom). Fluorescent proteins such as mCherry-PH, mCherry-GPI, mCherry-β1, αO-mCherry, mCherry-Gγ9, mCherry-Gγ3, and mitotracker red sensor were imaged using 594 nm excitation−624 nm emission settings. YFP-PH, YFP-Gγ1 and YFP-Gγ2 were imaged using 515 nm excitation and 542 nm emission settings. GFP-Gγ9, and GFP-Lact-C2 were imaged using 488 nm excitation and 525 nm emission settings. Ratio-metric imaging of BODIPY-C11 sensor in cells was imaged using 488-ex/525-em and 594-ex/624-em settings in emission and excitation filters. DHE and DAF-2DA were imaged using (ex/em) 515/620 nm and (ex/em) 488/524 nm wavelength settings, respectively. Power of the 445 nm solid-state laser (50 mW) was reduced to 5 mW and further controlled using an Acousto-optic tunable filter (AOTF) to obtain the desired power (4.86 μW). Cells were exposed to pulses of 445 nm light with 40 μs dwelling time for every one-second time interval (1 Hz) and repeated until a substantial change in the subcellular localization of fluorescent biosensor or tagged G-proteins was observed. Simultaneous live-cell imaging was conducted at room temperature (25 °C). Since our light exposures were in microsecond time scale, minimum non-linear effects were expected (30). Time-lapse images were analyzed using Andor® iQ 3.1 software by acquiring the changes in mean pixel intensity of the entire cell or in selected areas of the cell. Further data processing was performed using Excel (Microsoft office®) and Origin-pro (OriginLab®).
2.5. Confined exposure of cells to blue light
HeLa cells expressing fluorescent biosensors or fluorescently tagged G-proteins (PIP2 sensor (mCherry-PH, YFP-PH), phosphatidylserine sensor (GFP-Lact-C2), mCherry-Gγ (γ9 or γ3), GFP-Gγ9, mCherry-Gβ1, αO-mCherry, mCherry-GPI, YFP-Gγ (γ1 or γ2) or mCherry-Ras (KRas or MRas)) were selected considering their expression levels. Design of the PIP2 sensor (mCherry-PH) is described previously (12,29). Briefly, the pleckstrin homology (PH) domain of phospholipase C-δ1 (PLCδ1) is tagged with a fluorescent protein. The PH-PLCδ1 domain has a high affinity towards PI(4,5)P2 but not the other PIPs in cells (29,31). The focal plane was locked using the perfect focusing system (PFS). Cells were supplemented with all-trans-retinal (50 μM) for 10 minutes in the dark before the blue-light exposure and imaging. All live-cell imaging experiments were conducted in a dark room. After capturing pre-light-exposure time-lapse images for fluorescent proteins or sensors at 1 Hz for 20–60 seconds, in addition to imaging, cells were exposed to blue light (4.86 μW of 445 nm) using the FRAP-PA module at 1 Hz for 5–10 minutes. Perturbations in the subcellular localizations of fluorescent molecules were monitored using the fluorescence increases in internal membranes (IMs) after BLE-retinal exposure. Cells with pre (Fpre) and post (Fpost) BLE-retinal exposure IM-fluorescence ratio; (Fpost/Fpre)>1.2 were considered significant since this level of perturbation was visible. For quantitative analysis, % number of cells with translocated fluorescent sensor compared to the total number of exposed cells in each experiment was calculated. In shuttling experiments with mCherry-PH, mCherry-Gγ9, and mCherry-Gγ3, cells were exposed to blue light from a blue LED source (1529.5±0.1 μW/cm2 at 445 nm) in the presence of 50 μM all-trans-retinal. At 25 °C, half-cell-photobleaching using FRAP-PA module was followed by measuring fluorescence recovery until the equilibrium was reached. Shuttling halftimes were calculated by measuring the time to half-maximum recovery.
2.6. Light power measurements
Light powers of lasers, including 445 nm laser, and sunlight were measured using a light meter, Ophir® PD-300UV (Ophir photonics, Israel) with the filter-in mode. StarLab® (Ophir photonics) software was used to acquire power measurements of lasers. Absolute irradiance measurements and spectra of sunlight, blue LEDs and green LED were obtained using Ocean optics® STS Microspectrometer (Fl, USA) (equipped with 190–600nm, 50 μm Slit, 400 Core/1 cm SMA Input, QP400–2-SR fiber optics, CC-3-UV-S Cosine Corrector) and analyzed by Oceanview® software.
2.6a. Light sources and irradiation protocols
| Light source | Wavelength range at FWHM (nm) | Irradiance (μW/cm2/nm) or Light power (μW/cm2) | Frequency | Instrument |
|---|---|---|---|---|
| Blue LED (445 nm) | 425–490 | 1529.5 μW/cm2/nm | Continuous | Microspectrometer |
| Blue LED (415 nm) | 400–425 | 1730 μW/cm2/nm | Continuous | Microspectrometer |
| Green LED (524 nm) | 510–540 | 257 μW/cm2/nm | Continuous | Microspectrometer |
| Sunlight | 320–640 | 62 μW/cm2 (at 445 nm) | Continuous | PD-300UV |
| Laser | 445±3 | 4.8 μW/cm2 (at 445 nm), 45 μW/cm2/nm |
1 Hz (dwell time 40 μs) | PD-300UV, Microspectrometer |
Laser power calculations have been described previously (32). The ambient light conditions were measured using power and irradiance meter as explained above. Exposure to ambient light was avoided in all light exposure experiments by conducting experiments in a designated dark room equipped with red lights. Additionally, glass-bottomed dishes were covered with Aluminum foil prior to sunlight exposure of cells.
2.7. Analysis of subcellular localization of retinal in cells by GC-MS
HeLa cells were grown in 100 mm cell culture dishes, as stated previously. At 70–80% confluency, the media was aspirated, and cells were washed with 1X PBS once to remove residual medium and serum. Cells were lifted using versine-EDTA, the cell suspension was centrifuged at 1000×g for 3 minutes, and the cell pellet was obtained. Cell count was taken. 1X HBSS was added to the cell suspension to make 0.01 million cells/μL suspension, and 100 μL aliquots of cell suspension (1 million cells) were transferred to microcentrifuge tubes. The next steps were performed in a dark room with dim red-light environment.
To the centrifuge tube containing cells, 2 μL of 50 mM all-trans-retinal was added to obtain 1 mM retinal concentration. The centrifuge tube was vortexed at the lowest speed for 5 minutes to ensure the proper mixing and incorporation of retinal into cell membranes. Then cells were centrifuged at 16000×g for 1 minute, and supernatant was discarded. The cells were resuspended using 200 μL of HBSS and thoroughly mixed followed by centrifugation at 16000×g for 1 minute. The supernatant was discarded. This washing process of cells was repeated one additional time to remove most of the residual retinal that was not incorporated into cells. The supernatant was discarded. Then 200 μL of HPLC-grade water was added to the cell pellet, resuspended and thoroughly mixed. Water was used for resuspension of cells to ensure the leaking out of cytosolic fraction after cell swelling. Next, cells were centrifuged at 16000×g for 1 minute, the supernatant was discarded, and another 100 μL of water was added to cells and resuspended. The freeze-thawing of cells was performed on a dry ice-ethanol mixture three times to ensure cell lysis and elimination of the cytosolic fraction without disrupting cell membranes. Then the cell suspension was transferred to a glass tube and centrifuged at 16000×g for 2 minutes at room temperature. The supernatant was removed, and cells were subjected to vacuum evaporation for 15 minutes at 45 °C to dry cell membrane samples. Next, retinal in cell membranes was extracted using dichloromethane (100 μL) and analyzed by GC-MS via direct injection.
Separation and detection were conducted using a 7890B-5977B GC-MS (Agilent Technologies, Santa Clara, CA, USA) equipped with a DB-5MS (30 m × 0.25 mm × 0.25 μm) capillary column (Agilent Technologies, Santa Clara, CA, USA). The GC-MS system was also equipped with an MPS2 autosampler (GERSTEL.Inc, Linthicum, MD, USA) for automated injection. 1 μl of the retinal extract was injected into the gas-chromatograph, in splitless mode, at 270 °C. Ultra-pure helium gas was used as the carrier gas at a flow rate of 1 mL/minute. The initial column temperature was at 150 °C for 10 minutes, and ramped to 240 °C at 5 °C/minute, then ramped to 310 °C at 15 °C/minute and finally held for 10 minutes. The temperatures of MS detector transfer line, MS quadrupole, and MS source were set at 280, 150, and 230 °C, respectively. Electron impact ionization was used to generate gas-phase ions, and the quadrupole was operated in full scan mode in the range of 40−550 m/z. Identification of the retinal peak was carried out by retention time match after injection of the pure standard and mass spectrum match with NIST-17 library entry.
2.8. Intracellular ROS detection and imaging of mitochondria
ROS sensor staining protocols were performed according to the manufacturer’s protocols. Briefly, HeLa cells seeded on glass-bottom dishes were incubated with DHE (10 μM) or DAF-2DA (10 μM) in PBS respectively for 10 minutes. Then cells were washed with PBS (1 mL x 2 times) to remove excess dye. Wavelength settings (ex/em) of 515/620 nm and 488/524 nm were used to capture the changes in DHE and DAF-2DA fluorescence in cytosol or internal membranes of cells respectively, before and after exposure to BLE-retinal (50 μM all-trans-retinal, 4.86 μW of 445 nm). Data was acquired at room temperature at 25 °C using Andor® iQ software as mentioned previously.
2.9. ROS scavenger assay
HeLa cells seeded on glass-bottom dishes were incubated for four hours with ROS scavengers such as α-tocopherol (1 mM), ascorbic acid (500 μM), glutathione ethyl ester (500 μM). Then cells were incubated with all-trans-retinal (50 μM) in the dark (10 minutes) and exposed to blue LED light for 10 minutes. Control experiments were conducted by incubating cells with either all-trans-retinal (50 μM) in the dark (10 minutes) or exposing cells to blue light only (10 minutes). Blue LED light with 1730 μW/cm2 at 415 nm was used for light exposure. Next cells were stained with DHE sensor as described previously. Assays were conducted at room temperature (25 °C). Cells stained with DHE were counted, and quantitative analysis was performed.
2.10. Mitochondrial membrane potential measurement assay
HeLa cells seeded on glass-bottom dishes were incubated with JC-1 dye (2 μM in HBSS, 30 minutes at 37° C) according to manufacturer’s recommendation. JC-1 sensor’s dual fluorescence was imaged using 488/524 nm and 594/624 nm excitation/emission wavelength settings. Then cells were incubated with all-trans-retinal (50 μM) in the dark for 10 minutes, and selected cells in the field of vision were exposed to blue light (445 nm) using FRAP-PA device for 5 minutes. Control experiments were conducted by exposing cells with blue light only. Assays were conducted at room temperature (25 °C). The ratio of green: red fluorescence was calculated to determine the change in mitochondrial membrane potential.
2.11. BODIPY/C11 lipid peroxidation assay
BODIPY-C11 staining was performed according to the manufacturer’s protocol. Briefly, a solution of BODIPY/C11 (10 mM) was prepared in DMSO and diluted in HBSS to prepare a solution with final concentration of 10 μM. HeLa cells were incubated in the BODIPY containing HBSS solution for 15 minutes. The ratiometric fluorescence (488-ex/525-em, 594-ex/624-em) in cells was captured before and after exposing cells to blue light excited-retinal (50 μM all-trans-retinal, 4.86 μW of 445 nm). Similarly, rose bengal (25 μM) was supplemented to BODIPY-C11 incubated cells and imaged to obtain the ratiometric fluorescence as described above. Here, cells were not separately exposed to green light, because rose bengal’s absorbance spectrum (λmax=540 nm) overlaps with the imaging wavelength settings of BODIPY-C11, providing sufficient light excitation for singlet oxygen generation. Quantitative data was acquired from Andor® software as mentioned previously.
2.12. GC-MS analysis of farnesyl and geranylgeranyl alcohols
Farnesyl alcohol (FA) (500 μM) and geranylgeranyl alcohol (GGA) (500 μM) were prepared in HPLC grade ethanol. 100 μL samples of each alcohol (FA or GGA) were used for the following experiments: i.) alcohol and 30 minutes exposure of blue light, ii.) alcohol and all-trans-retinal (250 μM) followed by 30 minutes exposure of blue light and iii.) alcohol and rose bengal (RB) (10 μM) followed by 30 minutes exposure of green light. Blue LED light: (1529 μW/cm2 at 445 nm), Green LED light: (257 μW/cm2 at 524 nm). GC-MS separation, detection and analysis conditions of alcohols were the same as mentioned in the method for analysis of subcellular localization of retinal in cells. For FA, two peaks were observed in the chromatogram corresponding to both cis and trans isomers. The peak areas were calculated in each experiment for both FA and GGA.
2.13. ESI-MS analysis of chemical signatures in signaling biomolecules
Stock solutions of Farnesyl alcohol (FA) (50 mM) were prepared in HPLC-grade ethanol. Then appropriate dilutions were made to prepare 100 μM Farnesyl alcohol solutions. Ethanol was selected as the optimized solvent among methanol, hexane, n-butanol and petroleum ether for retinal and blue light-induced degradation of FA. For the mass analysis, FA samples were prepared in 50%:50%:0.1% (v/v/v) HPLC-grade methanol/water/formic acid. The following reaction conditions were tested for FA: (a) FA exposed to blue LED light (1529.5±0.1 μW/cm2 at 445 nm) for 30 minutes, and (b) FA with all-trans-retinal (250 μM), followed by exposure to blue LED light (1529.5±0.1 μW/cm2 at 445 nm) for 30 minutes. (c) FA with rose bengal (10 μM), (d) FA with rose bengal (10 μM), followed by exposure to green LED light (257 μW/cm2 at 524 nm) for 20 minutes. FA samples were analyzed by nano-ESI-MS in positive ion mode using Waters Synapt HDMS nanoESI-Q-TOF or LTQ Orbitrap XL™, ETD Hybrid Ion Trap-Orbitrap Mass Spectrometer. Instrument parameters for Waters Synapt HDMS nanoESI-Q-TOF: 1 μL/minute flow rate, 3 kV capillary voltage, 45 V sample cone voltage, 4 V extraction cone voltage, 90 °C source temperature, 6 eV trap collision energy, and 1950 V detector voltage. Instrument parameters were kept constant for all samples. Nano-ESI-MS/MS spectra were acquired for 1 minute and averaged. MassLynx® (version 4.2, Waters) and Xcalibur® (version 4.0, Thermo) were used for data acquisition and analysis.
2.14. Determination of cell viability
Previously described procedure for MTT assay was used (33) with modifications to determine the viability of HeLa cells upon dark and sunlight exposure in the presence of different retinal concentrations. HeLa cells were seeded on 24-well plates at a density of 0.05×10⁶ cells per well. At ~80% confluency, media was aspirated and replaced with MEM media without serum. The MEM media was supplemented with all-trans-retinal in the following concentrations; 0, 0.01, 0.1, 0.25, 0.5, 0.75, 1, 10 and 100 μM. Replacing MEM media containing retinal in 24-well plate was conducted in dim red-light conditions and plates were covered with aluminum (Al)-foil and incubated for 10 minutes at 37 °C in the 5% CO2 humidified incubator. The incubation step was performed to allow retinal to accumulate in cells sufficiently. Al-foil of one plate was removed and exposed to sunlight for 30 minutes while keeping the lid closed. The average light power of the sunlight was 62 μW/cm2 (at 445 nm) measured using Ophir® PD-300UV (Ophir photonics, Israel). The well plate covered with an Al-foil was kept next to the sunlight exposed well plate, to ensure the same environmental conditions. Next, media in well plates were aspirated. Stock MTT solution (5 mg/mL) was used to prepare the working MTT solution (0.25 mg/mL) with HBSS and 500 μL of working MTT solution was added to each well. Al-foil covered well plates were kept in the 5% CO2 humidified incubator at 37 °C for 4 hours. The MTT solution was aspirated carefully without disrupting cells and formazan crystals. In to each well, 400 μL of DMSO was added to dissolve formazan crystals and plates were shaken on an orbital shaker for 5 minutes to dissolve formazan crystals completely. The absorbance readings were acquired using a plate reader at 570 nm absorbance settings.
2.15. PIP2 sensor translocation in cells by apoptosis induction
HeLa cells expressing PIP2 sensor (mCherry-PH) were incubated with staurosporine (1 μM) for four hours at 37 °C in the 5% CO2 humidified incubator. Control cells were incubated with DMSO (1 μL) for four hours. Cells were imaged to determine PIP2 sensor localization.
2.16. TUNEL assay
ARPE-19 cells were seeded on a 14 mm glass-bottom dish and utilized in the following experiments under the following conditions: (a) all-trans-retinal (50 μM) in the dark for 30 minutes, (b) all-trans-retinal (50 μM), followed by exposure to blue LED light (1730 μW/cm2 at 415 nm) for 30 minutes and (c) only blue LED light for 30 minutes. Cells were stained with TUNEL reagent according to manufacturer’s recommendation. Briefly, medium over cells was aspirated and working TUNEL solution (50.5 μL) was added to cells and kept in a 37 ° C incubator for one hour. Cells were subsequently washed with 1X PBS (200 μL) and replaced with 100 μL of the provided reaction buffer. Cells were imaged using 40X objective with 594/624 nm excitation/emission wavelength settings. TUNEL positive cells were identified as cells with bright red fluorescence at their nuclei.
2.17. UV-VIS analysis of retinal degradation in an aqueous environment
All solution preparations and experiments were conducted in the dark under dim-red light. 1 μL of 50 mM all-trans-retinal stock solution (in Ethanol) was used to make 1 mL of 50 μM retinal solutions in water, HBSS, PBS, DPBS, and HEPES. UV-VIS spectra were acquired from 200–800 nm wavelength range for retinal (50 μM) in above buffers in the dark for prolonged time with and without mixing the solution to check if retinal precipitation occurs in the dark. Similar experiments were conducted for retinal in above buffers after exposing to blue light.
Additionally, Retinal in HBSS was extracted with three 500 μL aliquots of dichloromethane (DCM). Extractions were performed for retinal in the dark and retinal exposed to blue light (15 minutes). UV-VIS analysis was performed for DCM extracts. All UV-VIS spectra were acquired using UV-1800 spectrometer (Shimadzu Corporation, Kyoto, Japan).
2.18. Analysis of retinal degradation by HPLC
HPLC analysis of retinal degradation in aqueous solutions was performed using an HPLC system equipped with a reverse-phase column (C-18 polaris® column, 60 Å, 3 μm, 4.6 × 150 mm) with an isocratic flow of 100% Methanol at 0.2 mL/minute flow rate. A deuterium lamp UV detector was used at 370 nm to identify retinals.
2.19. Statistical data analysis
Statistical analysis and data plotting were performed using Origin Pro® (Origin lab®) software. Results of all quantitative assays (PIP2 sensor translocation, Gβγ translocation, ROS sensors’ dynamics, BODIPY-C11 sensor dynamics, Shuttling of Gγ9, Gγ3 and PIP2, sunlight-excited retinal induced cytotoxicity assay) are expressed as standard error of the mean (SEM) and farnesyl and geranylgeranyl degradation analysis is expressed as standard deviation (stdev) from n numbers of cells (indicated in the figure legends) from multiple independent experiments. One-way or two-way ANOVA tests were performed for Gγ9, Gγ3 & PIP2 shuttling half times, sunlight-excited retinal induced cytotoxicity (% cell viability) and farnesyl & geranylgeranyl degradation analysis to compare responses in each experiment. p< 0.05 was used.
3. Results and Discussion
3.1. BLE-retinal induces mislocalization of farnesylated G-proteins
3.1.1. Heterotrimeric G-proteins
When HeLa cells expressing PIP2 sensor, mCherry-PH, were incubated with ATR in the dark for 10 minutes and exposed to blue light (445 nm and 4.86 μW), cells exhibited an irreversible and retinal concentration-dependent translocation of PIP2 sensor from the PM to the cytosol (Fig. 1A)(12). Here, we employed the PIP2 sensor translocation as a positive control for retinal photosensitization, as we have shown before (12). In the presence of ATR, cells exposed to blue light for 5 minutes showed a primarily cytosol-localized PIP2 sensor. Indicating the irreversibility of the process, even after 75 minutes of post blue-light-exposure, PIP2 sensor remained cytosolic (Fig. S1). PIP2 sensor contains the PH-domain of PLCδ tethered to a fluorescent protein of choice (29,31). This sensor interacts with the phospholipid headgroup in PIP2. Once PIP2 is hydrolyzed to IP3 and DAG, IP3 headgroup-bound sensor translocates to the cytosol (34,35). However, we previously showed that BLE-retinal does not induce PIP2 hydrolysis (12). How does then the PIP2 sensor translocate to the cytosol during BLE-retinal exposure? Polyunsaturated fatty acids (PUFAs) are major targets of lipid peroxidation (36), if BLE-retinal induces peroxidation of the sn-1-stearoyl-2-arachidonoylglycerol moiety of PIP2, the structure and thus the properties of PIP2 should be altered. Peroxidation has been shown to reduce the lipophilicity of lipids (37), and ionizing radiation-induced peroxidation and degradation of phosphatidylglycerol in aqueous media has been observed (38). Therefore, we propose that the observed PIP2 sensor translocation is a result of peroxidation-induced distortion of PIP2 structure and disruption of PIP2:mCherry-PH interactions. Though the phototoxicity of retinal can likely be a key factor in vision-related diseases, in this work, we explored mechanisms of retinal-induced phototoxicity as a universal cytotoxicity inducer, for many cell types including skin cells. HeLa cells in particular were employed to investigate this universality of retinal phototoxicity. Experiments with ARPE-19 cells were conducted to show that retinal-phototoxicity indeed affects retinal pigment epithelial cells as well. Additionally, endogenous expression of photoreceptors including OPN4 (melanopsin) and OPN1mw/lw in ARPE-19 cells (39) and their activation of multiple G-protein signaling pathways (Gi and Gq-signaling) upon blue and other wavelengths of light (40) also motivated the use of HeLa cells. Nevertheless, further investigations using live-retinas and animal studies are required to examine whether effects of blue light and retinal –induced phototoxicity are linked to vision damage as in age-related macular degeneration or skin diseases.
Fig. 1.

BLE-retinal induces PIP2 and farnesylated G-protein translocation from the PM. A. HeLa cells expressing mCh-PH (PIP2 sensor) were incubated with ATR (50 μM) and exposed to pulses (1 Hz) of blue light (4.86 μW of 445 nm laser) or hereafter referred to as BLE-retinal. An irreversible PIP2 sensor translocation from the PM to cytosol was observed. The plot shows that the extent and the rate of PIP2 sensor translocation is retinal concentration dependent. B. Cells expressing either mCh-γ9 (FAR) or mCh-γ3 (GER) similar to A, were exposed to BLE-retinal. mCh-γ9 translocated to IMs, while mCh-γ3 remain unperturbed. Plot shows that recovery of mCh-γ9 on PM was not observed upon the removal of blue light exposure. C. To HeLa cells expressing endogenous α2-adrenergic receptors (α2AR) with either mCh-γ9, or mCh-γ3, norepinephrine (NE, 100 μM) was added at 60 s and yohimbine (YMB, 100 μM) at 300 s to activate and deactivate α2ARs, respectively. mCh-γ9 showed a robust translocation (yellow arrow) and recovered upon antagonist addition. Although mChGγ3 showed a similar behavior, its translocation was slow, and the extent was low. (mean ± S.E.M, n = 8 for γ3 and n = 13 for γ9). For Tt½ calculation of γ3, HeLa cells expressing α2AR-CFP and mCh-γ3 were used and α2ARs were activated using 100 μM norepinephrine (NE) and imaged for ~600 s until equilibrium. Bar graph: Comparison of permanent translocation induced by BLE-retinal (n = 6 for γ9) and transient translocation of Gγ (n = 16 for γ3 and n = 13 for γ9) induced by α2AR activation (mean ± S.E.M). rev. = reversible, irrev. = irreversible, ND = not detected. D. When exposed to BLE-retinal, irreversible translocations of mCh-KRas and mCh-MRas from PM to IMs were observed. Supposedly GERGER mCh-MRas showed only a minor translocation. E. Examination of pre and post BLE-retinal exposure shuttling of mCh-γ9, mCh-γ3 or mCh-PH. After half of the cell photobleaching of mCh (594 nm, 50 mW) with and without BLE-retinal exposure; images show fluorescence recovery in the photobleached area (yellow arrow) of each cell. F. The bar graph shows shuttling half times of Gγ9, Gγ3 and mCh-PH in photobleached regions, before (n = 8 for γ9, n = 11 for γ3, n = 22 for PIP2) and after (n = 28 for γ9, n = 15 for γ3 and n = 29 for PIP2) BLE-retinal exposure (mean ± S.E.M). Here, cells were exposed to blue light from a blue LED source (1529 μW/cm2 at 445 nm) and is also termed as BLE-retinal. Fluorescent protein, mCherry is abbreviated as mCh. Scale = 5 μm. (For interpretation of the references to colour in this figure legend, the reader is referred to the web version of this article.)
To identify broader cellular consequences of chemical processes that led to the proposed BLE-retinal induced PIP2-distortion, we examined if the same reactions perturb the PM-localization of G-protein gamma (Gγ) subunits. Gγ contains a polyunsaturated lipid anchor (isoprenyl) at the carboxy terminus (CT). Gγ forms stable dimers with Gβ, and Gβγ forms a heterotrimer with Gα. Gα bears a myristoyl, a palmitoyl or both lipid anchors for its PM-interactions. HeLa cells expressing either mCherry tagged Gγ9 or Gγ3 subunits were incubated with ATR in the dark and exposed to 1 Hz pulses of blue light (445 nm). Gγ9 is lipidated with a shorter farnesyl (fifteen-carbon) lipid, and Gγ3 with a longer geranylgeranyl (twenty-carbon) lipid. Interestingly, mCherry-γ3 did not show a visually-detectable translocation upon exposure of cells to BLE-retinal (Fig. 1B-top, Fig. S2A). A minor increase in mCherry fluorescence in IMs, only in 6.3±3.3% of cells was observed for mCherry-γ3. Interestingly, a robust and irreversible translocation of mCherry-Gγ9 from the PM to IMs was observed upon blue light exposure in 76.0±6.5% of cells (Fig. 1B-bottom, Fig. S2A, movie-S1). To examine whether this translocation was indeed due to the removal of fluorescently tagged G-protein from the PM, cells were co-expressed with GFP-γ9 and mCherry-GPI (a fluorescent PM marker). Upon exposure to BLE-retinal, only GFP-γ9 translocated to IMs while mCherry-GPI remained on the PM (Fig. S3). This BLE-retinal induced Gγ9 translocation was distinctly different from the classical Gβγ translocation observed when G protein heterotrimers are activated by GPCRs (32,41) (Fig. 1C). We previously showed that, upon GPCR activation, Gβγ subunits translocate from the PM to IMs and upon deactivation of GPCR, the process reverses (32,41). BLE-retinal induced a relatively slow (t½=114.1 ± 12.3 s), a linear (R2=0.9655) and an irreversible Gγ9 translocation response (Fig. 1C-bar graph). However, α2-adrenergic receptor (α2-AR) activation-induced a fast (Tt½=14.8 ± 1.1 s) and robust Gγ9 translocation compared to a ~20-fold slower (Tt½=332.8 ± 23.5 s) and minor translocation of Gγ3 (Fig. 1C). Reversed translocations were also observed after inhibition of the receptor with yohimbine. These GPCR induced translocations can be characterized using enzymatic modified-Hill equation. We have previously shown that Gγ3 possesses a higher PM affinity compared to Gγ9, partially due to its longer geranylgeranyl anchor (42). These data indicate two translocation responses (BLE-retinal and GPCR-induced) are governed by distinct processes. Similar to Gγ9, BLE-retinal also induced YFP-Gγ1, (another farnesylated Gγ), translocation in 44.4±13.8% of the exposed cells (Fig. S2A, B). Another geranylgeranylated Gγ, Gγ2 exhibited only a minor translocation upon exposure to BLE-retinal also only in a 5.0±5.0% of YFP-Gγ2 expressing cells (Fig. S2A, C). Blue light alone (Fig. S2D) or retinal alone (Fig. S2E) failed to disrupt the localization of Gγ in cells. Additionally, cells treated with the lipid-soluble antioxidant α-tocopherol attenuated BLE-retinal exposure induced Gγ9 translocation (only ~22% of cells compared to 63% in the control) (Fig. S2F).
Unlike the PIP2-sensor, the covalently linked fluorescent protein in Gγ shows its subcellular location. The BLE-retinal induced translocation of Gγ from the PM to IMs is indicative of reduced interactions between Gγ and lipid membranes, and their increased mobility. Several-fold higher surface area of IMs compared to the PM explains their accumulation in IMs (43). Distinct differences in Gγ9 and Gγ3 responses to BLE-retinal further indicate that BLE-retinal reduces membrane-Gγ interactions. Additionally, experiments conducted in cells co-expressing GFP-Gγ9 with mCherry-Gβ1 demonstrate that the majority of cells (90%) exhibited Gγ9 translocation also showed mCherry-Gβ1 translocation (Fig. S4A). On the contrary, in cells co-expressing GFP-Gγ9 with GαO-mCherry, only 23% of Gγ-translocated cells showed a minor GαO translocation (Fig. S4B). These results indicate the likelihood of the Gβγ dissociation from Gα upon lipid-peroxidation of Gγ. The lack of GαO translocation can be due to its interactions with the PM through dual N-terminal myristoyl and palmitoyl lipid anchors (44). However, these observations require further investigation.
Polyunsaturated lipids are susceptible to peroxidation (36). To examine how primarily saturated and mono-unsaturated phospholipid, phosphatidylserine (PS), responds to BLE-retinal exposure, subcellular localization of the PS sensor, GFP-Lact-C2 was examined (45). In cells co-expressing GFP-Lact-C2 and mCherry-PH, BLE-retinal only induced mCherry-PH translocation to the cytosol while GFP-Lact-C2 localization remained unchanged (Fig. S5). Even unsaturated anchors in PSs are found to be primarily mono-unsaturated. For instance, PS species 18:0/18:1 and 16:0/18:1 makes up ~40% of PS in HeLa cells (46,47). Since lipid peroxidation primarily occurs in polyunsaturated acyl chains (36), it is likely that the polyunsaturated fatty acyl group in PIP2 is more susceptible for oxidative damage compared to that of PS species. While distinct interactions are probable for the PS sensor (Lact-C2) with PS compared to that of PIP2 with its sensor (PH-PLCδ), we believe the lack of perturbation of PS: GFP-Lact-C2 interactions could be due to limited oxidative damage to PS compared, to PIP2. The other possibility could be the inability of the incurred oxidative damage to disrupt PS: GFP-Lact-C2 interactions.
3.1.2. Small monomeric G-proteins
Similar to Gγ, small monomeric G-proteins such as KRas and MRas interact with the PM primarily through their prenyl anchors. Using HeLa cells, we examined, if these proteins are also susceptible for BLE-retinal induced perturbation of subcellular localization. Both KRas and MRas were initially on the PM and upon exposure to BLE-retinal, 71.4±15.3% KRas and 55.6±13.4% MRas expressing cells exhibited translocation from the PM to IMs (Fig. 1D, Fig. S2A). The extent of KRas translocation was however a ~five-fold higher than MRas. KRas is primarily farnesylated and MRas is geranylgeranylated (48). Even after peroxidation, geranylgeranylated proteins are likely to have higher interactions with membranes compared to farnesylated proteins and therefore, it is not surprising to see the slower and relatively minor translocation of MRas. Even 30-carbon prenylated squalene (a polyunsaturated lipid) has been shown to undergo mono-peroxidation upon singlet oxygen exposure (49–51), and thus it is likely that both types of prenyl groups in G proteins can also be oxidized, in particular mono-peroxidation. These data additionally indicate that BLE-retinal has the potential to perturb localization of many signaling molecules and the associated cellular functions.
3.1.3. Effect of BLE-retinal on shuttling of lipidated molecules in living cells
We hypothesized that BLE-retinal induced chemical modifications to lipid anchors modify shuttling rates of signaling molecules. The shuttling is measured using the rate of the shuttling of lipidated protein from one half of a cell to the other after near-complete half-cell photobleaching. We examined pre and post-BLE-retinal exposure shuttling rates of Gγ3, Gγ9, and mCherry-PH. Fluorescence of mCherry-Gγ and mCherry-PH in half of the single cells was photobleached completely (Fig. 1E). The fluorescence recovery after photobleaching (FRAP) signal in the photobleached half of each cell was monitored until the equilibrium was reached (Fig. 1E, Fig. S6, movie-S2). Calculated shuttling half-times (t½) (mean±SEM) of cells without and with-BLE-retinal exposure respectively for Gγ9: 32.6±3.3 s and 17.7±2.3 s, PIP2: 42.1±3.7 s and 18.7±2.4 s, and Gγ3: 117.4±15.7 s and 85.4±5.3 s. A two-way ANOVA with F (2, 107) = 111.2, p=0.05 shows that BLE-retinal exposure significantly reduces shuttling half-times of the all three molecules (Table S1 and S2). Thus, BLE-retinal exposure induced a ~46% increase in Gγ9, 56% in PIP2 sensor and 27% in Gγ3 shuttling rates (Fig. 1F-bar graph). The ANOVA also indicates that the effect of BLE-retinal exposure on perturbation of subcellular distribution of Gγ9 is significantly higher than Gγ3, as well as PIP2 (Table S1 and S2).
Reduction of the affinity to lipid membranes and the enhanced translocation of heterotrimeric as well as Ras family G-proteins indicate a broader footprint of signaling perturbation by BLE-retinal. Data also show membrane-interacting molecules with higher shuttling rates (or low membrane interactions) are more susceptible to a further reduction in their membrane interactions upon exposure to BLE-retinal. Therefore, we predict that polyunsaturated lipid-bearing molecules are susceptible to oxidative damage by BLE-retinal during their residence at the PM. Our data further suggest that the effect of BLE-retinal is more significant on molecules with low membrane affinities, affecting their subcellular localization, as well as functions than molecules with high membrane affinities. For instance, compared to Gγ9, we showed Gγ3 has strong interactions with lipid membranes due to its positively-charged (poly-basic) amino acids at the carboxy terminus (42) as well as the five-more carbons longer lipid anchor. Therefore, the disruption of Gγ3 localization, even after peroxidation, would be less than that of Gγ9.
Among the large cohort of membrane-interacting proteins, the Ras superfamily members regulate important signaling events and play critical roles in numerous pathological conditions including cancer (52). Similar to Gγ, C termini of Ras proteins contain positively charged residues and interact with the negatively-charged phospholipids on the PM (53). Since oxidation of acyl chains in PIP2 followed by its distortion has been reported (54), BLE-retinal induced mislocalization of G-proteins from the PM can partially be due to the perturbation of phospholipids in the PM. Since PM-interacting proteins are major signaling regulators, the effect of BLE-retinal induced perturbation to their signaling, and subsequently to the cell survival, can be extensive.
3.2. Retinal accumulates in lipid membranes of cells, facilitating photoreceptor-independent excitationrelaxation cycles
Since BLE-retinal perturbs membrane-interacting signaling lipids, subcellular-location of retinal to facilitate such photochemical reactions was explored. Retinal is lipophilic (log P=~6.3). Therefore, we anticipated that retinal accumulates primarily within the hydrophobic core of lipid bilayers including, the PM and IMs (i.e. Golgi and ER). Perturbation of membrane properties such as erythrocyte-membrane microviscosity changes by retinoic acid and its derivatives have been demonstrated (55). Lipofuscin A2E-induced membrane instability has also been documented (56). Though literature suggested that retinal accumulation can disrupt membrane properties, our data show that such disruption requires retinal photosensitization by blue light as well.
Retinal in aqueous buffers including HEPES, PBS, DPBS, and HBSS were exposed to blue LED light (445 nm, 1529 μW/cm2 (Fig. S7A)) and analyzed using UV-VIS spectrometry. UV-VIS spectra showed the reduction of 420–450 nm retinal peak, indicating rapid retinal degradation (τ=10–20 s) (Fig. S8A-D). Solutions were mixed thoroughly to avoid signal loss due to possible retinal precipitation. Retinal dissolved in the same buffers and yet maintained in the dark showed no degradation (Fig. S8A-D). These UV-VIS spectra do not show the characteristic 290 nm and 430 nm peaks for retinal dimers, and therefore indicate the lack of retinal dimer formation. We also performed UV-VIS analysis of dichloromethane (DCM)-extracted retinal from HBSS, either maintained in the dark or exposed to blue light for 15 minutes to eliminate possible errors due to retinal precipitation in water (Fig. S8E). Compared to the unexposed sample, UV-VIS spectrum of DCM extract of blue light exposed retinal showed a significant retinal degradation (~96%). Therefore, if retinal were to be in the aqueous regions of cells including the cytosol, a rapid photodegradation upon blue light exposure should occur (Fig. S8F, S9A).
Though we have previously shown pre-blue-light-exposed-retinal in polar media cannot induce photodamage to cells (12), likely due to its photodegradation, the subcellular location of retinal that supports its phototoxicity was not examined. Since BLE-retinal-induced perturbation of the localization of lipidated molecules occurs over many minutes of light exposure, considering τ=10–20 s of retinal in aqueous conditions, it is unlikely that retinal in the cytosol causes photodamage to cells. When retinal is pre-exposed to blue light in an aqueous medium for 10 minutes and then added to cells, subsequent blue light-exposure of cells failed to induce a detectable PIP2 distortion, also supporting this prediction (Fig. S9A-B). Additionally, lipid anchors of molecules are localized to the lipid bilayers. Therefore, to induce oxidative damages, we examined if retinal is encapsulated in lipid bilayers of cells using HeLa cells pre-incubated with retinal. Here, cells were washed thoroughly with HBSS to remove any remaining extracellular retinal and to remove the cytosolic portion of cells upon cell lysis. The ghost cell-membrane fractions were extracted using dichloromethane and analyzed using gas chromatography-mass spectrometry (GC-MS) (Fig. 2A). Distinct chromatographic peaks of retinal isomers, with characteristic mass spectral fragmentation patterns, including the molecular ion at m/z 284, were detected (Fig. 2B-red line). Cells only incubated with the vehicle solvent, otherwise treated equally, did not show these characteristic retinal peaks (Fig. 2B-black line). This data shows retinal enters cell membranes and could not be removed even after cell-lysis and repeated washing. When a selected region of a retinal-pre-exposed HeLa cell was exposed to blue light, PIP2 distortion was only observed in the light-exposed subcellular area. This indicates that the photoexcitation of retinal is localized (Fig. 2C). These data collectively suggest that retinal is enriched in cell membranes, thus the lipid environment protects it from degradation while providing an environment for repeated retinal photosensitization.
Fig. 2.

Subcellular localization of retinal in mammalian cells. A. Workflow of analysis of retinal entrapped in cell membranes. B. GC–MS analysis and GC–MS spectra of retinal extracted from washed cell membranes. Data were acquired from 4 independent replicates with an overall RSD % of 12.2%. The average and RSD % values were obtained by considering the total area for the 4 isomers of retinal peaks detected. C. Upon exposure a half of HeLa cell expressing PIP2 sensor, YFP-PH to BLE-retinal, an irreversible YFP-PH translocation from the PM to cytosol only in light exposed regions was observed. (blue box = Blue light (BL)). Kymograph of a cross section of a cell (yellow dashed line) show the disappearance of PIP2 on PM in the light exposed regions (yellow arrow) compared to unexposed regions. The plot shows the dynamics of PM fluorescence of PIP2 in exposed vs non-exposed PM regions of cell in C. Scale = 5 μm. (For interpretation of the references to colour in this figure legend, the reader is referred to the web version of this article.)
3.3. BLE-retinal generates ROS, induces lipid peroxidation and challenges mitochondrial integrity in cells
To determine whether membrane-entrapped retinal in living cells generates ROS upon blue light-exposure, fluorescent probes for superoxide and nitric oxide detection, dihydroethidium (DHE) and 4,5-Di-aminofluorescein diacetate (DAF-2DA) respectively, were used (57,58). HeLa cells incubated with these probes exhibited a two-fold increase in fluorescence (DHE: red, DAF-2DA: green) upon exposure to BLE-retinal, demonstrating the ROS generation (Fig. 3A, B, movie-S3 and movie-S4). In the same field of vision, cells that were not exposed to blue light did not exhibit fluorescence intensity changes. In a control experiment, cells exposed only to blue light in the absence of ATR did not show an increase in DAF-2DA fluorescence (Fig. S10). To ascertain that the fluorescence changes are due to superoxide generation, cells were exposed to ATR and blue LED (1730 μW/cm2 at 415 nm, Fig. S7B) in the presence of ROS scavengers, ascorbic acid (to scavenge H2O2, OH., O2−.), α-tocopherol (to scavenge 1O2, peroxyl) and glutathione ethyl ester (to scavenge OH.)(59,60). Cells incubated with ROS scavengers showed significant decreases in superoxide production upon BLE-retinal exposure (Fig. S11). These data suggest the potential of antioxidants to mitigate retinal photosensitization-induced oxidative damage.
Fig. 3.
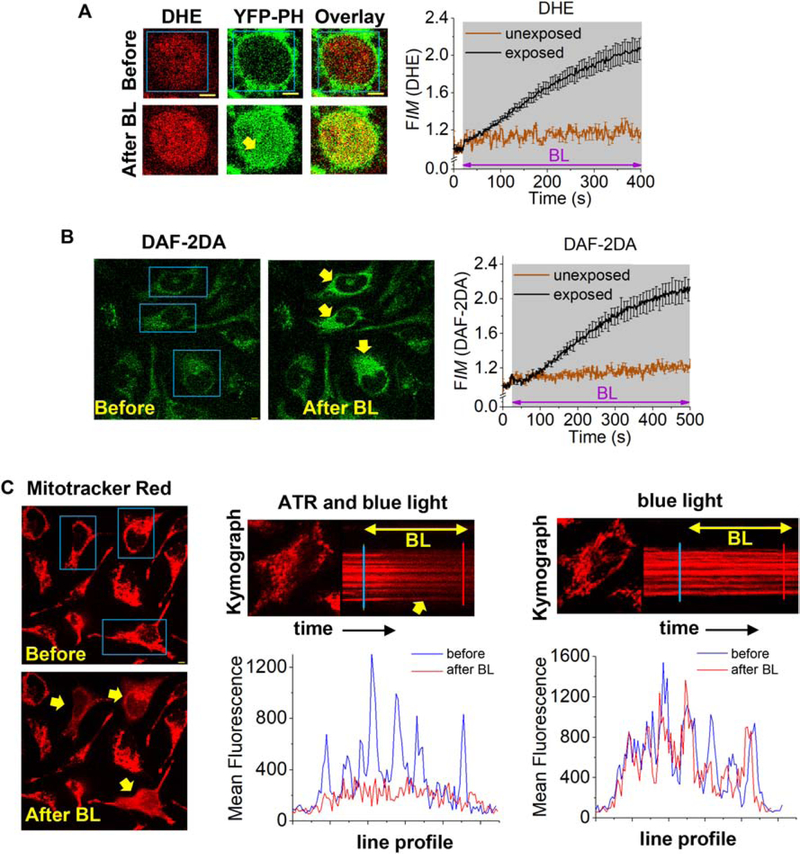
BLE-retinal trigger generation of reactive oxygen species in HeLa cells. A. HeLa cells expressing YFP-PH and incubated with dihydroethidium (10 μM, 10 min) were exposed to BLE-retinal. A cell and the plot show increase in DHE’s red fluorescence indicating superoxide generation on BLE-retinal exposure (mean ± S.E.M, n = 19 cells (exposed), n = 6 (unexposed)). YFP-PH also shows translocation to the cytosol (yellow arrows). B. Images and plot show that HeLa cells incubated with DAF-2DA (10 μM, 10 min) and only BLE-retinal exposed cells exhibiting increase in DAF-2DA’s green fluorescence indicating nitric oxide formation (mean ± S.E.M, n = 8 cells (exposed), n = 10 (unexposed)). Note that cells in the same field only exposed to retinal alone did not respond. C. HeLa cells were stained with mitochondrion marker, mitotracker red (100 nM) and selected cells were exposed to BLE-retinal. Fluorescence distribution of mitotracker red changed significantly, only in exposed cells (yellow arrows), indicating mitochondrial membrane-damage. Kymographs and line fluorescence profiles also show that only cells exposed to BLE-retinal exhibited change in fluorescence. This fluorescence change is not due to photobleaching, since cells only exposed to blue light alone did not show a change. Blue box = blue light (BL). Mean and S.E.M are from 3 < independent experiments. Scale = 5 μm. (For interpretation of the references to colour in this figure legend, the reader is referred to the web version of this article.)
We also examined whether BLE-retinal exposure challenges mitochondrial integrity in HeLa cells, since ROS mediated mitochondrial damage is well established (61,62). In the presence of retinal, only cells exposed to blue light showed a significant change in the mitotracker red distribution (Fig. 3C, movie-S5). The kymographs of mitotracker red-stained HeLa cells, and their respective cross-section line profiles, show that mitochondrial membranes are disintegrated in BLE-retinal exposed cells while blue light exposure alone or retinal alone did not show a significant mitochondrial disintegration (Fig. 3C-plots). Additionally, we examined the effect of BLE-retinal on mitochondrial membrane potential using JC-1 sensor (63). Upon retinal and blue light exposure, ~54% of cells showed reduction in mitochondrial membrane potential (depolarization), demonstrated by the increased green fluorescence and decreased red fluorescence (Fig. S12A, C). Control cells exposed only to blue light showed a minor depolarization, only in ~3% of cells (Fig. S12B, C). These data demonstrate not only BLE-retinal induces ROS production in living cells but also compromises mitochondrial integrity.
Since our data from living cells on phospholipids and prenylated-G proteins suggest that BLE-retinal oxidizes PUFA anchors in PM-interacting signaling molecules, oxidation of phospholipids by ROS was probed using a lipid peroxidation sensor, BODIPY-C11 (6). BODIPIY-C11 is a ratio-metric fluorescent probe with green (488 nm EX, 515 nm EM) and red (594 nm EX, 620 nm EM) fluorescence. Peroxidation increases the green fluorescence of BODIPIY-C11. Upon exposure to BLE-retinal, we observed a ~ 2-fold increase (when measured at ~300 s) in the green/red ratio of BODIPY-C11 (Fig. 4A, Movie-S6). Cells exposed only to blue light in the absence of ATR did not show significant increase in green/red fluorescence ratio of the sensor (Fig. S13). In a control experiment, rose bengal, a potent photosensitizer that generates ROS and induces lipid peroxidation (64) was used in place of retinal. HeLa cells pre-incubated with rose bengal (25 μM) and exposed to green light at 1 Hz frequency (imaging cells using 488 nm) showed a ~5-fold increase (when measured at ~300 s) in the green/red fluorescence ratio (Fig. 4B). Additionally, ARPE-19 cells also showed an increase in green/red fluorescence ratio of BODIPY-C11 upon BLE-retinal exposure (Fig. 4C). The similarities in cellular responses induced by BLE-retinal and green-light-excited-rose bengal collectively demonstrate that BLE-retinal induces lipid peroxidation through ROS generation in living cells. Photosensitizers absorb light, excite to a triplet state, and transfer energy to triplet oxygen to form singlet oxygen and ROS (64). These reactive species can oxidize lipids to form lipid peroxidation products (36,65). We argue, similar to photosensitizers, bio-available retinal also generates singlet oxygen and ROS upon photosensitization by blue light. Our cellular observations complement the previously observed photosensitizing ability of retinal (3,9,66,67). We also believe that, even at low retinal concentrations, blue light may inflict cellular damages since continuous retinal release from opsins and continuous photon flux could generate a steady stream of ROS, specially under compromised antioxidant defense.
Fig. 4.

Lipid peroxidation in cells exposed to BLE-retinal. A. HeLa cells incubated with the lipid peroxidation sensor; BODIPY-C11 581/591 (10 μM), with ATR (50 μM, 10 min). Only BL exposed cells showed increase in green fluorescence (ex/em: 488/524) and decrease in red fluorescence (ex/em:594/620), indicating lipid peroxidation. Fluorescence in unexposed cells remained unchanged. The plot shows the dynamics of green/red fluorescence ratio in BL exposed and unexposed cells (mean ± S.E.M, n = 4 cells (exposed), n = 6 (unexposed)). Blue box = blue light (BL) with 4.8 μW at 445 nm. B. HeLa cells were incubated with rose bengal (25 μM) in place of ATR in A. When cells were imaged using 488 nm light, due to the spectral overlap of rose bengal’s absorption spectrum, both images and the plot show that green/red fluorescence ratio of cells in the entire field of vision increased, (mean ± S.E.M, n = 11 cells). C. ARPE-19 cells incubated with BODIPY-C11 581/591 (10 μM), with ATR (50 μM, 10 min). Only blue light (BL) exposed cells showed increase in green fluorescence (ex/em: 488/524) and decrease in red fluorescence (ex/em:594/620), indicating lipid peroxidation. Fluorescence in unexposed cells remained unchanged. The plot shows the dynamics of green/red fluorescence ratio in BL exposed and unexposed cells (mean ± S.E.M, n = 6 cells (exposed), n = 8 (unexposed)). Blue box = blue light with 2.1 μW at 445 nm. Scale = 5 μm. (For interpretation of the references to colour in this figure legend, the reader is referred to the web version of this article.)
3.4. BLE-retinal introduces oxidative chemical modifications to lipid anchors of crucial signaling molecules
Since BLE-retinal induced an increased shuttling of both farnesylated and geranylgeranylated G proteins in living cells, gas chromatography-mass spectrometry (GC-MS) was used to determine if BLE-retinal oxidizes farnesyl alcohol (FA) and geranylgeranyl alcohol (GGA). Chromatographic peaks for FA and GGA with characteristic mass spectral fragmentation were identified (Fig. 5A, B). Control experiments were performed by exposing the alcohols to blue light only (Fig. 5A, B). However, when these alcohols were exposed to BLE-retinal, 12.4±4.9% reduction of FA and 24.8±7.1% reduction of GGA peak-areas were observed, likely due to their peroxidation (Fig. 5C, Table S3). One-way ANOVA with F (1, 10) = 39.2, p=0.05 shows that concentration of FA is significantly reduced after BLE-retinal exposure compared with FA exposed to blue light alone (Table S4). A two-way ANOVA indicates a significant reduction in GGA concentration upon BLE-retinal exposure compared to that of GGA exposed to blue light alone (Fig. 5C, Table S5). When FA and GGA were exposed to rose bengal and green light, a 24.3±11.1% and 40.7±13.5% loss of FA and GGA respectively were observed while a two-way ANOVA analysis shows these reductions in concentrations are significant compared to the controls (Fig. 5C, Table S5). Overall, two-way ANOVA shows that BLE-retinal and green-light-excited-rose bengal exposure induces substantial reductions in FA and GGA concentration, F (2, 30) = 3.45, p=0.05 (Fig. 5C, Table S5). The additional peaks for degraded or oxidized products for FA or GGA were not observed under these GC conditions. Collectively, these data indicate the likelihood of BLE-retinal induced chemical modifications to lipid anchors of signaling molecules.
Fig. 5.

GC–MS analysis of farnesyl and geranylgeranyl alcohols upon light exposure. All experiments were performed in HPLC-grade ethanol. A. Extracted ion chromatograms (m/z 69) of farnesyl alcohol (FA) (500 μM). Note the appearance of two peaks in due to cis-trans isomers of FA. Black: FA exposed to 30 min blue light (1529 μW/cm2 at 445 nm)➔ (BL), red: FA in ATR (250 μM) and 30 min exposure to BL, blue: FA in Rose bengal (RB) (10 μM) exposed to 30 min green light (GL), B. Extracted ion chromatograms (m/z 69) of geranylgeranyl alcohol (GGA) under conditions similar to A. C. Table and bar graphs show the comparison of % degradation of FA and GGA by ATR when exposed to BL and RB with GL. mean ± Std.dev, *, p < .05 (n = 6). GC–MS data from 3 < independent experiments. (For interpretation of the references to colour in this figure legend, the reader is referred to the web version of this article.)
GC-MS data for FA-degradation by BLE-retinal was further confirmed using ESI-HR/MS to examine resultant chemical modifications in FA on BLE-retinal exposure. Using ESI-MS in positive ion mode, a peak corresponding to [FA+H]+ was detected at m/z=223.2217 (Fig. S14A). FA exposed to blue light (without retinal) did not show any changes in chemical signatures in the ESI-HR/MS spectrum (Fig. S14B). BLE-retinal exposed FA showed a peak at m/z=277.1823 (Fig. S14C), suggesting the addition of -O-O. group (increase of 32 in m/z) to the FA sodium adduct, [M+Na+O2]+. These results suggest that BLE-retinal oxidizes FA. The oxidation may have occurred potentially through a peroxidation mechanism in which pentadienyl radical is formed upon H-abstraction followed by addition of oxygen on to the lipid radical forming hydroperoxyl (-O-OH) bond in FA (54,68–70). To validate these findings, FA was exposed to green LED light (257.3±20.4 μW/cm2 at 524 nm, Fig. S7C) in the presence of 10 μM rose bengal for 20 minutes. An intense peak at m/z=277.2068 was observed, also suggesting FA peroxidation (Fig. S14D). A control experiment conducted with ATR exposed to blue light did not show peaks at m/z 277 indicating that m/z 277 indeed corresponds to an oxidized product of FA (Fig. S14E). Overall, these data demonstrate that BLE-retinal follows a photosensitization mechanism similar to rose bengal and induces lipid oxidation.
3.5. BLE-retinal damages DNA in cells
The effect of BLE-retinal on DNA damage was investigated using TUNEL assay, in which cells with DNA damages incorporate fluorescent dUTP through Tdt-enzymatic reaction in DNA nick ends, exhibiting red fluorescence in the nuclei of cells (71). ARPE-19 cells were exposed to BLE-retinal and incubated with TUNEL reagent for 60 minutes. Approximately 77.6±2.0% of BLE-retinal exposed cells were positive for the TUNEL assay, indicating DNA damage. Only 16.9±3.0% cells were TUNEL positive when exposed to blue light alone. Retinal exposure alone resulted in only 0.8±0.4% TUNEL positive cells (Fig. 6). One-way ANOVA analysis with F (2, 57) = 368.5, p=0.05, also shows that DNA damage induced by retinal and blue light exposure is significantly higher compared to either ATR or blue light exposure alone (Table S6). TUNEL assay was also performed for HeLa cells treated similarly. In HeLa cells, BLE-retinal exposure induced 81.3±1.6% TUNEL positive cells, while blue light alone and retinal exposure exhibited 12.6±2.3% and 1.7±0.6% of TUNEL positive cells respectively (Fig. S15).
Fig. 6.

DNA damage visualized by TUNEL assay in ARPE-19 cells exposed to retinal and blue light. ARPE-19 cells were subjected to the following conditions. (i) 30 min blue light (BL) exposure, (ii) ATR (50 μM) in the dark for 30 min and (iii) ATR (50 μM) and 30 min blue light exposure. Cells were stained with TUNEL reagent and TUNEL positive cells were identified using fluorescence microscopy. BLE-retinal exposure resulted in 77.6 ± 2.0% TUNEL positive cells, while cells subjected to either BL or ATR showed 16.9 ± 3.0% and 0.8 ± 0.4% TUNEL positive cells respectively (mean ± S.E.M, n = 20 random fields for each experimental condition). The bar graph shows the % TUNEL positive cells in each condition. The blue light used was a LED with 1730 μW/cm2 at 415 nm. Scale = 5 μm. (For interpretation of the references to colour in this figure legend, the reader is referred to the web version of this article.)
3.6. Sunlight induces cell death in a retinal concentration-dependent manner
The effect of environmental blue light-exposure on retinal-containing cells was determined by exposing cells to sunlight since sunlight is a major source of blue and UV radiation (Fig. S16) (72). HeLa cells were initially incubated with 50 μM retinal for 10 minutes in the dark and subsequently exposed for 1, 5, 15 and 30 minutes to direct sunlight with averaged intensities of 62 ±10 μW/cm2 when measured at 445 nm. Similarly, retinal-treated control cell-plates in light-exclusion wrapping were maintained in the same environmental conditions. One minute of sunlight exposure was sufficient to induce PIP2 sensor translocation to the cytosol in 27.7% of cells (Fig. 7A). After 5, 15 and 30 minutes, cells with cytosolic PIP2 sensor were increased to 84.8%, 85.5% and 99.3%. Control cells exposed to retinal in the dark exhibited primarily a PM-bound PIP2 sensor (Fig. 7A). In the absence of exogenously added retinal, HeLa cells exposed to sunlight for 30 minutes, did not show a quantifiable PIP2-sensor translocation in the majority of cells (Fig. 7B). Since the serum in the cell culture medium has low concentrations of retinal/retinoids, some cells may induce sunlight excited-retinal mediated minor PIP2 sensor translocation, even without exogenous retinal addition. We previously showed that blue light induces cell death in single-cell experiments (12). Therefore, sunlight-induced percent cell death was examined using MTT assay which measures percent cell survival (33). After incubating cells in 10 nM to 100 μM retinal, the cell survival was examined after 30 minutes of sunlight exposure. Sunlight-exposed cells started exhibiting cell death at 250 nM retinal while at 1 μM ~28% and at 10 μM ~37% of cells died (Fig. 7C). A two-way ANOVA with F (8, 174) = 7.8, p=0.05 shows that compared to cells kept in the dark, sunlight induced a significant cytotoxicity with retinal concentrations above 1 μM (Tables S7 and S8). However, in addition to the direct toxicity of retinal photosensitization, we acknowledge the possible contribution of retinal photodegradation products for increased phototoxicity of retinal. Retinal photodegradation can be enhanced upon exposing retinal incubated cells to the UV component of sunlight. A one-way ANOVA with F (8, 87) = 15.9, p=0.05 shows that, up to 10 μM, retinal is not chemically toxic to cells (Tables S7 and S9). Additionally, after 5 minutes of sunlight, cells with 1 μM retinal exhibited nearly a constant 19% cell death (Fig. 7D). This is likely due to the limited lifetime of retinal and thus light exposure may have consumed retinal within 5 minutes. Additional control experiments were performed to examine the PIP2 sensor response in cells exposed to a known apoptosis-inducer, staurosporine (73). When cells expressing PIP2 sensor were treated with staurosporine for 4 hours, similar to BLE-retinal exposed cells, the PIP2 sensor was accumulated in the cytosol of 92% cells (Fig. S17). Control cells only incubated with vehicle (DMSO) did not show such sensor accumulation (Fig. S17). Previously, it has been shown that staurosporine induces apoptosis via increased generation of ROS (74,75). Cells incubated with α-tocopherol, staurosporine only resulted in PIP2 sensor accumulation in 37.5% of cells (Fig. S17). These data suggest the attenuation of staurosporine-induced oxidative damage of PIP2 in the presence of antioxidants. Thus, BLE-retinal is likely to induce PIP2 sensor translocation through increased generation of ROS.
Fig. 7.

Sunlight-excited retinal induces PIP2 disruption and cytotoxicity. A. mCh-PH expressing HeLa cells exposed to ATR (50 μM) for 10 min in the dark were exposed to sunlight for 1, 5, 15, and 30 min. Control cells were maintained under the same conditions, however excluded from light. The plot shows the percentage of cells showing mCh-PH translocation, as sunlight exposure times increase. Note cells kept in the dark for 30 min with retinal did not show PIP2 disruption (plot-red). B. In the absence of retinal, HeLa cells exposed to sunlight for 30 min or kept in the dark, did not show mCh-PH translocation C. Retinal compromised viability of cells when exposed to sunlight. HeLa cells seeded in 24-well plates and at ~80% confluency were incubated with 0, 10 nM, 100 nM, 250 nM, 500 nM, 750 nM, 1 μM, 10 μM and 100 μM retinal and subsequently exposed to sunlight for 30 min. Control cell-plates (with 0 to 100 μM retinal) and wrapped with Al-foil were otherwise maintained in the same conditions. Percent viability was calculated using MTT assay (mean ± S.E.M, n = 16 wells for 0 μM, 1 μM and 100 μM and n = 8 wells for 0.01 μM, 0.1 μM, 0.25 μM, 0.5 μM, 0.75 μM and 10 μM retinal from 3 independent experiments.) D. Viability of HeLa cells in 48-well plates, at ~80% confluency and under 1 μM retinal when exposed to sunlight for 0, 1, 5, 10, 15, 20, 25 and 30 min (mean ± S.E.M and n = 8 wells). Fluorescent protein, mCherry is abbreviated as mCh. Scale = 5 μm. (For interpretation of the references to colour in this figure legend, the reader is referred to the web version of this article.)
4. Conclusion
The present study demonstrates blue light and sunlight-induced photosensitization of retinal, and the resultant oxidative modifications of crucial signaling molecules, such as phospholipids and G-proteins, leads to cell death. The photosensitized retinal induced oxidation of polyunsaturated lipids, governed by ROS generation, was demonstrated using in vitro photochemistry and mass spectrometry. Living cells exposed to BLE-retinal showed lipid peroxidation and suggests oxidation of polyunsaturated lipid anchors commonly found in many biomolecules, corroborating the findings of in vitro investigations. Identical oxidative response signatures of photoexcited retinal and rose bengal established retinal as an efficient bioavailable photosensitizer in living cells. Our data also signify the subcellular locations of retinal accumulation and threshold concentrations of retinal to induce cellular photodamage. Overall, collectively our data indicate a broader physiological impact of this vital chromophore and light on cellular fate.
Supplementary Material
Highlights.
Blue light-excited retinal generates ROS, induces oxidation of unsaturated lipids.
Photoexcited-retinal disrupts subcellular localization of lipidated signaling molecules.
Similar to blue light, retinal also triggers cellular damage with sunlight too.
Retinal accumulation in cell membranes supports its photosensitization.
Retinal photoexcitation induces DNA and mitochondrial damage, and cell death.
Acknowledgment
We acknowledge Dr. N. Gautam (Washington University-School of Medicine, St. Louis, MO, USA) for providing recombinant DNA plasmids of mCherry-γ9, mCherry-γ3, GFP-γ9, YFP-γ1, YFP-γ2, αO-mCherry, mCherry-β1, mCherry-GPI, MRas, KRas, α2AR-CFP, YFP-PH and mCherry-PH. GFP-Lact-C2 was a gift from Sergio Grinstein (Addgene plasmid # 22852; http://n2t.net/addgene:22852; RRID:Addgene_22852). We acknowledge Dinesh Kankanamge for experimental assistance with generation of fluorescently tagged MRas and KRas constructs. We acknowledge Dr. Donald Ronning and Thanuja Sudasinghe for assistance in plate reader measurements. We acknowledge Harshana Lakmal Olupathage, George Kim, Claire Gray, and Zehra Fasih for assistance in HPLC, cell cytotoxicity measurements and for helpful discussions regarding preparation of the manuscript. We acknowledge Govind Sharma Shyam Sunder, Krishani Rajanayake, Dr. Dragan Isailovic and Dr. Arpad Somogyi for helpful discussions and technical support for ESI-MS experiments. We also acknowledge the Ohio State University CCIC mass spectrometry & proteomics facility for ESI-MS data acquisition. We acknowledge University of Toledo and the NIH-NIGMS (grant number: 1R15GM126455–01A1) for funding.
Footnotes
Conflicts of interest
Authors declare no conflicts of interest.
Publisher's Disclaimer: This is a PDF file of an unedited manuscript that has been accepted for publication. As a service to our customers we are providing this early version of the manuscript. The manuscript will undergo copyediting, typesetting, and review of the resulting proof before it is published in its final form. Please note that during the production process errors may be discovered which could affect the content, and all legal disclaimers that apply to the journal pertain.
References
- 1.Chen Y, Okano K, Maeda T, Chauhan V, Golczak M, Maeda A, and Palczewski K. (2012) Mechanism of all-trans-retinal toxicity with implications for stargardt disease and age-related macular degeneration. The Journal of biological chemistry 287, 5059–5069 [DOI] [PMC free article] [PubMed] [Google Scholar]
- 2.Rozanowska M, Handzel K, Boulton ME, and Rozanowski B. (2012) Cytotoxicity of all-trans-retinal increases upon photodegradation. Photochemistry and photobiology 88, 1362–1372 [DOI] [PMC free article] [PubMed] [Google Scholar]
- 3.Maeda A, Maeda T, Golczak M, Chou S, Desai A, Hoppel CL, Matsuyama S, and Palczewski K. (2009) Involvement of all-trans-retinal in acute light-induced retinopathy of mice. The Journal of biological chemistry 284, 15173–15183 [DOI] [PMC free article] [PubMed] [Google Scholar]
- 4.Wu J, Seregard S, and Algvere PV (2006) Photochemical damage of the retina. Survey of ophthalmology 51, 461–481 [DOI] [PubMed] [Google Scholar]
- 5.Organisciak DT, and Vaughan DK (2010) Retinal light damage: mechanisms and protection. Prog. Retin. Eye Res 29, 113–134 [DOI] [PMC free article] [PubMed] [Google Scholar]
- 6.Masutomi K, Chen C, Nakatani K, and Koutalos Y. (2012) All-trans retinal mediates light-induced oxidation in single living rod photoreceptors. Photochem Photobiol 88, 1356–1361 [DOI] [PMC free article] [PubMed] [Google Scholar]
- 7.Sparrow JR, and Cai B. (2001) Blue light-induced apoptosis of A2E-containing RPE: involvement of caspase-3 and protection by Bcl-2. Investigative ophthalmology & visual science 42, 1356–1362 [PubMed] [Google Scholar]
- 8.Sparrow JR, Nakanishi K, and Parish CA (2000) The lipofuscin fluorophore A2E mediates blue light-induced damage to retinal pigmented epithelial cells. Investigative ophthalmology & visual science 41, 1981–1989 [PubMed] [Google Scholar]
- 9.Rozanowska M, and Sarna T. (2005) Light-induced damage to the retina: role of rhodopsin chromophore revisited. Photochemistry and photobiology 81, 1305–1330 [DOI] [PubMed] [Google Scholar]
- 10.Wiegand RD, Giusto NM, Rapp LM, and Anderson RE (1983) Evidence for rod outer segment lipid peroxidation following constant illumination of the rat retina. Invest. Ophthalmol. Vis. Sci 24, 1433–1435 [PubMed] [Google Scholar]
- 11.Movitz C, Sjolin C, and Dahlgren C. (1997) A rise in ionized calcium activates the neutrophil NADPH-oxidase but is not sufficient to directly translocate cytosolic p47phox or p67phox to b cytochrome containing membranes. Inflammation 21, 531–540 [DOI] [PubMed] [Google Scholar]
- 12.Ratnayake K, Payton JL, Lakmal OH, and Karunarathne A. (2018) Blue light excited retinal intercepts cellular signaling. Scientific Reports 8, 10207 [DOI] [PMC free article] [PubMed] [Google Scholar]
- 13.Molday RS, and Moritz OL (2015) Photoreceptors at a glance. Journal of Cell Science 128, 4039–4045 [DOI] [PMC free article] [PubMed] [Google Scholar]
- 14.Maeda A, Maeda T, Golczak M, and Palczewski K. (2008) Retinopathy in Mice Induced by Disrupted All-trans-retinal Clearance. Journal of Biological Chemistry 283, 26684–26693 [DOI] [PMC free article] [PubMed] [Google Scholar]
- 15.Saari JC, Garwin GG, Van Hooser JP, and Palczewski K. (1998) Reduction of all-trans-retinal limits regeneration of visual pigment in mice. Vision research 38, 1325–1333 [DOI] [PubMed] [Google Scholar]
- 16.Lochner JE, Badwey JA, Horn W, and Karnovsky ML (1986) All-Trans-Retinal Stimulates Superoxide Release and Phospholipase-C Activity in Neutrophils without Significantly Blocking Protein-Kinase-C. Proc. Natl. Acad. Sci. U. S. A 83, 7673–7677 [DOI] [PMC free article] [PubMed] [Google Scholar]
- 17.von Lintig J. (2012) Metabolism of carotenoids and retinoids related to vision. The Journal of biological chemistry 287, 1627–1634 [DOI] [PMC free article] [PubMed] [Google Scholar]
- 18.Gorgidze LA, Oshemkova SA, and Vorobjev IA (1998) Blue light inhibits mitosis in tissue culture cells. Bioscience reports 18, 215–224 [DOI] [PubMed] [Google Scholar]
- 19.Pflaum M, Kielbassa C, Garmyn M, and Epe B. (1998) Oxidative DNA damage induced by visible light in mammalian cells: extent, inhibition by antioxidants and genotoxic effects. Mutation research 408, 137–146 [DOI] [PubMed] [Google Scholar]
- 20.Kuse Y, Ogawa K, Tsuruma K, Shimazawa M, and Hara H. (2014) Damage of photoreceptor-derived cells in culture induced by light emitting diode-derived blue light. Sci. Rep. 4, 5223. [DOI] [PMC free article] [PubMed] [Google Scholar]
- 21.Del Olmo-Aguado S, Nunez-Alvarez C, and Osborne NN (2016) Blue Light Action on Mitochondria Leads to Cell Death by Necroptosis. Neurochemical research 41, 2324–2335 [DOI] [PubMed] [Google Scholar]
- 22.Tosini G, Ferguson I, and Tsubota K. (2016) Effects of blue light on the circadian system and eye physiology. Molecular vision 22, 61–72 [PMC free article] [PubMed] [Google Scholar]
- 23.Lee HS, Cui L, Li Y, Choi JS, Choi J-H, Li Z, Kim GE, Choi W, and Yoon KC (2016) Influence of Light Emitting Diode-Derived Blue Light Overexposure on Mouse Ocular Surface. PLOS ONE 11, e0161041 [DOI] [PMC free article] [PubMed] [Google Scholar]
- 24.Vicente-Tejedor J, Marchena M, Ramírez L, García-Ayuso D, Gómez-Vicente V, Sánchez-Ramos C, de la Villa P, and Germain F. (2018) Removal of the blue component of light significantly decreases retinal damage after high intensity exposure. PLOS ONE 13, e0194218 [DOI] [PMC free article] [PubMed] [Google Scholar]
- 25.Wehner MR, Chren MM, Nameth D, Choudhry A, Gaskins M, Nead KT, Boscardin WJ, and Linos E. (2014) International prevalence of indoor tanning: a systematic review and meta-analysis. JAMA dermatology 150, 390–400 [DOI] [PMC free article] [PubMed] [Google Scholar]
- 26.Trotter LA, Patel D, Dubin S, Guerra C, McCloud V, Lockwood P, Messer R, Wataha JC, and Lewis JB (2017) Violet/blue light activates Nrf2 signaling and modulates the inflammatory response of THP-1 monocytes. Photochemical & photobiological sciences : Official journal of the European Photochemistry Association and the European Society for Photobiology 16, 883–889 [DOI] [PubMed] [Google Scholar]
- 27.Hasan CA, Hasan F, and Mahmood Shah SM (2017) Transient Smartphone Blindness: Precaution Needed. Cureus 9, e1796–e1796 [DOI] [PMC free article] [PubMed] [Google Scholar]
- 28.Schmick M, Vartak N, Papke B, Kovacevic M, Truxius, Dina C, Rossmannek L, and Bastiaens, Philippe IH. (2014) KRas Localizes to the Plasma Membrane by Spatial Cycles of Solubilization, Trapping and Vesicular Transport. Cell 157, 459–471 [DOI] [PubMed] [Google Scholar]
- 29.Stauffer TP, Ahn S, and Meyer T. (1998) Receptor-induced transient reduction in plasma membrane PtdIns(4,5)P2 concentration monitored in living cells. Current biology : CB 8, 343–346 [DOI] [PubMed] [Google Scholar]
- 30.Sivan Y, Rozenberg S, Halstuch A, and Ishaaya AA (2016) Nonlinear wave interactions between short pulses of different spatio-temporal extents. Scientific Reports 6, 29010 [DOI] [PMC free article] [PubMed] [Google Scholar]
- 31.Varnai P, and Balla T. (1998) Visualization of phosphoinositides that bind pleckstrin homology domains: calcium- and agonist-induced dynamic changes and relationship to myo-[3H]inositol-labeled phosphoinositide pools. The Journal of cell biology 143, 501–510 [DOI] [PMC free article] [PubMed] [Google Scholar]
- 32.Senarath K, Ratnayake K, Siripurapu P, Payton JL, and Karunarathne A. (2016) Reversible G Protein betagamma9 Distribution-Based Assay Reveals Molecular Underpinnings in Subcellular, Single-Cell, and Multicellular GPCR and G Protein Activity. Anal Chem 88, 11450–11459 [DOI] [PubMed] [Google Scholar]
- 33.Pei H, Yang Y, Cui L, Yang J, Li X, Yang Y, and Duan H. (2016) Bisdemethoxycurcumin inhibits ovarian cancer via reducing oxidative stress mediated MMPs expressions. Scientific Reports 6, 28773 [DOI] [PMC free article] [PubMed] [Google Scholar]
- 34.Hirose K, Kadowaki S, Tanabe M, Takeshima H, and Iino M. (1999) Spatiotemporal Dynamics of Inositol 1,4,5-Trisphosphate That Underlies Complex Ca2+ Mobilization Patterns. Science 284, 1527–1530 [DOI] [PubMed] [Google Scholar]
- 35.Nash MS, Young KW, Willars GB, Challiss RA, and Nahorski SR (2001) Single-cell imaging of graded Ins(1,4,5)P3 production following G-protein-coupled-receptor activation. Biochem J 356, 137–142 [DOI] [PMC free article] [PubMed] [Google Scholar]
- 36.Ayala A, Munoz MF, and Arguelles S. (2014) Lipid peroxidation: production, metabolism, and signaling mechanisms of malondialdehyde and 4-hydroxy-2-nonenal. Oxidative medicine and cellular longevity 2014, 360438 [DOI] [PMC free article] [PubMed] [Google Scholar]
- 37.Szachowicz-Petelska B, Dobrzynska I, Skrzydlewska E, and Figaszewski ZA (2008) Changes in Phospholipid Composition Studied by HPLC and Electric Properties of Liver Cell Membrane of Ethanol-Poisoned Rats. Toxicology mechanisms and methods 18, 525–530 [DOI] [PMC free article] [PubMed] [Google Scholar]
- 38.Shadyro OI, Yurkova IL, and Kisel MA (2002) Radiation-induced peroxidation and fragmentation of lipids in a model membrane. International journal of radiation biology 78, 211–217 [DOI] [PubMed] [Google Scholar]
- 39.Carr A-J, Vugler AA, Yu L, Semo M, Coffey P, Moss SE, and Greenwood J. (2011) The expression of retinal cell markers in human retinal pigment epithelial cells and their augmentation by the synthetic retinoid fenretinide. Molecular vision 17, 1701–1715 [PMC free article] [PubMed] [Google Scholar]
- 40.Kankanamge D, Ratnayake K, Samaradivakara S, and Karunarathne A. (2018) Melanopsin (Opn4) utilizes Galphai and Gbetagamma as major signal transducers. J Cell Sci 131 [DOI] [PubMed] [Google Scholar]
- 41.Ajith Karunarathne WK, O’Neill PR, Martinez-Espinosa PL, Kalyanaraman V, and Gautam N. (2012) All G protein betagamma complexes are capable of translocation on receptor activation. Biochemical and biophysical research communications 421, 605–611 [DOI] [PMC free article] [PubMed] [Google Scholar]
- 42.O’Neill PR, Karunarathne WK, Kalyanaraman V, Silvius JR, and Gautam N. (2012) G-protein signaling leverages subunit-dependent membrane affinity to differentially control betagamma translocation to intracellular membranes. Proceedings of the National Academy of Sciences of the United States of America 109, E3568–3577 [DOI] [PMC free article] [PubMed] [Google Scholar]
- 43.Yogurtcu ON, and Johnson ME (2018) Cytosolic proteins can exploit membrane localization to trigger functional assembly. PLOS Computational Biology 14, e1006031 [DOI] [PMC free article] [PubMed] [Google Scholar]
- 44.Wedegaertner PB, Wilson PT, and Bourne HR (1995) Lipid Modifications of Trimeric G Proteins. Journal of Biological Chemistry 270, 503–506 [DOI] [PubMed] [Google Scholar]
- 45.Yeung T, Gilbert GE, Shi J, Silvius J, Kapus A, and Grinstein S. (2008) Membrane phosphatidylserine regulates surface charge and protein localization. Science 319, 210–213 [DOI] [PubMed] [Google Scholar]
- 46.Skotland T, and Sandvig K. (2019) The role of PS 18: 0/18: 1 in membrane function. Nature communications 10, 1–10 [DOI] [PMC free article] [PubMed] [Google Scholar]
- 47.Lorizate M, Sachsenheimer T, Glass B, Habermann A, Gerl MJ, Krausslich HG, and Brugger B. (2013) Comparative lipidomics analysis of HIV-1 particles and their producer cell membrane in different cell lines. Cellular microbiology 15, 292–304 [DOI] [PubMed] [Google Scholar]
- 48.Wright LP, and Philips MR (2006) Thematic review series: Lipid Posttranslational Modifications CAAX modification and membrane targeting of Ras. Journal of Lipid Research 47, 883–891 [DOI] [PubMed] [Google Scholar]
- 49.Mudiyanselage SE, Elsner P, Thiele JJ, and Hamburger M. (2003) Ultraviolet A Induces Generation of Squalene Monohydroperoxide Isomers in Human Sebum and Skin Surface Lipids In Vitro and In Vivo. Journal of Investigative Dermatology 120, 915–922 [DOI] [PubMed] [Google Scholar]
- 50.Shimizu N, Ito J, Kato S, Otoki Y, Goto M, Eitsuka T, Miyazawa T, and Nakagawa K. (2018) Oxidation of squalene by singlet oxygen and free radicals results in different compositions of squalene monohydroperoxide isomers. Scientific Reports 8, 9116. [DOI] [PMC free article] [PubMed] [Google Scholar]
- 51.Hagvall L, Bäcktorp C, Svensson S, Nyman G, Börje A, and Karlberg A-T (2007) Fragrance Compound Geraniol Forms Contact Allergens on Air Exposure. Identification and Quantification of Oxidation Products and Effect on Skin Sensitization. Chemical Research in Toxicology 20, 807–814 [DOI] [PubMed] [Google Scholar]
- 52.Colicelli J. (2004) Human RAS superfamily proteins and related GTPases. Science’s STKE : signal transduction knowledge environment 2004, RE13 [DOI] [PMC free article] [PubMed] [Google Scholar]
- 53.Janosi L, and Gorfe AA (2010) Segregation of Negatively Charged Phospholipids by the Polycationic and Farnesylated Membrane Anchor of Kras. Biophysical Journal 99, 3666–3674 [DOI] [PMC free article] [PubMed] [Google Scholar]
- 54.Buettner GR (1993) The pecking order of free radicals and antioxidants: lipid peroxidation, alpha-tocopherol, and ascorbate. Archives of biochemistry and biophysics 300, 535–543 [DOI] [PubMed] [Google Scholar]
- 55.Meeks RG, Zaharevitz D, and Chen RF (1981) Membrane effects of retinoids: Possible correlation with toxicity. Archives of biochemistry and biophysics 207, 141–147 [DOI] [PubMed] [Google Scholar]
- 56.Sparrow JR, Cai B, Jang YP, Zhou J, and Nakanishi K. (2006) A2E, A Fluorophore of RPE Lipofuscin, Can Destabilize Membrane. Springer US, Boston, MA: [DOI] [PubMed] [Google Scholar]
- 57.Bindokas VP, Jordan J, Lee CC, and Miller RJ (1996) Superoxide production in rat hippocampal neurons: selective imaging with hydroethidine. The Journal of neuroscience : the official journal of the Society for Neuroscience 16, 1324–1336 [DOI] [PMC free article] [PubMed] [Google Scholar]
- 58.Kojima H, Nakatsubo N, Kikuchi K, Urano Y, Higuchi T, Tanaka J, Kudo Y, and Nagano T. (1998) Direct evidence of NO production in rat hippocampus and cortex using a new fluorescent indicator: DAF‐2 DA. NeuroReport 9, 3345–3348 [DOI] [PubMed] [Google Scholar]
- 59.Lee S, Pagoria D, Raigrodski A, and Geurtsen W. (2007) Effects of combinations of ROS scavengers on oxidative DNA damage caused by visible-light-activated camphorquinone/N,N-dimethyl-p-toluidine. Journal of biomedical materials research. Part B, Applied biomaterials 83, 391–399 [DOI] [PubMed] [Google Scholar]
- 60.Nimse SB, and Pal D. (2015) Free radicals, natural antioxidants, and their reaction mechanisms. RSC Advances 5, 27986–28006 [Google Scholar]
- 61.Nissanka N, and Moraes CT (2018) Mitochondrial DNA damage and reactive oxygen species in neurodegenerative disease. FEBS Letters 592, 728–742 [DOI] [PMC free article] [PubMed] [Google Scholar]
- 62.Guo C, Sun L, Chen X, and Zhang D. (2013) Oxidative stress, mitochondrial damage and neurodegenerative diseases. Neural Regen Res 8, 2003–2014 [DOI] [PMC free article] [PubMed] [Google Scholar]
- 63.Smiley ST, Reers M, Mottola-Hartshorn C, Lin M, Chen A, Smith TW, Steele GD, and Chen LB (1991) Intracellular heterogeneity in mitochondrial membrane potentials revealed by a J-aggregate-forming lipophilic cation JC-1. Proceedings of the National Academy of Sciences 88, 3671–3675 [DOI] [PMC free article] [PubMed] [Google Scholar]
- 64.Lamberts JJM, and Neckers DC (1985) Rose Bengal derivatives as singlet oxygen sensitizers. Tetrahedron 41, 2183–2190 [Google Scholar]
- 65.Girotti AW (1990) Photodynamic lipid peroxidation in biological systems. Photochemistry and photobiology 51, 497–509 [DOI] [PubMed] [Google Scholar]
- 66.Rozanowska MB (2012) Light‐Induced Damage to the Retina: Current Understanding of the Mechanisms and Unresolved Questions: A Symposium‐in‐Print. Photochemistry and photobiology 88, 1303–1308 [DOI] [PubMed] [Google Scholar]
- 67.Dillon J, Gaillard ER, Bilski P, Chignell CF, and Reszka KJ (1996) The Photochemistry of the Retinoids as Studied by Steady-State and Pulsed Methods. Photochemistry and photobiology 63, 680–685 [DOI] [PubMed] [Google Scholar]
- 68.Taylor NL, Day DA, and Millar AH (2004) Targets of stress‐induced oxidative damage in plant mitochondria and their impact on cell carbon/nitrogen metabolism. Journal of Experimental Botany 55, 1–10 [DOI] [PubMed] [Google Scholar]
- 69.Yin H, Xu L, and Porter NA (2011) Free Radical Lipid Peroxidation: Mechanisms and Analysis. Chemical Reviews 111, 5944–5972 [DOI] [PubMed] [Google Scholar]
- 70.Komaszylo née Siedlecka J, Kania M, Masnyk M, Cmoch P, Lozinska I, Czarnocki Z, Skorupinska-Tudek K, Danikiewicz W, and Swiezewska E. (2016) Isoprenoid Alcohols are Susceptible to Oxidation with Singlet Oxygen and Hydroxyl Radicals. Lipids 51, 229–244 [DOI] [PMC free article] [PubMed] [Google Scholar]
- 71.Kyrylkova K, Kyryachenko S, Leid M, and Kioussi C. (2012) Detection of apoptosis by TUNEL assay. Methods in molecular biology (Clifton, N.J.) 887, 41–47 [DOI] [PubMed] [Google Scholar]
- 72.Arnault E, Barrau C, Nanteau C, Gondouin P, Bigot K, Viénot F, Gutman E, Fontaine V, Villette T, Cohen-Tannoudji D, Sahel J-A, and Picaud S. (2013) Phototoxic Action Spectrum on a Retinal Pigment Epithelium Model of Age-Related Macular Degeneration Exposed to Sunlight Normalized Conditions. PLoS ONE 8, e71398 [DOI] [PMC free article] [PubMed] [Google Scholar]
- 73.Belmokhtar CA, Hillion J, and Segal-Bendirdjian E. (2001) Staurosporine induces apoptosis through both caspase-dependent and caspase-independent mechanisms. Oncogene 20, 3354–3362 [DOI] [PubMed] [Google Scholar]
- 74.Olguín-Albuerne M, Domínguez M, and Morán J. (2014) Effect of Staurosporine in the Morphology and Viability of Cerebellar Astrocytes: Role of Reactive Oxygen Species and NADPH Oxidase, [DOI] [PMC free article] [PubMed] [Google Scholar]
- 75.Olguín-Albuerne M, Ramos-Pittol JM, Coyoy A, Martínez-Briseño CP, Domínguez G, and Morán J. (2016) Peroxynitrite is Involved in the Apoptotic Death of Cultured Cerebellar Granule Neurons Induced by Staurosporine, but not by Potassium Deprivation. Neurochemical research 41, 316–327 [DOI] [PubMed] [Google Scholar]
Associated Data
This section collects any data citations, data availability statements, or supplementary materials included in this article.