

Abstract
Introduction
Apolipoprotein E ε4 (APOE4)–related genetic risk for sporadic Alzheimer's disease is associated with an early impairment of cognitive brain networks. The current study determines relationships between APOE4 carrier status, cortical iron, and cortical network‐functionality.
Methods
Sixty‐nine cognitively healthy old‐aged individuals (mean age [SD] 66.1 [± 7.2] years; Mini‐Mental State Exam [MMSE] 29.3 ± 1.1) were genotyped for APOE4 carrier‐status and received 3 Tesla magnetic resonance imaging (MRI) for blood oxygen level–dependent functional magnetic resonance imaging (MRI) at rest, three‐dimensional (3D)–gradient echo (six echoes) for cortical gray‐matter, non‐heme iron by quantitative susceptibility mapping, and 18F‐flutemetamol positron emission tomography for amyloid‐β
Results
A spatial pattern consistent with the default mode network (DMN) could be identified by independent component analysis. DMN activity was enhanced in APOE4 carriers and related to cortical iron burden. APOE4 and cortical iron synergistically interacted with DMN activity. Secondary analysis revealed a positive, APOE4 associated, relationship between cortical iron and DMN connectivity.
Discussion
Our findings suggest that APOE4 moderates effects of iron on brain functionality prior to manifestation of cognitive impairment.
Keywords: APOE4, DMN, flutemetamol, fMRI, gradient echo, ICA, iron, MRI, PET, QSM, preclinical Alzheimer's disease
1. INTRODUCTION
Apolipoprotein E (apoE) is an essential mediator for fat metabolism and facilitates cholesterol handling in the central nervous system (CNS).1 The Apolipoprotein E ε4 allele (APOE4) is the strongest known genetic risk factor for sporadic Alzheimer's disease (AD).2, 3, 4 In addition, several studies have demonstrated associations between APOE4 with established clinical phenotypes and pathological hallmarks of increased risk for AD. These include mild cognitive impairment,5, 6 increased burden of brain amyloid‐β (Aβ),7, 8, 9, 10, 11 CNS proteinopathy,12, 13 metabolic disorder,14, 15 and vascular disease.16, 17
Cognitive dysfunction in AD is preceded by progressive changes of intrinsic brain network activity.18, 19, 20, 21 Here, cognitive networks such as the default mode network (DMN) are primarily affected.19, 22, 23, 24 The DMN is constituted by a distinct connectivity pattern of synchronous cortical neuronal activity in spatially distant brain regions that include the medial prefrontal cortex (MPFC), lateral parietal cortices, posterior cingulate, and hippocampus, which are activated at rest.25, 26, 27 There is a consistent link between APOE4 carrier status and increased Aβ burden.8, 9, 28 Interestingly, the effect of APOE4 on cognitive brain networks is present prior to accumulation of Aβ, which may reflect risk for AD prior to manifestation of characteristic AD pathology.29
Another pathological feature of AD is an increased burden of cerebral iron deposition.30, 31 Although iron continuously accumulates in the human brain during aging,32, 33, 34, 35 recently published postmortem data suggest an association between the amount of brain iron deposition and the progression and severity of cognitive decline in AD.36, 37, 38 Moreover, associations between APOE4 carrier status, clinical phenotypes of increased risk for AD, and increased iron burden in the CNS have been demonstrated.36, 39, 40 Paramagnetic susceptibility, as measured by quantitative susceptibility mapping (QSM) magnetic resonance imaging (MRI), has been demonstrated to closely relate to non‐heme iron content of deep brain gray matter.41, 42, 43, 44 Although myelin content is a major determinant of MR phase differences between cortical gray and white matter,45 recently published histological data suggest that iron in cortical gray matter regions is a major contributor to susceptibility measured by QSM.46 This approach is considered to provide an indirect estimate of non‐heme iron in the brain, and associated risk for oxidative damage.38, 47 By applying suitable post‐processing techniques that balance susceptibility measures with reference regions and correct for heme iron and other non‐tissue iron sources, strong linear correlations resulted between postmortem gray matter tissue iron concentration and QSM measurements.43, 48 Consistently, several QSM‐MRI studies demonstrated an association between increased tissue magnetic susceptibility, AD, and AD‐risk phenotypes.33, 40, 49, 50 Considering possible damaging impacts of brain iron burden on brain tissue by increased oxidative stress and redox activity,51, 52, 53, 54, 55, 56 as well as programmed cell death conferred by ferroptosis,57, 58 APOE might be a moderator for iron‐related oxidative brain damage in individuals at risk for AD.36, 59 In this context, cortical iron burden might indicate early cortical neurodegenerative alterations, as suggested by earlier published data of ours on brain iron in mild cognitive impairment.40
HIGHLIGHTS
Three‐dimensional (3D) gradient recalled echo magnetic resonance imaging for quantitative susceptibility mapping (QSM) and 18F‐flutemetamol positron emission tomography for amyloid‐β (Aβ) in healthy old‐aged adults.
Spatial definition and assessment of the default mode network (DMN) by group independent component analysis.
Synergistic effects of iron (as measured by QSM) and APOE ε4 allele (APOE4) on DMN connectivity.
Interactive effects of APOE4 and QSM‐iron may precede Aβ pathology.
APOE4 may accelerate brain iron accumulation associated DMN disintegrity.
RESEARCH IN CONTEXT
The apolipoprotein E ε4 allele (APOE4) is the strongest known genetic risk factor for sporadic Alzheimer's disease (AD). APOE4‐associated impairment of brain‐network connectivity manifests prior to dementia. Considering recent reports on relationships between cerebral iron load, genetic risk, and progression of AD, our study aims at investigating the effects of APOE4 on cortical iron and cortical network connectivity in non‐demented old‐aged adults. Brain iron may be non‐invasively inferred on by its paramagnetic properties using quantitative susceptibility mapping (QSM) magnetic resonance imaging. QSM is considered to provide an indirect estimate of non‐heme iron.
Our findings suggest that APOE4 may moderate iron effects on brain functionality, as reflected by altered synchronized network activity, which is consistent with earlier reports on APOE4‐related default mode network alterations. Additional studies are needed to clarify mechanisms implicated in the interaction between APOE4, cortical iron burden, and progression of cortical dysfunction in AD.
Considering these prior studies, and allowing for the published evidence on earliest APOE4‐moderated DMN alterations in cognitively unimpaired adults,29, 60 we hypothesized that APOE4 may moderate the effects of increased cortical iron on cortical functionality, as reflected by DMN connectivity. Moreover, we hypothesized that APOE4‐related changes should (a) be reflected by altered DMN activity and (b) precede the manifestation of significant AD pathology and cognitive dysfunction. To test this hypothesis, a study sample of cognitively healthy, old‐aged study participants was recruited. All participants received genotyping for detection of APOE4 carrier status,2 and 18F‐flutemetamol positron emission tomography (PET) for assessing brain Aβ burden.61, 62 Blood oxygen level–dependent (BOLD) functional MRI (fMRI) at rest was performed for assessing intrinsic network connectivity, and the CONN toolbox63 was used to identify the DMN by independent component analysis (ICA)64 and statistical testing for interactive effects of APOE4 and cortical iron load, inferred from gray matter susceptibility.
2. MATERIALS AND METHODS
2.1. Study sample
The study sample included 69 cognitively healthy old‐aged adults (32 female, 37 male; mean age [SD] 66.1 [7.25] years, range 51–80 years, mean education [SD] 15.99 [2.77] years, range 11–20) recruited in the cantone Zurich, Switzerland, from an ongoing study at our center.65 Study procedures were in concordance with regulations issued by the local, cantonal ethics authority (Kantonale Ethikkommission Zürich, http://www.kek.zh.ch), good clinical practice, and with the Declaration of Helsinki.66 Written informed consent was obtained from all participants before inclusion in the study. Inclusion criteria were age between 50 and 80 years, unimpaired overall cognitive status as indicated by Mini‐Mental State Examination (MMSE) ≥27/30, neuropsychological testing, and comprehensive psychiatric examination. Exclusion criteria were presence of any condition possibly affecting cognition, any current medication or substance abuse with prompt effects on cognition, serious medical or psychiatric illness, and evidence of infarction or inflammation on cranial MRI. Furthermore, subjects with contraindications to MRI or PET, clinically relevant changes in red blood count, or significant exposure to radiation were excluded. After inclusion, all participants received standardized cognitive testing and a clinical workup, including medical history, blood sampling, and genotyping of APOE as described earlier.65 The study population was dichotomized based on presence of the APOE4 genotype (“APOE4 carriers” vs “non‐carriers”), for stratification by genetic risk for sporadic, late‐onset AD.4
2.2. Cognitive assessment of participants
Screening for cognitive impairment was performed by applying the MMSE67 and the Consortium to Establish a Registry for Alzheimer's Disease (CERAD) neuropsychological battery.68 Moreover, the delayed recall Verbal Learning and Memory Test (VLMT)69 was used to assess episodic memory performance, the Boston Naming Test for confrontational word retrieval,70 the Stroop interference test71 as a measure of executive function, and Trail Making Test, Section B divided by Section A (TMT B/A) for assessment of mental flexibility.72
2.3. Acquisition of MRI data and QSM
Imaging of all 69 participants was conducted using a 3T GE SIGNA PET‐MR whole‐body scanner (GE Medical Systems, Milwaukee, WI) equipped with an 8‐channel head coil. For anatomical referencing and automated image segmentation, T1‐weighted BRAVO images (TI = 450 ms, voxel size = 1 × 1 × 1 mm3, flip‐angle = 12°, ASSET factor = 2, scan time = 6:00 minutes) were acquired. MR phase measurements used for QSM calculation were collected using a multi‐echo 3D gradient recalled echo (GRE) sequence with six echoes (TR/TE1/ΔTE = 40/6/4 ms, voxel size = 1 × 1 × 1 mm3, flip angle = 15°, bandwidth = ±62.5 kHz, flow compensated, ASSET factor = 2, scan time = 7:53 minutes). For investigating BOLD synchronicity at rest (open eyes), a T2∗‐weighted single‐shot gradient echo‐planar imaging sequence was used to record 200 functional volumes (repetition time (TR) = 2.547 s; echo time (TE) = 13.8 ms; matrix = 64 × 64; flip angle = 90°, total scan time = 8.49 minutes), with 46 slices per volume (voxel size = 3.75 × 3.75 × 3.6 mm3) for whole‐brain coverage.
For QSM reconstruction, phase data acquired with an echo time in the range of 18 to 26 ms was used. QSM images were calculated from the MR phase images using algorithms described previously by our group40, 48, 65 using an in‐house script written in MATLAB (MATLAB 2016a, Version 9.0). Briefly, processing included Laplacian‐based phase unwrapping,41 brain masking using GRE magnitude image acquired at TE = 14 ms with FSL's brain extraction tool (BET, FMRIB Oxford, UK), dividing the unwrapped phase images by 2π*TE to obtain frequency shift images (Hz) for each echo. For eliminating background fields the vSHARP method42, 73 was used (maximum spherical kernel size = 4 mm, regularization parameter = 0.05). Spatially confined vascular objects such as veins and microbleeds were excluded from estimation of regional susceptibility values. To increase signal‐to‐noise ratios (SNR), images resulting from the last three echoes were averaged.74 Sparse linear equation and least‐squares (LSQR)‐based minimization was used for inverse dipole calculations of susceptibility maps,75, 76 with deep frontal white matter as reference.65
2.4. Acquisition of flutemetamol‐PET data
18F‐flutemetamol‐PET was used for determination of participants Aβ plaque burden,61, 62 as described earlier by our group.65 In brief, an individual dose of 140 MBq of flutemetamol was injected into the cubital vein. Late‐frame (85—105 minute) PET images were reconstructed with state of the art time‐of‐flight algorithms allowing for attenuation correction maps, which were generated using standard procedures implemented by the manufacturer. This resulted in 3D volumes of 18F‐flutemetamol retention (matrix = 256 × 256 × 89, voxel size = 1.17 × 1.17 × 2.78 mm3). Individual measures of cortical Aβ plaque load were calculated based on average 18F retention in a composite cortical volume of interest, which was normalized to cerebellar gray matter composite cortical volume of interest standard uptake value ratio (COM‐SUVR).62 Consistent with earlier studies on AD and healthy controls, extent of amyloid pathology was assessed in regard to a COM‐SUVR threshold of 1.56.62
2.5. Analysis of functional MRI data
2.5.1. Data preprocessing
BOLD fMRI data were processed for statistical analysis using “CONN functional connectivity toolbox” (ver.17.d; http://www.nitrc.org/projects/conn),63 “statistical parametric mapping” (SPM12, Version 6906), MATLAB (Version 9.0, MathWorks Inc., Natick, MA, USA), and the “statistics and machine learning toolbox” (Version 10.2). After importing NIFTI functional and anatomical images into the CONN toolbox, individual fMRI volumes were spatially realigned, and anatomical scans were coregistered to the mean functional image, corrected for timing differences between slices, spatially normalized to montreal neurological institute (MNI) template space, and smoothed using an 8 mm full width at half‐maximum Gaussian kernel. The Artifact Detection Toolbox (ART, https://web.mit.edu/swg/software.htm) was used for detection and analysis of sources of artifacts in the investigated timeseries of 200 functional MR‐volumes.63
2.5.2. Identification of resting‐state networks
To obtain functional connectivity networks of all 69 participants, we performed group spatial ICA77 as implemented in the CONN toolbox for data‐driven blind source separation of fMRI data and identification of functional networks, represented by spatially distant patterns of BOLD synchronicity.64, 78, 79, 80 The DMN, as a representation of intrinsic network activity, was identified based on characteristic spatial patterns that included signature regions of MPFC, posterior cingulate cortex (PCC), and left and right lateral parietal lobes (LPLs).26
2.6. Statistical analysis
The statistical analysis of fMRI data, as well as investigation of APOE4 and paramagnetic tissue iron effects on DMN connectivity, was performed using algorithms implemented in the CONN‐toolbox (V17d).63 As such, DMN activity was operationalized by level of BOLD synchronicity (β weights of connectivity) within the spatial confinement of the correspondent independent component.77 Reliability of the ICA for detection of the DMN was estimated by probability of each voxel identified by ICA to belong into the DMN by one sample t test. Moreover, CONN was used for investigating group differences in DMN activity as a function of APOE4 carrier status and cortical magnetic susceptibility by linear regression and one‐way analysis of covariate interaction tests in order to study the effects of high cortical magnetic susceptibility and APOE4 carrier status on DMN activity. False discovery rate was used to adjust raw P‐values for multiple testing (P‐FDR).81
Descriptives of the sample data are presented using mean ±SD. Tests for differences in demographic, clinical, neuropsychological, or imaging‐based (SUVR, QSM) parameters between subjects in the ApoE4‐ and no‐ApoE4 group were performed with independent samples t tests. A median split of the study sample was used for separation of participants based on average cortical magnetic susceptibility: QSM levels above or equal to the group median were categorized as “high cortical magnetic susceptibility” and QSM levels below the group median as “low cortical magnetic susceptibility.” The resulting dichotomous variable was used as a categorical operator of cortical iron burden.
3. RESULTS
3.1. Characteristics of the study population
Within the study population of 69 participants, 18 carriers of the APOE4 allele could be identified (allelic frequencies were: APOE ɛ2/ɛ4 = 1, APOE ɛ3/ɛ4 = 16, APOE ɛ4/ɛ4 = 1). When comparing APOE4 carriers with non‐carriers, there were no significant differences in demographic characteristics between groups. Moreover, neuropsychological screening by MMSE as well as domain‐specific testing using the CERAD neuropsychological battery consistently indicated high levels of cognitive performance in all study participants, without significant differences between APOE4 carriers and non‐carriers (Table 1). Only in two APOE4 carriers was increased brain Aβ load observable. For the rest of the study population, no substantial brain amyloid pathology was present, as indicated by average COM‐SUVR (mean (±SD)) of 1.19(0.19) without significant differences on a group level (APOE4 carriers: 1.28(0.33), non‐carriers: 1.16(0.1)) (Table 1). Overall cortical magnetic susceptibility was 1.85 (0.81) ppb, without significant differences between APOE4 carriers (1.81(0.65) ppb) and non‐carriers (1.87(0.65) ppb) (Table 1).
Table 1.
Overview of sample demographics, neuropsychological test performance as well as cortical Aβ and cortical magnetic susceptibility measures as mean (±SD)
| Whole sample | APOE4 | no‐APOE4 | t test (P) | |
|---|---|---|---|---|
| N | 69 | 18 | 51 | ‐ |
| Females/males | 32/37 | 8/10 | 24/27 | ‐ |
| Age | 66.1 (7.25) | 66.28 (5.29) | 66.04 (7.87) | 0.89 |
| Years of education | 15.99 (2.77) | 16.56 (2.48) | 15.78 (2.87) | 0.28 |
| MMSE | 29.32 (1.12) | 29.12 (1.58) | 29.4 (0.89) | 0.49 |
| Boston Naming Test | 14.64 (0.7) | 14.65 (1) | 14.64 (0.57) | 0.97 |
| CERAD word fluency | 24.05 (5.34) | 22.47 (5.36) | 24.62 (5.27) | 0.62 |
| TMT B/A | 2.24 (0.76) | 2.33 (0.88) | 2.21 (0.72) | 0.64 |
| Stroop | 28 (7.12) | 28.59 (6.87) | 27.79 (7.26) | 0.17 |
| Episodic memory (VLMT) | 9.34 (3.9) | 9 (3.22) | 9.47 (4.14) | 0.69 |
| Cortical Abeta (18F‐flutemetamol SUVR) | 1.19 (0.19) | 1.28 (0.33) | 1.16 (0.11) | 0.15 |
| Abeta positives (n > 1.56) | 2 | 2 | 0 | ‐ |
| Cortical magnetic susceptibility (QSM) | 1.85 (0.81) | 1.81 (0.65) | 1.87 (0.86) | 0.78 |
T test was performed to investigate differences on a group‐level between APOE4 carriers (APOE4) and non‐carriers (no‐APOE4).
Abbreviations: APOE4: Apolipoprotein E ɛ4 allele, MMSE: Mini‐Mental State Exam, CERAD: Consortium to Establish a Registry for Alzheimer's Disease, TMT A/B: Trail Making Test, Section A divided by Section B, VLMT: Verbal Learning and Memory Test, SUVR: standard uptake value ratio, QSM: quantitative susceptibility mapping.
3.2. Identification and spatial definition of the DMN
By performing group ICA for blind source decomposition of 3D resting‐state BOLD data, 20 spatial components of resting‐state network activity could be identified based on factor loading by voxel (Figure 1). These represented established functional brain networks, including one consistent with the DMN (component #3: T(68) = 4.07, P(FDR) = 0.0024, k_min = 24), as defined by a spatial pattern of MPFC, hippocampus, parahippocampal formation, PCC, precuneus, and lateral parietal cortex (Figure 2).
Figure 1.
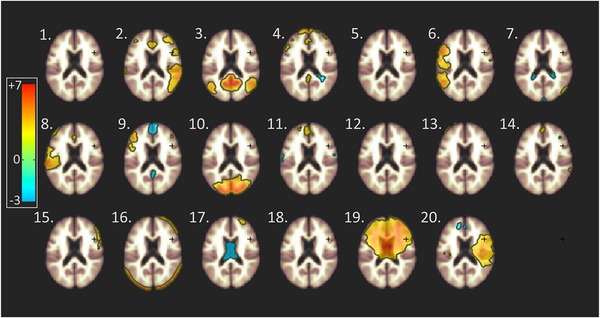
Identification of resting‐state networks by independent component analysis (ICA) of blood oxygen level–dependent (BOLD) time course synchronicity at rest. Using ICA, 20 independent components could be identified, representing distinct BOLD time course synchronicity patterns at rest. Heat maps represent factor loading by voxel for each spatial component, estimated by group ICA (color bar: lowest, blue = −3; maximum, red = +7, horizontal lines in the green area = 0)
Figure 2.
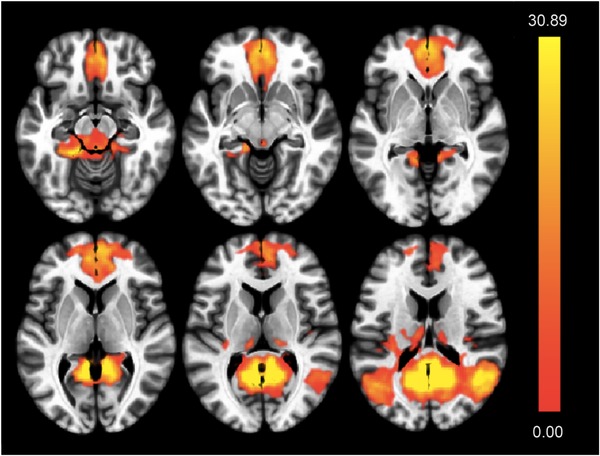
Spatial definition of the default mode network (DMN) based on blood oxygen level–dependent (BOLD) time course synchronicity within independent component 3. Indicated are axial slices indicating brain regions included by component 3. Significance levels of voxel‐level BOLD synchronicity are color coded (T‐map, highest values are yellow)
3.3. Synergistic interaction of APOE4 and cortical iron on default mode network activity
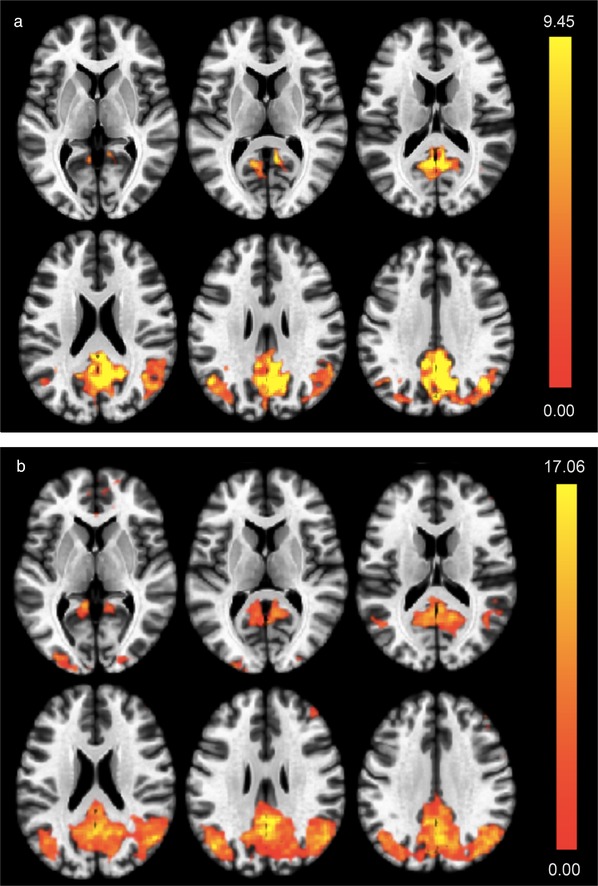
By analysis of covariance, a significant effect of APOE4 carrier status on increased DMN activity could be observed: F(2,66) = 17.95, P(FDR) < 0.001. The strongest effects were observed in the posterior cingulate cortex, precuneus, and lateral parietal cortex (Figure 3).
Figure 3.
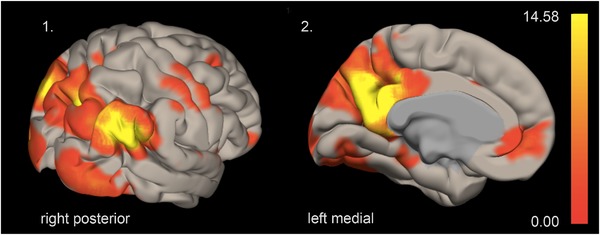
Effect of APOE4 carrier status on default mode network (DMN) activity. DMN activity, as indicated by synchronicity of blood oxygen level–dependent (BOLD) time courses, is associated with APOE4 carrier status (F‐map, highest values are yellow)
Moreover, ANCOVA also indicated significant effects of cortical iron burden on connectivity within the DMN component (F(2,66) = 14.24, P(FDR) < 0.001) (Figure 4). Finally, to compare regression effects attributable to APOE4 and cortical iron, respectively, a one‐way ANCOVA interaction was performed by using second‐level analysis algorithms included in CONN.63 Additive synergism of APOE4 and iron effects was indicated by a positive relationship between cortical iron and DMN connectivity that was associated with APOE4 carrier status (T(65) = 3.22, P(FDR) < 0.001, Figure 5A). Here, significant iron effects within the subgroup of APOE4 carriers were observed (F(2,16) = 10.97, P(FDR) = 0.0026, Figure 5B). The strongest local effects consistently resulted for voxels localized in the posterior cingulate cortex, the precuneus, and lateral parietal cortex (Figures 5A, B).
Figure 4.
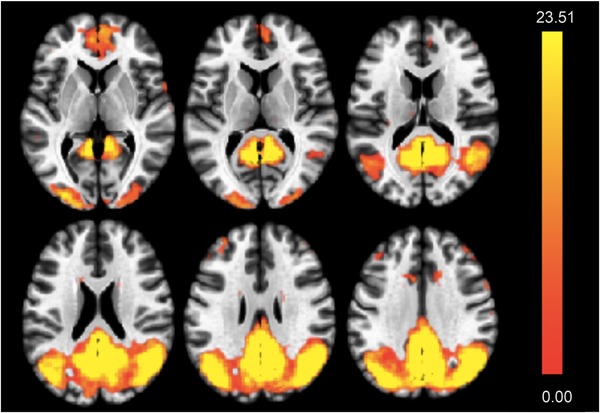
Effect of cortical iron burden on default mode network (DMN) activity. DMN activity is increased in study participants with high cortical iron (estimated by QSM) (F‐map, highest values are yellow)
Figure 5.
(A) Synergistic interactions between APOE4 carrier status and cortical iron on default mode network (DMN) activity. Colors indicate local effect sizes, as generated by second level, one‐way analysis of covariance (ANCOVA) interaction analysis (T‐map, highest values are yellow). (B) DMN activity in APOE4 carriers relates to cortical iron burden. DMN activity is increased in APOE4 carriers with high cortical iron, as indicated by regression (F‐map, highest values are yellow)
4. DISCUSSION
We identified a synergistic interaction of cortical gray matter susceptibility (QSM) and BOLD synchronicity at rest, suggesting a moderator effect of APOE4 on the relationship between cortical non‐heme iron and DMN activity. This effect was observable in a population of old‐aged, cognitively healthy adults. Because for the majority of the investigated participants no significant increase of Aβ burden could be observed, our findings might reflect preclinical brain alterations associated with APOE4‐related increased risk for AD.
The current study used established neuropsychological testing for assessment of cognitive domains typically affected in AD.82 Moreover, all study participants were genotyped for presence of the APOE4 allele, allowing for additional stratification of the study population by individual risk for AD.1, 4 Each participant also was investigated by 18F‐flutemetamol PET to assess brain Aβ burden. Flutemetamol has been used previously for assessing patients with AD,61, 62 as well as cognitively unimpaired old‐aged adults.83, 84 Although there was no significant difference between APOE4 carriers and non‐carriers regarding Aβ pathology, longitudinal follow‐up of our sample might reveal possible faster accumulation of brain Aβ in the APOE4 group, as suggested by earlier reports.10, 85 Considering the synchronicity of BOLD contrast variation in spatially distinct brain regions a proxy of neuronal functionality,25, 26, 86 ICA was performed for detection and statistical group‐inferences.63, 77 Blind source decomposition is capable of identifying many different brain networks from fMRI data recorded at rest.26, 64 In the current study we focused on the DMN, considering earlier studies that provide evidence that DMN connectivity is an indicator of cognitive functionality,25, 27, 87 which is affected at early, preclinical stages of AD.18, 19, 21, 22, 84 Although the chosen focus on the DMN may be a limitation regarding general inferences on global intrinsic network activity, the unambiguous spatial characteristics of the DMN component may have facilitated differentiation from components representing noise. Iron burden was assessed using QSM,44, 47, 88 which is a potential pathology in AD and AD‐risk populations.40, 49, 50, 89 A close association between paramagnetic susceptibility in gray matter brain regions (with low myelin content) and high tissue iron content is supported by post mortem analysis of deep brain gray matter.43, 90 Recently published histological data on cortical and deep gray matter regions furthermore support a positive relationship between QSM and iron, and an inverse relationship between QSM and myelin.46 Although paramagnetic susceptibility in human gray matter is regarded as a valid measure of non‐heme iron,38, 91 particularly cortical susceptibility measures should be interpreted carefully. When inferring on local non‐heme iron, myelin may have a confounding impact due to its phase shifting capacity.45 Moreover, there may be a relationship between susceptibility measured by locally increased BOLD contrast and QSM. Although the current study investigated BOLD synchronicity over time rather than local increases of BOLD contrast, the fact that BOLD and QSM may not be completely independent might nevertheless represent another limitation of our experimental approach. In addition, QSM at higher spatial resolution might reduce the risk of confounding heme iron by vascular objects that may have been missed due to SNR limitations of the 3 Tesla GRE sequence applied here. Further studies implying an additional, independent measure of blood flow might provide insight on the interdependence of both measures.
Although our data are consistent with earlier reports on an association between APOE4 and altered DMN properties in preclinical stages of AD,29 our findings of an association between APOE4 and increased DMN connectivity may be consistent with earlier considerations that increased DMN connectivity might represent characteristic phenomena in populations at risk for AD.84 Moreover, the finding of a genotype effect may corroborate biological relevance of our observation. Our main finding was that APOE4 effects synergistically interacted with effects associated with increased brain iron (as estimated by QSM). To our knowledge no interactive effects between magnetic susceptibility, as a reflection of iron, and APOE4 on DMN activity have been reported so far. However, our findings support earlier considerations that detrimental effects associated with increased brain iron may be promoted by the APOE4 genotype.36, 59, 89
Although the APOE4 genotype alone is not associated with increased iron,37 increased prevalence of APOE4 in cognitively impaired individuals with higher levels of brain iron might reflect accelerated cognitive deterioration.39, 40 Moreover, recently published data suggest that alterations of cortical networks such as the DMN may also indicate progression of tau pathology.92, 93 Here, additional longitudinal studies are needed to carefully investigate potential interactions between pathological tau and iron in neurodegenerative disease and healthy aging.94 Our current findings of a possibly synergistic impact of paramagnetic susceptibility and APOE4 on BOLD synchronicity within the DMN might support recently suggested therapeutic interventions aimed at brain iron load54, 95 but also restoring physiological network architecture within the neocortex.96 Recent studies suggest potentially deleterious effects of unbound iron by oxidative stress52, 97 or programmed cell death such as ferroptosis,58 an association of brain iron burden with life style,98 and a possible role of iron for maintained cognitive function at old age.65 Thus, longitudinal cohort studies are needed to better understand the interplay between altered MR measures of cortical susceptibility, its relationship to dysbalanced brain iron homeostasis, and APOE4‐related risk for AD.
ACKNOWLEDGMENTS
The authors thank all study participants for partaking in the current study. This project was supported by KFSP Molecular Imaging Network Zurich (MINZ), University of Zurich, Swiss National Science Foundation, Synapsis Alzheimer Research Switzerland, and Mäxi Stiftung, and by the National Center for Research Resources and the National Institute of Biomedical Imaging and Bioengineering of the National Institutes of Health through resource grant P41 EB015909.
Kagerer SM, van Bergen JMG, Li X, et al. APOE4 moderates effects of cortical iron on synchronized default mode network activity in cognitively healthy old‐aged adults. Alzheimer's Dement. 2020;12:e12002 10.1002/dad2.12002
REFERENCES
- 1. Belloy ME, Napolioni V, Greicius MD. A quarter century of APOE and Alzheimer's disease: progress to date and the path forward. Neuron. 2019;101:820‐838. [DOI] [PMC free article] [PubMed] [Google Scholar]
- 2. Corder EH, Saunders AM, Strittmatter WJ, et al. Gene dose of apolipoprotein E type 4 allele and the risk of Alzheimer's disease in late onset families. Science. 1993;261:921‐923. [DOI] [PubMed] [Google Scholar]
- 3. Strittmatter WJ, Saunders AM, Schmechel D, et al. Apolipoprotein E: high‐avidity binding to beta‐amyloid and increased frequency of type 4 allele in late‐onset familial Alzheimer disease. Proc Natl Acad Sci U S A. 1993;90:1977‐1981. [DOI] [PMC free article] [PubMed] [Google Scholar]
- 4. Farrer LA, Cupples LA, Haines JL, et al. Effects of age, sex, and ethnicity on the association between apolipoprotein E genotype and Alzheimer disease. A meta‐analysis. APOE and Alzheimer Disease Meta Analysis Consortium. JAMA. 1997;278:1349‐1356. . [PubMed] [Google Scholar]
- 5. Deary IJ, Whiteman MC, Pattie A, et al. Cognitive change and the APOE epsilon 4 allele. Nature. 2002;418:932. [DOI] [PubMed] [Google Scholar]
- 6. Farlow MR, He Y, Tekin S, Xu J, Lane R, Charles HC. Impact of APOE in mild cognitive impairment. Neurology. 2004;63:1898‐1901. [DOI] [PubMed] [Google Scholar]
- 7. Reiman EM, Chen K, Liu X, et al. Fibrillar amyloid‐beta burden in cognitively normal people at 3 levels of genetic risk for Alzheimer's disease. Proc Natl Acad Sci U S A. 2009;106:6820‐6825. [DOI] [PMC free article] [PubMed] [Google Scholar]
- 8. Morris JC, Roe CM, Xiong C, et al. APOE predicts amyloid‐beta but not tau Alzheimer pathology in cognitively normal aging. Ann Neurol. 2010;67:122‐131. [DOI] [PMC free article] [PubMed] [Google Scholar]
- 9. Kantarci K, Lowe V, Przybelski SA, et al. APOE modifies the association between Abeta load and cognition in cognitively normal older adults. Neurology. 2012;78:232‐240. [DOI] [PMC free article] [PubMed] [Google Scholar]
- 10. Fleisher AS, Chen K, Liu X, et al. Apolipoprotein E epsilon4 and age effects on florbetapir positron emission tomography in healthy aging and Alzheimer disease. Neurobiol Aging. 2013;34:1‐12. [DOI] [PubMed] [Google Scholar]
- 11. Lim YY, Ellis KA, Ames D, et al. Abeta amyloid, cognition, and APOE genotype in healthy older adults. Alzheimers Dement. 2013;9:538‐545. [DOI] [PubMed] [Google Scholar]
- 12. Kok E, Haikonen S, Luoto T, et al. Apolipoprotein E‐dependent accumulation of Alzheimer disease‐related lesions begins in middle age. Ann Neurol. 2009;65:650‐657. [DOI] [PubMed] [Google Scholar]
- 13. Robinson JL, Lee EB, Xie SX, et al. Neurodegenerative disease concomitant proteinopathies are prevalent, age‐related and APOE4‐associated. Brain. 2018;141:2181‐2193. [DOI] [PMC free article] [PubMed] [Google Scholar]
- 14. Kivipelto M, Helkala EL, Laakso MP, et al. Apolipoprotein E epsilon4 allele, elevated midlife total cholesterol level, and high midlife systolic blood pressure are independent risk factors for late‐life Alzheimer disease. Ann Intern Med. 2002;137:149‐155. [DOI] [PubMed] [Google Scholar]
- 15. Rasmussen KL, Tybjaerg‐Hansen A, Nordestgaard BG, Frikke‐Schmidt R. Data on plasma levels of apolipoprotein E, correlations with lipids and lipoproteins stratified by APOE genotype, and risk of ischemic heart disease. Data Brief. 2016;6:923‐932. [DOI] [PMC free article] [PubMed] [Google Scholar]
- 16. Biffi A, Sonni A, Anderson CD, et al. Variants at APOE influence risk of deep and lobar intracerebral hemorrhage. Ann Neurol. 2010;68:934‐943. [DOI] [PMC free article] [PubMed] [Google Scholar]
- 17. Wang YL, Sun LM, Zhang L, et al. Association between Apolipoprotein E polymorphism and myocardial infarction risk: a systematic review and meta‐analysis. FEBS Open Bio. 2015;5:852‐858. [DOI] [PMC free article] [PubMed] [Google Scholar]
- 18. Sheline YI, Raichle ME. Resting state functional connectivity in preclinical Alzheimer's disease. Biol Psychiatry. 2013;74:340‐347. [DOI] [PMC free article] [PubMed] [Google Scholar]
- 19. Palmqvist S, Scholl M, Strandberg O, et al. Earliest accumulation of beta‐amyloid occurs within the default‐mode network and concurrently affects brain connectivity. Nature Commun. 2017;8:1214. [DOI] [PMC free article] [PubMed] [Google Scholar]
- 20. Seeley WW. Mapping neurodegenerative disease onset and progression. Cold Spring Harb Perspect Biol. 2017;9 10.1101/cshperspect.a023622 [DOI] [PMC free article] [PubMed] [Google Scholar]
- 21. Sorg C, Riedl V, Muhlau M, et al. Selective changes of resting‐state networks in individuals at risk for Alzheimer's disease. Proc Natl Acad Sci U S A. 2007;104:18760‐18765. [DOI] [PMC free article] [PubMed] [Google Scholar]
- 22. Buckner RL, Sepulcre J, Talukdar T, et al. Cortical hubs revealed by intrinsic functional connectivity: mapping, assessment of stability, and relation to Alzheimer's disease. J Neurosci. 2009;29:1860‐1873. [DOI] [PMC free article] [PubMed] [Google Scholar]
- 23. Greicius MD, Srivastava G, Reiss AL, Menon V. Default‐mode network activity distinguishes Alzheimer's disease from healthy aging: evidence from functional MRI. Proc Natl Acad Sci U S A. 2004;101:4637‐4642. [DOI] [PMC free article] [PubMed] [Google Scholar]
- 24. Toussaint PJ, Maiz S, Coynel D, et al. Characteristics of the default mode functional connectivity in normal ageing and Alzheimer's disease using resting state fMRI with a combined approach of entropy‐based and graph theoretical measurements. Neuroimage. 2014;101:778‐786. [DOI] [PubMed] [Google Scholar]
- 25. Fox MD, Snyder AZ, Vincent JL, Corbetta M, Van Essen DC, Raichle ME. The human brain is intrinsically organized into dynamic, anticorrelated functional networks. Proc Natl Acad Sci U S A. 2005;102:9673‐9678. [DOI] [PMC free article] [PubMed] [Google Scholar]
- 26. Damoiseaux JS, Rombouts SA, Barkhof F, et al. Consistent resting‐state networks across healthy subjects. Proc Natl Acad Sci U S A. 2006;103:13848‐13853. [DOI] [PMC free article] [PubMed] [Google Scholar]
- 27. Buckner RL, Andrews‐Hanna JR, Schacter DL. The brain's default network: anatomy, function, and relevance to disease. Ann N Y Acad Sci. 2008;1124:1‐38. [DOI] [PubMed] [Google Scholar]
- 28. Castellano JM, Kim J, Stewart FR, et al. Human apoE isoforms differentially regulate brain amyloid‐beta peptide clearance. Sci Transl Med. 2011;3:89ra57. [DOI] [PMC free article] [PubMed] [Google Scholar]
- 29. Sheline YI, Morris JC, Snyder AZ, et al. APOE4 allele disrupts resting state fMRI connectivity in the absence of amyloid plaques or decreased CSF Abeta42. J Neurosci. 2010;30:17035‐17040. [DOI] [PMC free article] [PubMed] [Google Scholar]
- 30. Grundke‐Iqbal I, Fleming J, Tung YC, Lassmann H, Iqbal K, Joshi JG. Ferritin is a component of the neuritic (senile) plaque in Alzheimer dementia. Acta Neuropathologica. 1990;81:105‐110. [DOI] [PubMed] [Google Scholar]
- 31. Connor JR, Snyder BS, Beard JL, Fine RE, Mufson EJ. Regional distribution of iron and iron‐regulatory proteins in the brain in aging and Alzheimer's disease. J Neurosci Res. 1992;31:327‐335. [DOI] [PubMed] [Google Scholar]
- 32. Hallgren B, Sourander P. The effect of age on the non‐haemin iron in the human brain. J Neurochem. 1958;3:41‐51. [DOI] [PubMed] [Google Scholar]
- 33. Rodrigue KM, Daugherty AM, Haacke EM, Raz N. The role of hippocampal iron concentration and hippocampal volume in age‐related differences in memory. Cereb Cortex. 2013;23:1533‐1541. [DOI] [PMC free article] [PubMed] [Google Scholar]
- 34. Acosta‐Cabronero J, Betts MJ, Cardenas‐Blanco A, Yang S, Nestor PJ. In vivo MRI mapping of brain iron deposition across the adult lifespan. J Neurosci. 2016;36:364‐374. [DOI] [PMC free article] [PubMed] [Google Scholar]
- 35. Zecca L, Youdim MB, Riederer P, Connor JR, Crichton RR. Iron, brain ageing and neurodegenerative disorders. Nat Rev Neurosci. 2004;5:863‐873. [DOI] [PubMed] [Google Scholar]
- 36. van Duijn S, Bulk M, van Duinen SG, et al. Cortical iron reflects severity of Alzheimer's disease. J Alzheimers Dis. 2017;60:1533‐1545. [DOI] [PMC free article] [PubMed] [Google Scholar]
- 37. Ayton S, Wang Y, Diouf I, et al. Brain iron is associated with accelerated cognitive decline in people with Alzheimer pathology. Mol Psychiatry. 2019. [DOI] [PMC free article] [PubMed] [Google Scholar]
- 38. Daugherty AM, Raz N. Appraising the role of iron in brain aging and cognition: promises and limitations of MRI methods. Neuropsychol Rev. 2015;25:272‐287. [DOI] [PMC free article] [PubMed] [Google Scholar]
- 39. Ayton S, Faux NG, Bush AI, Alzheimer's Disease Neuroimaging Initiative . Ferritin levels in the cerebrospinal fluid predict Alzheimer's disease outcomes and are regulated by APOE. Nature Commun. 2015;6:6760. [DOI] [PMC free article] [PubMed] [Google Scholar]
- 40. van Bergen JM, Li X, Hua J, et al. Colocalization of cerebral iron with amyloid beta in mild cognitive impairment. Sci Rep. 2016;6:35514. [DOI] [PMC free article] [PubMed] [Google Scholar]
- 41. Li W, Wu B, Liu C. Quantitative susceptibility mapping of human brain reflects spatial variation in tissue composition. Neuroimage. 2011;55:1645‐1656. [DOI] [PMC free article] [PubMed] [Google Scholar]
- 42. Schweser F, Deistung A, Lehr BW, Reichenbach JR. Quantitative imaging of intrinsic magnetic tissue properties using MRI signal phase: an approach to in vivo brain iron metabolism. Neuroimage. 2011;54:2789‐2807. [DOI] [PubMed] [Google Scholar]
- 43. Langkammer C, Schweser F, Krebs N, et al. Quantitative susceptibility mapping (QSM) as a means to measure brain iron? A post mortem validation study. Neuroimage. 2012;62:1593‐1599. [DOI] [PMC free article] [PubMed] [Google Scholar]
- 44. Lim IA, Faria AV, Li X, et al. Human brain atlas for automated region of interest selection in quantitative susceptibility mapping: application to determine iron content in deep gray matter structures. Neuroimage. 2013;82:449‐469. [DOI] [PMC free article] [PubMed] [Google Scholar]
- 45. Langkammer C, Krebs N, Goessler W, et al. Susceptibility induced gray‐white matter MRI contrast in the human brain. Neuroimage. 2012;59:1413‐1419. [DOI] [PMC free article] [PubMed] [Google Scholar]
- 46. Hametner S, Endmayr V, Deistung A, et al. The influence of brain iron and myelin on magnetic susceptibility and effective transverse relaxation–a biochemical and histological validation study. Neuroimage. 2018;179:117‐133. [DOI] [PubMed] [Google Scholar]
- 47. Deistung A, Schafer A, Schweser F, Biedermann U, Turner R, Reichenbach JR. Toward in vivo histology: a comparison of quantitative susceptibility mapping (QSM) with magnitude‐, phase‐, and R2*‐imaging at ultra‐high magnetic field strength. Neuroimage. 2013;65:299‐314. [DOI] [PubMed] [Google Scholar]
- 48. van Bergen JMG, Li X, Quevenco FC, et al. Simultaneous quantitative susceptibility mapping and flutemetamol‐PET suggests local correlation of iron and beta‐amyloid as an indicator of cognitive performance at high age. Neuroimage. 2018. [DOI] [PMC free article] [PubMed] [Google Scholar]
- 49. Acosta‐Cabronero J, Williams GB, Cardenas‐Blanco A, Arnold RJ, Lupson V, Nestor PJ. In vivo quantitative susceptibility mapping (QSM) in Alzheimer's disease. PLoS One. 2013;8:e81093. [DOI] [PMC free article] [PubMed] [Google Scholar]
- 50. Ayton S, Fazlollahi A, Bourgeat P, et al. Cerebral quantitative susceptibility mapping predicts amyloid‐beta‐related cognitive decline. Brain. 2017;140:2112‐2119. [DOI] [PubMed] [Google Scholar]
- 51. Richardson JS, Subbarao KV, Ang LC. On the possible role of iron‐induced free radical peroxidation in neural degeneration in Alzheimer's disease. Ann N Y Acad Sci. 1992;648:326‐327. [DOI] [PubMed] [Google Scholar]
- 52. Yoshida T, Tanaka M, Sotomatsu A, Hirai S. Activated microglia cause superoxide‐mediated release of iron from ferritin. Neurosci Lett. 1995;190:21‐24. [DOI] [PubMed] [Google Scholar]
- 53. Smith MA, Harris PL, Sayre LM, Perry G. Iron accumulation in Alzheimer disease is a source of redox‐generated free radicals. Proc Natl Acad Sci U S A. 1997;94:9866‐9868. [DOI] [PMC free article] [PubMed] [Google Scholar]
- 54. Bush AI. The metal theory of Alzheimer's disease. J Alzheimers Dis. 2013;33(Suppl 1):S277‐S281. [DOI] [PubMed] [Google Scholar]
- 55. Kruer MC. The neuropathology of neurodegeneration with brain iron accumulation. Int Rev Neurobiol. 2013;110:165‐194. [DOI] [PMC free article] [PubMed] [Google Scholar]
- 56. Harman D. Aging: a theory based on free radical and radiation chemistry. J Gerontol. 1956;11:298‐300. [DOI] [PubMed] [Google Scholar]
- 57. Angeli JPF, Shah R, Pratt DA, Conrad M. Ferroptosis inhibition: mechanisms and opportunities. Trends Pharmacol Sci. 2017;38:489‐498. [DOI] [PubMed] [Google Scholar]
- 58. Stockwell BR, Friedmann Angeli JP, Bayir H, et al. Ferroptosis: a regulated cell death nexus linking metabolism, redox biology, and disease. Cell. 2017;171:273‐285. [DOI] [PMC free article] [PubMed] [Google Scholar]
- 59. Wood H. Alzheimer disease: iron‐the missing link between ApoE and Alzheimer disease. Nat Rev Neurol. 2015;11:369. [DOI] [PubMed] [Google Scholar]
- 60. Filippini N, MacIntosh BJ, Hough MG, et al. Distinct patterns of brain activity in young carriers of the APOE‐epsilon4 allele. Proc Natl Acad Sci U S A. 2009;106:7209‐7214. [DOI] [PMC free article] [PubMed] [Google Scholar]
- 61. Small GW, Kepe V, Ercoli LM, et al. PET of brain amyloid and tau in mild cognitive impairment. N Engl J Med. 2006;355:2652‐2663. [DOI] [PubMed] [Google Scholar]
- 62. Vandenberghe R, Van Laere K, Ivanoiu A, et al. 18F‐flutemetamol amyloid imaging in Alzheimer disease and mild cognitive impairment: a phase 2 trial. Ann Neurol. 2010;68:319‐329. [DOI] [PubMed] [Google Scholar]
- 63. Whitfield‐Gabrieli S, Nieto‐Castanon A. Conn: a functional connectivity toolbox for correlated and anticorrelated brain networks. Brain Connect. 2012;2:125‐141. [DOI] [PubMed] [Google Scholar]
- 64. McKeown MJ, Makeig S, Brown GG, et al. Analysis of fMRI data by blind separation into independent spatial components. Hum Brain Mapp. 1998;6:160‐188. [DOI] [PMC free article] [PubMed] [Google Scholar]
- 65. van Bergen JMG, Li X, Quevenco FC, et al. Low cortical iron and high entorhinal cortex volume promote cognitive functioning in the oldest‐old. Neurobiol Aging. 2018;64:68‐75. [DOI] [PMC free article] [PubMed] [Google Scholar]
- 66. World Medical A. Declaration of Helsinki. Law Med Health Care. 1991;19:264‐265. [PubMed] [Google Scholar]
- 67. Folstein MF, Folstein SE, McHugh PR. “Mini‐mental state”. A practical method for grading the cognitive state of patients for the clinician. J Psychiatr Res. 1975;12:189‐198. [DOI] [PubMed] [Google Scholar]
- 68. Sotaniemi M, Pulliainen V, Hokkanen L, et al. CERAD‐neuropsychological battery in screening mild Alzheimer's disease. Acta Neurol Scand. 2012;125:16‐23. [DOI] [PubMed] [Google Scholar]
- 69. Helmstaedter C, Durwen HF. The verbal learning and retention test. A useful and differentiated tool in evaluating verbal memory performance. Schweiz Arch Neurol Psychiatr (1985). 1990;141:21‐30. [PubMed] [Google Scholar]
- 70. Nicholas LE, Brookshire RH, MacLennan DL, Schumacher JG, Porrazzo SA. The Boston naming test: revised administration and scoring procedures and normative information for non‐brain‐damaged adults. Clinical Aphasiology. 1988;18. [Google Scholar]
- 71. MacLeod CM. Half a century of research on the Stroop effect: an integrative review. Psychol Bull. 1991;109:163‐203. [DOI] [PubMed] [Google Scholar]
- 72. Tombaugh TN. Trail making test A and B: normative data stratified by age and education. Arch Clin Neuropsychol. 2004;19:203‐214. [DOI] [PubMed] [Google Scholar]
- 73. Wu B, Li W, Guidon A, Liu C. Whole brain susceptibility mapping using compressed sensing. Magn Reson Med. 2012;67:137‐147. [DOI] [PMC free article] [PubMed] [Google Scholar]
- 74. Wu B, Li W, Avram AV, Gho SM, Liu C. Fast and tissue‐optimized mapping of magnetic susceptibility and T2* with multi‐echo and multi‐shot spirals. Neuroimage. 2012;59:297‐305. [DOI] [PMC free article] [PubMed] [Google Scholar]
- 75. Li W, Wang N, Yu F, et al. A method for estimating and removing streaking artifacts in quantitative susceptibility mapping. Neuroimage. 2015;108:111‐22. (PMID: 25536496) [DOI] [PMC free article] [PubMed] [Google Scholar]
- 76. Li X, Lei P, Tuo Q, et al. Enduring elevations of hippocampal amyloid precursor protein and iron are features of beta‐amyloid toxicity and are mediated by tau. Neurotherapeutics. 2015;12:862‐873. [DOI] [PMC free article] [PubMed] [Google Scholar]
- 77. Calhoun VD, Adali T, Pearlson GD, Pekar JJ. A method for making group inferences from functional MRI data using independent component analysis. Hum Brain Mapp. 2001;14:140‐151. [DOI] [PMC free article] [PubMed] [Google Scholar]
- 78. Bell AJ, Sejnowski TJ. An information‐maximization approach to blind separation and blind deconvolution. Neural Comput. 1995;7:1129‐1159. [DOI] [PubMed] [Google Scholar]
- 79. Boly M, Phillips C, Tshibanda L, et al. Intrinsic brain activity in altered states of consciousness: how conscious is the default mode of brain function. Ann N Y Acad Sci. 2008;1129:119‐129. [DOI] [PMC free article] [PubMed] [Google Scholar]
- 80. Biswal B, Yetkin FZ, Haughton VM, Hyde JS. Functional connectivity in the motor cortex of resting human brain using echo‐planar MRI. Magn Reson Med. 1995;34:537‐541. [DOI] [PubMed] [Google Scholar]
- 81. Benjamini Y, Hochberg Y. Controlling the false discovery rate: a practical and powerful approach to multiple testing. Journal of the Royal Statistical Society, Series B. 1995;57:289‐300. [Google Scholar]
- 82. Albert MS, Moss MB, Tanzi R, Jones K. Preclinical prediction of AD using neuropsychological tests. J Int Neuropsychol Soc. 2001;7:631‐639. [DOI] [PubMed] [Google Scholar]
- 83. Jansen WJ, Ossenkoppele R, Knol DL, et al. Prevalence of cerebral amyloid pathology in persons without dementia: a meta‐analysis. JAMA. 2015;313:1924‐1938. [DOI] [PMC free article] [PubMed] [Google Scholar]
- 84. Hahn A, Strandberg TO, Stomrud E, et al. Association between earliest amyloid uptake and functional connectivity in cognitively unimpaired elderly. Cereb Cortex. 2019;29:2173‐2182. [DOI] [PMC free article] [PubMed] [Google Scholar]
- 85. Chetelat G, La Joie R, Villain N, et al. Amyloid imaging in cognitively normal individuals, at‐risk populations and preclinical Alzheimer's disease. Neuroimage Clin. 2013;2:356‐365. [DOI] [PMC free article] [PubMed] [Google Scholar]
- 86. Biswal BB, Mennes M, Zuo XN, et al. Toward discovery science of human brain function. Proc Natl Acad Sci U S A. 2010;107:4734‐4739. [DOI] [PMC free article] [PubMed] [Google Scholar]
- 87. Van Dijk KR, Hedden T, Venkataraman A, Evans KC, Lazar SW, Buckner RL. Intrinsic functional connectivity as a tool for human connectomics: theory, properties, and optimization. J Neurophysiol. 2010;103:297‐321. [DOI] [PMC free article] [PubMed] [Google Scholar]
- 88. Schweser F, Sommer K, Deistung A, Reichenbach JR. Quantitative susceptibility mapping for investigating subtle susceptibility variations in the human brain. Neuroimage. 2012;62:2083‐2100. [DOI] [PubMed] [Google Scholar]
- 89. Ayton S, Faux NG, Bush AI. Association of cerebrospinal fluid ferritin level with preclinical cognitive decline in APOE‐epsilon4 carriers. JAMA Neurol. 2017;74:122‐125. [DOI] [PubMed] [Google Scholar]
- 90. Sun H, Walsh AJ, Lebel RM, et al. Validation of quantitative susceptibility mapping with Perls' iron staining for subcortical gray matter. Neuroimage. 2015;105:486‐492. [DOI] [PubMed] [Google Scholar]
- 91. Ndayisaba A, Kaindlstorfer C, Wenning GK. Iron in neurodegeneration–cause or consequence. Front Neurosci. 2019;13:180. [DOI] [PMC free article] [PubMed] [Google Scholar]
- 92. Franzmeier N, Rubinski A, Neitzel J, et al. Functional connectivity associated with tau levels in ageing, Alzheimer's, and small vessel disease. Brain. 2019;142:1093‐1107. [DOI] [PMC free article] [PubMed] [Google Scholar]
- 93. Sepulcre J, Sabuncu MR, Li Q, El Fakhri G, Sperling R, Johnson KA. Tau and amyloid‐beta proteins distinctively associate to functional network changes in the aging brain. Alzheimers Dement. 2017;13:1261‐1269. [DOI] [PMC free article] [PubMed] [Google Scholar]
- 94. Rao SS, Adlard PA. Untangling tau and iron: exploring the interaction between iron and tau in neurodegeneration. Front Mol Neurosci. 2018;11:276. [DOI] [PMC free article] [PubMed] [Google Scholar]
- 95. Nikseresht S, Bush AI, Ayton S. Treating Alzheimer's disease by targeting iron. Br J Pharmacol. 2019;176:3622‐3635. [DOI] [PMC free article] [PubMed] [Google Scholar]
- 96. Pini L, Manenti R, Cotelli M, Pizzini FB, Frisoni GB, Pievani M. Non‐invasive brain stimulation in dementia: a complex network story. Neurodegener Dis. 2018;18:281‐301. [DOI] [PubMed] [Google Scholar]
- 97. Dixon SJ, Stockwell BR. The role of iron and reactive oxygen species in cell death. Nat Chem Biol. 2014;10:9‐17. [DOI] [PubMed] [Google Scholar]
- 98. Pirpamer L, Hofer E, Gesierich B, et al. Determinants of iron accumulation in the normal aging brain. Neurobiol Aging. 2016;43:149‐155. [DOI] [PubMed] [Google Scholar]