Abstract
Flying-foxes (pteropid bats) are the natural host of Hendra virus, a recently emerged zoonotic virus responsible for mortality or morbidity in horses and humans in Australia since 1994. Previous studies have suggested physiological and ecological risk factors for infection in flying-foxes, including physiological stress. However, little work has been done measuring and interpreting stress hormones in flying-foxes. Over a 12-month period, we collected pooled urine samples from underneath roosting flying-foxes, and urine and blood samples from captured individuals. Urine and plasma samples were assayed for cortisol using a commercially available enzyme immunoassay. We demonstrated a typical post-capture stress response in flying-foxes, established urine specific gravity as an attractive alternative to creatinine to correct urine concentration, and established population-level urinary cortisol ranges (and geometric means) for the four Australian species: Pteropus alecto 0.5–305.1 ng/mL (20.1 ng/mL); Pteropus conspicillatus 0.3–370.9 ng/mL (18.9 ng/mL); Pteropus poliocephalus 0.3–311.3 ng/mL (10.1 ng/mL); Pteropus scapulatus 5.2–205.4 ng/mL (40.7 ng/mL). Geometric means differed significantly except for P. alecto and P. conspicillatus. Our approach is methodologically robust, and has application both as a research or clinical tool for flying-foxes, and for other free-living colonial wildlife species.
Keywords: bat, flying-fox, stress, cortisol, Australia
Introduction and Purpose
Bats (Order Chiroptera) are the source of a number of emerging pathogenic viruses of animal and public health significance, including ebolaviruses, SARS-like coronaviruses, and henipaviruses (Halpin et al. 2000; Chua et al. 2000; Li et al. 2005; Calisher et al. 2006; Pourrut et al. 2009; Ge et al. 2013). In Australia, fruit-bats of the genus Pteropus (commonly known as flying-foxes) have been identified as the natural host of Hendra virus, a novel and potentially fatal zoonotic virus responsible for mortality or morbidity in about 80 horses and 7 humans since it was first described in 1994 (Murray et al. 1995; Halpin et al. 2000). Understanding Hendra virus infection dynamics in flying-foxes and the contributing risk factors is fundamental to elaborating the disease ecology of the virus and thus effective exposure risk management in horses and humans. Previous studies have suggested that a range of physiological and ecological factors constitute risk factors for Hendra virus infection in flying-foxes (Field 2005; Plowright et al. 2008; Breed et al. 2011), including physiological stress associated with reproduction and sub-optimal nutritional (Plowright et al. 2008). However, to rigorously investigate the putative association between stress and Hendra virus infection dynamics in flying-foxes, a robust method of measuring stress in free-living flying-foxes is needed.
Glucocorticoid hormones (cortisol and corticosterone) are fundamental regulators of energy balance in mammalian species, and elevations in these hormones precipitate a stress response which modulates fertility, metabolic balance and immune function (Sapolsky et al. 2000; Reeder and Kramer 2005). However, little work has been done on glucocorticoid dynamics in flying-foxes and there are currently few recognised approaches to measuring hormone levels and interpreting changes in terms of physiological stress. Fundamentally, a non-stressful method of sampling is needed to validly measure physiological stress in free-living wildlife populations, to avoid measuring the stress response to the capture and sampling event itself (Reeder et al. 2004a).
Studies of Pteropus species have found that cortisol is the primary glucocorticoid occurring in plasma (Widmaier and Kunz 1993, Widmaier et al. 1994, Reeder et al. 2004b), and that animals exhibit significant elevations in plasma glucocorticoid levels in response to restraint stress. Widmaier et al. (1994) concluded that bats possess a stress response similar in some ways to other mammals, but that the high constitutive and stress-induced levels of glucocorticoids in Pteropodidae were exceptional amongst mammals. Similarly, Reeder et al. (2004b) noted Pteropus hypomelanus (variable flying-fox) to have amongst the highest total plasma glucocorticoids in vertebrates.
Matrices of secretion of glucocorticoids, other than plasma, have been used to successfully measure cortisol levels non-invasively. Bennett et al. (2008) used urinary corticosteroid excretion patterns in the okapi (Okapia johnstoni) to study circadian rhythms, Pearson et al. (2008) used saliva for the quantification of cortisol in socially housed baboons (Papio hamadryas hamadryas), Woodruff et al. (2010) used faecal corticosterone metabolite measurements to compare captive and free-living tuco-tucos (Ctenomys sociabilis) and Hogan et al. (2012) used faecal cortisol metabolites as a non invasive tool to assess stress in captive numbats (Myrmecobius fasciatus).
The primary aim of this study is to develop and demonstrate a methodologically robust approach to determining and interpreting cortisol values in urine collected from wild, free-living flying-fox populations. Secondary aims are to describe population-level urinary cortisol ranges in the four Australian mainland species, and to compare the urinary cortisol profiles between species.
Methods
Animals, Ethics and Study Sites
The four mainland Australian flying-fox species were included in the study: Pteropus alecto (black flying-fox), Pteropus poliocephalus (grey-headed flying-fox), Pteropus conspicillatus (spectacled flying-fox), and Pteropus scapulatus (little red flying-fox). Samples were collected over a 12-month-period in Queensland (QLD) and New South Wales (NSW) as part of a broader study (Edson et al. 2014, in preparation). Roost sites were identified using information from the Queensland Department of Environment and Heritage Protection (EHP) and the Queensland Centre for Emerging Infectious Diseases (QCEID). Species cortisol ranges were determined from pooled urine samples collected under roosting flying-foxes when only single species were present. Fieldwork was conducted under the (then) Department of Employment, Economic Development and Innovation Animal Ethics Committee Permit SA 2011/12/375, Queensland Environmental Protection Agency Scientific Purposes Permit WISP05810609, Queensland Department of Environment and Resource Management Scientific Purposes Permit WISP05810609, New South Wales Office of Environment and Heritage Animal Ethics Committee Permit 120206/02, and New South Wales Office of Environment and Heritage Scientific Licence SL 100537.
Sample Collection and Storage
Two types of sample were collected—pooled urine samples and individual animal samples. Collection of pooled urine samples, adapted from Field et al. (2011), began in the late afternoon at selected roost sites. Plastic sheeting (measuring 3.6 m × 2.6 m) was placed under trees in which flying-foxes were roosting. The following morning at sunrise, pooled urine samples were collected from each sheet and held on ice bricks. The target sample size and volume was 30 × 1 mL, with typically three pooled samples from each of ten sheets. Pooled samples were methodically collected from discrete sections of each sheet to minimise an individual’s potential contribution to multiple pools, and typically consisted of 10–20 discrete urine droplets. Where more than four pooled samples were collected from a sheet, four samples were randomly selected for inclusion in the analysis (using a random number generator) to maintain sampling intensity across sheets.
Individual P. alecto were captured at a roost in Laidley, Queensland. Bats were captured pre-dawn in mist nets (20 m wide × 4 m deep) hoist between two 12 m aluminium masts, as they returned to the roost. Each bat was quickly removed from the net, and immediately anaesthetised (under veterinary supervision) using the inhalation agent isoflurane and medical oxygen, as described by Jonsson et al. (2004). Within 3 min of capture, 1 mL of blood was collected from the marginal wing (cephalic) vein into a 1.3 mL lithium heparin blood tube (Sarstedt product number 2269201), and a urine sample was sought by trans-abdominal palpation and gentle manual bladder expression. Blood samples were stored on ice bricks for up to 3 h before being centrifuged for 10 min at 3,000 rpm and the plasma yield collected. Blood glucose was measured using an ACCU-CHEK Performa™ glucometer (Roche Diagnostics GmbH). Post-anaesthetic, each bat was monitored until conscious, placed into a pillowcase which was tied to a horizontal line (allowing natural inverted roosting posture), and allowed to hang quietly for 60–90 min, when the above blood and urine sample collections were repeated. Following the second collection, animals were again monitored until conscious, placed into a pillowcase and allowed to recover for at least 30 min before being released at the roost site. All samples were stored on ice bricks or refrigerated at 5°C until shipment on ice bricks to the laboratory. At the laboratory, samples were stored at −80°C until processing.
Hormone Analysis and Statistics
Cortisol concentration was measured using Cayman Chemical Company Cortisol Enzyme Immunoassay (EIA)™, (Product number 500360), employing a synthetic cortisol-specific mouse monoclonal antibody (4-pregnen-11β,17,21-triol-3,20-dione). The assay is validated by the manufacturers for human urine and plasma, and mouse faeces, with a minimum detectable cortisol concentration of 0.2 ng/ml. The specificity of the monoclonal antibody is described by the manufacturers, with 100% reactivity with cortisol, and 4% or less cross-reactivity with related hormones (prednisolone 4.0%, cortexolone 1.6%, 11-deoxycorticosterone 0.23%, 17-hydroxyprogesterone 0.23%, cortisol glucuronide 0.15%, corticosterone 0.14%, cortisone 0.13%, and <0.1% for androstenedione, enterolactone, estrone, 17-hydroxypregnenolone, pregnenolone and testosterone).
Duplicate pooled urine samples were diluted 1:10 and duplicate plasma samples were diluted 1:10,000 in EIA kit assay buffer and assayed for cortisol according to manufacturer instructions. Absorbances were read at 405 nm with a Thermo Scientific Multiscan Ascent plate reader using Ascent software (Version 2.6). When measurements fell outside the range of 20–80% B/B0, samples were diluted and re-assayed to ensure the measurements fell within the linear range of the standard curve. Cortisol concentration was determined by analysis of absorbance values using MyAssays Analysis Software Solutions Cortisol ‘Four Parameter Logistic Curve’ online data analysis tool (MyAssays Ltd., http://www.myassays.com/four-parameter-logistic-curve.assay). Measurements were further statistically analysed after logarithmic transformation due to positive skew of pooled population data, using XLSTAT (Version 2008.6.08 Copyright Addinsoft 1995–2008), and analytical validations using Genstat (Version 14).
Correction of Cortisol Measurements for Urine Concentration
Urinary creatinine concentrations were measured using Cayman Chemical Company Creatinine (urinary) Assay Kit (Item Number 500701). Urine specific gravity (USG) was measured using a hand-held clinical refractometer. Cortisol concentration was expressed as urinary ng cortisol/mg creatinine for a subset of pooled population urine samples for each species, and compared with a corrected urinary cortisol concentration derived from the USG of the same samples using the adapted formula of Miller et al. (2004): Corrected cortisol concentration (ng/mL) = Raw cortisol concentration (ng/ml) × (Species USG-1)/(Sample USG-1).
Analytical Validations
Both the plasma and urine cortisol concentration data were subjected to regression analysis to establish parallelism with the standard curve. Assay accuracy was expressed as linear correlation (R 2 value) and percent recovery efficiency listed for each species and matrix. Percent binding of antibody versus cortisol assay standards (ln transformed doses of 4,000–6.5 pg/mL) was compared with serially diluted urine (log 10 transformed doses of neat to 1:1,000), employing one low and one high concentration pooled urine sample (n = 5) for each species. Percent binding of antibody versus cortisol assay standards (ln transformed doses of 4,000 to 6.5 pg/mL) was compared with serially diluted plasma (log 10 transformed doses of 1:1,000 to 1:50,000). One pooled plasma sample (n = 5) for black flying-foxes was employed. Only samples within the linear range of the standard curve of 20–80% antibody binding were included in the analysis. Assay accuracy was determined by linear correlation between serially diluted cortisol assay standards in EIA assay buffer (4,000 to 6.5 pg/mL), and serially diluted cortisol assay standards in 1:10 urine or 1:10,000 plasma.
Results
A total of 964 pooled urine samples from all four species were collected in 33 sampling events across 15 selected roost sites. Individual urine and blood samples were collected from 13 wild-caught P. alecto in an additional sampling event (Fig. 1; Table 1).
Figure 1.
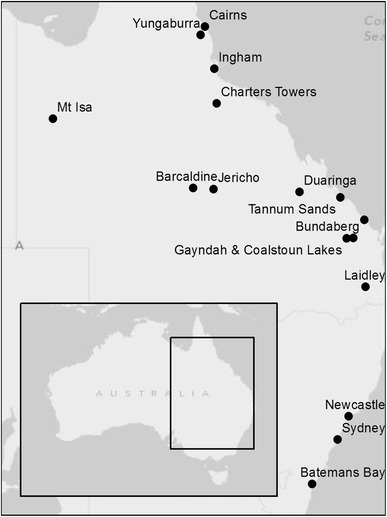
Flying-fox roost study sites for pooled urine collection and individual animal capture in Queensland and New South Wales, Australia.
Table 1.
Flying-fox roost study sites
| Roost site | Region | Species | Sample type | Sample date |
|---|---|---|---|---|
| Laidley | South East Queensland | P. alecto | Individual animals | November 2012 |
| Gayndah | South Queensland | P. alecto | Pooled urine | April 2012 |
| Bundaberg | South Queensland | P. alecto | Pooled urine | March 2012 |
| Coalstoun Lakes | South Queensland | P. alecto | Pooled urine | April 2012 |
| Tannum Sands1 | Central Queensland | P. alecto | Pooled urine | April–June 2012 |
| Duaringa1 | Central Queensland | P. scapulatus | Pooled urine | May–June 2012 |
| Charters Towers | North Queensland | P. alecto | Pooled urine | July 2012 |
| Ingham1 | North Queensland | P. alecto | Pooled urine | June–July 2012 |
| Cairns1 | Far North Queensland | P. conspiculatus | Pooled urine | May–August 2012 |
| Yungaburra1 | Far North Queensland | P. conspiculatus | Pooled urine | November 2011–May 2012 |
| Barcaldine | Western Queensland | P. scapulatus | Pooled urine | September 2011 |
| Jericho | Western Queensland | P. scapulatus | Pooled urine | January 2012 |
| Mt Isa1 | Western Queensland | P. scapulatus | Pooled urine | October–November 2011 |
| Sydney1 | New South Wales | P. poliocephalus | Pooled urine | March–July 2012 |
| Newcastle | New South Wales | P. poliocephalus | Pooled urine | June 2012 |
| Batemans Bay1 | New South Wales | P. poliocephalus | Pooled urine | June–July 2012 |
1Roost sites sampled on multiple occasions.
Correction of Cortisol Measurements for Urine Concentration Using Urine Specific Gravity
USG varied between samples within a single roost site collection, between different dates of collection at the same roost site, between different roost sites of the same species and between species (Table 2). The mean USG was calculated from urine samples for each species and used in the cortisol measurement correction to adjust cortisol concentration measurements for varying physiological states across a single species. Correlation between cortisol concentration corrected for USG and creatinine concentration was established by determining linearity for P. poliocephalus (R 2 = 0.88, n = 36); for P. alecto/P. scapulatus (R 2 = 0.89, n = 14); and for P. conspicillatus (R 2 = 0.95, n = 20). USG was determined for all urine samples, and cortisol concentrations corrected according to mean species USG.
Table 2.
Urine specific gravity population ranges and means for Australian Pteropus species
| P. alecto | P. poliocephalus | P. scapulatus | P. conspicillatus | |
|---|---|---|---|---|
| n | 292 | 201 | 172 | 245 |
| Range | 1.001–1.034 | 1.001–1.034 | 1.004–1.040 | 1.002–1.042 |
| Species Mean (SD) | 1.015 (0.007) | 1.013 (0.006) | 1.015 (0.007) | 1.015 (0.010) |
Analytical Validations
Parallelism with the standard curve was demonstrated for all plasma and urine samples, with no sample curves exhibiting significant difference to the standard curves (test of slopes, P > 0.01, at 95% CI). High levels of assay accuracy and good recovery efficiency were also demonstrated (Table 3). Intra-assay variation was determined to be 6.0%, on comparison of 100 randomly chosen duplicate urine and plasma samples across ten assays. Inter-assay variation was determined to be 4.2% on comparison of one cortisol assay standard falling between 20 and 80% antibody binding across 26 assays.
Table 3.
Analytical validations of the cortisol EIA assay for Australian Pteropus species
| Test | Urine | Plasma | |||
|---|---|---|---|---|---|
| P. alecto | P. poliocephalus | P. scapulatus | P. conspicillatus | P. alecto | |
| Test of slope (P) | 0.05 | 0.02 | 0.10 | 0.24 | 0.23 |
| Linearity (R 2) | 0.99 | 0.99 | 0.99 | 0.95 | 0.99 |
| Recovery (%) | 102 | 86 | 79 | 98 | 110 |
Response to Capture Stress
Paired blood samples for blood glucose analysis were obtained from 12 individuals, with one invalid glucose reading. Valid cortisol measurements were obtained from six paired plasma samples, and from a further five of the 60–90 min post-capture plasma samples. The corresponding 3 min post-capture plasma samples from these latter five bats had cortisol levels below the lowest detectable dose of the cortisol assay. These samples were attributed values half way between the lowest detectable dose and zero, and were included in the mean value analysis. Two individual animals yielded urine samples at 3 min post-capture, and six different individuals yielded urine at 60–90 min post-capture.
Individual animal 3 min post-capture plasma cortisol measurements ranged from 21.1 to 298.0 ng/mL, with a mean of 61.2 ± 25.0 ng/mL, whilst the 60–90 min post-capture measurements ranged from 474.2 to 1,630.1 ng/mL, with a mean of 1,144.9 ± 121.9 ng/mL (Figs. 2, 3). This demonstrates a statistically significant approximately tenfold increase in plasma cortisol (t = −6.866, P = 0.0001 at 95% CI). Individual animal 3 min post-capture urinary cortisol measurements ranged from 0.2 to 1.2 ng/mL, with a mean of 0.7 ± 0.5 ng/mL, whilst the 60–90 min post-capture measurements ranged from 116.9 to 474.5 ng/mL, with a mean of 333.4 ± 49.1 ng/mL, demonstrating a statistically significant increase in urinary cortisol (Kruskal–Wallis test, P = 0.046 at 95% CI) (Fig. 4). Individual animal 3 min post-capture blood glucose measurements ranged from 3.9 to 10.1 mmol/L, with a mean of 7.0 ± 0.5 mmol/L, whilst the 60–90 min post-capture measurements ranged from 7.3 mmol/L to 13.7 mmol/L, with a mean of 9.8 ± 0.6 mmol/L, demonstrating a statistically significant increase in blood glucose (t = −3.550, P = 0.002 at 95% CI) (Fig. 5).
Figure 2.
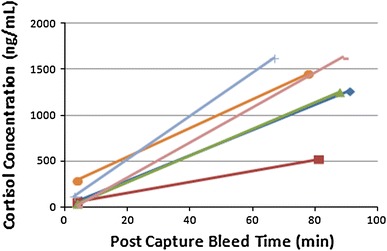
Individual plasma cortisol concentration of P. alecto (n = 6) at 3 min and 60–90 min bleed post-capture.
Figure 3.
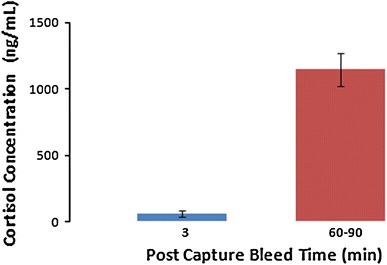
Mean plasma cortisol concentration ± standard error of mean (SEM) of P. alecto (n = 11) at 3 min and 60–90 min bleed post-capture.
Figure 4.
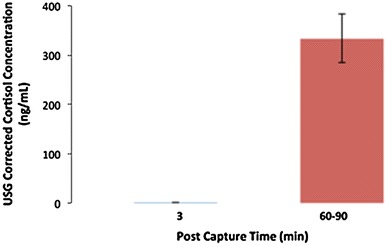
Mean urinary cortisol concentration (USG corrected) ± SEM of P. alecto (n = 8) at 3 min and 60–90 min collection post-capture.
Figure 5.
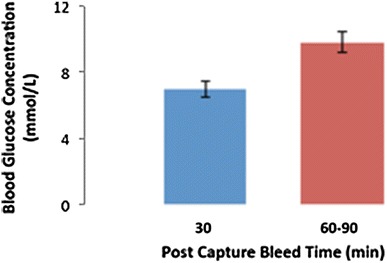
Mean blood glucose concentration ± SEM of P. alecto (n = 11) at 3 min and 60–90 min bleed post-capture.
Cortisol Measurements in Pooled Species Population Urine Samples
Population-level urinary cortisol ranges and geometric means are presented in Table 4 and Fig. 6. P. alecto, P. conspicillatus and P. poliocephalus showed similar ranges of cortisol measurements, whilst P. scapulatus showed a narrower range. P. alecto and P. conspicillatus urinary cortisol geometric mean measurements are not significantly different from each other (ANOVA Tukey, P = 0.716 at 95% CI), however, P. poliocephalus showed significantly different and lower urinary cortisol geometric mean measurements than all other species, and P. scapulatus showed significantly higher urinary cortisol geometric mean measurements than all other species (ANOVA Tukey, P < 0.0001 at 95% CI).
Table 4.
Pooled population urinary cortisol concentration ranges and geometric means for Australian Pteropus species
| Species | Min–Max cortisol ng/ml | Range | Geometric mean | 95% CI |
|---|---|---|---|---|
| P. alecto (n = 292) | 0.5–305.1 | 304.6 | 20.1 | 6.8–59.4 |
| P. poliocephalus (n = 201) | 0.3–311.3 | 311.0 | 10.1 | 2.6–38.6 |
| P. scapulatus (n = 172) | 5.2–205.4 | 200.2 | 40.7 | 22.2–74.6 |
| P. conspicillatus (n = 245) | 0.3–370.9 | 370.6 | 18.9 | 4.5–80.0 |
Figure 6.
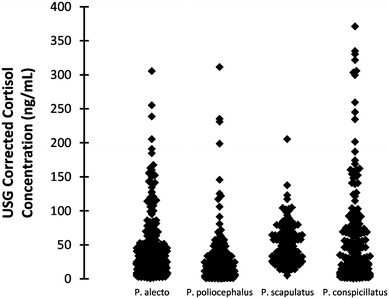
Distribution of pooled population urinary cortisol concentrations (USG corrected) of Australian Pteropus species.
Discussion
Studies of glucocorticoid hormone dynamics and physiological stress in free-living wildlife have been limited, with few studies in free-living flying-foxes. Our study presents a novel and methodologically robust approach for flying-foxes that includes collecting urine from beneath roosting bats, accurately measuring urinary cortisol, correcting measurements for urine concentration, and confidently interpreting elevated levels. Urine samples were consistently collected at dawn, expected to be at the low point of glucocorticoid production in the diurnal phase of the circadian rhythm of flying-foxes, as shown by Widmaier and Kunz (1993).
The significant increase in plasma cortisol levels that we detected 60–90 min post-capture indicates a typical capture stress response, and establishes that the assay is effectively measuring cortisol (Fig. 3). The elevated values that we detected are similar to those reported by Reeder et al. (2006) in the Malayan flying-fox (Pteropus vampyrus). Blood glucose also increased showing the typical physiological gluconeogenesis response to stress (Fig. 5). Urinary cortisol increase, demonstrated in other species to have a greater lag time than plasma cortisol increase, was also detectable 60–90 min post-capture (Fig. 4), thus validating the assay’s ability to detect a physiological response to stress in both plasma and urine.
In the course of the study, we found that the USG of the pooled urine samples varied substantially with season and roost site, as well as between individuals and species. This variation is not unexpected, and is likely due to physiological differences between individuals, species and times of urine collection, the latter plausibly reflecting available food and water resources at that time. In addition, the pooled nature of the samples means that each sample potentially contains urine from multiple bats of various physiological and nutritional status. However, for valid comparison and interpretation, it is essential to ensure that hormone concentrations are corrected for concentration of urine. This has typically been done by correcting measured cortisol concentration based on urinary creatinine concentration, which is constant in urine. Miller et al. (2004) used USG to measure urine concentration and found it as reliable as creatinine in human populations. We trialled both approaches and found little difference between the two methods. Thus, we chose to use USG to correct urinary cortisol measurements, because it was a simpler, faster and more cost efficient method.
Our inclusion in the study of all four species of flying-foxes on mainland Australia allowed us to describe the measured urinary cortisol range and geometric mean for each species (Table 4). P. alecto, P. conspicillatus and P. poliocephalus showed similar range, with P. alecto and P. conspicillatus having very similar geometric mean values and P. poliocephalus having a comparatively lower geometric mean value. P. scapulatus showed a narrower urinary cortisol range than the other species, but higher geometric mean values. These statistics provide an insight into urinary cortisol variability between species, as well as within species, and fill a significant knowledge gap, both for ecological studies and for captive population health management. However, the data should be regarded as indicative of, rather than defining, actual population parameters, given they are derived from pooled samples containing variable volumes of urine from individual bats of variable physiological characteristics. We propose to further investigate species differences in cortisol levels, and any relationship with physiological and general health parameters.
Analytical validations of the cortisol EIA demonstrated parallelism and high levels of accuracy, the latter demonstrated by the linearity between dilutions of cortisol standards in buffer compared with dilutions of the standards in the urine and plasma matrix, and acceptable recovery of cortisol standards from urine and plasma matrix. As these validations demonstrated no interfering effect of the plasma or urine matrix on the assay at the dilutions employed in this study, it was not necessary to purify either urine or plasma samples for assay in order to perform the physiological validation.
We contemplated ACTH challenge and dexamethasone suppression tests, because they are useful in demonstrating a cortisol response, and provide further physiological validation that the assay does indeed measure a cortisol response. However, these tests would have required injection into the pectoral (flight) muscles and holding the animals for longer periods of time, both of which we deemed unacceptable in free-living wild flying-foxes on ethical and welfare grounds.
Finally, the manufacturers of the EIA report potential cross-reactivity up to 4% with other steroid hormones, suggesting it might be appropriate to assess the cortisol specificity of the assay in flying-foxes. However, when the synthetic glucocorticoid prednisolone is excluded (free-living wild flying-foxes have no opportunity to exposure to prednisolone), reported potential cross-reactivity drops to a maximum 1.6%. This, in addition to our physiological validation in flying-foxes (which showed the assay was detecting a stress response), argued against the need to further elaborate specificity in flying-foxes.
The genesis of this study was the need to quantitatively measure stress in flying-fox populations to underpin investigation of a putative association between environmental stress and Hendra virus infection dynamics (Edson et al. 2014, in preparation). The approach has equal application to other species and scenarios where the aim is to directly assess the impact of stress on a population-level outcome variable, as qualitative assessments of the latter are often confounded by anthropogenic interpretations of ‘stress’. The approach also provides a means to explore underlying seasonal trends in population cortisol levels. Measuring chronic stress poses additional challenges, and with compounding ecological pressures on many natural systems, robust methodological approaches that facilitate investigation of the occurrence, impact and consequences of chronic stress scenarios on wildlife populations are also needed, and are a focus of our current research.
Conclusion
Our study has developed and demonstrated a robust approach to the measurement and interpretation of pooled population urinary cortisol values in wild, free-living flying-fox populations. In the process, we have demonstrated a typical post-capture stress response in wild flying-foxes, established population-level urinary cortisol ranges for the four Australian mainland species, and established USG as an attractive alternative to creatinine to correct urine concentration. The approach has direct application as a research or clinical tool for flying-fox populations, but equally importantly, has broader application to other free-living colonial wildlife species. Future research needs to target seasonal variability and chronic stress scenarios.
Acknowledgments
We acknowledge funding from the National Hendra Virus Research Program supported by the Queensland, New South Wales and Australian Governments. We would like to thank the following: Queensland Centre for Emerging Infectious Diseases (QCEID) personnel for assistance in field collections and laboratory analyses, particularly Debra Melville, Alice Broos, Lauren Goldspink and Joanna Kristoffersen; Queensland Department of Environment and Heritage Protection (EHP) officers, particularly Rosie Savoca, John Hueston, Mike Devery, Greg O’Neil, Mary Starkey and Chris Pacey for assistance on flying-fox roost locations, population surveys and field work; University of Queensland (UQ) veterinary students for assistance with field and laboratory work, in particular Kristen Nielsen; University of Kyoto visiting scientist Christian Vincenot for assistance with animal catching; Sydney Royal Botanic Gardens and Domain Trust staff Dr John Martin for assistance in facilitating Sydney field work; Department of Agriculture, Fisheries and Forestry (DAFF) biometrician, David Mayer, for assistance with statistical analysis; and Queensland regional councils in help facilitating field work.
References
- Bennett C, Fripp D, Othen L, Jarsky T, French J, Loskutoff N. Urinary corticosteroid excretion patterns in the okapi (Okapia johnstoni) Zoo Biology. 2008;27:381–393. doi: 10.1002/zoo.20208. [DOI] [PubMed] [Google Scholar]
- Breed AC, Breed MF, Meers J, Field HE. Evidence of endemic Hendra virus infection in flying-foxes (Pteropus conspicillatus)—implications for disease risk management. Plos ONE. 2011;6(12):e28816. doi: 10.1371/journal.pone.0028816. [DOI] [PMC free article] [PubMed] [Google Scholar]
- Calisher CH, Childs JE, Field HE, Holmes KV, Schountz T. Bats: Important reservoir hosts of emerging viruses. Clinical Microbiology Reviews. 2006;19(3):531–545. doi: 10.1128/CMR.00017-06. [DOI] [PMC free article] [PubMed] [Google Scholar]
- Chua KB, Bellini WJ, Rota PA, Harcourt BH, Tamin A, Lam SK, Ksaizek TG, Rollin PE, Zaki SR, Shieh W, Goldsmith CS, Gubler DJ, Roehig JT, Eaton B, Gould AR, Olson J, Field H, Daniels P, Ling AE, Peters CJ, Anderson LJ, Mahy BW. Nipah virus: a recently emergent deadly paramyxovirus. Science. 2000;288(5470):1432–1435. doi: 10.1126/science.288.5470.1432. [DOI] [PubMed] [Google Scholar]
- Field HE (2005) The ecology of Hendra virus and Australian bat lyssavirus. PhD thesis, The University of Queensland, Brisbane
- Field HE, De Jong CE, Melville DF, Smith CS, Smith I, Broos AC, Kung YS, McLaughlin A, Zeddemann A. Hendra virus infection dynamics in Australian Fruit Bats. PLos ONE. 2011;6(12):e28678. doi: 10.1371/journal.pone.0028678. [DOI] [PMC free article] [PubMed] [Google Scholar]
- Ge XY, Li JL, Yang XL, Chmura AA, Zhu GG, Epstein JH, Mazet JK, Hu B, Zhang W, Peng C, Zhang YJ, Luo CM, Tan B, Wang N, Zhu N, Crameri G, Zhang ZY, Wang LF, Daszak P, Shi ZL. Isolation and characterization of a bat SARS-like coronavirus that uses the ACE2 receptor. Nature. 2013;503(7477):535–538. doi: 10.1038/nature12711. [DOI] [PMC free article] [PubMed] [Google Scholar]
- Halpin K, Young PL, Field HE, Mackenzie JS. Isolation of Hendra virus from pteropid bats: a natural reservoir of Hendra virus. Journal of General Virology. 2000;81:1927–1932. doi: 10.1099/0022-1317-81-8-1927. [DOI] [PubMed] [Google Scholar]
- Hogan LA, Lisle AT, Johnston SD, Robertson H. Non-invasive assessment of stress in captive numbats, Myrmecobius fasciatus (Mammalia: Marsupialia), using faecal cortisol measurement. General and Comparative Endocrinology. 2012;179:376–383. doi: 10.1016/j.ygcen.2012.09.020. [DOI] [PubMed] [Google Scholar]
- Jonsson NN, Johnston SD, Field H, De Jong C, Smith C. Field anaesthesia of three Australian species of flying fox. Veterinary Record. 2004;154:664. doi: 10.1136/vr.154.21.664. [DOI] [PubMed] [Google Scholar]
- Li W, Shi K, Yu M, Ren W, Smith C, Epstein JH, Wang H, Crameri G, Hu Z, Zhang H, Zhang J, McEachern J, Field H, Daszak P, Eaton BT, Zhang S, Wang LF. Bats are natural reservoirs of SARS-like coronaviruses. Science. 2005;310(5748):676–679. doi: 10.1126/science.1118391. [DOI] [PubMed] [Google Scholar]
- Miller RC, Brindle E, Holman DJ, Shofer J, Klein NA, Soules MR, O’Connor KA (2004) Comparison of specific gravity and creatinine methods for normalizing urinary reproductive hormone concentrations. Centre for Studies in Demography and Ecology, Working Paper No. 04-02, University of Washington [DOI] [PubMed]
- Murray K, Selleck P, Hooper P, Hyatt A, Gould A, Gleeson L, Westbury H, Hiley L, Selvey L, Rodwell B, Ketterer P. A Morbillivirus that caused fatal disease in horses and humans. Science. 1995;268(5207):94–97. doi: 10.1126/science.7701348. [DOI] [PubMed] [Google Scholar]
- Pearson BL, Kudge PGJ, Reeder DM. Effectiveness of saliva collection and enzyme-immunoassay for the quantification of cortisol in socially housed baboons. American Journal of Primatology. 2008;70:1145–1151. doi: 10.1002/ajp.20613. [DOI] [PubMed] [Google Scholar]
- Plowright RK, Field HE, Smith C, Divljan A, Palmer C, Tabor G, Daszak P, Foley JE. Reproductive and nutritional stress are risk factors for Hendra virus infection in little red flying foxes (Pteropus scapulatus) Proceedings of the Royal Society Biological Sciences. 2008;275(1636):861–869. doi: 10.1098/rspb.2007.1260. [DOI] [PMC free article] [PubMed] [Google Scholar]
- Pourrut X, Souris M, Towner JS, Rollin PE, Nichol ST, et al. Large serological survey showing cocirculation of Ebola and Marburg viruses in Gabonese bat populations, and a high seroprevalence of both viruses in Rousettus aegyptiacus. BMC Infectious Diseases. 2009;9:159. doi: 10.1186/1471-2334-9-159. [DOI] [PMC free article] [PubMed] [Google Scholar]
- Reeder DM, Kosteczko NS, Kunz TH, Widmaier EP. Changes in baseline and stress-induced glucocorticoid levels during the active period in free-ranging males and female little brown myotis, Myotis lucifugus (Chiroptera: Vespertilionidae) General and Comparative Endocrinology. 2004;136:260–269. doi: 10.1016/j.ygcen.2003.12.020. [DOI] [PubMed] [Google Scholar]
- Reeder DM, Kosteczko NS, Kunz TH, Widmaier EP. The hormonal and behavioural response to group formation, seasonal changes, and restraint stress in the highly social Malayan Flying Fox (Pteropus vampyrus) and the less social Little golden-mantled flying fox (Pteropus pumilus) (Chiroptera: Pteropodidae) Hormones and Behaviour. 2006;49:484–500. doi: 10.1016/j.yhbeh.2005.11.001. [DOI] [PubMed] [Google Scholar]
- Reeder DM, Kramer KM. Stress in free-ranging mammals: integrating physiology, ecology, and natural history. Journal Mammal. 2005;86:225–235. doi: 10.1644/BHE-003.1. [DOI] [Google Scholar]
- Reeder DM, Kunz TH, Widmaier EP. Baseline and stress-induced glucocorticoids during reproduction in the variable flying fox, Pteropus hypomelanus (Chiroptera: Pteropodidae) Journal of Experimental Zoology. 2004;301A:682–690. doi: 10.1002/jez.a.58. [DOI] [PubMed] [Google Scholar]
- Sapolsky RM, Romero LM, Munck AU. How do glucocorticoids influence stress responses? Integrating permissive, suppressive, stimulatory and preparative actions. Endocrinology Review. 2000;21:55–89. doi: 10.1210/edrv.21.1.0389. [DOI] [PubMed] [Google Scholar]
- Widmaier EP, Harmer TL, Sulak AM, Kunz TH. Further characterization of the pituitary-adrenocortical responses to stress in Chiroptera. Journal of Experimental Zoology. 1994;269:442–449. doi: 10.1002/jez.1402690507. [DOI] [PubMed] [Google Scholar]
- Widmaier EP, Kunz TH. Basal, diurnal, and stress-induced levels of glucose and glucocorticoids in captive bats. Journal of Experimental Zoology. 1993;265:533–540. doi: 10.1002/jez.1402650509. [DOI] [PubMed] [Google Scholar]
- Woodruff JA, Lacey EA, Bentley S. Contrasting fecal corticosterone metabolite levels in captive and free-living colonial tuco-tucos (Ctenomys sociabilis) Journal of Experimental Zoology. 2010;313A:498–507. doi: 10.1002/jez.621. [DOI] [PubMed] [Google Scholar]


