

Abstract
Sleep is a nearly universal behavior that is regulated by diverse environmental stimuli and physiological states. A defining feature of sleep is a homeostatic rebound following deprivation, where animals compensate for lost sleep by increasing sleep duration and/or sleep depth. The fruit fly, Drosophila melanogaster, exhibits robust recovery sleep following deprivation and represents a powerful model to study neural circuits regulating sleep homeostasis. Numerous neuronal populations have been identified in modulating sleep homeostasis as well as depth, raising the possibility that the duration and quality of recovery sleep is dependent on the environmental or physiological processes that induce sleep deprivation. Here, we find that unlike most pharmacological and environmental manipulations commonly used to restrict sleep, starvation potently induces sleep loss without a subsequent rebound in sleep duration or depth. Both starvation and a sucrose-only diet result in increased sleep depth, suggesting that dietary protein is essential for normal sleep depth and homeostasis. Finally, we find that Drosophila insulin like peptide 2 (Dilp2) is acutely required for starvation-induced changes in sleep depth without regulating the duration of sleep. Flies lacking Dilp2 exhibit a compensatory sleep rebound following starvation-induced sleep deprivation, suggesting Dilp2 promotes resiliency to sleep loss. Together, these findings reveal innate resilience to starvation-induced sleep loss and identify distinct mechanisms that underlie starvation-induced changes in sleep duration and depth.
Author summary
Sleep is nearly universal throughout the animal kingdom and homeostatic regulation represents a defining feature of sleep, where animals compensate for lost sleep by increasing sleep over subsequent time periods. Despite the robustness of this feature, the neural mechanisms regulating recovery from different types of sleep deprivation are not fully understood. Fruit flies provide a powerful model for investigating the genetic regulation of sleep, and like mammals, display robust recovery sleep following deprivation. Here, we find that unlike most stimuli that suppress sleep, sleep deprivation by starvation does not require a homeostatic rebound. These findings are likely due to flies engaging in deeper sleep during the period of partial sleep deprivation, suggesting a natural resilience to starvation-induced sleep loss. This unique resilience to starvation-induced sleep loss is dependent on Drosophila insulin-like peptide 2, revealing a critical role for insulin signaling in regulating interactions between diet and sleep homeostasis.
Introduction
Sleep is a near universal behavior that is modulated in accordance with physiological state and environmental stimuli [1–3]. Numerous environmental factors can alter sleep, including daily changes in light and temperature, stress, social interactions, and nutrient availability [4,5]. A central factor defining sleep is that a homeostat detects sleep loss and then compensates by increasing sleep duration and/or depth during recovery [6,7]. However, recent findings suggest that the need for recovery sleep varies depending on the neural circuits driving sleep loss [8,9]. An understanding of how different forms of sleep restriction impact sleep quality and homeostasis may offer insights into the integration of an organism’s environment with sleep drive.
Food restriction represents an ecologically-relevant perturbation that impacts sleep. In animals ranging from flies to mammals, sleep is disrupted during times of food restriction, presumably to allow for increased time to forage [10,11]. While the mechanisms underlying sleep-metabolism interactions are unclear, numerous genes have been identified that integrate these processes [12,13]. Further, neurons involved in sleep or wakefulness have been identified in flies and mammals that are glucose sensitive, raising the possibility that cell-autonomous nutrient sensing is critical to sleep regulation [14–16]. Despite these highly conserved interactions between sleep and metabolic regulation, little is known about the effects of starvation on sleep quality and homeostatically regulated recovery sleep when food is restored.
Fruit flies are a powerful model to study the molecular basis of sleep regulation [17,18]. Recently, significant progress has been made in identifying neural and cellular processes associated with detecting sleep debt and inducing recovery sleep [8,9,19–21]. However, a central question is how different genetic, pharmacological, and environmental manipulations impact sleep quality and homeostasis. Flies potently suppress their sleep when starved, and although the duration of starvation varies among studies, at least some evidence suggests they are resilient to this form of sleep loss [11,22,23]. Therefore, it is possible that starvation-induced sleep restriction is governed by neural processes that are distinct from other manipulations that restrict sleep.
Sleep quality is dependent on both sleep duration and sleep depth. The recent development of standardized methodology to measure sleep depth in Drosophila allows for investigating the physiological effects of sleep loss [24–26]. Mechanically depriving flies of sleep results in increased sleep duration and depth the following day, but the effects of other deprivation methods on sleep depth is largely unknown [24,26]. Applying these new approaches to quantify sleep during and following periods of starvation has potential to identify the mechanistic differences underlying resiliency to starvation-induced sleep loss.
Here, we find that starvation impairs sleep without inducing a homeostatic rebound, and that this is likely due to increased sleep depth during the period of food restriction. This phenotype can also be induced by feeding flies a diet lacking in amino acids, suggesting a role for dietary protein in maintaining normal sleep quality. Further, this resilience to starvation-induced sleep loss is dependent on Drosophila insulin-like peptide 2. Overall, these findings highlight the role of insulin signaling in regulating the interaction between diet and sleep depth.
Results
To determine how different forms of sleep deprivation impact sleep depth and homeostatic recovery, we measured sleep and arousal threshold by video-tracking in the Drosophila ARousal Tracking (DART) system (Fig 1A; [25]). This system probes sleep depth by quantifying the responsiveness of sleeping flies to increasing intensities of mechanical stimuli (Fig 1A, representative stimulus train displayed on computer screen). After 24 hours of baseline sleep measurements in undisturbed female control (w1118) flies, we restricted flies of sleep for 24 hours by caffeine feeding, administration of mechanical stimuli, or through starvation. The sleep- restricting stimulus was then removed at ZT0 the following day to measure rebound sleep duration and arousal threshold during recovery (Fig 1B). As expected, sleep restricting flies through the feeding of caffeine-laced food or mechanical stimulation resulted in a homeostatic rebound where sleep was increased during the 12 hr period following sleep deprivation (Fig 1C–1E). The timing of recovery sleep differed between the two deprivation protocols, with mechanical sleep disruption resulting in significant recovery as early as the first three hours following deprivation, while recovery sleep was only detected over the 12 hr period following caffeine feeding (Fig 1C and 1E). Both caffeine and mechanical sleep deprivation also resulted in increased arousal threshold during rebound, indicating deeper sleep (Fig 1D and 1F, right panels). To ensure that this increase in arousal threshold during recovery was not a result of habituation to the mechanical stimulus over the duration of the experiment, we measured arousal threshold on standard food over a 3-day period. We found no effect of time on sleep duration or arousal threshold (S1 Fig), suggesting that this increase in arousal threshold during rebound results from sleep restriction rather than habituation to the mechanical stimulus. Conversely, starved flies did not exhibit rebound sleep or increased arousal threshold during recovery (Fig 1G and 1H), although there is a trend towards a rebound in sleep duration during the first 3 hours of recovery. Together, these findings suggest starvation restricts sleep without inducing a homeostatic increase in sleep duration or depth during rebound.
Fig 1. Homeostatic rebound following sleep deprivation is treatment dependent.

(A) The Drosophila Arousal Tracking (DART) system records fly movement while simultaneously controlling mechanical stimuli via a digital analog converter (DAC). Here, mechanical stimuli are delivered to three platforms, each housing twenty flies. Mechanical stimuli of increasing strength were used to assess arousal threshold (shown on the computer screen). Arousal thresholds were determined hourly, starting at ZT0 [25]. (B) Total sleep and arousal threshold were assessed for 24 hrs on standard food (Control). Flies were then sleep deprived (Sleep Dep) for 24hrs using one of three treatments: 0.5mg/mL caffeine, mechanical vibration, or starvation, after which homeostatic rebound (Recovery) was assessed in the subsequent 12 hrs. Comparisons were made between the first 12 hrs of the control day (white box) and the homeostatic rebound (blue box). (C-H) Daytime sleep and arousal thresholds prior to and after 24 hrs of sleep deprivation. Profiles of sleep and arousal threshold are shown prior to the quantification of each trait. Measurements of homeostatic rebound were assessed in 3-, 6-, and 12-hr increments. (C,D) Sleep (C) and arousal threshold (D) significantly increases after 24hrs on standard food media containing 0.5mg/mL caffeine (Sleep: two-way ANOVA: F1,228 = 16.76, P<0.0001; Arousal threshold: REML: F1,76 = 5.691, P = 0.0205; N = 38–40). (E,F) Sleep (E) and arousal threshold (F) significantly increases after 24hrs of randomized mechanical vibration (Sleep: two-way ANOVA: F1,234 = 35.11, P<0.0001; Arousal threshold: REML: F1,78 = 63.07, P<0.0001; N = 40). (G,H) There is no difference in sleep (G) or arousal threshold (H) after 24hrs of starvation (Sleep: two-way ANOVA: F1,210 = 3.272, P = 0.0800; Arousal threshold: REML: F1,70 = 0.0251, P = 0.8746; N = 36). For profiles, shaded regions indicate +/- standard error from the mean. White background indicates daytime, while gray background indicates nighttime. For sleep measurements, error bars represent +/- standard error from the mean. For arousal threshold measurements, the median (dashed line) as well as 25th and 75th percentiles (dotted lines) are shown. * = P<0.05; ** = P<0.01; *** = P<0.001; **** = P<0.0001.
To examine the effects of starvation-induced sleep restriction on sleep quality, we probed arousal threshold throughout the 24-hour starvation period (Fig 2A). Starvation significantly reduced sleep during both the day and night compared to flies maintained on standard fly food (Fig 2B–2C). Daytime arousal threshold did not differ between fed and starved flies; yet nighttime arousal threshold was significantly increased in starved flies (Fig 2D–2E). Quantifying reactivity to the mechanical stimulus as a function of individual sleep bout length revealed that arousal threshold was significantly higher in starved flies shortly after they enter sleep, suggesting starved flies are quicker to enter deeper sleep (Fig 2F). In addition, the increase in nighttime arousal threshold is specific to starvation, as there was no increase in nighttime arousal threshold when flies were sleep deprived using caffeine feeding or mechanical vibration (2G-J). Together, these findings suggest flies compensate for starvation-induced sleep loss by increasing sleep depth during the night.
Fig 2. Starvation increases arousal threshold.

(A) Total sleep and arousal threshold were assessed for 24 hrs on standard food (Control) and then starved for 24 hrs on agar (Sleep Dep). Flies were flipped to agar at ZT0. (B) Sleep profiles of fed and starved flies. (C) Sleep duration decreases in the starved state (two-way ANOVA: F1,220 = 54.63, P<0.0001), and occurs in both the day (P<0.0001) and night (P<0.0001). (D) Profile of arousal threshold of fed and starved flies. (E) Arousal threshold significantly increases in the starved state (REML: F1,110 = 34.68, P<0.0001), and occurs only at night (day: P = 0.2210; night: P<0.0001). (F) Sleep depth is not correlated with sleep duration in starved flies. The proportion of flies that reacted to a mechanical stimulus for each bin of immobility was assessed. Starved flies are significantly less likely to respond to a mechanical stimulus during sleep (ANOVA: F1,1230 = 68.47, P<0.0001), specifically when flies have been sleeping for less than 30 min (6–10 min: P<0.0001; 11–15 min: P = 0.0002; 16–20 min: P<0.0001; 21–25 min: P = 0.0094; 26–30 min: P = 0.0538). Numbers within each bar represent the frequency of individuals for each bin of immobility. All measurements were taken at night. (G-J) Sleep and arousal threshold measurements were taken over a 24 hr period from flies on standard food media or 1% agar. Flies were flipped to agar at ZT12. (G) Sleep profiles of fed and starved flies. (H) Sleep duration decreases in the starved state (two-way ANOVA: F1,172 = 32.22, P<0.0001), but occurs only during the day (day: P<0.0001; night: P = 0.2036). (I) Profile of arousal threshold of fed and starved flies. (J) Arousal threshold significantly increases in the starved state (REML: F1,74 = 9.248, P<0.0027) and occurs only during the day (day: P<0.0001; night: P = 0.0960). (K-N) Unlike starvation, other methods of sleep deprivation do not increase nighttime arousal threshold. Flies were sleep deprived for 24 hrs using either mechanical vibration or 0.5mg/mL caffeine. (K) Sleep profile. (L) Relative to control, sleep duration significantly decreases for each method of sleep deprivation (two-way ANOVA: F1,234 = 21.58, P<0.0001), and occurs only at night (P<0.0001). (M) Profile of arousal threshold. (N) Arousal threshold remains unchanged when using each of the described methods of sleep deprivation (REML: F1,72 = 0.2563, P = 0.6142, N = 38). Arousal threshold via mechanical vibration was unable to be calculated since the mechanical vibration used to assess arousal threshold was being used to implement sleep deprivation. For profiles, shaded regions indicate +/- standard error from the mean. White background indicates daytime, while gray background indicates nighttime. For sleep measurements, error bars represent +/- standard error from the mean. For arousal threshold measurements, the median (dashed line) as well as 25th and 75th percentiles (dotted lines) are shown. ** = P<0.01; *** = P<0.001; **** = P<0.0001.
To assess how sleep architecture is affected by these methods of sleep deprivation, we measured sleep using Drosophila activity monitors (DAM; [27]). Similar to our results obtained in the DART, we found that sleep is significantly reduced when flies are starved, mechanically shaken, and when fed caffeine. When flies are fed caffeine, the number of bouts remain unchanged, but their length significantly decreases (S2A–S2E Fig). When flies are mechanically sleep deprived, both bout number and length are significantly reduced (S2F–S2H Fig). Lastly, starvation-induced sleep suppression results from a significant decrease in bout number, but not bout length (S2I–S2K Fig). Given that deeper sleep states are correlated with longer sleep bouts [24,25,28], these findings provide additional support for our findings that sleep depth increases during starvation.
Sleep duration and resistance to starvation are sexually dimorphic and vary based on genetic background [29–32]. To determine whether the starvation-dependent changes in sleep depth are generalizable across sexes, we measured arousal threshold in starved male control (w1118) flies. We found that starvation results in reduced sleep duration and increased nighttime arousal threshold, phenocopying our results in females (S3A–S3D Fig). To determine if the effects on arousal threshold generalize to other laboratory strains, we measured starvation-dependent changes in sleep depth in Canton-S females [33]. Again, we found that sleep is reduced and arousal threshold is increased in starved Canton-S flies (S3E–S3H Fig). Therefore, the increase in sleep depth during starvation is generalizable across sex and D. melanogaster strains.
It is possible that the increase in sleep depth during the night in starved flies is due to either the duration of starvation or circadian regulation. To differentiate between these possibilities, we shifted the time of starvation to the onset of lights off. In these flies, there was a small reduction in nighttime sleep and a robust decrease in daytime sleep (Fig 2K and 2L). We found that sleep depth did not differ during the night (0–12 hrs of starvation), but was significantly increased in starved flies during the day (12–24 hrs of starvation; Fig 2M and 2N). Therefore, the increase in sleep depth observed in starved flies is induced by the duration of food restriction, rather than the phase of the light cycle.
To determine whether longer periods of starvation induce recovery sleep, we extended starvation for 36 hours beginning at ZT12 (onset of lights off; Fig 3A), resulting in over 500 minutes of total sleep loss (Fig 3B and 3C). Arousal threshold was elevated from hours 12–24 and 24–36 following starvation, suggesting sleep depth is increased, even under severe starvation conditions (Fig 3D and 3E). Despite the robust loss in sleep, no change in sleep duration or arousal threshold was detected when flies were returned to food (Fig 3F and 3G). Therefore, flies do not exhibit a homeostatic rebound following prolonged periods of starvation, even though it results in significant cumulative sleep loss.
Fig 3. The absence of a homeostatic rebound following starvation is independent of starvation duration.

(A) Total sleep and arousal threshold were assessed for 24 hrs on standard food (Control), for a subsequent 36 hrs on agar (Starvation), and then when transferred back to standard food to assess homeostatic rebound (Recovery). Flies were flipped to agar at ZT12. (B) Sleep profile. (C) Sleep duration decreases in the starved state (two-way ANOVA: F4,284 = 20.44, P<0.0001). Post hoc analyses revealed that this occurs after 12hr of starvation and is maintained over time (0–12: P = 0.5706; 12–24: P = 0.0499; 24–36: P<0.0001). (D) Profile of arousal threshold. (E) Arousal threshold significantly increases in the starved state (Kruskal-Wallis test: H = 29.72, P<0.0001; N = 57–59). Post hoc analyses revealed that this occurs after 12hr of starvation and is maintained over time (0–12: P>0.9999; 12–24: P = 0.0006; 24–36: P = 0.0003). (F-G) There is no homeostatic rebound following 36 hrs of starvation. Homeostatic rebound was measured as described in Fig 1B and was assessed in 3-, 6-, and 12-hr increments. (F) There is no difference in sleep duration (two-way ANOVA: F1,336 = 3.451, P = 0.0641). (G) There is no difference in arousal threshold (REML: F1,108 = 3.276, P = 0.0731, N = 55–59). For profiles, shaded regions indicate +/- standard error from the mean. White background indicates daytime, while gray background indicates nighttime. Error bars represent +/- standard error from the mean. For arousal threshold measurements, the median (dashed line) as well as 25th and 75th percentiles (dotted lines) are shown. *** = P<0.001.
Recent work suggests energy metabolism is a critical regulator of sleep homeostasis [34], but the contributions of dietary composition to sleep homeostasis remains poorly understood. Fly food is comprised primarily of sugars and protein, with yeast providing the primary protein source [35,36]. To determine the effects of different dietary macronutrients on sleep regulation, we varied the concentration of sugar and yeast and measured the effects on sleep duration and depth. Flies were fed a diet consisting of 2% yeast alone, 2% yeast and 5% sugar, or 5% sugar alone (Fig 4A). When compared to standard food, sleep duration did not differ between any of the diets, consistent with the notion that sufficiency of total caloric content, rather than the presence of specific macronutrients, regulates sleep duration (Fig 4B and 4C; [11]). Quantification of arousal threshold revealed increased nighttime sleep depth in flies fed a sucrose-only diet, but not in flies fed yeast and sucrose, or yeast alone (Fig 4D and 4E). Given that flies increase arousal threshold on a sucrose-only diet, we next assessed whether this would have any effect during recovery. We found no change in sleep duration or arousal threshold in the subsequent 12 hours after sucrose-only feeding (Fig 4F and 4G). This suggests that even though flies fed a sucrose-only diet sleep more deeply, there is no effect on sleep duration or depth during later time periods. To specifically examine the contribution of amino acids to the regulation of arousal threshold, we supplemented sugar with a cocktail of amino acids using a previously described protocol [37]. In agreement with previous findings, sleep duration did not differ in flies fed standard food, sucrose, or sucrose and amino acids (Fig 4H and 4I). The addition of amino acids to a sucrose-only diet restored nighttime arousal threshold to the level of flies fed standard food (Fig 4J and 4K). These findings suggest the absence of dietary amino acids increases sleep depth without affecting sleep duration.
Fig 4. The absence of dietary protein increases sleep depth.

(A) Sleep and arousal threshold measurements were taken over a 24 hr period from flies fed standard food media, 2% yeast, 2% yeast and 5% sucrose, 5% sucrose, or 5% sucrose and 2.5x amino acids. Comparisons were then made between flies fed standard food media and each of the subsequent diets. (B) Sleep profile. (C) Diet does not affect sleep duration (two-way ANOVA: F1,396 = 0.3886, P = 0.7612). (D) Arousal threshold profile. (E) Diet does affect nighttime sleep depth (REML: F3,183 = 11.70, P<0.0001, N = 46–53). Post hoc analyses revealed a significant increase in nighttime arousal threshold when flies are fed 5% sucrose, compared to standard food (day: P>0.9999; night: P<0.0001). (F-G) There is no homeostatic rebound following 24 hrs of sucrose feeding. Homeostatic rebound was measured as described in Fig 1B and was assessed in 3-, 6-, and 12-hr increments. (F) There is no difference in sleep duration (two-way ANOVA: F1,312 = 0.0344, P = 0.8530). (G) There is no difference in arousal threshold (REML: F1,88 = 2.738, P = 0.1005, N = 46–53). (H-K) Adding amino acids to sucrose restores sleep depth. (H) Sleep profile. (I) Again, diet does not affect sleep duration (two-way ANOVA: F2,140 = 0.0193, P = 0.9808). (J) Arousal threshold profile. (K) Diet does affect arousal threshold (REML: F2,180 = 11.98, P<0.0001, N = 20–33). Post hoc analyses revealed a significant increase in nighttime arousal threshold when flies are fed 5% sucrose, compared to standard food (day: P = 0.1206; night: P<0.0001) and when sucrose is supplemented with amino acids (day: P = 0.1362; night: P<0.0001). For profiles, shaded regions indicate +/- standard error from the mean. White background indicates daytime, while gray background indicates nighttime. Error bars represent +/- standard error from the mean. For arousal threshold measurements, the median (dashed line) as well as 25th and 75th percentiles (dotted lines) are shown. *** = P<0.001.
To determine whether the effects of starvation can be recapitulated by inhibition of glycolysis, and thereby preventing cellular utilization of sugars and numerous dietary amino acids, we pharmacologically starved flies by feeding them standard fly food laced with the glycolysis inhibitor 2-deoxyglucose (2DG; Fig 5A; [38,39]). In agreement with our previous findings [39], flies fed 2DG slept less than those housed on standard food (Fig 5B and 5C). Further, this decrease in sleep duration was accompanied by an increase in arousal threshold (Fig 5D and 5E), largely phenocopying starved flies. Further, there was no rebound in sleep duration or arousal threshold when 2DG-treated flies were placed back on standard food (Fig 5F and 5G), suggesting the elevated arousal threshold induced by 2DG is protective against sleep debt. Together, these findings suggest that the changes in sleep duration and arousal threshold in starved flies is a result of metabolic deprivation.
Fig 5. Inhibition of glycolysis phenocopies the yeast-dependent modulation of arousal threshold.
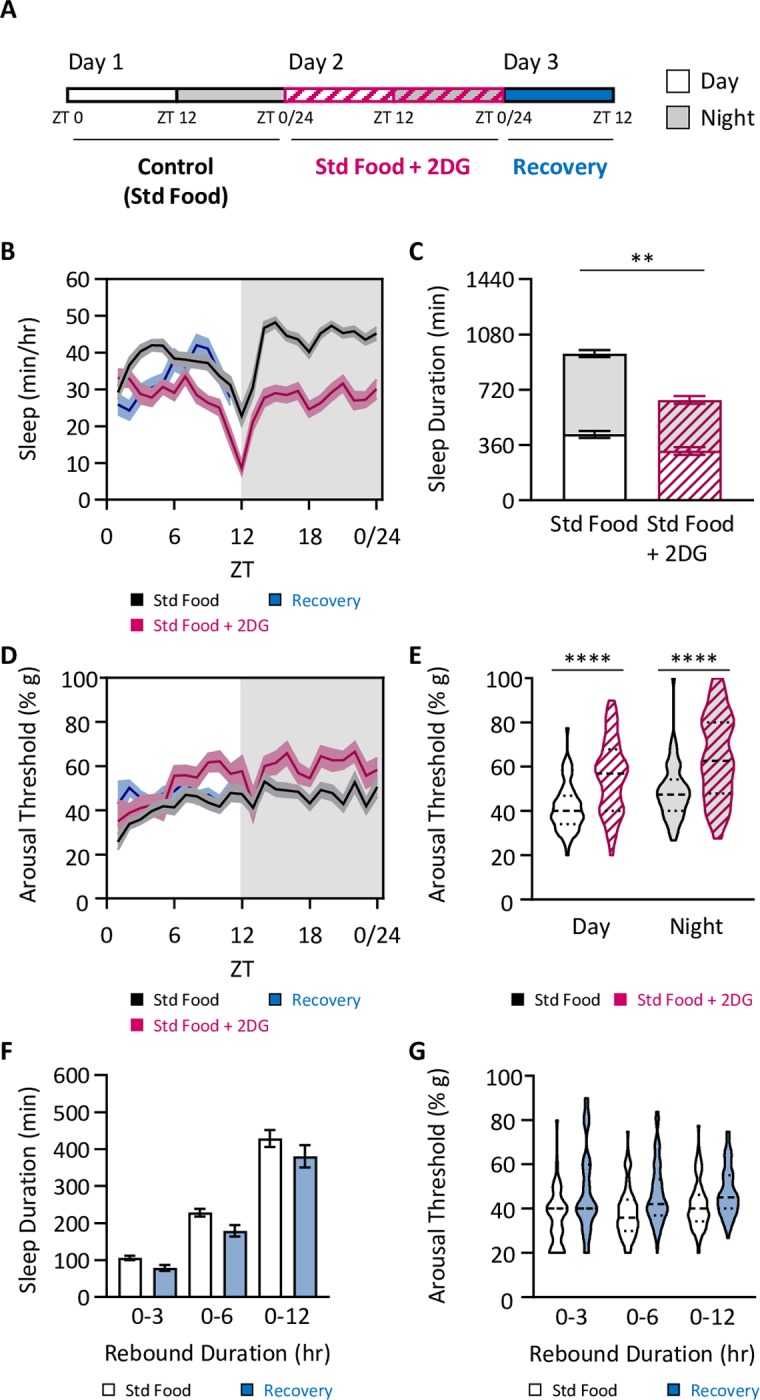
(A) Total sleep and arousal threshold were assessed for 24 hrs on standard food (black outlined boxes), standard food + 2-deoxyglucose (2DG; pink outlined boxes with hatches), and then when transferred back to standard food. (B) Sleep profiles. (C) Sleep duration decreases when 2DG is included in the diet (two-way ANOVA: F1,190 = 38.77, P<0.0001), and occurs during both the day (P = 0.0040) and night (P<0.0001). (D) Profile of arousal threshold. (E) Arousal threshold significantly increases when 2-DG is included in the diet (REML: F1,111 = 71.07, P<0.0001, N = 46–51), and occurs during both the day (P<0.0001) and night (P<0.0001). (F-G) Measurements of homeostatic rebound following 24 hrs of 2DG feeding were assessed in 3-, 6-, and 12-hr increments. (F) Although there is a significant effect of treatment on sleep duration (two-way ANOVA: F1,285 = 7.943, P = 0.0052), post hoc analyses revealed no evidence of a homeostatic rebound for any timepoint measured (0–3 hrs: P = 0.6399; 0–6 hrs: P = 0.1582; 0–12 hrs: P = 0.1661). (G) Although there is a significant effect of treatment arousal threshold (REML: F1,121 = 5.426, P<0.0231, N = 46–51), post hoc analyses revealed no evidence of a homeostatic rebound for any timepoint measured (0–3 hrs: P = 0.3274; 0–6 hrs: P = 0.0822; 0–12 hrs: P = 0.4670). For profiles, shaded regions indicate +/- standard error from the mean. White background indicates daytime, while gray background indicates nighttime. For sleep measurements, error bars represent +/- standard error from mean. For arousal threshold measurements, the median (dashed line) as well as 25th and 75th percentiles (dotted lines) are shown. ** = P<0.01; **** = P<0.0001.
The Drosophila insulin producing cells (IPCs) are critical regulators of sleep and metabolic homeostasis [14,40,41], thereby raising the possibility that these cells regulate starvation-induced changes in sleep, arousal threshold, and metabolic rate. The IPCs express 3 of the 8 Drosophila insulin-like peptides (DILPS; [42,43]) and one of these, DILP2, has been previously implicated in sleep and feeding state [44,45]. To determine the effects Dilp2 on sleep regulation, we measured sleep duration and depth in flies with disrupted Dilp2 function. We first used RNAi targeted to Dilp2 to selectively inhibit function within the IPCs. Immunostaining with Dilp2 antibody confirmed that Dilp2 levels were not detectable in experimental flies (Dilp2-GAL4>UAS-Dilp2RNAi; Fig 6A and 6B). Nighttime sleep duration in flies with RNAi knockdown of Dilp2 did not differ in the fed or starved state compared to its respective control (Figs 6C and S4A). Conversely, nighttime arousal threshold was elevated in starved control flies, but did not differ between fed and starved Dilp2-GAL4>UAS-Dilp2RNAi flies (Fig 6D and 6E), suggesting Dilp2 is required for starvation-dependent changes in arousal threshold. While control flies did not exhibit a rebound following deprivation, Dilp2-GAL4>UAS-Dilp2RNAi flies displayed a significant sleep rebound following starvation, suggesting Dilp2 is required for increased sleep depth during starvation that likely prevents rebound (Fig 6F). No effect on arousal threshold was observed during recovery in the control nor the Dilp2-GAL4>UAS-Dilp2RNAi flies (S4B Fig). To validate that the effects of Dilp2-knockdown are not due to RNAi off-targeting, we assessed the effects of starvation on sleep depth and homeostasis in Dilp2null flies (Fig 6G–6I; [46]). Similar to RNAi knockdown flies, sleep duration was normal in fed and starved Dilp2null flies (Figs 6J and S4C), yet Dilp2null flies did not increase arousal threshold during starvation and displayed a significant rebound in sleep upon re-feeding (Fig 6K–6M). Again, no effect on arousal threshold was observed during recovery in the control nor the Dilp2null flies (S4D Fig). Further, during other manipulations of sleep deprivation, including feeding caffeine, both Dilp2-GAL4>UAS-Dilp2RNAi and Dilp2null flies respond similarly to the control in that they all decrease sleep duration with no change in depth during sleep deprivation, but following sleep deprivation produce a homeostatic rebound in which both sleep duration and depth increase (S5 Fig). Therefore, Dilp2 is required for increasing nighttime sleep depth specifically during starvation, thereby circumventing the need for recovery sleep during the daytime when food is restored.
Fig 6. Dilp2 uniquely regulates arousal threshold during starvation.

Total sleep and arousal threshold were assessed for 24 hrs on standard food. Flies were then sleep deprived by starving them for the following 24hrs. Homeostatic rebound was then assessed during the subsequent 12 hrs. (A,B) Immunohistochemistry using Dilp2 antibody (green). For each image, the brain was counterstained with the neuropil marker nc82 (magenta). Scale bar = 100μm. In comparison with the Dilp2-GAL4>UAS-attp2 control (A), Dilp2 protein is reduced in Dilp2-GAL4>UAS-Dilp2RNAi (B). (C) Compared to the control (Dilp2-GAL4>UAS-attp2), knockdown of Dilp2 in Dilp2-expressing neurons (Dilp2-GAL4>UAS-Dilp2RNAi) has no effect on nighttime sleep duration (two-way ANOVA: F1,146 = 2.164, P = 0.1435), however there is a significant effect of starvation (two-way ANOVA: F1,146 = 26.78, P<0.0001). For each genotype, post hoc analyses revealed a significant decrease in nighttime sleep duration when starved (Dilp2-GAL4>UAS-attp2: P = 0.0008; Dilp2-GAL4>UAS-Dilp2RNAi: P = 0.0002), when compared to standard food. (D) There is a significant effect of genotype on nighttime arousal threshold (REML: F1,76 = 18.22, P<0.0001). Post hoc analyses revealed that while controls significantly increase nighttime arousal threshold during starvation (Dilp2-GAL4>UAS-attp2: P<0.0001), there is no effect of knockdown of Dilp2 in Dilp2-expressing neurons on arousal threshold (Dilp2-GAL4>UAS-Dilp2RNAi: P = 0.4053). (E-F) Measurements of homeostatic rebound following 24 hrs of starvation were assessed in 3-, 6-, and 12-hr increments. (E) There is a significant effect of genotype on sleep duration following 24 hrs of starvation (two-way ANOVA: F1,146 = 8.651, P = 0.0038). Post hoc analyses revealed that in control flies there was no change in sleep duration for any timepoint measured (Dilp2-GAL4>UAS-attp2: 0–3 hrs: P = 0.9849; 0–6 hrs: P = 0.9974; 0–12 hrs: P>0.9999). However, knockdown of Dilp2 in Dilp2-expressing neurons significantly increases rebound sleep between 6 and 12 hrs after rebound onset (Dilp2-GAL4>UAS-Dilp2RNAi: 0–3 hrs: P = 0.4030; 0–6 hrs: P = 0.1725; 0–12 hrs: P = 0.0450). (F) Compared to the control (Dilp2-GAL4>UAS-attp2), knockdown of Dilp2 in Dilp2-expressing neurons (Dilp2-GAL4>UAS-Dilp2RNAi) has no effect on arousal threshold following 24 hrs of starvation (REML: F1,76 = 0.4683, P = 0.4954). (G-I) Immunohistochemistry using DILP2 antibody (green). For each image, the brain was counterstained with the neuropil marker nc82 (magenta). Scale bar = 100μm. In comparison with the w1118 control (H), DILP2 protein is present in heterozygotes (I), while it is absent in Dilp2null mutants (J). (J) In comparison to the control (w1118), there is no effect on nighttime sleep duration in Dilp2null heterozygotes or Dilp2null mutants (two-way ANOVA: F1,231 = 0.1994, P = 0.8194), however there is a significant effect of starvation (two-way ANOVA: F1,231 = 59.11, P<0.0001). For all three genotypes, post hoc analyses revealed a significant decrease in nighttime sleep duration when starved (w1118: P = 0.0002; w1118>Dilp2null: P<0.0001; Dilp2null: P<0.0001). (K) There is a significant effect of genotype on nighttime arousal threshold (REML: F2,117 = 10.03, P<0.0001). Post hoc analyses revealed that while control flies (w1118) and Dilp2null heterozygotes significantly increase nighttime arousal threshold during starvation (w1118: P<0.0001; w1118>Dilp2null: P<0.0001), there is no effect on arousal threshold in Dilp2null mutants (P = 0.9973). (L-M) Measurements of homeostatic rebound following 24 hrs of starvation were assessed in 3-, 6-, and 12-hr increments. (L) There is a significant effect of genotype on sleep duration following 24 hrs of starvation (two-way ANOVA: F1,231 = 3.7810, P = 0.0531). Post hoc analyses revealed no change in sleep duration for any timepoint measured in control flies and Dilp2 heterozygotes (w1118: 0–3 hrs: P = 0.9876; 0–6 hrs: P = 0.9693; 0–12 hrs: P = 0.9108; w1118>Dilp2null: 0–3 hrs: P = 0.8178; 0–6 hrs: P = 0.5672; 0–12 hrs: P = 0.9193), however sleep duration does significantly increase in Dilp2null mutants (Dilp2null: 0–3 hrs: P = 0.7004; 0–6 hrs: P = 0.1719; 0–12 hrs: P = 0.0072). (M) In comparison to the control (w1118), there is no effect on arousal threshold following 24 hrs of starvation in Dilp2null heterozygotes or Dilp2null mutants (REML: F2,117 = 1.420, P = 0.2347). For sleep measurements, error bars represent +/- standard error from the mean. For arousal threshold measurements, the median (dashed line) as well as 25th and 75th percentiles (dotted lines) are shown. * = P<0.05; ** = P<0.01; *** = P<0.001; **** = P<0.0001.
It is possible that Dilp2 functions acutely to increase sleep depth during starvation, or that it is required during development. To differentiate between these possibilities, we utilized Dilp2-Geneswithch (GS) to temporally silence Dilp2 expression in adulthood [47]. We acutely fed RU486 to flies harboring the transgene for inducible GAL4 in Dilp2-expressing neurons (Dilp2-GS-GAL4) as well as UAS-Dilp2RNAi for 24 hours prior to and during experimental manipulations (Fig 7A). We found that sleep duration in Dilp2-GS-GAL4>UAS-Dilp2RNAi flies fed RU486 did not differ in the fed or starved state compared to its respective controls (Figs 7B and S6A). Nighttime arousal threshold was significantly increased in all starved controls, but did not differ between fed and starved Dilp2-GS-GAL4>UAS-Dilp2RNAi flies fed RU486 (Fig 7C and 7D), suggesting Dilp2 is required in adults for starvation-dependent changes in arousal threshold. While control flies did not exhibit a rebound following deprivation, Dilp2-GS-GAL4>UAS-Dilp2RNAi flies fed RU486 displayed a significant sleep rebound following starvation, suggesting Dilp2 is required during adulthood for increased sleep depth during starvation that likely prevents rebound (Fig 7E). No effect on arousal threshold was observed during recovery in any of the manipulations (S6B Fig). Taken together, these findings suggest Dilp2 acts acutely to increase sleep depth during starvation and confers resiliency to starvation-induced sleep deficits.
Fig 7. Dilp2 acutely regulates arousal threshold during starvation in adults.

(A) Silencing of Dilp2 expression was temporally controlled using Dilp2-Geneswitch (GS). Flies were reared to adulthood and aged in the absence of RU486. Then, either solvent alone (-RU486) or RU486 (+RU486) was added to the diet 24 hrs prior to testing in the DART. (B) Total sleep and arousal threshold were assessed for 24 hrs on standard food (Day 1). Flies were then sleep deprived by starving them for the following 24hrs (Day 2). Homeostatic rebound was then assessed during the subsequent 12 hrs (Day 3). (C) There is no effect of genotype on nighttime sleep duration (two-way ANOVA: F3,67 = 0.1975, P = 0.8977), however there is a significant effect of starvation (two-way ANOVA: F1,67 = 74.34, P<0.0001). For each genotype, post hoc analyses revealed a significant decrease in nighttime sleep duration when starved (Dilp2-GS-GAL4>UAS-attp2/-RU486: P = 0.0002; Dilp2-GS-GAL4>UAS-attp2/+RU486: P = 0.0003; Dilp2-GS-GAL4>UAS-Dilp2RNAi/-RU486: P<0.0001; Dilp2-GS-GAL4>UAS-Dilp2RNAi/+RU486: P = 0.006), when compared to standard food. (D) There is a significant effect of genotype on nighttime arousal threshold (REML: F1,77 = 49.98, P<0.0001). Post hoc analyses revealed that while controls significantly increase nighttime arousal threshold during starvation (Dilp2-GS-GAL4>UAS-attp2/-RU486: P<0.0001; Dilp2-GS-GAL4>UAS-attp2/+RU486: P = 0.0025; Dilp2-GS-GAL4>UAS-Dilp2RNAi/-RU486: P = 0.0103), there is no effect of knockdown of Dilp2 in Dilp2-expressing neurons on arousal threshold (Dilp2-GS-GAL4>UAS-Dilp2RNAi/+RU486: P = 0.2989). (E-F) Measurements of homeostatic rebound following 24 hrs of starvation were assessed in 3-, 6-, and 12-hr increments. (E) There is a significant effect of genotype on sleep duration following 24 hrs of starvation (two-way ANOVA: F3,170 = 2.948, P = 0.0344). Post hoc analyses revealed that in the controls, there were no change in sleep duration for any timepoint measured (Dilp2-GS-GAL4>UAS-attp2/-RU486: 0–3 hrs: P = 0.9864; 0–6 hrs: P = 0.9022; 0–12 hrs: P = 0.5590; Dilp2-GS-GAL4>UAS-attp2/+RU486: 0–3 hrs: P = 0.9226; 0–6 hrs: P = 0.7724; 0–12 hrs: P = 0.9710; Dilp2-GS-GAL4>UAS-Dilp2RNAi/-RU486: 0–3 hrs: P = 0.8609; 0–6 hrs: P = 0.9627; 0–12 hrs: P = 0.9939). However, knockdown of Dilp2 in Dilp2-expressing neurons significantly increases rebound sleep between 3 and 12 hrs after rebound onset (Dilp2-GS-GAL4>UAS-Dilp2RNAi/+RU486: 0–3 hrs: P = 0.1174; 0–6 hrs: P = 0.0395; 0–12 hrs: P = 0.0113). (F) Compared to the controls, knockdown of Dilp2 in Dilp2-expressing neurons (Dilp2-GS-GAL4>UAS-Dilp2RNAi/+RU486) has no effect on arousal threshold following 24 hrs of starvation (REML: F3,134 = 1.489, P = 0.2203). For sleep measurements, error bars represent +/- standard error from the mean. For arousal threshold measurements, the median (dashed line) as well as 25th and 75th percentiles (dotted lines) are shown. * = P<0.05; ** = P<0.01; *** = P<0.001; **** = P<0.0001.
Given that sleep depth increases not just during starvation, but also in the absence of yeast, we next tested whether Dilp2 may similarly regulate sleep depth on a sucrose-only diet. We found that, similar to the control, feeding Dilp2-GAL4>UAS-Dilp2RNAi flies a sucrose-only diet has no effect on sleep duration (S7A Fig). However, unlike the control, sleep depth does not increase on a sucrose-only diet in Dilp2-GAL4>UAS-Dilp2RNAi flies (S7B Fig). Additionally, we did not observe any homeostatic rebound in sleep duration or depth in the control or in Dilp2-GAL4>UAS-Dilp2RNAi flies (S7C and S7D Fig), suggesting that a homeostatic rebound, similar to what we observe in these flies after 24 hours of starvation, occurs only after a decrease in both sleep duration and depth. We found similar results in Dilp2null flies (S7E–S7H Fig). Overall, these results suggest that Dilp2 uniquely regulates sleep depth both during starvation and the absence of yeast.
Discussion
Animals ranging from jellyfish to humans display a homeostatic rebound following sleep deprivation [6,48]. Here we describe a functional and molecular mechanism underlying resilience to starvation-induced sleep loss. While it is widely accepted that sleep is a homeostatically regulated process, a number of factors suggest flies may be resilient to starvation-induced changes in sleep. It has previously been reported that starvation does not induce a sleep rebound after 12 hours of starvation [22], and in appetitive conditioning assays starvation is required for memory formation, suggesting flies still form robust memories despite sleep loss [49–51]. Our findings suggest that changes in sleep quality during starvation underlie the reduced need for a rebound. This resiliency to starvation-induced sleep loss may reflect an ethologically relevant adaptation that allows animals to forage through portions of the night without requiring rebound sleep the following day.
A central model suggests the sleep homeostat is functionally distinct from circadian processes and detects an accumulation of sleep pressure [52]. While the cellular basis homeostatic regulation in response to different types of sleep loss remains poorly understood, a large-scale screen identified the anti-microbial peptide nemuri as a sleep-promoting factor that accumulates during periods of prolonged wakefulness [21]. In addition, numerous other genes including the TNF-alpha homolog Eiger, the microRNA mir190SP, and the rhoGTPase Cross-veinless are required for sleep homeostasis [53–55]. Recovery sleep following deprivation involves complex and likely redundant neural circuits [56], raising the possibility that sleep-loss inducing perturbations can differentially impact the homeostat. For example, both the fan-shaped body and ring-neurons that comprise the ellipsoid body, brain regions associated with regulation of sleep, movement, and visual memory, have been implicated in the regulation of sleep homeostasis [8,53,57,58]. In the mushroom body, activity within a subset of sleep-promoting neurons is elevated during sleep deprivation, suggesting this may provide a neural correlate of sleep drive [59]. Further, mounting evidence suggests sleep duration can be differentiated from sleep homeostasis. As such, studies using TrpA1, the heat-activated thermosensor to activate neurons and suppress sleep identified many neuronal populations that suppressed sleep, some of which induced a rebound while others did not [9,60]. Therefore, our findings fortify the notion that different neural processes may modulate sleep homeostasis in accordance with the perturbation that induces sleep loss.
Our findings suggest the perturbation used to deprive flies of sleep is a critical factor in regulating sleep depth and homeostasis. In fruit flies, the vast majority of studies use mechanical shaking to induce sleep deprivation in flies [5,61–63]. This method is highly effective because the timing and duration of sleep loss can be precisely controlled. Here, we find that in addition to mechanical deprivation, sleep loss induced by caffeine feeding also results in sleep rebound. Our finding that flies do not rebound after starvation-induced sleep loss can be extended to other ethologically-relevant perturbations. For example, male flies deprived of sleep by pairing with a receptive female, presumably resulting in sexual excitation, does not induce a sleep rebound when the female is removed [64,65]. Together, these findings raise the possibility that flies may be resilient to some ethologically relevant forms of sleep deprivation and highlight the importance of studying the genetic and neural processes regulating sleep across diverse environmental contexts.
In mammals, sleep stages based on cortical activity are used to measure sleep depth [66]. For example, recovery sleep is marked by increases in slow wave sleep [67]. While orthologous sleep stages have not been identified in fruit flies, behavioral and physiological measurements suggests sleep can differ in intensity [24–26]. For example, sleep periods lasting longer than 15 minutes are associated with an elevated arousal threshold, suggesting that flies are in deeper sleep [24,25]. The finding that nighttime arousal threshold is elevated in starved animals suggests starvation enhances sleep depth. It is also is possible that arousal threshold will differ based on the sensory stimulus used to probe arousal. In agreement with this notion, it has previously been reported that starved flies are more readily aroused by odors, suggesting the olfactory system may be sensitized in starved animals [68]. Therefore, is likely that measuring arousal threshold using other sensory stimuli, including light, smell, or taste, may differentially impact arousal threshold.
While many studies have examined the interactions between sleep and feeding, these have typically compared fed and starved animals without examining the effects of specific dietary components on sleep regulation [11,69–71]. In Drosophila, feeding of a sugar only diet is sufficient for normal sleep duration [11], and evidence suggests that activation of sweet taste-receptors alone is sufficient to promote sleep [68,72]. While our group and others have interpreted this to suggest that dietary sugar alone is sufficient for ‘normal sleep’, these findings indicate that sleep quality may differ in flies fed a sugar only-diet, and that this has impacts on sleep architecture and homeostasis.
The IPCs have long been proposed as critical integrators of behavior and metabolic function [14,40,44,73]. Our results raise the possibility that Dilp2-expressing neurons become active on diets deficient in amino acids. The application of genetically encoded Ca2+ sensors that can be measured in freely moving animals, such as CaMPARI and TRIC, provide the opportunity to determine the effects of dietary macronutrients on IPC activity [74,75]. Previous studies have implicated both the IPCs, as well as Dilp2, Dilp3, and Dilp5 in promoting sleep during fed conditions, suggesting a role for the Dilps in sleep regulation [44,45]. Dilp2-expressing neurons are functionally downstream of wake-promoting octopamine neurons [14]. Induction of sleep loss by activating octopamine neurons does not induce a rebound [9], phenocopying loss of Dilp2. Together, these findings suggest a complex role for Dilp2 and the IPCs in sleep regulation, and suggest multiple transmitters expressed in the IPCs may act in concert with Dlip2 to differentially regulate sleep under fed and starved conditions. Additionally, we did not find any changes in sleep duration in flies lacking Dilp2. This is contrary to what we would predict based on previous literature, since genetic ablation of the IPCs has been shown to mimic diabetic- and starvation-like phenotypes [42,45,76]. However, possibly due to the compensatory effect of having multiple Dilps [46,77,78], these findings do not directly translate into expression of individual Dilps in the IPCs, as there are conflicting reports on whether Dilp2 expression is modulated during starvation. Some have shown that, contrary to Dilp3 and Dilp5, Dilp2 expression does not change during starvation [42,79,80], while others have shown that Dilp2 expression decreases [45].
Numerous factors have been identified as essential regulators of starvation-induced sleep suppression. For example, we have found that flies mutant for the mRNA/DNA binding protein translin, the neuropeptide Leucokinin, and Astray, a regulator of serine biosynthesis, fail to suppress sleep when starved [39,69,70]. Further, activation of orexigenic Neuropeptide F-expressing neurons or the sweet-sensing Gr64f-expressing neurons suppress sleep, suggesting that activation of feeding circuits may directly inhibit sleep [72,81]. However, it is not known whether these factors impact nutrient-dependent changes in sleep depth. A central question is how neural circuits that mediate starvation-induced sleep suppression interface with the IPCs that regulate sleep depth during the starvation period. We have found that Leucokinin neurons in the lateral horn signal to IPC neurons that express the Leucokinin Receptor (LkR) to suppress sleep during starvation [70]. These findings raise the possibility of a connection between LkR signaling in the IPCs and Dilp2 function, that in turn increase sleep depth during periods of starvation.
Overall, our findings identify differential modulation of sleep duration and depth in response to ecologically relevant sleep restriction. These findings reveal that naturally occurring resilience to starvation-induced sleep loss occurs by enhancement of sleep depth. This increase in sleep depth not only occurs during starvation, but also in the absence of yeast. Our finding that Dilp2 is required for starvation-induced modulation of sleep depth implicates insulin signaling in its regulation and highlights the need to understand the molecular mechanisms underlying changes in sleep quality in response of environmental perturbation.
Material and methods
Fly husbandry and stocks
Flies were grown and maintained on standard Drosophila food media (Bloomington Recipe, Genesee Scientific, San Diego, California) in incubators (Powers Scientific, Warminster, Pennsylvania) at 25°C on a 12:12 LD cycle with humidity set to 55–65%. The following fly strains were obtained from the Bloomington Stock Center: w1118 (#5905); Canton-S (#64349; [33]); Dilp2null (#30881; [46]); Dilp2-GAL4 (#37516; [76]); UAS-attp2 (#36303; [82]); and UAS-Dilp2RNAi (#31068; [82]). The Dilp2null flies as well as all GAL4 and UAS lines were backcrossed to the w1118 laboratory strain for 6 generations. The Canton-S strain was used to validate that the observed effects were not specific to the w1118 strain (S3E–S3H Fig). The Dilp2-GS line was a kind gift from Dr. Heinrich Jasper [47]. All flies carrying the Dilp2-GS driver were placed onto standard food supplemented with either 200 μM RU486 (#M8046; Sigma, St. Louis, Missouri) to activate transgene expression or the equivalent volume of 95% ethanol (vehicle alone) for 24 hours prior to and during experimental trials. Unless otherwise stated, 3-to-5 day old mated females were used for all experiments performed in this study.
Sleep and arousal threshold measurements
Arousal threshold was measured using the Drosophila Arousal Tracking system (DART), as previously described [25]. In brief, individual female flies were loaded into plastic tubes (Trikinectics, Waltham, Massachusetts) and placed onto trays containing vibrating motors. Flies were recorded continuously using a USB-webcam (QuickCam Pro 900, Logitech, Lausanne, Switzerland) with a resolution of 960x720 at 5 frames per second. The vibrational stimulus, video tracking parameters, and data analysis were performed using the DART interface developed in MATLAB (MathWorks, Natick, Massachusetts). To track fly movement, raw video flies were subsampled to 1 frame per second. Fly movement, or a difference in pixilation from one frame to the next, was detected by subtracting a background image from the current frame. The background image was generated as the average of 20 randomly selected frames from a given video. Fly activity was measured as movement of greater than 3 mm. Sleep was determined by the absolute location of each fly and was measured as bouts of immobility for 5 min or more. Arousal threshold was assessed using sequentially increasing vibration intensities, from 0 to 1.2 g, in 0.3 g increments, with an inter-stimulus delay of 15 s, once per hour over 24 hours starting at ZT0. Measurements of arousal threshold are reported as the proportion of the maximum force applied to the platform, thus an arousal threshold of 40% is 40% of 1.2g. For experiments using the Drosophila Activity Monitoring (DAM) system (Trikinetics, Waltham, MA, USA), measurements of sleep and waking activity were measured as previously described [61,83]. For each individual fly, the DAM system measures activity by counting the number of infrared beam crossings over time. These activity data were then used to calculate sleep, defined as bouts of immobility of 5 min or more. Sleep traits were then extracted using the Drosophila Sleep Counting Macro [27].
Sleep deprivation
For all sleep deprivation experiments, flies were briefly anesthetized using CO2 and then placed into plastic tubes containing standard food. Flies were allowed to recover from CO2 exposure and to acclimate to the tubes for a minimum of 24 hours prior to the start of the experiment. Upon experiment onset, baseline sleep and arousal threshold were measured starting at ZT0 for 24 hours. Unless otherwise stated, for the following 24 hours, flies were sleep deprived using one of the methods described below, during which sleep and arousal threshold were also measured. Lastly, to assess homeostatic rebound, flies were returned to standard conditions and sleep and arousal threshold was measured during the subsequent day (ZT0-ZT12). To assess the effect of sleep deprivation on sleep duration and depth, baseline nighttime sleep and arousal threshold were compared with nighttime sleep and arousal threshold measurements during sleep deprivation. To determine whether there exists a homeostatic rebound in sleep duration and/or depth, baseline daytime sleep and arousal threshold were compared to daytime sleep and arousal threshold during recovery.
Caffeine
Caffeine (#C0750, Sigma) was added to melted standard Drosophila media at a concentration of 0.5 mg/mL. At ZT0 on the day of sleep deprivation, flies were transferred into tubes containing the caffeine-laced standard food. Following 24 hours of caffeine supplementation, flies were then transferred back into tubes containing standard Drosophila media during the recovery period.
Mechanical vibration
For mechanical vibration experiments, the motors of the DART system were utilized to disrupt sleep, as described previously [25]. Briefly, a randomized mechanical stimulus, set at a maximum of 1.2 g, occurred every 20–60 sec, with each stimulus composing 4–7 pulses lasting 0.5–4 sec in length. These randomized stimuli began at ZT0 on the day of sleep deprivation and was repeated for 24hours.
Starvation
Flies were starved on 1% agar (#BP1423, Fisher Scientific, Hampton, New Hampshire), a non-nutritive substrate. At ZT0 on the day of sleep deprivation, flies were transferred into tubes containing agar. Following 24 hours of starvation, flies were then transferred back into tubes containing standard Drosophila media during the recovery period.
Pharmacological manipulations
2-Deoxyglucose (2DG; #D8375, Sigma) was added to melted standard Drosophila media at a concentration of 400 mM, as used previously to suppress sleep [39]. At ZT0 on the day of sleep deprivation, flies were transferred into tubes containing the 2DG-laced standard food media. Following 24 hours of 2DG supplementation, flies were then transferred back into tubes containing standard Drosophila media during the recovery period.
Feeding treatments
To assess sleep and arousal threshold on different diets, a similar experimental design was employed as that described above. In lieu of sleep deprivation, sleep duration and depth were assessed on one of four different food treatments. Flies were anesthetized using CO2 and then placed into plastic tubes containing standard food. Flies were allowed to recover from CO2 exposure and acclimate to the tubes for a minimum of 24 hours prior to the start of the experiment. Upon experiment onset, baseline sleep and arousal threshold were measured starting at ZT0 for 24 hours. For the following 24 hours, flies were transferred into tubes containing one of five different diets, during which sleep and arousal threshold were again measured. These diets include standard food, 2% yeast extract (#BP1422, Fisher Scientific), 2% yeast extract and 5% sucrose (#S3, Fisher Scientific), 5% sucrose alone, or 5% sucrose and 2.5x amino acids (#11140050 and #1113051; ThermoFisher Scientific, Waltham, Massachusetts). With the exception of standard food, all diets were dissolved in ddH2O and included 1% agar, 0.375% tegosept (methyl-4-hydroxybenzoate dissolved in 95% ethanol; #W271004; Sigma), and 0.125% penicillin (#15140122, ThermoFisher Scientific).
Immunohistochemistry
Brains of three to five day old female flies were dissected in ice-cold phosphate buffered saline (PBS) and fixed in 4% formaldehyde, PBS, and 0.5% Triton-X for 35 min at room temperature, as previously described [84]. Brains were then rinsed 3x with cold PBS and 0.5% Triton-X (PBST) for 10 min at room temperature and then overnight at 4°C. The following day, the brains were incubated for 24 hours in primary antibody (1:20 mouse nc82; Iowa Hybridoma Bank; The Developmental Studies Hybridoma Bank, Iowa City, Iowa), and then diluted in 0.5% PBST at 4°C on a rotator. The brains were incubated for another 24 hours at 4°C upon the addition of a second primary antibody (1:1300 rabbit anti-Dilp2). The following day, the brains were rinsed 3x in cold PBST for 10 min at room temperature and then incubated in secondary antibody (1:400 donkey anti-rabbit Alexa 488 and 1:400 donkey anti-mouse Alexa 647; ThermoFisher Scientific, Waltham, Massachusetts) for 95 min at room temperature. The brains were again rinsed 3x in cold PBST for 10 min at room temperature then stored overnight in 0.5% PBST at 4°C. Lastly, the brains were mounted in Vectashield (VECTOR Laboratories, Burlingame, California) and imaged in 2μm sections on a Nikon A1R confocal microscope (Nikon, Tokyo, Japan) using a 20X oil immersion objective. Images are presented as the Z-stack projection through the entire brain and processed using ImageJ2.
Statistical analysis
Measurements of sleep duration are presented as bar graphs displaying the mean ± standard error. Unless otherwise noted, a one-way or two-way analysis of variance (ANOVA) was used for comparisons between two or more genotypes and one treatment or two or more genotypes and two treatments, respectively. Measurements of arousal threshold were not normally distributed and so are presented as violin plots; indicating the median, 25th, and 75th percentiles. The non-parametric Kruskal-Wallis test was used to compare two or more genotypes. To compare two or more genotypes and two treatments, a restricted maximum likelihood (REML) estimation was used. All post hoc analyses were performed using Sidak’s multiple comparisons test. All statistical analyses were performed using InStat software (GraphPad Software 8.0).
Supporting information
(A) Total sleep and arousal threshold were assessed on standard food over a 3-day period. (B) Sleep profile. (C) There is no change in sleep duration over a 3-day period (two-way ANOVA: F2,168 = 0.24, P<0.79). This is consistent during the day (ANOVA: F2,84 = 0.03, P<0.96) and night (ANOVA: F2,84 = 0.35, P<0.70). (D) Profile of arousal threshold. (E) There is no change in arousal threshold over a 3-day period (REML: F2,56 = 0.17, P<0.83). This is consistent during the day (Kruskal-Wallis test: H = 0.09, P<0.95; N = 29) and the night (Kruskal-Wallis test: H = 0.23, P<0.89; N = 29). For profiles, shaded regions indicate +/- standard error from the mean. White background indicates daytime, while gray background indicates nighttime. For sleep measurements, error bars represent +/- standard error from the mean. For arousal threshold measurements, the median (dashed line) as well as 25th and 75th percentiles (dotted lines) are shown.
(PDF)
(A) Sleep traits were measured using the Drosophila Activity Monitoring (DAM) system. Individual flies were placed inside plastic tubes containing standard food at one end and a foam plug at the other. Flies were then allowed to acclimate for 24 hrs. (B) At ZT0, baseline sleep was measured on a standard food diet (Day 1). At ZT0 of the following day, flies were sleep deprived using 0.5mg/mL caffeine, mechanical vibration, or starved for 24 hrs. (C) Total sleep duration significantly decreases when caffeine is added to a standard food diet (t-test: t64 = 6.54, P<0.0001). (D,E) This is not due to a change in bout number (t-test: t64 = 0.24, P<0.80), but rather a significant decrease in bout length (t-test: t64 = 4.82, P<0.0001). (F) Total sleep duration significantly decreases when flies are mechanically sleep deprived (t-test: t56 = 12.06, P<0.0001). (G,H) This is caused by a significant decrease in bout number (t-test: t56 = 7.13, P<0.0001) as well as a significant decrease in bout length (t-test: t54 = 3.24, P<0.0020). (I) Total sleep duration significantly decreases during starvation (t-test: t68 = 9.69, P<0.0001). (J,K) This is due to a significant decrease in bout number (t-test: t68 = 11.85, P<0.0001), but not bout length (t-test: t68 = 1.22, P<0.22). Error bars represent +/- standard error from the mean. ** = P<0.01; **** = P<0.0001.
(PDF)
All experiments were performed as described in Fig 2A. (A-D) Sleep and arousal threshold measurements in w1118 male flies. (A) Sleep profiles of fed and starved flies. (B) Sleep duration decreases in the starved state (two-way ANOVA: F1,152 = 101.4, P<0.0001), and occurs during both the day (P<0.0001) and night (P<0.0001). (C) Profile of arousal threshold of fed and starved flies. (D) Arousal threshold significantly increases in the starved state (REML: F1,71 = 40.81, P<0.0001), but occurs only at night (day: P<0.11; night: P<0.0001). (E-H) Sleep and arousal threshold measurements in female Canton-S flies. (E) Sleep profiles of fed and starved flies. (F) Sleep duration decreases in the starved state (two-way ANOVA: F1,122 = 36.92, P<0.0001), and occurs during both the day (P<0.0001) and night (P<0.0001). (G) Profile of arousal threshold of fed and starved flies. (H) Arousal threshold significantly increases in the starved state (REML: F1,52 = 62.11, P<0.0001), and occurs both during the day and at night (day: P<0.0008; night: P<0.0001). For profiles, shaded regions indicate +/- standard error from the mean. White background indicates daytime, while gray background indicates nighttime. For sleep measurements, error bars represent +/- standard error from the mean. For arousal threshold measurements, the median (dashed line) as well as 25th and 75th percentiles (dotted lines) are shown. *** = P<0.001; **** = P<0.0001.
(PDF)
(A) Compared to the control, knockdown of Dilp2 in Dilp2-expressing does not affect sleep duration (two-way ANOVA: F1,146 = 2.16, P<0.14), and both genotypes suppressed sleep during starvation (two-way ANOVA: F1,146 = 26.78, P<0.0001). For each genotype, post hoc analyses revealed a significant decrease in sleep duration when starved both during the day (Dilp2-GAL4>UAS-attp2: P<0.03; Dilp2-GAL4>UAS-Dilp2RNAi: P<0.0048) and night (Dilp2-GAL4>UAS-attp2: P<0.0008; Dilp2-GAL4>UAS-Dilp2RNAi: P<0.0002). (B) Compared to the control, knockdown of Dilp2 in Dilp2-expressing neurons has no effect on arousal threshold during recovery (REML: F1,76 = 0.46, P<0.49). (C) In comparison to the control, there is no effect on sleep duration in heterozygotes or Dilp2null flies (two-way ANOVA: F1,231 = 0.19, P<0.81), and all genotypes suppressed sleep during starvation (two-way ANOVA: F1,231 = 59.11, P<0.0001). For all three genotypes, post hoc analyses revealed a significant decrease in sleep duration when starved both during the day (w1118: P<0.0001; w1118/Dilp2null: P<0.0001; Dilp2null: P<0.0001) and night (w1118: P<0.0002; w1118/Dilp2null: P<0.0001; Dilp2null: P<0.0001). (D) In comparison to the control, there is no effect on arousal threshold during recovery in heterozygotes or Dilp2null flies (REML: F2,117 = 1.42, P<0.23). For sleep measurements, error bars represent +/- standard error from the mean. For arousal threshold measurements, the median (dashed line) as well as 25th and 75th percentiles (dotted lines) are shown. Measurements of homeostatic rebound were assessed in 3-, 6-, and 12-hr increments. * = P<0.05; ** = P<0.01; *** = P<0.001; **** = P<0.0001.
(PDF)
Total sleep and arousal threshold during sleep deprivation and recovery were assessed as described in Fig 1A. Flies were sleep deprived by adding 0.5mg/mL caffeine to their diet. (A) There is no effect of genotype on nighttime sleep duration (two-way ANOVA: F1,154 = 0.02, P<0.87), and all genotypes suppressed sleep when fed caffeine (two-way ANOVA: F1,154 = 20.56, P<0.0001). Post hoc analyses revealed a significant decrease in nighttime sleep duration when fed caffeine for both genotypes (Dilp2-GAL4>UAS-attp2: P<0.0069; Dilp2-GAL4>UAS-Dilp2RNAi: P<0.0015). (B) Similar to the control, knockdown of Dilp2 in Dilp2-expressing neurons has no effect on nighttime arousal threshold when fed caffeine (REML: F1,78 = 2.22, P<0.13). (C) There is no effect of genotype on sleep duration (two-way ANOVA: F1,154 = 0.13, P<0.71), however there was a significant effect of recovery (two-way ANOVA: F1,154 = 15.80, P<0.0001). For both genotypes, post hoc analyses revealed a significant increase in sleep duration after 6 hrs of recovery (Dilp2-GAL4>UAS-attp2: 0–3 hrs: P<0.90; 0–6 hrs: P<0.34; 0–12 hrs: P<0.0005; Dilp2-GAL4>UAS-Dilp2RNAi: 0–3 hrs: P<0.99; 0–6 hrs: P<0.94; 0–12 hrs: P<0.03). (D) There was no effect of genotype on arousal threshold (REML: F1,78 = 0.06, P<0.79), however there was a significant effect of recovery (REML: F1,76 = 106.1, P<0.0001). For all both genotypes, post hoc analyses revealed a significant increase in arousal threshold after 3 hrs of recovery (Dilp2-GAL4>UAS-attp2: 0–3 hrs: P<0.05; 0–6 hrs: P<0.0001; 0–12 hrs: P<0.0001; Dilp2-GAL4>UAS-Dilp2RNAi: 0–3 hrs: P<0.09; 0–6 hrs: P<0.0064; 0–12 hrs: P<0.0012). (E) There was no effect of genotype on nighttime sleep duration (two-way ANOVA: F2,208 = 0.11, P<0.88), and all genotypes suppressed sleep when fed caffeine (two-way ANOVA: F2,208 = 45.32, P<0.0001). Post hoc analyses revealed a significant decrease in nighttime sleep duration when fed caffeine for all three genotypes (w1118: P<0.0016; w1118/Dilp2null: P<0.0001; Dilp2null: P<0.0003). (F) Similar to control flies, there is no change in nighttime arousal threshold when fed caffeine in heterozygotes or Dilp2null flies (REML: F2,105 = 2.74, P<0.06). (G) There was no effect of genotype on sleep duration (two-way ANOVA: F1,208 = 0.13, P<0.87), but there was a significant effect of recovery (two-way ANOVA: F1,208 = 25.08, P<0.0001). Post hoc analyses revealed a significant increase in sleep duration during recovery for all three genotypes (w1118: 0–3 hrs: P<0.33; 0–6 hrs: P<0.0051; 0–12 hrs: P<0.0001; w1118/Dilp2null: 0–3 hrs: P<0.76; 0–6 hrs: P<0.04; 0–12 hrs: P<0.0060; Dilp2null: 0–3 hrs: P<0.80; 0–6 hrs: P<0.02; 0–12 hrs: P<0.0032). (H) There was no effect of genotype on arousal threshold (REML: F2,105 = 0.370, P<0.68), however there was a significant effect of recovery (REML: F1,103 = 29.33, P<0.0001). Post hoc analyses revealed a significant increase in arousal threshold during recovery for all three genotypes (w1118: 0–3 hrs: P<0.33; 0–6 hrs: P<0.0002; 0–12 hrs: P<0.0001; w1118/Dilp2null: 0–3 hrs: P<0.99; 0–6 hrs: P<0.02; 0–12 hrs: P<0.0026; Dilp2null: 0–3 hrs: P<0.18; 0–6 hrs: P<0.01; 0–12 hrs: P<0.0049). For sleep measurements, error bars represent +/- standard error from the mean. For arousal threshold measurements, the median (dashed line) as well as 25th and 75th percentiles (dotted lines) are shown. Measurements of homeostatic rebound during recovery were assessed in 3-, 6-, and 12-hr increments. * = P<0.05; ** = P<0.01; *** = P<0.001; **** = P<0.0001.
(PDF)
(A) There is no effect of genotype on nighttime sleep duration (two-way ANOVA: F3,67 = 0.19, P<0.89), and all genotypes suppressed sleep during starvation (two-way ANOVA: F1,67 = 74.34, P<0.0001). Post hoc analyses revealed a significant decrease in sleep duration when starved both during the day (Dilp2-GS-GAL4>UAS-attp2/-RU486: P<0.0048; Dilp2-GS-GAL4>UAS-attp2/+RU486: P<0.04; Dilp2-GS-GAL4>UAS-Dilp2RNAi/-RU486: P<0.04; Dilp2-GS-GAL4>UAS-Dilp2RNAi/+RU486: P<0.02) and night (Dilp2-GS-GAL4>UAS-attp2/-RU486: P<0.0002; Dilp2-GS-GAL4>UAS-attp2/+RU486: P<0.0003; Dilp2-GS-GAL4>UAS-Dilp2RNAi/-RU486: P<0.0001; Dilp2-GS-GAL4>UAS-Dilp2RNAi/+RU486: P<0.006). (B) Compared to the controls, knockdown of Dilp2 in Dilp2-expressing neurons (Dilp2-GS-GAL4>UAS-Dilp2RNAi/+RU486) has no effect on arousal threshold following 24 hrs of starvation (REML: F3,134 = 1.48, P<0.22). For sleep measurements, error bars represent +/- standard error from the mean. For arousal threshold measurements, the median (dashed line) as well as 25th and 75th percentiles (dotted lines) are shown. Measurements of homeostatic rebound were assessed in 3-, 6-, and 12-hr increments. * = P<0.05; ** = P<0.01; *** = P<0.001; **** = P<0.0001.
(PDF)
Total sleep and arousal threshold were assessed as described in Fig 4A. On Day 2 of testing, flies were fed a diet of 5% sucrose. (A) Compared to the control, knockdown of Dilp2 in Dilp2-expressing neurons has no effect on sleep duration when fed a sucrose-only diet (two-way ANOVA: F1,150 = 0.21, P<0.64). (B) There is a significant effect of genotype on nighttime arousal threshold (REML: F1,75 = 26.51, P<0.0001). Post hoc analyses revealed that while controls significantly increase nighttime arousal threshold when fed a sucrose-only diet (P<0.0001), there is no effect upon knockdown of Dilp2 in Dilp2-expressing neurons (P<0.13). (C) Similar to the control, knockdown of Dilp2 in Dilp2-expressing neurons does not change sleep duration during recovery when fed a sucrose-only diet (two-way ANOVA: F1,150 = 0.19, P<0.66). (D) There is a significant effect of genotype on arousal threshold during recovery (REML: F1,75 = 6.21, P<0.01). However, post hoc analyses revealed no differences in arousal threshold in the control (P<0.20), nor upon knockdown of Dilp2 in Dilp2-expressing neurons (P<0.12). (E) In comparison to the control, there is no effect on nighttime sleep duration in heterozygotes or Dilp2null flies when fed a sucrose-only diet (two-way ANOVA: F2,216 = 0.02, P<0.97). (F) There is a significant effect of genotype on nighttime arousal threshold (REML: F2,108 = 5.93, P<0.0032). Post hoc analyses revealed that while controls and heterozygotes significantly increase nighttime arousal threshold when fed a diet of sucrose (w1118: P<0.0001; w1118/Dilp2null: P<0.0001), there is no effect on arousal threshold in Dilp2null flies (P<0.10). (G) Similar to the control, there is no effect on sleep duration during recovery in heterozygotes or Dilp2null flies (two-way ANOVA: F2,216 = 0.01, P<0.98). (H) There is a significant effect of genotype on arousal threshold during recovery (REML: F2,108 = 14.58, P<0.0001). However, post hoc analyses revealed no differences in arousal threshold in control flies (P<0.67), heterozygotes (P<0.14), nor Dilp2null flies (P<0.94). For sleep measurements, error bars represent +/- standard error from the mean. For arousal threshold measurements, the median (dashed line) as well as 25th and 75th percentiles (dotted lines) are shown. Measurements of homeostatic rebound were assessed in 3-, 6-, and 12-hr increments. **** = P<0.0001.
(PDF)
(XLXS)
Acknowledgments
We are thankful to members of the Keene laboratory for helpful discussions and technical support. We are also thankful to Jan Veenstra for kindly providing anti-Dilp2 antibody and Dragana Rogulja for helpful discussion.
Data Availability
All relevant data are within the manuscript and its Supporting Information files. Original statistics and raw data will be published as a supporting file upon acceptance.
Funding Statement
This work was supported by NIH Grants 1R01 NS081512, 1R01 DC017390, and 1R01 HL143790 to ACK. The funders had no role in study design, data collection and analysis, decision to publish, or preparation of the manuscript.
References
- 1.Keene AC, Duboue ER. The origins and evolution of sleep. J Exp Biol. 2018;12: jeb159533. 10.1242/jeb.159533 [DOI] [PMC free article] [PubMed] [Google Scholar]
- 2.Joiner WJ. Unraveling the evolutionary determinants of sleep. Curr Biol. 2016;26: R1073–R1087. 10.1016/j.cub.2016.08.068 [DOI] [PMC free article] [PubMed] [Google Scholar]
- 3.Allada R, Siegel JM. Unearthing the phylogenetic roots of sleep. Curr Biol. 2008;18: R670–R679. 10.1016/j.cub.2008.06.033 [DOI] [PMC free article] [PubMed] [Google Scholar]
- 4.Donlea JM. Neuronal and molecular mechanisms of sleep homeostasis. Curr Opin Insect Sci. 2017;24: 51–57. 10.1016/j.cois.2017.09.008 [DOI] [PubMed] [Google Scholar]
- 5.Tougeron K, Abram PK. An ecological perspective on sleep disruption. Am Nat. 2017;190: E55–E66. 10.1086/692604 [DOI] [PubMed] [Google Scholar]
- 6.Campbell SS, Tobler I. Animal sleep: a review of sleep duration across phylogeny. Neurosci Biobehav Rev. 1984;8: 269–300. 10.1016/0149-7634(84)90054-x [DOI] [PubMed] [Google Scholar]
- 7.Hartmann E. The function of sleep. Annu Psychoanal. 1974;2: 271–289. [Google Scholar]
- 8.Liu S, Liu Q, Tabuchi M, Wu M. Sleep drive Is encoded by neural plastic changes in a dedicated circuit. Cell. 2016;165: 1347–1360. 10.1016/j.cell.2016.04.013 [DOI] [PMC free article] [PubMed] [Google Scholar]
- 9.Seidner G, Robinson JE, Wu M, Worden K, Masek P, Roberts SW, Keene AC, Joiner WJ. Identification of neurons with a privileged role in sleep homeostasis in Drosophila melanogaster. Curr Biol. 2015;25: 2928–2938. 10.1016/j.cub.2015.10.006 [DOI] [PMC free article] [PubMed] [Google Scholar]
- 10.Danguir J, Nicolaidis S. Dependence of sleep on nutrients' availability. Physiol Behav. 1979;22: 735–740. 10.1016/0031-9384(79)90240-3 [DOI] [PubMed] [Google Scholar]
- 11.Keene AC, Duboué ER, McDonald DM, Dus M, Suh GS, Waddell S, Blau J. Clock and cycle limit starvation-induced sleep loss in Drosophila. Curr Biol. 2010;20: 1209–1215. 10.1016/j.cub.2010.05.029 [DOI] [PMC free article] [PubMed] [Google Scholar]
- 12.Griffith LC. Neuromodulatory control of sleep in Drosophila melanogaster: Integration of competing and complementary behaviors. Curr Opin Neurobiol. 2013;23: 819–823. 10.1016/j.conb.2013.05.003 [DOI] [PMC free article] [PubMed] [Google Scholar]
- 13.Yurgel ME, Masek P, DiAngelo J, Keene AC. Genetic dissection of sleep-metabolism interactions in the fruit fly. J Comp Physiol A Neuroethol Sens Neural Behav Physiol. 2014;201: 869–77. 10.1007/s00359-014-0936-9 [DOI] [PMC free article] [PubMed] [Google Scholar]
- 14.Crocker A, Shahidullah M, Levitan IB, Sehgal A. Identification of a neural circuit that underlies the effects of octopamine on sleep:wake behavior. Neuron. 2010;65: 670–681. 10.1016/j.neuron.2010.01.032 [DOI] [PMC free article] [PubMed] [Google Scholar]
- 15.Kréneisz O, Chen X, Fridell YW, Mulkey DK. Glucose increases activity and Ca2+ in insulin-producing cells of adult Drosophila. Neuroreport. 2010;21: 1116–1120. 10.1097/WNR.0b013e3283409200 [DOI] [PMC free article] [PubMed] [Google Scholar]
- 16.Varin C, Rancillac A, Geoffroy H, Arthaud S, Fort P, Gallopin T. Glucose induces slow-wave sleep by exciting the sleep-promoting neurons in the ventrolateral preoptic nucleus: a new link between sleep and metabolism. J Neurosci. 2015;35: 9900–9911. 10.1523/JNEUROSCI.0609-15.2015 [DOI] [PMC free article] [PubMed] [Google Scholar]
- 17.Chakravarti L, Moscato EH, Kayser MS. Unraveling the neurobiology of sleep and sleep disorders using Drosophila. 2017;121: 253–285. 10.1016/bs.ctdb.2016.07.010 [DOI] [PubMed] [Google Scholar]
- 18.Artiushin G, Sehgal A. The Drosophila circuitry of sleep–wake regulation. Curr Opin Neurobiol. 2017;44: 243–250. 10.1016/j.conb.2017.03.004 [DOI] [PMC free article] [PubMed] [Google Scholar]
- 19.Donlea JM, Pimentel D, Talbot CB, Kempf A, Omoto JJ, Hartenstein V, Miesenböck G. Recurrent circuitry for balancing sleep need and sleep. Neuron. 2018;97: 378–389.e4. 10.1016/j.neuron.2017.12.016 [DOI] [PMC free article] [PubMed] [Google Scholar]
- 20.Pimentel D, Donlea JM, Talbot CB, Song SM, Thurston AJF, Miesenböck G. Operation of a homeostatic sleep switch. Nature. 2016;536: 333–337. 10.1038/nature19055 [DOI] [PMC free article] [PubMed] [Google Scholar]
- 21.Toda H, Williams JA, Gulledge M, Sehgal A. A sleep-inducing gene, nemuri, links sleep and immune function in Drosophila. Science. 2019;363: 509–515. 10.1126/science.aat1650 [DOI] [PMC free article] [PubMed] [Google Scholar]
- 22.Thimgan MS, Suzuki Y, Seugnet L, Gottschalk L, Shaw PJ. The perilipin homologue, lipid storage droplet 2, regulates sleep homeostasis and prevents learning impairments following sleep loss. 2010;8: e1000466 10.1371/journal.pbio.1000466 [DOI] [PMC free article] [PubMed] [Google Scholar]
- 23.Donlea J, Leahy A, Thimgan MS, Suzuki Y, Hughson BN, Sokolowski MB, Shaw PJ. Foraging alters resilience/vulnerability to sleep disruption and starvation in Drosophila. Proc Natl Acad Sci USA. 2012;109: 2613–2618. 10.1073/pnas.1112623109 [DOI] [PMC free article] [PubMed] [Google Scholar]
- 24.van Alphen B, Yap MH, Kirszenblat L, Kottler B, van Swinderen B. A dynamic deep sleep stage in Drosophila. J Neurosci. 2013;33: 6917–6927. 10.1523/JNEUROSCI.0061-13.2013 [DOI] [PMC free article] [PubMed] [Google Scholar]
- 25.Faville R, Kottler B, Goodhill GJ, Shaw PJ, van Swinderen B. How deeply does your mutant sleep? Probing arousal to better understand sleep defects in Drosophila. Sci Rep. 2015;13: 8454 10.1038/srep08454 [DOI] [PMC free article] [PubMed] [Google Scholar]
- 26.Yap MHW, Grabowska MJ, Rohrscheib C, Jeans R, Troup M, Paulk AC, van Alphen B, Shaw PJ, van Swinderen B. Oscillatory brain activity in spontaneous and induced sleep stages in flies. Nat Commun. 2017;8: 1815 10.1038/s41467-017-02024-y [DOI] [PMC free article] [PubMed] [Google Scholar]
- 27.Pfeiffenberger C, Lear BC, Keegan KP, Allada R. Locomotor activity level monitoring using the Drosophila activity monitoring (DAM) system. Cold Spring Harb Protoc. 2010;2010: pdb.prot5518. 10.1101/pdb.prot5518 [DOI] [PubMed] [Google Scholar]
- 28.Stahl BA, Slocumb ME, Chaitin H, DiAngelo JR, Keene AC. Sleep-dependent modulation of metabolic rate in Drosophila. Sleep. 2017;40: zsx084. 10.1093/sleep/zsx084 [DOI] [PMC free article] [PubMed] [Google Scholar]
- 29.Harshman LG, Hoffmann AA, Clark AG. Selection for starvation resistance in Drosophila melanogaster: Physiological correlates, enzyme activities and multiple stress responses. J Evol Biol. 1999;12: 370–379. 10.1046/j.1420-9101.1999.00024.x [DOI] [Google Scholar]
- 30.Andretic R, Shaw PJ. Essentials of sleep recordings in Drosophila: Moving beyond sleep time. Methods Enzymol. 2005;393: 759–772. 10.1016/S0076-6879(05)93040-1 [DOI] [PubMed] [Google Scholar]
- 31.Brown EB, Torres J, Bennick RA, Rozzo V, Kerbs A, DiAngelo JR, Keene AC. Variation in sleep and metabolic function is associated with latitude and average temperature in Drosophila melanogaster. Ecol Evol. 2018;8: 4084–4097. 10.1002/ece3.3963 [DOI] [PMC free article] [PubMed] [Google Scholar]
- 32.Khericha M, Kolenchery JB, Tauber E. Neural and non-neural contributions to sexual dimorphism of mid-day sleep in Drosophila melanogaster: a pilot study. Physiol Entomol. 2016;41: 327–334. 10.1111/phen.12134 [DOI] [PMC free article] [PubMed] [Google Scholar]
- 33.Lindsley DL, Grell EH. Genetic Variations of Drosophila melanogaster. Publs Carnegie Instn. 1968; 627: 469pp. [Google Scholar]
- 34.Kempf A, Song SM, Talbot CB, Miesenböck G. A potassium channel β-subunit couples mitochondrial electron transport to sleep. Nature. 2019;568: 230–234. 10.1038/s41586-019-1034-5 [DOI] [PMC free article] [PubMed] [Google Scholar]
- 35.de Camargo R, Phaff HJ. Yeasts occurring in Drosophila flies and in fermenting tomato fruits in northern California. J Food Sci. 1957;22: 367–372. 10.1111/j.1365-2621.1957.tb17024.x [DOI] [Google Scholar]
- 36.Phaff HJ, Miller MW, Recca JA, Shifrine M, Mrak EM. Yeasts found in the alimentary canal of Drosophila. Ecology. 1956;37: 533–538. 10.2307/1930176 [DOI] [Google Scholar]
- 37.Liu Q, Tabuchi M, Liu S, Kodama L, Horiuchi W, Daniels J, Chiu L, Baldoni D, Wu MN. Branch-specific plasticity of a bifunctional dopamine circuit encodes protein hunger. Science. 2017;356: 534–539. 10.1126/science.aal3245 [DOI] [PMC free article] [PubMed] [Google Scholar]
- 38.Dus M, Min S, Keene AC, Lee GY, Suh GSB. Taste-independent detection of the caloric content of sugar in Drosophila. Proc Natl Acad Sci USA. 2011;108: 11644–11649. 10.1073/pnas.1017096108 [DOI] [PMC free article] [PubMed] [Google Scholar]
- 39.Murakami K, Yurgel ME, Stahl BA, Masek P, Mehta A, Heidker R, Bollinger W, Gingras RM, Kim YJ, Ja WW, Suter B, DiAngelo JR, Keene AC. Translin is required for metabolic regulation of sleep. Curr Biol. 2016;26: 972–980. 10.1016/j.cub.2016.02.013 [DOI] [PMC free article] [PubMed] [Google Scholar]
- 40.DiAngelo JR, Erion R, Crocker A, Sehgal A. The central clock neurons regulate lipid storage in Drosophila. PLoS One. 2011;6: e19921 10.1371/journal.pone.0019921 [DOI] [PMC free article] [PubMed] [Google Scholar]
- 41.Rajan A, Perrimon N. Drosophila cytokine unpaired 2 regulates physiological homeostasis by remotely controlling insulin secretion. Cell. 2012;151: 123–137. 10.1016/j.cell.2012.08.019 [DOI] [PMC free article] [PubMed] [Google Scholar]
- 42.Ikeya T, Galic M, Belawat P, Nairz K, Hafen E. Nutrient-dependent expression of insulin-like peptides from neuroendocrine cells in the CNS contributes to growth regulation in Drosophila. Curr Biol. 2002;12: 1293–1300. 10.1016/s0960-9822(02)01043-6 [DOI] [PubMed] [Google Scholar]
- 43.Birse RT, Choi J, Reardon K, Rodriguez J, Graham S, Diop S, Ocorr K, Bodmer R, Oldham S. High-fat-diet-induced obesity and heart dysfunction are regulated by the TOR pathway in Drosophila. Cell Metab. 2010;12: 533–544. 10.1016/j.cmet.2010.09.014 [DOI] [PMC free article] [PubMed] [Google Scholar]
- 44.Metaxakis A, Tain L, Grönke, Hendrich O, Hinze Y, Birras U, Partridge L. Lowered insulin signalling ameliorates age-related sleep fragmentation in Drosophila. PLoS Biol. 2014;12: e1001824 10.1371/journal.pbio.1001824 [DOI] [PMC free article] [PubMed] [Google Scholar]
- 45.Cong X, Wang H, Liu Z, He C, An C, Zhao Z. Regulation of sleep by insulin-like peptide system in Drosophila melanogaster. Sleep. 2015;38: 1075–1083. 10.5665/sleep.4816 [DOI] [PMC free article] [PubMed] [Google Scholar]
- 46.Grönke S, Clarke DF, Broughton S, Andrews TD, Partridge L. Molecular evolution and functional characterization of Drosophila insulin-like peptides. PLoS Genet. 2010;6: e1000857 10.1371/journal.pgen.1000857 [DOI] [PMC free article] [PubMed] [Google Scholar]
- 47.Karpac J, Hull-Thompson J, Falleur M, Jasper H. JNK signaling in insulin-producing cells is required for adaptive responses to stress in Drosophila. Aging Cell. 2009;8: 288–295. 10.1111/j.1474-9726.2009.00476.x [DOI] [PMC free article] [PubMed] [Google Scholar]
- 48.Nath RD, Bedbrook CN, Abrams MJ, Basinger T, Bois JS, Prober DA, Sternberg PW, Gradinaru V, Goentoro L. The jellyfish Cassiopea exhibits a sleep-like state. Curr Biol. 2017;27: 2984-2990.e3. 10.1016/j.cub.2017.08.014 [DOI] [PMC free article] [PubMed] [Google Scholar]
- 49.Krashes MJ, DasGupta S, Vreede A, White B, Armstrong JD, Waddell S. A neural circuit mechanism integrating motivational state with memory expression in Drosophila. Cell. 2009;139: 416–27. 10.1016/j.cell.2009.08.035 [DOI] [PMC free article] [PubMed] [Google Scholar]
- 50.Krashes MJ, Waddell S. Rapid consolidation to a radish and protein synthesis-dependent long-term memory after single-session appetitive olfactory conditioning in Drosophila. J Neurosci. 2008;19: 3103–3113. 10.1523/JNEUROSCI.5333-07.2008 [DOI] [PMC free article] [PubMed] [Google Scholar]
- 51.Cervantes-Sandoval I, Davis RL. Distinct traces for appetitive versus aversive olfactory memories in DPM neurons of Drosophila. Curr Biol. 2012;22: 1247–1252. 10.1016/j.cub.2012.05.009 [DOI] [PMC free article] [PubMed] [Google Scholar]
- 52.Borbély AA. A two process model of sleep regulation. Hum Neurobiol. 1982;1: 195–204. 10.1111/jsr.12371 [DOI] [PubMed] [Google Scholar]
- 53.Donlea JM, Pimentel D, Miesenböck G. Neuronal machinery of sleep homeostasis in Drosophila. Neuron. 2014;81: 860–872. 10.1016/j.neuron.2013.12.013 [DOI] [PMC free article] [PubMed] [Google Scholar]
- 54.Goodwin PR, Meng A, Moore J, Hobin M, Fulga TA, Van Vactor D, Griffith LC. MicroRNAs regulate sleep and sleep homeostasis in Drosophila. Cell Rep. 2018;23: 3776–3786. 10.1016/j.celrep.2018.05.078 [DOI] [PMC free article] [PubMed] [Google Scholar]
- 55.Vanderheyden WM, Goodman AG, Taylor RH, Frank MG, Van Dongen HPA, Gerstner JR. Astrocyte expression of the Drosophila TNF-alpha homologue, Eiger, regulates sleep in flies. PLOS Genet. 2018;14: e1007724 10.1371/journal.pgen.1007724 [DOI] [PMC free article] [PubMed] [Google Scholar]
- 56.Allada R, Cirelli C, Sehgal A. Molecular mechanisms of sleep homeostasis in flies and mammals. Cold Spring Harb Perspect Biol. 2017;9: a027730 10.1101/cshperspect.a027730 [DOI] [PMC free article] [PubMed] [Google Scholar]
- 57.Liu G, Seiler H, Wen A, Zars T, Ito K, Wolf R, Heisenberg M, Liu L. Distinct memory traces for two visual features in the Drosophila brain. Nature. 2006;439: 551–556. 10.1038/nature04381 [DOI] [PubMed] [Google Scholar]
- 58.Pan Y, Zhou Y, Guo C, Gong H, Gong Z, Liu L. Differential roles of the fan-shaped body and the ellipsoid body in Drosophila visual pattern memory. 2009;16: 289–295. 10.1101/lm.1331809.16 [DOI] [PubMed] [Google Scholar]
- 59.Sitaraman D, Aso Y, Jin X, Chen N, Felix M, Rubin GM, Nitabach MN. Propagation of homeostatic sleep signals by segregated synaptic microcircuits of the Drosophila mushroom body. Curr Biol. 2015;25: 2517–2527. 10.1016/j.cub.2015.09.017 [DOI] [PMC free article] [PubMed] [Google Scholar]
- 60.Tabuchi M, Lone SR, Liu Q, Liu Q, Zhang J, Spira AP, Wu MN. Sleep interacts with aβ to modulate intrinsic neuronal excitability. Curr Biol. 2015;25: 702–712. 10.1016/j.cub.2015.01.016 [DOI] [PMC free article] [PubMed] [Google Scholar]
- 61.Shaw PJ, Cirelli C, Greenspan RJ, Tononi G. Correlates of sleep and waking in Drosophila melanogaster. Science. 2000;287: 1834–1837. 10.1126/science.287.5459.1834 [DOI] [PubMed] [Google Scholar]
- 62.Ho KS, Sehgal A. Drosophila melanogaster: An insect model for fundamental studies of sleep. Methods Enzymol. 2005;393: 772–793. 10.1016/S0076-6879(05)93041-3 [DOI] [PubMed] [Google Scholar]
- 63.Harbison ST, Mackay TF, Anholt RR. Understanding the neurogenetics of sleep: progress from Drosophila. Trends Genet. 2009;25: 262–269. 10.1016/j.tig.2009.04.003 [DOI] [PMC free article] [PubMed] [Google Scholar]
- 64.Beckwith EJ, Geissmann Q, French AS, Gilestro GF. Regulation of sleep homeostasis by sexual arousal. Elife. 2017;6: e27445 10.7554/eLife.27445 [DOI] [PMC free article] [PubMed] [Google Scholar]
- 65.Machado DR, Afonso DJ, Kenny AR, Öztürk-Çolak A, Moscato EH, Mainwaring B, Kayser M, Koh K. Identification of octopaminergic neurons that modulate sleep suppression by male sex drive. Elife. 2017;6: e23130 10.7554/eLife.23130 [DOI] [PMC free article] [PubMed] [Google Scholar]
- 66.Szymusiak R. Hypothalamic versus neocortical control of sleep. Curr Opin Pulm Med. 2010;16: 530–535. 10.1097/MCP.0b013e32833eec92 [DOI] [PubMed] [Google Scholar]
- 67.Hanlon EC, Vyazovskiy VV, Faraguna U, Tononi G, Cirelli C. Synaptic potentiation and sleep need: clues from molecular and electrophysiological studies. Curr Top Med Chem. 2011;11: 2472–2482. 10.2174/156802611797470312 [DOI] [PubMed] [Google Scholar]
- 68.Hasegawa T, Tomita J, Hashimoto R, Ueno T, Kume S, Kume K. Sweetness induces sleep through gustatory signalling independent of nutritional value in a starved fruit fly. Sci Rep. 2017;7: 14355 10.1038/s41598-017-14608-1 [DOI] [PMC free article] [PubMed] [Google Scholar]
- 69.Sonn JY, Lee J, Sung MK, Ri H, Choi JK, Lim C, Choe J. Serine metabolism in the brain regulates starvation-induced sleep suppression in Drosophila melanogaster. Proc Natl Acad Sci USA. 2018;115: 7129–7134. 10.1073/pnas.1719033115 [DOI] [PMC free article] [PubMed] [Google Scholar]
- 70.Yurgel ME, Kakad P, Zandawala M, Nässel DR, Godenschwege TA, Keene AC. A single pair of leucokinin neurons are modulated by feeding state and regulate sleep–metabolism interactions. PLoS Biol. 2019;17: e2006409 10.1371/journal.pbio.2006409 [DOI] [PMC free article] [PubMed] [Google Scholar]
- 71.Linford NJ, Chan TP, Pletcher SD. Re-patterning sleep architecture in Drosophila through gustatory perception and nutritional quality. PLoS Genet. 2012;8: e1002668 10.1371/journal.pgen.1002668 [DOI] [PMC free article] [PubMed] [Google Scholar]
- 72.Linford NJ, Ro J, Chung BY, Pletcher SD. Gustatory and metabolic perception of nutrient stress in Drosophila. Proc Natl Acad Sci USA. 2015;112: 2587–2592. 10.1073/pnas.1401501112 [DOI] [PMC free article] [PubMed] [Google Scholar]
- 73.Broughton SJ, Slack C, Alic N, Metaxakis A, Bass TM, Driege Y, Partridge L. DILP-producing median neurosecretory cells in the Drosophila brain mediate the response of lifespan to nutrition. Aging Cell. 2010;9: 336–346. 10.1111/j.1474-9726.2010.00558.x [DOI] [PMC free article] [PubMed] [Google Scholar]
- 74.Fosque BF, Sun Y, Dana H, Yang CT, Ohyama T, Tadross MR, Patel R, Zlatic M, Kim DS, Ahrens MB, Jayaraman V, Looger LL, Schreiter ER. Neural circuits. Labeling of active neural circuits in vivo with designed calcium integrators. Science. 2015;347: 755–760. 10.1126/science.1260922 [DOI] [PubMed] [Google Scholar]
- 75.Gao XJ, Riabinina O, Li J, Potter CJ, Clandinin TR, Luo L. A transcriptional reporter of intracellular Ca(2+) in Drosophila. Nat Neurosci. 2015;18: 917–925. 10.1038/nn.4016 [DOI] [PMC free article] [PubMed] [Google Scholar]
- 76.Rulifson EJ, Kim SK, Nusse R. Ablation of insulin-producing neurons in flies: growth and diabetic phenotypes. Science. 2002;296: 1118–1120. 10.1126/science.1070058 [DOI] [PubMed] [Google Scholar]
- 77.Broughton S, Alic N, Slack C, Bass T, Ikeya T, Vinti G, Tommasi AM, Driege Y, Hafen E, Partridge L. Reduction of DILP2 in Drosophila triages a metabolic phenotype from lifespan revealing redundancy and compensation among DILPs. PLoS One. 2008;3: e3721 10.1371/journal.pone.0003721 [DOI] [PMC free article] [PubMed] [Google Scholar]
- 78.Post S, Karashchuk G, Wade JD, Sajid W, De Meyts P, Tatar M. Drosophila insulin-like peptides DILP2 and DILP5 differentially stimulate cell signaling and glycogen phosphorylase to regulate longevity. Front Endocrinol (Lausanne). 2018;9: 245 10.3389/fendo.2018.00245 [DOI] [PMC free article] [PubMed] [Google Scholar]
- 79.Birse RT, Soderberg JA, Luo J, Winther AM, Nässel DR. Regulation of insulin-producing cells in the adult Drosophila brain via the tachykinin peptide receptor DTKR. J Exp Biol. 2011;214: 4201–4208. 10.1242/jeb.062091 [DOI] [PubMed] [Google Scholar]
- 80.Sudhakar SR, Varghese J. Insulin signalling activates multiple feedback loops to elicit hunger-induced feeding in Drosophila bioRxiv. 2018. 10.1101/364554 [DOI]
- 81.Chung BY, Ro J, Hutter SA, Miller KM, Guduguntla LS, Kondo S, Pletcher SD. Drosophila neuropeptide F signaling independently regulates feeding and sleep-wake behavior. Cell Rep. 2017;19: 2441–2450. 10.1016/j.celrep.2017.05.085 [DOI] [PMC free article] [PubMed] [Google Scholar]
- 82.Ni JQ, Markstein M, Binari R, Pfeiffer B, Liu LP, Villalta C, Booker M, Perkins L, Perrimon N. Vector and parameters for targeted transgenic RNA interference in Drosophila melanogaster. Nat Methods. 2008;5: 49–51. 10.1038/nmeth1146 [DOI] [PMC free article] [PubMed] [Google Scholar]
- 83.Hendricks JC, Finn SM, Panckeri KA, Chavkin J, Williams JA, Sehgal A, Pack AI. Rest in Drosophila is a sleep-like state. Neuron. 2000;25: 129–138. 10.1016/s0896-6273(00)80877-6 [DOI] [PubMed] [Google Scholar]
- 84.Kubrak OI, Lushchak OV, Zandawala M, Nässel DR. Systemic corazonin signalling modulates stress responses and metabolism in Drosophila. Open Biol. 2016;6: 160152 10.1098/rsob.160152 [DOI] [PMC free article] [PubMed] [Google Scholar]