

Abstract
Apolipoprotein D (ApoD) gene expression is increased in several neurological disorders such as Alzheimer’s disease (AD) and multiple sclerosis. We previously showed that transgenic mice that overexpress human ApoD show a better resistance against paraquat or OC43 coronavirus-induced neurodegeneration. Here, we identified several nuclear factors from the cortex of control and OC43-infected mice which bind a fragment of the proximal ApoD promoter in vitro. Of interest, we detected apolipoprotein E (ApoE). Human ApoE consists of three isoforms (E2, E3, and E4) with the E4 and E2 alleles representing a greater and a lower risk for developping AD, respectively. Our results show that ApoE is located in the nucleus and on the ApoD promoter in human hepatic and glioblastoma cells lines. Furthermore, overexpression of ApoE3 and ApoE4 isoforms but not ApoE2 significantly inhibited the ApoD promoter activity in U87 cells (E3/E3 genotype) cultured under normal or different stress conditions while ApoE knock-down by siRNA had a converse effect. Consistent with these results, we also demonstrated by ChIP assay that E3 and E4 isoforms, but not E2, bind the ApoD promoter. Moreover, using the Allen Brain Atlas in situ hybridization database, we observed an inverse correlation between ApoD and ApoE mRNA expression during development and in several regions of the mouse brain, notably in the cortex, hippocampus, plexus choroid, and cerebellum. This negative correlation was also observed for cortex layers IV–VI based on a new Transcriptomic Atlas of the Mouse Neocortical Layers. These findings reveal a new function for ApoE by regulating ApoD gene expression.
Electronic supplementary material
The online version of this article (doi:10.1007/s12035-013-8456-0) contains supplementary material, which is available to authorized users.
Keywords: Apolipoprotein D, Apolipoprotein E, OC43, Mass spectrometry, ChIP, Glioblastoma astrocytic cells
Introduction
Human apolipoprotein D (ApoD) is a 29-kDa secreted glycoprotein and a member of the lipocalin superfamily [1, 2]. ApoD mRNA is expressed at high levels in several tissues particularly in the central nervous system (CNS) where it is produced in glia but also in scattered neurons (for review, see [3]). However, in contrast to other apolipoproteins, such as apolipoprotein E (ApoE), it is poorly expressed in liver and intestine. Moreover, its gene expression is increased in several neuropathologies such as Alzheimer’s disease (AD), meningoencephalitis, stroke [4], Parkinson’s [5], Niemann–Pick’s type C [6], and multiple sclerosis [7]. Furthermore, ApoD expression and proliferation are inversely correlated in response to cellular stress. This regulation of ApoD gene expression is reflected by the numerous cis elements located within its promoter [3, 8]. Several nuclear factors that bind the human ApoD promoter under growth arrest were identified. Notably, PARP-1, APEX-1, and ERK1/2 were found to regulate ApoD gene expression [9]. Despite several putative roles attributed to ApoD, such as repair and reinnervation as well as lipid turnover after nervous tissue injury [10, 11], the precise role of ApoD in the CNS remains elusive but accumulating evidences suggest a neuroprotective role as a repair protein.
ApoE is a 34-kDa secreted protein that was first identified in 1973 in association with very-low-density lipoprotein [12]. After the liver, the brain is the second site of expression for ApoE [13]. Three major ApoE isoforms exist in human population: ApoE2, ApoE3, and ApoE4, thus giving rise to six different genotypes. This genetic heterogeneity of ApoE is due to amino acid composition at positions 112 and 158 (E2, cys112/cys158; E4, arg112/arg158; and E3, cys112/arg158) [14, 15]. More importantly, ApoE is the major genetic marker associated with AD, the E4 and E2 alleles representing a greater and a lower risk for developing the disease, respectively [16, 17]. Since both ApoD and ApoE share common biological functions and are also implicated in neurodegenerative situations, it was of interest to investigate their respective regulation.
We previously showed that overexpression of human ApoD in transgenic mice treated with paraquat or infected with OC43 coronavirus (HCoVOC43) which both provoke brain inflammation and neurodegeneration confers a neuroprotection [18, 19]. Paraquat treatment is known to generate ROS and thus protein and lipid peroxidation [20]. HCoVOC43 are enveloped positive-stranded RNA viruses responsible for respiratory, enteric, and neurological diseases [21, 22]. Indeed, HCoVOC43 has neurotropic capabilities [23–25] and was also found in human brains [24]. Most importantly, several studies detected the OC43 virus in subjects with multiple sclerosis [26, 27] suggesting the involvement of a coronavirus in neurological disorders along with environmental and genetic factors [28].
Using this mouse model of neurodegenerative disease, we identified several nuclear factors from the cortex of control and OC43-infected-mice which bind in vitro a DNA fragment of the human ApoD promoter. We demonstrate that human ApoE isoforms E3 and E4 but not E2 bind the ApoD promoter in vivo and downregulate its gene expression. We also observed an inverse correlation between ApoD and ApoE expression in the mouse cortex using several databases. Overall, these results demonstrate a new fonction for ApoE by regulating the ApoD gene expression.
Materials and Methods
Cell Culture and Reagents
Human glioblastoma cells (U87 and U373M) were obtained from American Type Culture Collection (ATCC, Rockville, MD) and maintained in Dulbecco’s modified Eagle’s medium (DMEM; Invitrogen, Carlsbad, CA) supplemented with 10 % inactivated fetal bovine serum, penicillin G (100 units/ml) and streptomycin (100 μg/ml). All cells were maintained at 37 °C in a 5 % CO2-humidified atmosphere and were fed every 2 days with fresh medium.
Virus and Mice Infection
The American Type Culture Collection HCoV-OC43 strain (ATCC VR-759) was grown on the HRT-18 cell line, and virus stocks (106.5 tissue culture infectious dose 50 (TCID50)/ml) were kept at −80 °C as previously described [29]. Mice were infected at 22 days postnatal with intracerebral (IC) inoculation of 10 μl containing ten TCID50 of HCoV-OC43. Control mice received an IC inoculation of 10 μl of cell culture medium. Mice (C57BL/6) were killed at 7 days postinfection, and cortex was collected.
Nuclear Extract
Briefly, 200 mg of cortex of control (sham) or OC43-infected mice were homogenized in 500 μl of NE1 buffer (250 mM sucrose, 15 mM Tris–HCl pH 7.9, 140 mM NaCl, 2 mM EDTA, 0.5 mM EGTA, 20 % glycerol, 0.15 mM spermine, 0.5 mM spermidine, 1 mM DTT, 0.4 mM PMSF, 25 mM KCl, and 2 mM MgCl2). After homogeneization, 25 μl of Nonidet P-40 (Sigma Chemical) at 10 % were added followed by a second step of homogeneization. Lysates were cleared by 8 min of centrifugation at 1,000×g. The nucleus pellet was wash with 1 mL of NE1 buffer and was resuspended in 100 μL of NE2 buffer (buffer NE1 with 350 mM KCl) followed by homogenization and centrifugation for 5 min at 12,000×g. Organels were eliminated with centrifugation at 180,000×g for 90 min. The lysate were dialysed for 1 h with buffer D (50 mM KCl, 4 mM MgCl2, 20 mM K3PO4 pH 7.4, and 1 mM de β-mercaptoethanol) using 0.025 μm filter (Millipore) and kept at −80 °C until use. All steps of the extraction protocol were done at 4 °C. The protein concentration was determined at 595 nm using the Bio-Rad protein assay reagent (Bio-Rad Laboratories, Hercules, CA).
Affinity Purification of Nuclear Factors and Mass Spectrometry
The region −817 to +64 of the human ApoD promoter was amplified by PCR in six overlapping regions (1–6) using biotinylated primers (see Supplementary Fig. S1a, b). Fragments of approximatively 200 bp were obtained for each region. Streptavidin beads (200 μg; Dynabeads M-280 Strepavidin, Dynal Biotech, Oslo, Norway) were resuspended and incubated with 6 μg of biotinylated DNA (regions 1–6) for 15 min in W&B buffer (1×; 10 mM Tris–HCl, pH 7.5, 1 M NaCl, and 1 mM EDTA) as recommended by the manufacturer. The washing steps were done in the same buffer, and the beads linked with the biotinylated DNA were incubated for 15 min at room temperature with 100 μg of cortex nuclear extracts containing 20 μl of annealing buffer 10× (50 mM Tris–HCl, pH 7.5, 1 M NaCl, 100 mM MgCl2, 0.2 mM EDTA, and 1 mM DTT), 1 mg of BSA, and 20 μg of PolydI/dC in a final volume of 200 μl. The beads were washed with a low salt washing buffer (20 mM Tris–HCl, pH 8.0, 0.05 % NP-40, 1 mM EDTA, and 75 mM KCl) and eluted with 60 μl of SDS at 0.1 %. The proteins were loaded and migrated on a SDS-PAGE (12 %) followed by Coomassie blue staining. Each lane was cut in fortheen distinct bands eluted, trypsinized, and analyzed by mass spectrometry (LC-MS/MS velos) at the Genome Québec Innovation Centre Proteomics Platform (Montreal, QC, Canada) for protein identification. Proteins were identified by the presence of at least 1 distinct peptide in the sample with 99.9 % probability. Of note, no differences in band intensity were observed between each regions or conditions used for purification due to the sensibility of Coomassie blue staining. However, silver staining allowed to see clear differences between control or OC43 conditions for region 1 (Fig. 1c).
Fig. 1.
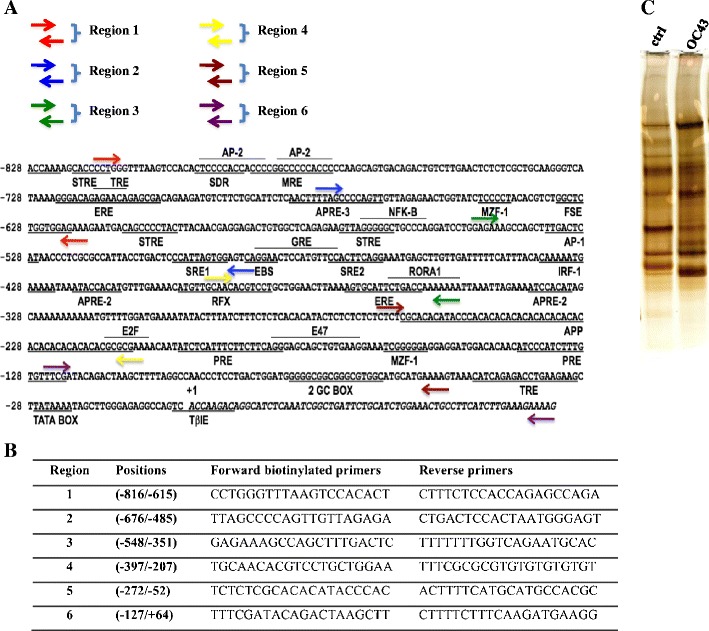
Sequence of the proximal ApoD promoter and biotinylated primers used for amplification of smaller overlapping regions. a Schematic representation of the 5′flanking region of the ApoD promoter (−828/+64) showing several known responsive elements [8, 41] and the positions of the primers (indicated with arrows of different colors). Six overlapping regions ((1–6) of the ApoD promoter were amplified by PCR. b Nucleotide sequence of the primers with their respective positions on the ApoD promoter. c Silver-stained SDS-PAGE showing differences in band intensity between control and OC43 nuclear extracts. Proteins were eluted from region 1
siRNA Transfections
For the siRNA experiments, two predesigned siRNA were used for human ApoE gene (si-ApoE1 and si-ApoE2; Qiagen), and negative control siRNA (Allstar negative control, Qiagen) were included in each experiment.
Luciferase Assays
The cDNA of human ApoE isoforms (E2, E3, and E4) were cloned in pCMV6 expression vector (Origene, Rockville, MD). Each plasmid was transiently co-transfected in U87 cells in the presence of Polyfect (Qiagen) as recommended by the manufacturer, with a vector containing the human ApoD promoter upstream of the luciferase reporter gene (−728/+4-ApoD-Luc). Twenty-four hours later, cells were rinsed twice with phosphate-buffered saline and maintained in a medium supplemented with 10 % serum containing 10 μg/ml lypopolysaccharide (LPS), low-serum medium containing 0.2 % serum, or normal medium containing 10 % serum. Transfected cells were lysed at different time post-transfection and luciferase activity was measured with the Dynex MLX microplate luminometer (MLX Dynex Technologies, Chantilly, VA). Each sample was co-transfected with a β-gal-expressing vector for normalization (pcDNA-lacZ). The β-galactosidase activity was measured using the Galacto-Light™ kit (Applied Biosystems, Bedford, MS) according to manufacturer's suggestions. Luciferase activity is presented in relative light units and represents the calculated mean ± SD of eight transfected samples normalized by the measured β-galactosidase activity.
Immunofluorescence and Confocal Microscopy
For immunofluorescence staining, U87 and U373M cells were grown on six-well plates (immunofluorescence) and Labtek chamber slides (confocal) and fixed with methanol for 30 min at −20 °C. After three washes with PBS, fixed cells were incubated in blocking (2 % goat serum) for 1 h. Cells were sequentially incubated with primary antibody (goat polyclonal antibody anti-ApoE, 1:100; obtained from Ross Milne, Ottawa Heart Institute) and then with fluorophore-labeled secondary antibody (alexa 488). For nucleus staining, cells were incubated with propidium iodide (1:300) (Sigma-Aldrich) for 10 min at room temperature.
Chromatin Immunoprecipitation
Chromatin immunoprecipitation (ChIP) assay was performed on human glioblastoma U87 and hepatic HepG2 cells according to the manufacturer protocol (Zm Tech Scientifique). Briefly, cells were cross-linked with 1 % formaldehyde and quenched with 0.125 M glycine. After sonication, chromatin was immunoprecipitated with anti-ApoE polyclonal or anti-DDK monoclonal antibodies (Origene). After several washes and DNA purification, semi-quantitative PCR was performed using specific primers for the ApoD promoter (−397 to +64; Fig. 1b).
Analysis of Gene Expression in Allen Brain Atlas, GENSAT, and the Transcriptomic Atlas of the Mouse Neocortical Layers
The Allen Brain Atlas (ABA; www.brain-map.org) [30] and GENSAT (www.gensat.org) [31] projects are public databases and useful resources to study the expression of genes in the mouse brain as well as during development. The ABA database mapped the expression of the whole mouse transcriptome (over 20,000 genes mRNA expression) by in situ hybridization (ISH) technique. The expression levels of ISH images are also quantified by color intensity as described in the website. The ISH images for ApoD and ApoE were selected from this database from 56 days old mice in order to compare their expression pattern in the adult mouse brain. Comparisons were also carried throughout development (from P4 to 24 months for ApoD and 33 months for ApoE) (see Figs. S1and S2).
In the Transcriptomic Atlas of the Mouse Neocortical Layers (http://genserv.anat.ox.ac.uk/layers), cortical layers were separated in sections (A–F) from somatosensory (S1), dorsal cortex (DC), and lateral cortex (LC) and in which the transcriptome was sequenced [32]. The relative expression for each genes is represented in fragments per kilobase of exon model per million reads mapped (FPKMs) values (Table 2). Sections A to F correspond to layers I–III, layer IV, upper layer V, lower layer V, layer VI, and layer VIb, respectively [32]. Correlation between expression of each gene was calculated using the Pearson’s correlation test.
Table 2.
FPKMs values for ApoD and ApoE genes
| Gene | Gene ID | FPKM | ||||||
|---|---|---|---|---|---|---|---|---|
| Somatosensory cortex | A | B1 | B2 | C | D | E | F | |
| ApoD | ENSMUSG00000002985 | 78.5686 | 20.2918 | 33.3066 | 46.2856 | 58.6014 | 101.871 | 293.871 |
| ApoE | ENSMUSG00000002985 | 1,484.84 | 897.763 | 664.742 | 563.017 | 507.324 | 423.845 | 750.515 |
| Dorsal cortex | DCA | DCB | DCC | DCD | DCE | DCF | ||
| ApoD | ENSMUSG00000002985 | 169.173 | 43.2737 | 67.7391 | 110.61 | 164.592 | 273.522 | |
| ApoE | ENSMUSG00000002985 | 3,392.72 | 2,709.79 | 2,471.74 | 2,103.72 | 1,879.52 | 824.348 | |
| Lateral cortex | LCA | LCB | LCC | LCD | LCE | LCF | ||
| ApoD | ENSMUSG00000002985 | 150.411 | 96.6178 | 107.019 | 113.292 | 174.006 | 181.347 | |
| ApoE | ENSMUSG00000002985 | 4,637.85 | 3,191.89 | 2,196.49 | 1,668.19 | 1,826.03 | 1,501.04 | |
The FPKMs values were obtained from Ref. [32]. FPKMs values for ApoD and ApoE in the six-section layers (from superficial to deep layers (A–F)) of somatosensory cortex (S1), dorsal cortex (DC), and lateral cortex (LC). For somatosensory cortex (S1), section B was done in duplicate
FPKM fragments per kilobase of exon model per million reads mapped
Statistical Analysis
Statistical significance of the experiments was evaluated using an unpaired Student's t test. Results were considered statistically significant at P < 0.05.
Results
Purification and Identification of Nuclear Factors Binding the Proximal Human ApoD Promoter In Vitro
We previously showed that ApoD gene expression is upregulated in the brain of human OC43 virus-infected mice [19]. In order to better understand the regulation of ApoD gene expression, we purified the nuclear factors that bind the ApoD promoter using nuclear extracts from the cortex of control and OC43-infected mice. Six overlapping regions of the ApoD promoter (−816/+64) were amplified by PCR using biotinylated primers and then linked to streptavidin beads (see “Materials and Methods”; Fig. 1a, b). After incubation with nuclear extracts, the specific proteins were eluted from the DNA-streptavidin complex, visualized by SDS-PAGE followed by Coomassie blue staining. Protein bands were then eluted and analyzed by mass spectrometry. Because of low sensibility of Coomassie blue, silver staining was used for samples obtained from region 1 and allowed to see clear differences between control and OC43 conditions (Fig. 1c).
Several transcription factors were identified ,such as Stat1, Daxx, transcriptional activator Pur-α and Pur-β, Ilf-2, and Ilf-3 (also known as nuclear factors 45 and 90, respectively), and several members of the HDAC, heat shock proteins, DDX, MAPK, importin, dynein, and kinesin families, just to name a few (unpublished data). Proteins implicated in neurodegenerative diseases, including AD, Parkinson’s disease, and Huntington’s disease and known not only for their tendency to aggregate but also to bind DNA nonspecifically (for review, see [33]), were also purified. In particular, we detected microtubule-associated protein tau, amyloid-β (Aβ) A4, alpha- and beta-synuclein, superoxyde dismutase (Cu–Zn and Mn), Huntingtin, Huntingtin-interacting protein K, Huntingtin-interacting protein-related-1, and ataxin-10 (unpublished data). More interestingly, we identified proteins which are not recognized in the literature to bind DNA. Of particular interest, we found ApoE, clusterin (CLU; also known as ApoJ), phosphatidylinositol-binding clathrin assembly protein (PICALM), bridging integretor 1, high-density lipoprotein-binding protein (HDL-BP), and alpha-2-macroglobulin receptor-associated protein also known as low-density lipoprotein receptor-related protein-associated protein 1 (LRPAP1) (Table 1). Due to the novelty of ApoE binding to DNA and its association with neurodegenerative diseases, we further investigated the implication of this protein on ApoD gene regulation. ApoE was detected in both conditions in regions 1, 2, and 3 and only in control nuclear extracts in regions 4, 5, and 6 (Table 1).
Table 1.
Selected identified proteins from the mass spectrometry analysis binding the ApoD promoter
| Protein ID | Acct. No. | Region 1 | Region 2 | Region 3 | Region 4 | Region 5 | Region 6 | ||||||
|---|---|---|---|---|---|---|---|---|---|---|---|---|---|
| Ctrl | OC43 | Ctrl | OC43 | Ctrl | OC43 | Ctrl | OC43 | Ctrl | OC43 | Ctrl | OC43 | ||
| ApoE | P08226 | 4 | 3 | 3 | 2 | 3 | 3 | 2 | 0 | 4 | 0 | 2 | 0 |
| Clu/apoJ | Q06890 | 4 | 2 | 6 | 0 | 5 | 3 | 3 | 4 | 2 | 4 | 4 | 3 |
| HDL-BP | Q3V1M8 | 7 | 15 | 8 | 15 | 7 | 12 | 5 | 10 | 6 | 13 | 5 | 9 |
| LRPAP1a | Q3V1M8 | 0 | 0 | 2 | 1 | 0 | 2 | 0 | 0 | 2 | 0 | 0 | 2 |
| BIN1 | O08539 | 33 | 26 | 20 | 25 | 28 | 27 | 31 | 24 | 26 | 29 | 28 | 22 |
| PICALM | Q3TD51 | 4 | 6 | 3 | 5 | 5 | 3 | 0 | 6 | 3 | 6 | 2 | 5 |
Nuclear extracts from the cortex of control (Ctrl) or OC43-infected mice were incubated with six overlapping regions (1–6) of the ApoD promoter (approximately 200 bp for each region) bound to streptavidin beads. The bound proteins were eluted and analyzed by SDS-PAGE and silver staining. Each well was cut in 14 distinct bands, eluted, and analyzed by mass spectrometry analysis (LC-MSMS velos) after tryptic digestion. For each region, the number of peptides which allowed protein identification are indicated. Unless otherwise indicated, all proteins were identified with peptides with a minimum of 99.9 % probability
LRPAP1 low-density lipoprotein receptor-related protein-associated protein 1, MW molecular weight
aA probability of 99.0 %
ApoE Localizes in the Nucleus of U87, U373M, and HepG2 Cell Lines
Several studies already reported the nuclear localization of ApoE in different cell types such as human forskin fibroblast (AG01518), Chinese-hamster ovary cells, ovarian cancer cells, and from various rat tissue cells such as brain and liver [34–38]. We performed immunofluorescence and confocal microscopy to investigate the possible nuclear localization of ApoE in glioblastoma astrocytic cells (U87 and U373M; Fig. 2) cultured in normal conditions. ApoE was found predominantly in the cytoplasm and to a lesser extent in the nucleus in a punctate pattern. The same pattern of nuclear localization was also seen in human hepatic cells HepG2 (data not shown).
Fig. 2.

Analysis of cellular localization of ApoE in U87 and U373 cells. Cells were grown at approximately 50 % confluence, fixed and immunostained using a specific ApoE antibody and Alexa Fluor 488-conjugated secondary antibody (green fluorescence). The nucleus was stained with propidium iodine (PI; red fluorescence), and cells were observed by immunofluorescence (a) and confocal microscopy (b)
ApoE3 and E4 Bind the ApoD Promoter In Vivo
Since ApoE was found in the nucleus, we investigated its binding to DNA. The binding specificity of ApoE on the ApoD promoter was verified by ChIP assay. We found that the ApoD promoter was immunoprecipited by both ApoE and TFIID (positive control) antibodies in U87, U373M, and HepG2 cells (Fig. 3a). When overexpressing the different isoforms of ApoE (E2, E3, and E4) tagged with DDK in U87 cells, we demonstrated that only E3 and E4 but not E2 could be detected on the ApoD promoter compared with the control (empty pCMV6 vector; Fig. 3b). These results are consistent with the fact that the U87 and HepG2 cells genotype is E3/E3 [39]. However, to our knowledge, the ApoE genotype of U373M cells is unknown.
Fig. 3.
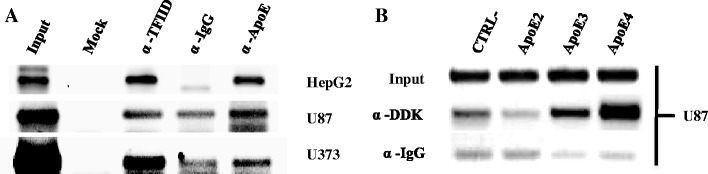
ApoE interacts with the ApoD promoter in vivo. a Human hepatic (HepG2) and glioblastoma (U87 and U373) cells were collected for chromatin immunoprecipitation assays. The input and chromatin immunoprecipitation products were amplified by PCR reactions corresponding to the region −397 to +64 of the ApoD promoter. The input represents 10 % of the cell lysate. Mock no antibody, α-TFIID positive control, α-IgG (secondary goat) negative control. b U87 cells transfected with ApoE cDNA isoforms tagged with DDK and treated as in (a)
ApoE3 and E4 Repress the ApoD Promoter Activity
Since both mouse and human ApoE proteins were detected on the human ApoD promoter by mass spectrometry analysis and ChIP assay, we next attempted to determine if ApoE could regulate ApoD expression in U87 cells under different stress conditions. Indeed, we previously demonstrated that both mouse and human ApoD gene expression is upregulated in several stress conditions such as growth arrest and inflammation in different cell lines, more precisely in human astrocytic cells (U373) and NIH/3T3 murine fibroblasts [40, 41]. Therefore, U87 cells were co-transfected with the different ApoE isoforms cDNA in pCMV6 vector and a construct containing the ApoD promoter upstream of the luciferase reporter gene (−728/+4-ApoD-pGL3). The luciferase activity was analyzed in normal (10 % serum), serum-starved (0.2 % serum), and inflammatory conditions (LPS; 10 μg/ml). At 24-h post-transfection (Fig. 4a), both ApoE3 and E4 repressed the ApoD promoter activity in normal and serum-starved conditions compared with the control (empty vector) while E2 isoform had no effect. In inflammatory conditions, the ApoD promoter was repressed in the control, but this repression was less prominent in the presence of E2. Moreover, E4 isoform repressed the ApoD promoter activity compared with the control, with E3 having no effect.
Fig. 4.
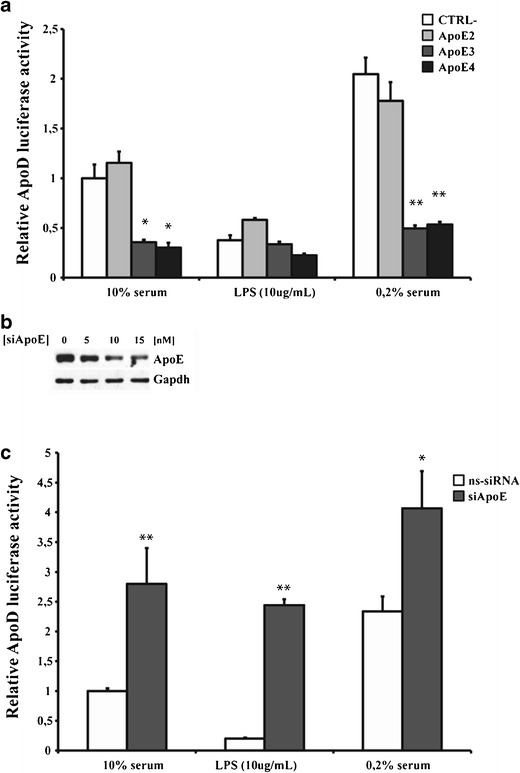
Regulation of the ApoD promoter by ApoE isoforms. Human glioblastoma U87 cells were co-transfected with vectors containing a luciferase reporter construct under the 5′-flanking region (−728/−4) of the ApoD promoter gene, the cDNA corresponding to the three ApoE isoforms (E2, E3, and E4), the plasmid pcDNA-LacZ and the control (CTRL−) corresponding to the empty vector. After transfection, cells were cultured in media with serum (10 %; white bars) or without serum (0.2 %; grey bars) or with lipopolysaccharide (LPS, 10 μg/ml) for 24 h (a). Western blot analysis of ApoE in cells transfected by specific siRNA at different concentrations to document expression inhibition (b). Effect of specific siRNA against ApoE (siApoE; dark grey bars) or nonspecific siRNA (ns-siRNA; negative control) on the ApoD promoter activity 48 h post-transfection (d)
Furthermore, we used specific siRNA against ApoE gene to verify if the repressive activity of E3 isoform in U87 cells could be reversed since this cell line harbors a E3/E3 genotype. Indeed, blocking the expression of ApoE in U87 cells for up to 48 h post-transfection of specific siRNA (siApoE) (Fig. 4b), significantly transactivated the ApoD promoter in all conditions tested (Fig. 4c). These results show that ApoE3 and E4 negatively regulate ApoD gene expression.
ApoD and ApoE Expression Correlation in the Mouse Cortex Layers
Using the FPKMs values for each genes from the Transcriptomic Atlas of the Mouse Neocortical Layers (Table 2), we applied a Pearson’s correlation test between ApoE and ApoD gene expression (Table 3). We did not observed expression correlation between ApoE and ApoD genes for sections A–F (r = 0,05; Table 3). However, for sections B–F, the expression of ApoD and ApoE is negatively correlated in dorsal cortex and lateral cortex (r = −0.85; p < 0.005). This negative correlation is not observed in somatosensory S1 probably due to an upregulation of ApoE expression in section F which is not observed in dorsal or lateral cortex (Table 2, indicated in bold). A positive correlation between ApoD and ApoE gene expression was observed for sections A and B in somatosensory S1, dorsal and lateral cortex (r = 0.82; p < 0.05).
Table 3.
Pearson’s correlation of ApoE expression compared with ApoD gene expression
| Protein | Gene ID | Pearson’s coefficient correlation | ||
|---|---|---|---|---|
| S1-DC-LC (A–F) | DC-LC (A and B) | DC-LC (B–F) | ||
| ApoE | ENSMUSG00000002985 | 0.05 | 0.82* | −0.85** |
Pearson’s correlation was calculated from FPKMs values shown in Table 2
FPKM fragments per kilobase of exon model per million reads mapped, S1-DC-LC (A–F) the coefficient correlation values were calculated for all samples (A–F) in somatosensory (S1), dorsal cortex (DC), and lateral cortex (LC), DC-LC (A and B) the coefficient correlation values were calculated only for samples (A and B), DC-LC (B–F) the coefficient values were calculated for samples (B–F) in dorsal and lateral cortex
*p < 0.05; **p < 0.005
Discussion
The ApoD gene is upregulated in several neuropathological disorders, such as AD, menogoencephalitis [4], multiple sclerosis [7], and Parkinson’s disease [5]. ApoD concentrations are increased by 350 and 60 % in the cerobrospinal fluid (CSF) and hippocampus, respectively, of patients with AD compared with normal subjects [4]. ApoD gene expression is also upregulated in the CNS of mice infected with viruses, which cause encephalitis, such as herpes simplex type-I virus [42], Sindbis virus [43], Japanese encephalitis virus [44], rabies virus [45], and human coronavirus OC43 [19]. In OC43-infected mice, ApoD gene expression was found upregulated by five- and sevenfold in the cortex and hippocampus, respectively. Several studies have speculated a neuronal protective role for ApoD [5, 11, 46–51] and overexpression of ApoD in neurons of transgenic mice confers neuroprotection [18, 19] and/or an improved repair potential.
The study presented herein reports the identification of several nuclear factors, from the cortex of control and OC43-infected mice, that bind the human ApoD promoter. Among the nuclear factors identified, we were particularly interested in the ApoE DNA-binding properties mostly because these two genes share common biological features. More precisely, both ApoD and ApoE proteins vary in concentration in several neurodegeneratives diseases, binds to HDL [52], are involved in regenerative and reinnervation in the peripheral nervous system [10, 53]. Their expression is regulated after enthorinal cortex lesioning of the rat brain [11] and in several stress conditions, such as growth arrest caused by serum deprivation [35, 41, 54] and inflammation [40]. Moreover, under stress conditions, ApoD [40] and ApoE [34, 35, 40] were shown to enter the nucleus. Finally, both proteins colocalize with Aβ within senile plaques and neurofibrillary tangles of AD brain tissue [51, 55, 56].
Using streptavidin beads and biotinylated PCR-amplified DNA complex, we showed that ApoE binds to all six regions of the ApoD promoter from nuclear extracts obtained from the cortex of either control or OC43-infected mice (Table 1). These results show that ApoE may be constitutively bound on the ApoD promoter in both normal and pathological conditions and demonstrate for the first time a DNA-binding activity for ApoE. Since ApoE does not contain any DNA-binding domain or NLS, we speculate that it binds the ApoD promoter by interaction with another nuclear protein. Despite this fact, ApoE nuclear localization has already been demonstrated in several cell types and tissues, including brain and liver [35–38]. Here, we confirm that ApoE is localized to the nucleus of human hepatic and glioblastoma cells (Fig. 2) and we clearly demonstrate by ChIP assays that E3 and E4 isoforms, but not E2, could bind the ApoD promoter in vivo (Fig. 3).
The mechanism by which ApoE may escape the secretory or endocytic pathways and be directed to the nucleus is still obscure. It is quite possible that ApoE enters the cytoplasm through interaction with cellular receptors such as low density lipoprotein receptor (LDLr) or LDLr-related familly members (LRP) and once inside the cytoplasm could migrate to the nucleus via importins or nucleolin [57, 58]. We did not identify any known ApoE binding receptors among those factors binding the ApoD promoter but several functional related ApoE proteins were identified such as LRPAP1, ApoJ, and HDL-BP (Table 1). Interestingly, ApoJ is also implicated in several aspects of AD. Effectively, its gene expression is induced in AD [59] and plays pleiotropic functions such as removal of Aβ peptides and fibrils, brain cholesterol and lipid homeostasis in association with ApoE (for review, see [60]). Moreover, ApoJ is localized in the nucleus in complex with Ku70, a DNA binding subunit of DNA-dependent protein kinase (DNA-PK) [61]. Also, several genome-wide association studies have identify and associated PICALM, BIN1, and CLU genetic polymorphisims with AD (for review, see [62]), which were all found on the ApoD promoter. PICALM and BIN1 are both associated with clathrin endocytic pathways [63, 64].
Despite the fact that several studies have clearly demonstrated the presence of ApoE in the nucleus, its underlying role in this organelle remains unclear. It was speculated that ApoE could play a role in transcriptional activity [34, 37, 65]. In this present work, we clearly demonstrated that ApoE is implicated directly at the promoter level in gene transcription regulation. Indeed, overexpression of E3 and E4 isoforms significantly inhibited the ApoD promoter in normal and serum-starved conditions 24 h post-transfection while E2 had no effect (Fig. 4a). Unexpectedly, in inflammatory conditions, the ApoD promoter appeared repressed in contradiction with previous findings [40]. This apparent discrepency is very likely due to the incubation time used (24 h in this study versus 3–6 days). Moreover, ApoE gene expression is upregulated by LPS in astrocytes and monocytes but repressed in macrophages [66]. Therefore, inhibition of ApoD promoter activity in presence of LPS may be due to endogenous induction of ApoE gene in U87 cells. Also specific siRNA directed against ApoE gene releived the ApoD promoter from repression (Fig. 4c). In this experiment, only the ApoE3 isoform could be targeted with a specific siRNA due to the E3/E3 genotype of U87 cells [39]. Since a neuroprotective role for ApoD has been proposed, the fact that the E4 and E2 alleles represent a greater and a lower risk for developping AD, respectively is in agreement with our results of the effect of these isoforms on the ApoD promoter activity. In contrast, the repressive activity of E3 isoform on the ApoD promoter does not correlates well with ApoD neuroprotective role since the E3 allele is considered more beneficial than E4 in AD. Considering the clearly established neuroprotective role of ApoD, it is tempting to speculate that the neuroprotective action of ApoE2 is due to the fact that it does not inhibit ApoD expression. It would be interesting to further investigate this mechanism of regulation of the ApoD promoter by ApoE isoforms using glioblastoma cell lines with different ApoE genotype (E2/E2 and E4/E4) and also using knock-in mice for each human ApoE isoforms. Such experiments will clearly clarify the overall picture regarding the role of each ApoE isoforms on ApoD gene regulation.
In human brain, ApoD gene regulation is positively correlated with age at the opposite for ApoE [56, 67–70]. Interestingly, it was demonstrated that the increase of ApoD and decrease of ApoE concentrations in the CSF and brain respectively of AD patients are correlated in a dose-dependent manner with inheritance of the E4 allele [4, 39, 71, 72]. This correlation is also observed in the cortex, cerrebellum and hippocampus of ApoE-KO mice where ApoD protein expression is increased [4, 73]. Also, the expression of ApoD and ApoE genes is differentially modulated in rats hippocampus 4 days after entorhinal cortex lesioning where ApoD is upregulated ipsilaterally and ApoE downregulated bilaterally [4]. Perdomo and Dong [74] also reported an increase of ApoD plasma levels in a mouse model of atherosclerosis using 3 months old ApoE-KO mice.
Based on the ABA database, we observed qualitatively that ApoD and ApoE mRNA expression are inversely correlated in the mouse cortex during development (Fig. S1) and also in several brain regions of 56 days old mice (Fig. S2). Effectively, ApoE mRNA appears strongly expressed in the cortex, hippocampus and plexus choroid (Fig. S2b–d) in contrast to ApoD gene expression. Furthermore, this inverse correlation was also observed in a transcriptomic atlas of the mouse brain neocortex for layers IV–VI corresponding to section B–F (Table 3). However, a positive correlation was shown in cortex layers I–IV corresponding to section A–B which is apparently attributable to higher ApoD expression in sample A relative to sample B (Table 3). ISH data from the ABA database in developing brain (Fig. S1) and previous work suggest that ApoD mRNA, like ApoE, is expressed in the pia mater of the subarachnoid space in monkey and rabbit brain [75, 76], some of which could have been swept into the dissection of section B. These cells and the perivasicular fibroblasts of the subarachnoidal space derive from different lineages. It is thus possible that, in those particular cell lineages such a negative regulatory relationship is overpowered by other transcription factors. The significant negative correlation seen elsewhere (samples B–F corresponding to cortex layers IV–VI) is certainly consistent with our experimental findings of a negative regulatory relationship in glia. However, the cell-type specificities of ApoE and ApoD could be an alternative explanation. Indeed, the expression profile of ApoE is quite similar to the expression profile of many astrocyte-specific genes while the expression profile of ApoD is similar to the expression profile of many oligodendrocyte-specific genes [77].
In conclusion, several proteins were identified that bind the ApoD promoter in vitro from a mouse model of acute encephalitis induced upon infection by the human OC43 coronavirus. Our results demonstrate a novel function for ApoE through binding and regulating the ApoD promoter. We also observe an inverse correlation between the ApoE and ApoD gene expression in most regions of the mouse brain as well as during development. This inverse correlation certainly requires further investigations. Moreover, ApoE could, as a potential transcription factor, be involved in several neuropathological disorders.
Electronic Supplementary Materials
Below is the link to the electronic supplementary material.
Representative ISH of ApoD and ApoE genes in the mouse cortex during development. These images were obtained from the ABA Website (http://www.brainmap.org) with their corresponding relative gene expression intensities. Comparisons were made throughout development, from E.18.5 to 24 months for ApoD and 33 months for ApoE. (PPT 5051 kb)
Representative in situ hybridations of ApoD and ApoE genes in the mouse brain. These images were obtained from the ABA Website (http://www.brain-map.org) with their corresponding relative gene expression intensities in different brain areas of 56-day-old mice. a Total brain. b Hippocampus. Field CA1, CA2, CA3, DG, and dentate gyrus. c Cerebral cortex (isocortex). Layers I–VI; CC corpus collasum. d Plexus choroid. e Cerebellar cortex. ML molecular layer, PL Purkinge layer, GL granular layer. (PPT 2174 kb)
Acknowledgments
We gratefully acknowledge support from the Canadian Institutes for Health Research to ER (Grant MOP-15677). We thank Sonia Do Carmo and Grant Belgard for helpful discussion.
References
- 1.Drayna DT, McLean JW, Wion KL, Trent JM, Drabkin HA, Lawn RM. Human apolipoprotein D gene: gene sequence, chromosome localization, and homology to the alpha 2u-globulin superfamily. DNA. 1987;6(3):199–204. doi: 10.1089/dna.1987.6.199. [DOI] [PubMed] [Google Scholar]
- 2.Flower DR. The lipocalin protein family: structure and function. Biochem J. 1996;318(Pt 1):1–14. doi: 10.1042/bj3180001. [DOI] [PMC free article] [PubMed] [Google Scholar]
- 3.Rassart E, Bedirian A, Do Carmo S, Guinard O, Sirois J, Terrisse L, Milne R. Apolipoprotein D. Biochim Biophys Acta. 2000;1482(1–2):185–198. doi: 10.1016/S0167-4838(00)00162-X. [DOI] [PubMed] [Google Scholar]
- 4.Terrisse L, Poirier J, Bertrand P, Merched A, Visvikis S, Siest G, Milne R, Rassart E. Increased levels of apolipoprotein D in cerebrospinal fluid and hippocampus of Alzheimer's patients. J Neurochem. 1998;71(4):1643–1650. doi: 10.1046/j.1471-4159.1998.71041643.x. [DOI] [PubMed] [Google Scholar]
- 5.Ordonez C, Navarro A, Perez C, Astudillo A, Martinez E, Tolivia J. Apolipoprotein D expression in substantia nigra of Parkinson disease. Histol Histopathol. 2006;21(4):361–366. doi: 10.14670/HH-21.361. [DOI] [PubMed] [Google Scholar]
- 6.Yoshida K, Cleaveland ES, Nagle JW, French S, Yaswen L, Ohshima T, Brady RO, Pentchev PG, Kulkarni AB. Molecular cloning of the mouse apolipoprotein D gene and its upregulated expression in Niemann–Pick disease type C mouse model. DNA Cell Biol. 1996;15(10):873–882. doi: 10.1089/dna.1996.15.873. [DOI] [PubMed] [Google Scholar]
- 7.Reindl M, Knipping G, Wicher I, Dilitz E, Egg R, Deisenhammer F, Berger T. Increased intrathecal production of apolipoprotein D in multiple sclerosis. J Neuroimmunol. 2001;119(2):327–332. doi: 10.1016/S0165-5728(01)00378-2. [DOI] [PubMed] [Google Scholar]
- 8.Lambert J, Provost PR, Marcel YL, Rassart E. Structure of the human apolipoprotein D gene promoter region. Biochim Biophys Acta. 1993;1172(1–2):190–192. doi: 10.1016/0167-4781(93)90292-L. [DOI] [PubMed] [Google Scholar]
- 9.Levros LC, Jr, Do Carmo S, Edouard E, Legault P, Charfi C, Rassart E. Characterization of nuclear factors modulating the apolipoprotein D promoter during growth arrest: implication of PARP-1, APEX-1 and ERK1/2 catalytic activities. Biochim Biophys Acta. 2010;1803(9):1062–1071. doi: 10.1016/j.bbamcr.2010.04.011. [DOI] [PMC free article] [PubMed] [Google Scholar]
- 10.Boyles JK, Notterpek LM, Anderson LJ. Accumulation of apolipoproteins in the regenerating and remyelinating mammalian peripheral nerve. Identification of apolipoprotein D, apolipoprotein A-IV, apolipoprotein E, and apolipoprotein A-I. J Biol Chem. 1990;265(29):17805–17815. [PubMed] [Google Scholar]
- 11.Terrisse L, Seguin D, Bertrand P, Poirier J, Milne R, Rassart E. Modulation of apolipoprotein D and apolipoprotein E expression in rat hippocampus after entorhinal cortex lesion. Brain Res Mol Brain Res. 1999;70(1):26–35. doi: 10.1016/S0169-328X(99)00123-0. [DOI] [PubMed] [Google Scholar]
- 12.Shore VG, Shore B. Heterogeneity of human plasma very low density lipoproteins. Separation of species differing in protein components. Biochemistry. 1973;12(3):502–507. doi: 10.1021/bi00727a022. [DOI] [PubMed] [Google Scholar]
- 13.Mahley RW. Apolipoprotein E: cholesterol transport protein with expanding role in cell biology. Science. 1988;240(4852):622–630. doi: 10.1126/science.3283935. [DOI] [PubMed] [Google Scholar]
- 14.Weisgraber KH, Rall SC, Jr, Mahley RW. Human E apoprotein heterogeneity. Cysteine-arginine interchanges in the amino acid sequence of the Apo-E isoforms. J Biol Chem. 1981;256(17):9077–9083. [PubMed] [Google Scholar]
- 15.Rall SC, Jr, Weisgraber KH, Mahley RW. Human apolipoprotein E. The complete amino acid sequence. J Biol Chem. 1982;257(8):4171–4178. [PubMed] [Google Scholar]
- 16.Corder EH, Saunders AM, Risch NJ, Strittmatter WJ, Schmechel DE, Gaskell PC, Jr, Rimmler JB, Locke PA, Conneally PM, Schmader KE, et al. Protective effect of apolipoprotein E type 2 allele for late onset Alzheimer disease. Nat Genet. 1994;7(2):180–184. doi: 10.1038/ng0694-180. [DOI] [PubMed] [Google Scholar]
- 17.Corder EH, Saunders AM, Strittmatter WJ, Schmechel DE, Gaskell PC, Small GW, Roses AD, Haines JL, Pericak-Vance MA. Gene dose of apolipoprotein E type 4 allele and the risk of Alzheimer's disease in late onset families. Science. 1993;261(5123):921–923. doi: 10.1126/science.8346443. [DOI] [PubMed] [Google Scholar]
- 18.Ganfornina MD, Do Carmo S, Lora JM, Torres-Schumann S, Vogel M, Allhorn M, Gonzalez C, Bastiani MJ, Rassart E, Sanchez D. Apolipoprotein D is involved in the mechanisms regulating protection from oxidative stress. Aging Cell. 2008;7(4):506–515. doi: 10.1111/j.1474-9726.2008.00395.x. [DOI] [PMC free article] [PubMed] [Google Scholar]
- 19.Do Carmo S, Jacomy H, Talbot PJ, Rassart E. Neuroprotective effect of apolipoprotein D against human coronavirus OC43-induced encephalitis in mice. J Neurosci. 2008;28(41):10330–10338. doi: 10.1523/JNEUROSCI.2644-08.2008. [DOI] [PMC free article] [PubMed] [Google Scholar]
- 20.Beal MF. Oxidatively modified proteins in aging and disease. Free Radic Biol Med. 2002;32(9):797–803. doi: 10.1016/S0891-5849(02)00780-3. [DOI] [PubMed] [Google Scholar]
- 21.Buchmeier MJ, Lane TE. Viral-induced neurodegenerative disease. Curr Opin Microbiol. 1999;2(4):398–402. doi: 10.1016/S1369-5274(99)80070-8. [DOI] [PMC free article] [PubMed] [Google Scholar]
- 22.Myint S, Johnston S, Sanderson G, Simpson H. Evaluation of nested polymerase chain methods for the detection of human coronaviruses 229E and OC43. Mol Cell Probes. 1994;8(5):357–364. doi: 10.1006/mcpr.1994.1052. [DOI] [PMC free article] [PubMed] [Google Scholar]
- 23.Arbour N, Cote G, Lachance C, Tardieu M, Cashman NR, Talbot PJ. Acute and persistent infection of human neural cell lines by human coronavirus OC43. J Virol. 1999;73(4):3338–3350. doi: 10.1128/jvi.73.4.3338-3350.1999. [DOI] [PMC free article] [PubMed] [Google Scholar]
- 24.Arbour N, Day R, Newcombe J, Talbot PJ. Neuroinvasion by human respiratory coronaviruses. J Virol. 2000;74(19):8913–8921. doi: 10.1128/JVI.74.19.8913-8921.2000. [DOI] [PMC free article] [PubMed] [Google Scholar]
- 25.Bonavia A, Arbour N, Yong VW, Talbot PJ. Infection of primary cultures of human neural cells by human coronaviruses 229E and OC43. J Virol. 1997;71(1):800–806. doi: 10.1128/jvi.71.1.800-806.1997. [DOI] [PMC free article] [PubMed] [Google Scholar]
- 26.Boucher A, Desforges M, Duquette P, Talbot PJ. Long-term human coronavirus-myelin cross-reactive T-cell clones derived from multiple sclerosis patients. Clin Immunol. 2007;123(3):258–267. doi: 10.1016/j.clim.2007.02.002. [DOI] [PMC free article] [PubMed] [Google Scholar]
- 27.Talbot PJ, Arnold D, Antel JP. Virus-induced autoimmune reactions in the CNS. Curr Top Microbiol Immunol. 2001;253:247–271. doi: 10.1007/978-3-662-10356-2_12. [DOI] [PubMed] [Google Scholar]
- 28.Yeh EA, Collins A, Cohen ME, Duffner PK, Faden H. Detection of coronavirus in the central nervous system of a child with acute disseminated encephalomyelitis. Pediatrics. 2004;113(1 Pt 1):e73–e76. doi: 10.1542/peds.113.1.e73. [DOI] [PubMed] [Google Scholar]
- 29.Jacomy H, Talbot PJ. Vacuolating encephalitis in mice infected by human coronavirus OC43. Virology. 2003;315(1):20–33. doi: 10.1016/S0042-6822(03)00323-4. [DOI] [PMC free article] [PubMed] [Google Scholar]
- 30.Lein ES, Hawrylycz MJ, Ao N, Ayres M, Bensinger A, Bernard A, Boe AF, Boguski MS, Brockway KS, Byrnes EJ, Chen L, Chen L, Chen TM, Chin MC, Chong J, Crook BE, Czaplinska A, Dang CN, Datta S, Dee NR, Desaki AL, Desta T, Diep E, Dolbeare TA, Donelan MJ, Dong HW, Dougherty JG, Duncan BJ, Ebbert AJ, Eichele G, Estin LK, Faber C, Facer BA, Fields R, Fischer SR, Fliss TP, Frensley C, Gates SN, Glattfelder KJ, Halverson KR, Hart MR, Hohmann JG, Howell MP, Jeung DP, Johnson RA, Karr PT, Kawal R, Kidney JM, Knapik RH, Kuan CL, Lake JH, Laramee AR, Larsen KD, Lau C, Lemon TA, Liang AJ, Liu Y, Luong LT, Michaels J, Morgan JJ, Morgan RJ, Mortrud MT, Mosqueda NF, Ng LL, Ng R, Orta GJ, Overly CC, Pak TH, Parry SE, Pathak SD, Pearson OC, Puchalski RB, Riley ZL, Rockett HR, Rowland SA, Royall JJ, Ruiz MJ, Sarno NR, Schaffnit K, Shapovalova NV, Sivisay T, Slaughterbeck CR, Smith SC, Smith KA, Smith BI, Sodt AJ, Stewart NN, Stumpf KR, Sunkin SM, Sutram M, Tam A, Teemer CD, Thaller C, Thompson CL, Varnam LR, Visel A, Whitlock RM, Wohnoutka PE, Wolkey CK, Wong VY, Wood M, Yaylaoglu MB, Young RC, Youngstrom BL, Yuan XF, Zhang B, Zwingman TA, Jones AR. Genome-wide atlas of gene expression in the adult mouse brain. Nature. 2007;445(7124):168–176. doi: 10.1038/nature05453. [DOI] [PubMed] [Google Scholar]
- 31.Heintz N. Gene expression nervous system atlas (GENSAT) Nat Neurosci. 2004;7(5):483. doi: 10.1038/nn0504-483. [DOI] [PubMed] [Google Scholar]
- 32.Belgard TG, Marques AC, Oliver PL, Abaan HO, Sirey TM, Hoerder-Suabedissen A, Garcia-Moreno F, Molnar Z, Margulies EH, Ponting CP. A transcriptomic atlas of mouse neocortical layers. Neuron. 2011;71(4):605–616. doi: 10.1016/j.neuron.2011.06.039. [DOI] [PMC free article] [PubMed] [Google Scholar]
- 33.Jimenez JS. Protein–DNA interaction at the origin of neurological diseases: a hypothesis. J Alzheimers Dis. 2010;22(2):375–391. doi: 10.3233/JAD-2010-100189. [DOI] [PubMed] [Google Scholar]
- 34.Quinn CM, Kagedal K, Terman A, Stroikin U, Brunk UT, Jessup W, Garner B. Induction of fibroblast apolipoprotein E expression during apoptosis, starvation-induced growth arrest and mitosis. Biochem J. 2004;378(Pt 3):753–761. doi: 10.1042/BJ20031352. [DOI] [PMC free article] [PubMed] [Google Scholar]
- 35.Kim WS, Elliott DA, Kockx M, Kritharides L, Rye KA, Jans DA, Garner B. Analysis of apolipoprotein E nuclear localization using green fluorescent protein and biotinylation approaches. Biochem J. 2008;409(3):701–709. doi: 10.1042/BJ20071261. [DOI] [PubMed] [Google Scholar]
- 36.Chen YC, Pohl G, Wang TL, Morin PJ, Risberg B, Kristensen GB, Yu A, Davidson B, Shih Ie M. Apolipoprotein E is required for cell proliferation and survival in ovarian cancer. Cancer Res. 2005;65(1):331–337. [PubMed] [Google Scholar]
- 37.Panin LE, Russkikh GS, Polyakov LM. Detection of apolipoprotein A-I, B, and E immunoreactivity in the nuclei of various rat tissue cells. Biochemistry (Mosc) 2000;65(12):1419–1423. doi: 10.1023/A:1002861008363. [DOI] [PubMed] [Google Scholar]
- 38.Panin LE, Polyakov LM, Kolosova NG, Russkikh GS, Poteryaeva ON. Distribution of tocopherol and apolipoprotein A-I immunoreactivity in rat liver chromatin. Membr Cell Biol. 1998;11(5):631–640. [PubMed] [Google Scholar]
- 39.Riddell DR, Zhou H, Atchison K, Warwick HK, Atkinson PJ, Jefferson J, Xu L, Aschmies S, Kirksey Y, Hu Y, Wagner E, Parratt A, Xu J, Li Z, Zaleska MM, Jacobsen JS, Pangalos MN, Reinhart PH. Impact of apolipoprotein E (ApoE) polymorphism on brain ApoE levels. J Neurosci. 2008;28(45):11445–11453. doi: 10.1523/JNEUROSCI.1972-08.2008. [DOI] [PMC free article] [PubMed] [Google Scholar]
- 40.Do Carmo S, Levros LC, Jr, Rassart E. Modulation of apolipoprotein D expression and translocation under specific stress conditions. Biochim Biophys Acta. 2007;1773(6):954–969. doi: 10.1016/j.bbamcr.2007.03.007. [DOI] [PubMed] [Google Scholar]
- 41.Do Carmo S, Seguin D, Milne R, Rassart E. Modulation of apolipoprotein D and apolipoprotein E mRNA expression by growth arrest and identification of key elements in the promoter. J Biol Chem. 2002;277(7):5514–5523. doi: 10.1074/jbc.M105057200. [DOI] [PubMed] [Google Scholar]
- 42.Kang S, Seo S, Hill J, Kwon B, Lee H, Cho H, Vinay D, Kwon B. Changes in gene expression in latent HSV-1-infected rabbit trigeminal ganglia following epinephrine iontophoresis. Curr Eye Res. 2003;26(3–4):225–229. doi: 10.1076/ceyr.26.3.225.14894. [DOI] [PubMed] [Google Scholar]
- 43.Johnston C, Jiang W, Chu T, Levine B. Identification of genes involved in the host response to neurovirulent alphavirus infection. J Virol. 2001;75(21):10431–10445. doi: 10.1128/JVI.75.21.10431-10445.2001. [DOI] [PMC free article] [PubMed] [Google Scholar]
- 44.Saha S, Rangarajan PN. Common host genes are activated in mouse brain by Japanese encephalitis and rabies viruses. J Gen Virol. 2003;84(Pt 7):1729–1735. doi: 10.1099/vir.0.18826-0. [DOI] [PubMed] [Google Scholar]
- 45.Prosniak M, Hooper DC, Dietzschold B, Koprowski H. Effect of rabies virus infection on gene expression in mouse brain. Proc Natl Acad Sci U S A. 2001;98(5):2758–2763. doi: 10.1073/pnas.051630298. [DOI] [PMC free article] [PubMed] [Google Scholar]
- 46.Navarro A, Ordonez C, Martinez E, Perez C, Astudillo A, Tolivia J. Apolipoprotein D expression absence in degenerating neurons of human central nervous system. Histol Histopathol. 2008;23(8):995–1001. doi: 10.14670/HH-23.995. [DOI] [PubMed] [Google Scholar]
- 47.Franz G, Reindl M, Patel SC, Beer R, Unterrichter I, Berger T, Schmutzhard E, Poewe W, Kampfl A. Increased expression of apolipoprotein D following experimental traumatic brain injury. J Neurochem. 1999;73(4):1615–1625. doi: 10.1046/j.1471-4159.1999.0731615.x. [DOI] [PubMed] [Google Scholar]
- 48.del Valle E, Navarro A, Astudillo A, Tolivia J. Apolipoprotein D expression in human brain reactive astrocytes. J Histochem Cytochem. 2003;51(10):1285–1290. doi: 10.1177/002215540305101005. [DOI] [PubMed] [Google Scholar]
- 49.Thomas EA, Dean B, Pavey G, Sutcliffe JG. Increased CNS levels of apolipoprotein D in schizophrenic and bipolar subjects: implications for the pathophysiology of psychiatric disorders. Proc Natl Acad Sci U S A. 2001;98(7):4066–4071. doi: 10.1073/pnas.071056198. [DOI] [PMC free article] [PubMed] [Google Scholar]
- 50.Khan MM, Parikh VV, Mahadik SP. Antipsychotic drugs differentially modulate apolipoprotein D in rat brain. J Neurochem. 2003;86(5):1089–1100. doi: 10.1046/j.1471-4159.2003.01866.x. [DOI] [PubMed] [Google Scholar]
- 51.Desai PP, Ikonomovic MD, Abrahamson EE, Hamilton RL, Isanski BA, Hope CE, Klunk WE, DeKosky ST, Kamboh MI. Apolipoprotein D is a component of compact but not diffuse amyloid-beta plaques in Alzheimer's disease temporal cortex. Neurobiol Dis. 2005;20(2):574–582. doi: 10.1016/j.nbd.2005.04.012. [DOI] [PubMed] [Google Scholar]
- 52.McConathy WJ, Alaupovic P. Studies on the isolation and partial characterization of apolipoprotein D and lipoprotein D of human plasma. Biochemistry. 1976;15(3):515–520. doi: 10.1021/bi00648a010. [DOI] [PubMed] [Google Scholar]
- 53.Ganfornina MD, Do Carmo S, Martinez E, Tolivia J, Navarro A, Rassart E, Sanchez D. ApoD, a glia-derived apolipoprotein, is required for peripheral nerve functional integrity and a timely response to injury. Glia. 2010;58(11):1320–1334. doi: 10.1002/glia.21010. [DOI] [PMC free article] [PubMed] [Google Scholar]
- 54.Provost PR, Marcel YL, Milne RW, Weech PK, Rassart E. Apolipoprotein D transcription occurs specifically in nonproliferating quiescent and senescent fibroblast cultures. FEBS Lett. 1991;290(1–2):139–141. doi: 10.1016/0014-5793(91)81244-3. [DOI] [PubMed] [Google Scholar]
- 55.Navarro A, Del Valle E, Astudillo A, Gonzalez del Rey C, Tolivia J. Immunohistochemical study of distribution of apolipoproteins E and D in human cerebral beta amyloid deposits. Exp Neurol. 2003;184(2):697–704. doi: 10.1016/S0014-4886(03)00315-7. [DOI] [PubMed] [Google Scholar]
- 56.Kalman J, McConathy W, Araoz C, Kasa P, Lacko AG. Apolipoprotein D in the aging brain and in Alzheimer's dementia. Neurol Res. 2000;22(4):330–336. doi: 10.1080/01616412.2000.11740678. [DOI] [PubMed] [Google Scholar]
- 57.Semenkovich CF, Ostlund RE, Jr, Olson MO, Yang JW. A protein partially expressed on the surface of HepG2 cells that binds lipoproteins specifically is nucleolin. Biochemistry. 1990;29(41):9708–9713. doi: 10.1021/bi00493a028. [DOI] [PubMed] [Google Scholar]
- 58.Shibata Y, Muramatsu T, Hirai M, Inui T, Kimura T, Saito H, McCormick LM, Bu G, Kadomatsu K. Nuclear targeting by the growth factor midkine. Mol Cell Biol. 2002;22(19):6788–6796. doi: 10.1128/MCB.22.19.6788-6796.2002. [DOI] [PMC free article] [PubMed] [Google Scholar]
- 59.May PC, Lampert-Etchells M, Johnson SA, Poirier J, Masters JN, Finch CE. Dynamics of gene expression for a hippocampal glycoprotein elevated in Alzheimer's disease and in response to experimental lesions in rat. Neuron. 1990;5(6):831–839. doi: 10.1016/0896-6273(90)90342-D. [DOI] [PubMed] [Google Scholar]
- 60.Nuutinen T, Suuronen T, Kauppinen A, Salminen A. Clusterin: a forgotten player in Alzheimer's disease. Brain Res Rev. 2009;61(2):89–104. doi: 10.1016/j.brainresrev.2009.05.007. [DOI] [PubMed] [Google Scholar]
- 61.Yang CR, Leskov K, Hosley-Eberlein K, Criswell T, Pink JJ, Kinsella TJ, Boothman DA. Nuclear clusterin/XIP8, an X-ray-induced Ku70-binding protein that signals cell death. Proc Natl Acad Sci U S A. 2000;97(11):5907–5912. doi: 10.1073/pnas.97.11.5907. [DOI] [PMC free article] [PubMed] [Google Scholar]
- 62.Lambert JC, Amouyel P. Genetics of Alzheimer's disease: new evidences for an old hypothesis? Curr Opin Genet Dev. 2011;21(3):295–301. doi: 10.1016/j.gde.2011.02.002. [DOI] [PubMed] [Google Scholar]
- 63.Pant S, Sharma M, Patel K, Caplan S, Carr CM, Grant BD. AMPH-1/Amphiphysin/Bin1 functions with RME-1/Ehd1 in endocytic recycling. Nat Cell Biol. 2009;11(12):1399–1410. doi: 10.1038/ncb1986. [DOI] [PMC free article] [PubMed] [Google Scholar]
- 64.Hollingworth P, Harold D, Jones L, Owen MJ, Williams J. Alzheimer's disease genetics: current knowledge and future challenges. Int J Geriatr Psychiatry. 2011;26(8):793–802. doi: 10.1002/gps.2628. [DOI] [PubMed] [Google Scholar]
- 65.Zhao Y, Chen X, Yang H, Zhou L, Okoro EU, Guo Z. A novel function of apolipoprotein E: upregulation of ATP-binding cassette transporter A1 expression. PLoS One. 2011;6(7):e21453. doi: 10.1371/journal.pone.0021453. [DOI] [PMC free article] [PubMed] [Google Scholar]
- 66.Gafencu AV, Robciuc MR, Fuior E, Zannis VI, Kardassis D, Simionescu M. Inflammatory signaling pathways regulating ApoE gene expression in macrophages. J Biol Chem. 2007;282(30):21776–21785. doi: 10.1074/jbc.M611422200. [DOI] [PubMed] [Google Scholar]
- 67.Elliott DA, Weickert CS, Garner B. Apolipoproteins in the brain: implications for neurological and psychiatric disorders. Clin Lipidol. 2010;51(4):555–573. doi: 10.2217/clp.10.37. [DOI] [PMC free article] [PubMed] [Google Scholar]
- 68.Navarro A, del Valle E, Juarez A, Martinez E, Ordonez C, Astudillo A, Tolivia J. Apolipoprotein D synthesis progressively increases in frontal cortex during human lifespan. Age (Dordr) 2010;32(1):85–96. doi: 10.1007/s11357-009-9117-0. [DOI] [PMC free article] [PubMed] [Google Scholar]
- 69.Belloir B, Kovari E, Surini-Demiri M, Savioz A. Altered apolipoprotein D expression in the brain of patients with Alzheimer disease. J Neurosci Res. 2001;64(1):61–69. doi: 10.1002/jnr.1054. [DOI] [PubMed] [Google Scholar]
- 70.Kim WS, Wong J, Weickert CS, Webster MJ, Bahn S, Garner B. Apolipoprotein-D expression is increased during development and maturation of the human prefrontal cortex. J Neurochem. 2009;109(4):1053–1066. doi: 10.1111/j.1471-4159.2009.06031.x. [DOI] [PubMed] [Google Scholar]
- 71.Leduc V, Domenger D, De Beaumont L, Lalonde D, Belanger-Jasmin S, Poirier J. Function and comorbidities of apolipoprotein e in Alzheimer's disease. Int J Alzheimers Dis. 2011;2011:974361. doi: 10.4061/2011/974361. [DOI] [PMC free article] [PubMed] [Google Scholar]
- 72.Bertrand P, Poirier J, Oda T, Finch CE, Pasinetti GM. Association of apolipoprotein E genotype with brain levels of apolipoprotein E and apolipoprotein J (clusterin) in Alzheimer disease. Brain Res Mol Brain Res. 1995;33(1):174–178. doi: 10.1016/0169-328X(95)00097-C. [DOI] [PubMed] [Google Scholar]
- 73.Jansen PJ, Lutjohann D, Thelen KM, von Bergmann K, van Leuven F, Ramaekers FC, Monique M. Absence of ApoE upregulates murine brain ApoD and ABCA1 levels, but does not affect brain sterol levels, while human ApoE3 and human ApoE4 upregulate brain cholesterol precursor levels. J Alzheimers Dis. 2009;18(2):319–329. doi: 10.3233/JAD-2009-1150. [DOI] [PubMed] [Google Scholar]
- 74.Perdomo G, Henry Dong H. Apolipoprotein D in lipid metabolism and its functional implication in atherosclerosis and aging. Aging (Albany NY) 2009;1(1):17–27. doi: 10.18632/aging.100004. [DOI] [PMC free article] [PubMed] [Google Scholar]
- 75.Smith KM, Lawn RM, Wilcox JN. Cellular localization of apolipoprotein D and lecithin:cholesterol acyltransferase mRNA in rhesus monkey tissues by in situ hybridization. J Lipid Res. 1990;31(6):995–1004. [PubMed] [Google Scholar]
- 76.Provost PR, Villeneuve L, Weech PK, Milne RW, Marcel YL, Rassart E. Localization of the major sites of rabbit apolipoprotein D gene transcription by in situ hybridization. J Lipid Res. 1991;32(12):1959–1970. [PubMed] [Google Scholar]
- 77.Cahoy JD, Emery B, Kaushal A, Foo LC, Zamanian JL, Christopherson KS, Xing Y, Lubischer JL, Krieg PA, Krupenko SA, Thompson WJ, Barres BA. A transcriptome database for astrocytes, neurons, and oligodendrocytes: a new resource for understanding brain development and function. J Neurosci. 2008;28(1):264–278. doi: 10.1523/JNEUROSCI.4178-07.2008. [DOI] [PMC free article] [PubMed] [Google Scholar]
Associated Data
This section collects any data citations, data availability statements, or supplementary materials included in this article.
Supplementary Materials
Representative ISH of ApoD and ApoE genes in the mouse cortex during development. These images were obtained from the ABA Website (http://www.brainmap.org) with their corresponding relative gene expression intensities. Comparisons were made throughout development, from E.18.5 to 24 months for ApoD and 33 months for ApoE. (PPT 5051 kb)
Representative in situ hybridations of ApoD and ApoE genes in the mouse brain. These images were obtained from the ABA Website (http://www.brain-map.org) with their corresponding relative gene expression intensities in different brain areas of 56-day-old mice. a Total brain. b Hippocampus. Field CA1, CA2, CA3, DG, and dentate gyrus. c Cerebral cortex (isocortex). Layers I–VI; CC corpus collasum. d Plexus choroid. e Cerebellar cortex. ML molecular layer, PL Purkinge layer, GL granular layer. (PPT 2174 kb)