Abstract
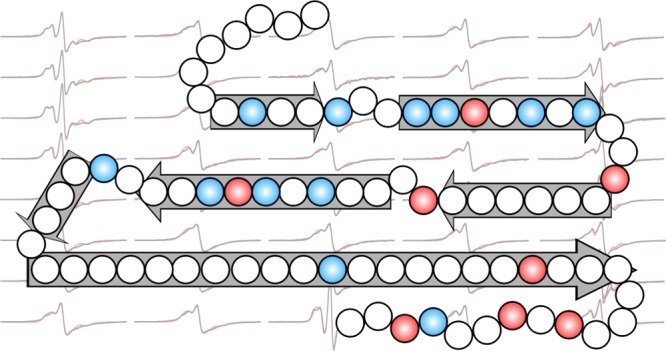
In yeast, the formation of Ure2 fibrils underlies the prion state [URE3], in which the yeast loses the ability to distinguish good nitrogen sources from bad ones. The Ure2 prion domain is both necessary and sufficient for the formation of amyloid fibrils. Understanding the structure of Ure2 fibrils is important for understanding the propagation not only of the [URE3] prion but also of other yeast prions whose prion domains share similar features, such as the enrichment of asparagine and glutamine residues. Here, we report a structural study of the amyloid fibrils formed by the Ure2 prion domain using site-directed spin labeling and electron paramagnetic resonance (EPR) spectroscopy. We completed a spin label scanning of all the residue positions between 2 and 80 of the Ure2 prion domain. The EPR data show that the Ure2 fibril core consists of residues 8–68 and adopts a parallel in-register β-sheet structure. Most of the residues show strong spin–exchange interactions, suggesting that there are only short turns and no long loops in the fibril core. Based on the strength of spin–exchange interactions, we determined the likely locations of the β-strands. EPR data also show that the C-terminal region of the Ure2 prion domain is more disordered than the N-terminal region. The roles of hydrophobic and charged residues are analyzed. Overall, the structure of Ure2 fibrils appears to involve a balance of stabilizing interactions, such as asparagine ladders, and destabilizing interactions, such as stacking of charged residues.
Introduction
Prions are infectious proteins that propagate the prion state by converting the prion protein from a non-prion conformation to a prion conformation.1,2 In mammals, prions are the basis of transmissible encephalopathies, including the Creutzfeldt–Jakob disease in humans,3 bovine spongiform encephalopathies in cattle,4 and chronic wasting disease in deer and elk.5 In yeast, prions are responsible for some non-chromosomal genetic elements, such as [PSI+] and [URE3].6,7 The structures of amyloid fibrils give insights into how prions propagate their prion phenotype. Intriguingly, the same protein may adopt multiple structures in the amyloid fibrils, underlying a phenomenon called prion strains that are manifested by different disease sub-types of the Creutzfeldt–Jakob disease.8
Ure2 from yeast Saccharomyces cerevisiae is a 354-residue protein that consists of two domains: an N-terminal prion domain of ∼90 residues and a C-terminal functional domain.9 The structure of the C-terminal domain has been solved by X-ray crystallography and shows that Ure2 is part of the glutathione transferase superfamily.10,11 It has been shown that Ure2 has glutathione peroxidase and glutaredoxin activities.12,13 The C-terminal domain suppresses the expression of enzymes and transporters responsible for catabolizing poor nitrogen sources when a good nitrogen source is present.14 In the prion state called [URE3], however, the yeast does not distinguish between good and poor nitrogen sources. The prion domain is necessary for the [URE3] phenotype and amyloid fibril formation.15 An isolated Ure2 prion domain forms fibrils in vitro by itself,16 adopts a structure that is similar to the fibrils of full-length Ure2 protein,17 and is able to convert yeast cells from the non-prion to prion state.18
In the last several years, significant progress has been made in the understanding of amyloid structures in general, including the amyloid structures of Aβ,19 α-synuclein,20 and tau,21,22 but the molecular structure of yeast prion fibrils is still elusive. Currently, a number of yeast prions have been shown to form amyloid fibrils.6 Ure2 and Sup35 are two of the best characterized yeast prions. Evidence from solid-state NMR,17,23 prion assays of scrambled sequence,24 and electron paramagnetic resonance (EPR)25,26 shows that the amyloid fibrils of Ure2 prion domain adopt a parallel in-register β-sheet structure, but the detailed locations of β-strands and turns are still lacking. Gorkovskiy et al.27 used solid-state NMR to identify the locations of turns in Sup35 amyloid fibrils with isotope labeling at 16 residue positions. Their study confirmed the parallel in-register β-sheet structure of Sup35 fibrils, but the spatial resolution is not high enough to identify all the β-strands and turns. Similar efforts using solid-state NMR have not been attempted on Ure2 fibrils. Identifying the locations of β-strands and turns would represent a significant step forward in the understanding of the Ure2 fibril structure.
Most of the amyloid fibrils studied to date adopt a parallel in-register β-sheet structure.28 In such a structure, the side chains at the same residue position but from different protein chains stack on top of each other (Figure 1A). The average distance between these neighboring side chains is the same as the inter-strand distance in a β-sheet, which is 4.75 Å. When the amyloid fibrils are formed by a protein spin labeled at a the β-strand site, the stacking of the spin label side chains leads to strong spin–exchange interactions between the spin labels.29 As a result, the spin-labeled amyloid fibrils give a characteristic single-line EPR spectrum, a diagnostic feature for the parallel in-register β-sheet structure (Figure 1B). If the spin label is introduced at a residue located in a turn or loop region, then the EPR spectrum shows a different lineshape, indicating weaker spin–exchange interactions. Therefore, scanning through all the residue positions of the amyloid core with spin labeling can identify the location of β-strands and turns with the aid of a quantitative analysis of the spin–exchange interactions.26,30
Figure 1.
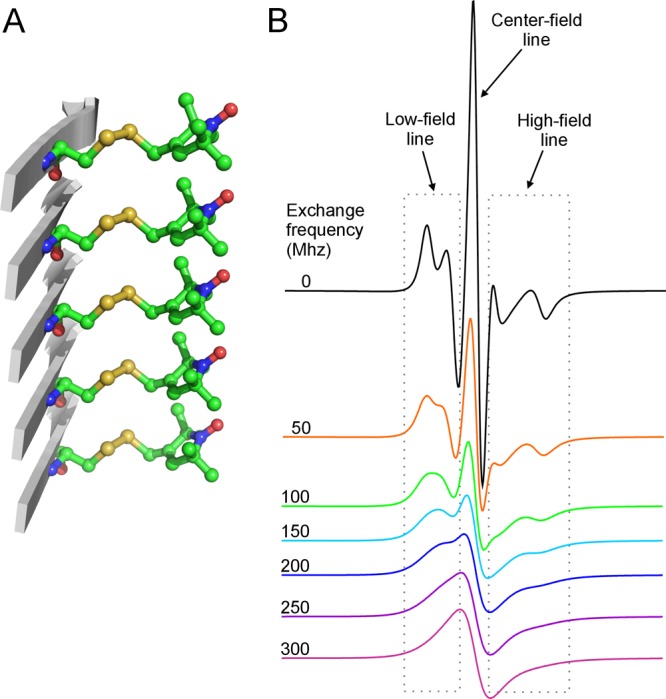
Spin-labeled amyloid fibrils show characteristic single-line EPR spectra. (A) A stick model of the spin label R1 in a parallel in-register β-sheet structure, commonly found in the core of amyloid fibrils formed by various proteins, including the yeast prion protein Ure2. This side-chain packing of the spin label R1 is based on the crystal packing of the spin-labeling reagent MTSSL. (B) Simulated EPR spectra with varying strengths of spin–exchange interactions. Note that increasing spin–exchange interactions leads to the collapse of the high-field and low-field resonance lines toward the center line and results in a single-line feature when the exchange frequency is above 100 MHz. When the exchange frequency is above 200 MHz, the bumpy features at both low-field and high-field lines are smoothed out and the EPR spectrum becomes a complete single-line spectrum.
To locate the β-strands, turns, and loops in the amyloid fibrils of the yeast prion protein Ure2, spin labels were introduced, one at a time, at residues 2–80 of the Ure2 prion domain. EPR spectra of these 79 spin-labeled Ure2 fibril samples provide detailed structural information on the amyloid core at a single-residue resolution. Our results show that the amyloid core of the Ure2 fibrils consists of residues 8–68. Based on the strength of the spin–spin interaction, likely β-strands are assigned. The roles of polar, hydrophobic, and charged residues in the stabilization of the Ure2 fibril structure are discussed.
Results
The Amyloid Core of Ure2 Fibrils
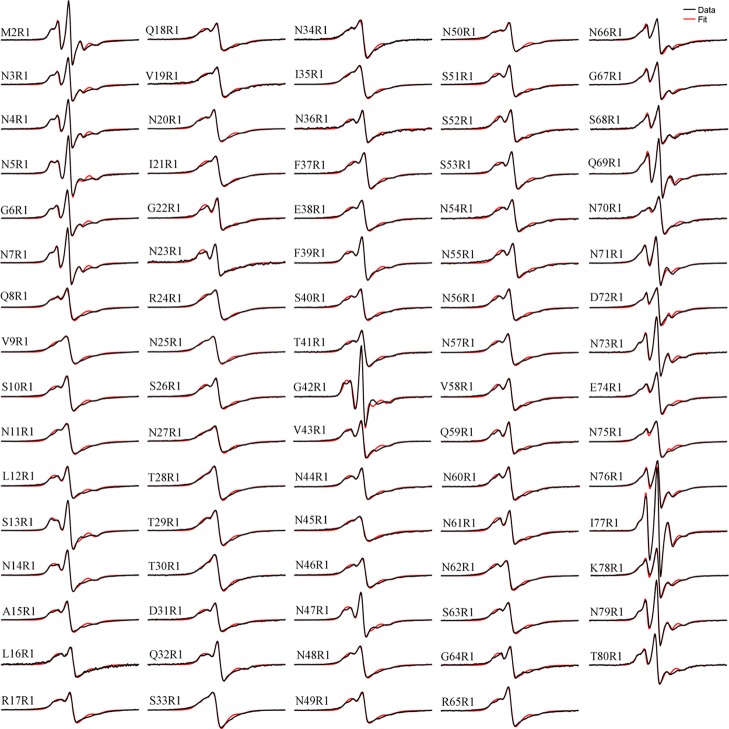
We completed a spin label scanning from residue 2 to residue 80 of the Ure2 prion domain. Previously, only 27 residue positions have been studied with spin labeling.25,26 To study the structure of amyloid fibrils formed by the yeast prion protein Ure2, we prepared spin-labeled Ure2 fibrils in a phosphate-buffered saline (PBS) buffer at 37 °C without agitation. The EPR spectra at labeling sites 2–15 were taken from the study of Ngo et al.,26 but all other samples were prepared in this study. Figure 2 shows the EPR spectra of the 79 fibril samples formed by the spin-labeled Ure2 prion domain, along with the best fits from spectral simulations. Most of these EPR spectra display the so-called single-line feature (e.g., V9R1), in which the low-field and high-field lines of the typical three-line EPR spectrum merge with the center line (see also Figure 1B). This single-line spectrum is diagnostic of the parallel in-register β-sheet structure of amyloid fibrils.29 As shown in Figure 2, single-line-like spectra can be identified from residue 8 at the N-terminal region to residue 75 at the C-terminal region, suggesting that almost the entire length of Ure2 prion domain adopts a highly ordered structure. This is consistent with our previous EPR study on Ure2 prion fibrils, in which spin labels were introduced at every 5th residue position of the Ure2 prion domain.25
Figure 2.
EPR spectra of Ure2 amyloid fibrils with spin labels at residues 2–80. The experimental spectra (black traces) are superimposed on the best fit of the simulated spectra (red traces). EPR spectral simulation and fitting was used to extract the strength of the spin–exchange interaction. All spectra are normalized to the same number of spins. The scan width is 200 G.
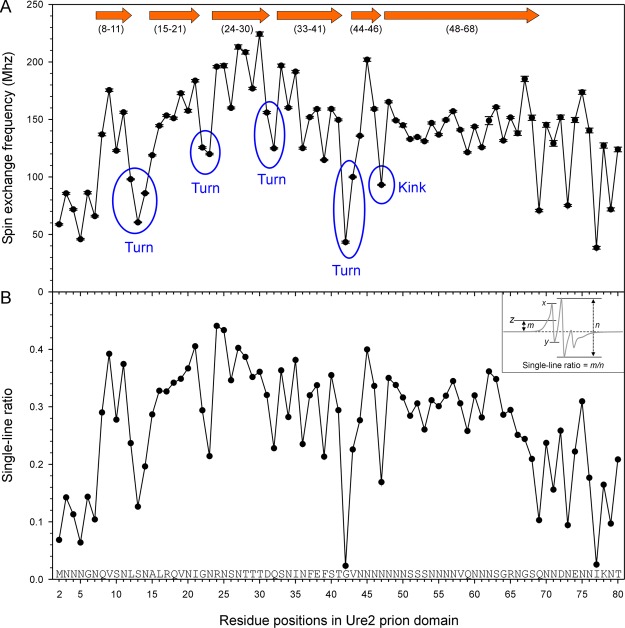
Spin labeling at every residue position from 2 to 80 allows us to identify the locations of the β-strand and turn regions through a quantitative analysis of the spin–exchange interactions. Previous EPR studies on spin-labeled Aβ fibrils30−32 show an excellent agreement with other high-resolution methods, including solid-state NMR33−37 and cryoEM,19 suggesting that this is a valid approach to obtain the secondary structure information. The strength of the spin–exchange interaction can be obtained using spectral simulations, which were performed on all the EPR data presented in Figure 2. Previously published spectra (residues 2–15) were also re-analyzed here to ensure consistency among all spectral simulations. The exchange frequency as a function of residue positions in the Ure2 prion domain is shown in Figure 3A. We previously developed an empirical parameter called the “single-line ratio”, which can be measured directly from the EPR spectra.26 The single-line ratios for residues 2–80 are shown in Figure 3B. The single-line ratio measures the upward shift of the low-field peak (i.e., the bump to the left of the center peak) as a ratio to the center-line amplitude (distance n in Figure 3B). The calculation of the single-line ratio is modified from our previous report.26 In the present study, the upward shift of the low-field peak relative to baseline (distance m in Figure 3B) is used to calculate the single-line ratio, while the upward shift relative to the lowest point of the spectrum was used in the previous report.26 The modified calculation changes the range of the single-line ratio from approximately 0.5–1 in the previous report to 0–0.5 in this study. In the absence of spin–exchange interactions, the single-line ratio would be zero, making the interpretation of the single-line ratio more intuitive using the modified calculation here. The calculation of the single-line ratio does not require sophisticated spectral simulations and is thus immune to the choice of motional models and fitting parameters. Therefore, the single-line ratio provides a general validation for the simulation to ensure that the fitting parameters provide reasonable results. The shortcoming of the single-line ratio analysis is that it cannot quantify the changes when the spin–exchange interaction is very strong and the bumpy feature to the left of the center peak is smoothed out. When a spectrum consists of multiple components, the single-ratio may be obscured by the presence of non-exchange spectral components, such as the spectra at the C-terminal region of the Ure2 prion domain. Overall, the plots of the spin–exchange frequency in Figure 3A and the single-line ratio in Figure 3B are remarkably similar, suggesting that the exchange frequencies obtained from spectral simulations reflect the main changes in the lineshape. The main difference between these two plots is at the C-terminal region. The single-line ratio shows that residues 69–80 have overall lower values than the preceding segment (residues 48–68). The exchange frequency numbers obtained from spectral simulations show that the residues with stronger exchange interactions among residues 69–80 are on par with residues 48–68. This is because the EPR spectra at this region consist of two spectral components: one component with exchange interactions and the other component without interactions. The non-exchange component makes the use of the single-line ratio problematic because it obscures the spectral changes resulting from spin–exchange interactions.
Figure 3.
Quantitative analysis of the spin–exchange interactions in Ure2 fibrils reveals locations of β-strands and turns. (A) Plot of spin–exchange frequency obtained from spectral simulation and fitting as a function of residue positions in the Ure2 prion domain. Block arrows represent the β-strands, and numbers in parentheses are the range of residues for each β-strand. (B) Single-line ratio, an empirical measure of spin–exchange interactions, is plotted as a function of residue positions in the Ure2 prion domain. Inset shows how the single-line ratio is calculated. In the inset, line z is half-way between x and y. Distance m measures the upward shift for the center of the low-field peak relative to the baseline. For a spectrum without exchange interactions, m = 0. Distance n measures the amplitude of the center line. If the bumpy feature at the low-field line is completely smoothed out, distance m cannot be determined and the single-line ratio is arbitrarily set at 0.5.
In the plot of the spin–exchange frequency, there are “peaks” and “valleys”. Peaks represent three or more consecutive residues with high exchange frequencies, and valleys represent residues with lower exchange frequencies than their immediate neighbors. When assigning “valleys”, we consider both the absolute value of the spin–exchange frequency and the relative value compared to the neighboring positions. We assign the residues in the peaks to the β-strand structure, and we assign valleys to turns. We consider that turns consist of more than one residue and assign the one-residue valley to a “kink” in the β-strand structure. Based on this principle of analysis, we identified 7 β-strand regions: residues 8–11, 15–21, 24–30, 33–41, 44–46, 48–68 (Figure 3). It is worth noting that residues 48–68 all show strong spin–exchange interactions, but they may not form a single long β-strand. If there were connecting turns within region 48–68 and these turns were highly ordered, we would still observe strong spin–exchange interactions.
For residues 69–80, some residues such as 74 and 75 show single-line EPR spectra, indicating strong spin–exchange interactions. At the same time, residues in this region all require a second spectral component in spectral simulation and fitting. This suggests that the local structural stability of this region is low (see the section “Local Structural Stability in Ure2 Fibrils” below). Therefore, we believe that this region also adopts a parallel in-register β-sheet structure, but with lower stability than the core residues from 8 to 68. In a previous study with spin labels introduced at every 5th residue position, we observed that residues 70, 75, and 80 were highly ordered, but the strength of exchange interaction and local stability were lower than those of residues 30–65 in the center region.25 We assigned residues 70–80 to be in an outer core region for their lower structural stability. In the same study,25 we also found that residues 10, 15, 20, and 25 showed weaker exchange interactions than the center residues 30–65. With higher spatial labeling density in this work, we do not see a structural difference between residues 10–25 and 30–65. Therefore, we abandoned the use of the inner core and outer core and consider that residues 8–68 form the amyloid core of the Ure2 prion domain. It is worth noting, however, that residues 69–80 are still highly ordered and may also adopt parallel in-register β-sheet structures.
Reproducibility of EPR Spectra for Spin-Labeled Ure2 Fibrils
During the course of EPR studies on Ure2 fibrils, fibrils of some spin-labeled Ure2 mutants were prepared more than once. This provides an opportunity to evaluate the reproducibility of the EPR spectral features for these spin-labeled amyloid fibrils. Figure 4 shows two EPR spectra at 10 labeling positions. The two EPR spectra of the same mutant have been obtained using different batches of spin-labeled Ure2 proteins in separate fibril preparations. The two EPR spectra for the same mutant are very similar to each other, reflecting not only the similar strength of spin–exchange interactions but also fine details such as the bumps to the left of the center peak. The reproducibility of the EPR spectra at each labeling site suggests that each labeling site is unique and distinguishable from other residue positions, likely reflecting the unique local atomic contacts surrounding each label. Margittai and Langen29 pointed out that the differences in EPR spectra among different labeling sites may be direct fingerprints for each labeling position, resulting from different backbone and site-chain contacts. The observation that the specific EPR spectral features can be reproduced in separate experiments supports this notion.
Figure 4.
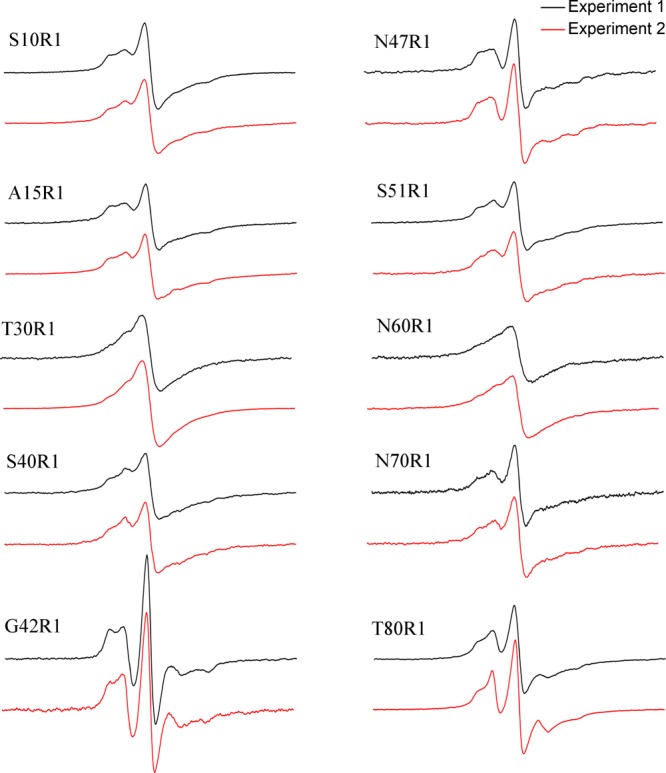
Reproducibility of EPR spectra for spin-labeled Ure2 mutants. For each mutant, experiment 1 and experiment 2 represent two different batches of spin labeling and fibril preparation. All spectra are normalized to the same number of spins. Scan width is 200 G.
Local Structural Stability in Ure2 Fibrils
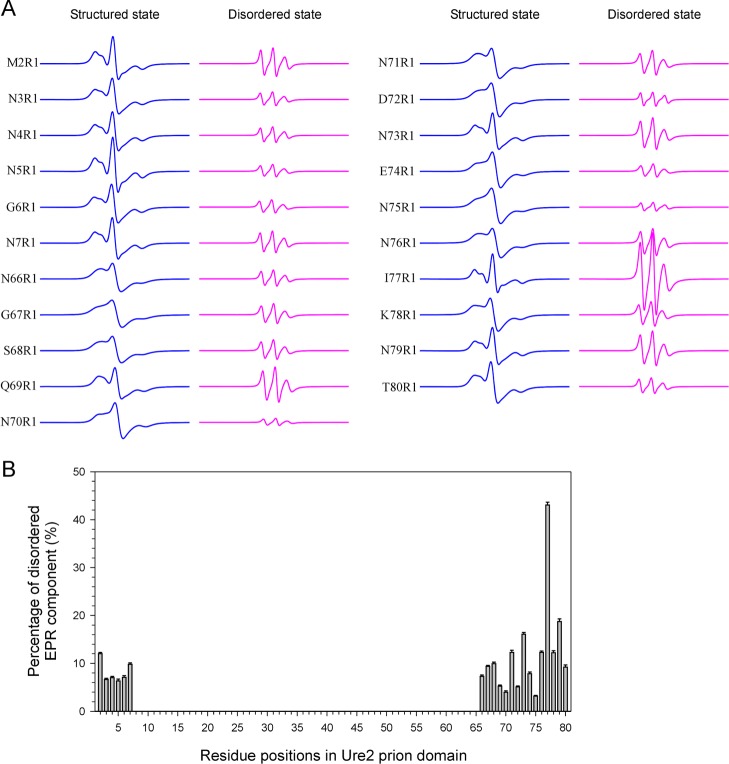
The EPR studies of spin-labeled Ure2 fibrils allow us to evaluate the local structural stability at a single-residue resolution. Most of the spin-labeled Ure2 variants can be simulated with one structural state, but some Ure2 variants require two structural states: one structured state and one disordered state. The simulated spectral components at these sites are shown in Figure 5A. Because the disordered state appears only in some Ure2 variants, we conclude that the disordered state represents a local structural disorder, rather than a global structural disorder. Therefore, spectral simulations of the EPR data can reveal where the local structural disorder appears at a single-residue resolution, and the percentage of the disordered state represents the extent of the disorder. The percentage of the disordered state as a function of the labeling position is plotted in Figure 5B. These residues are located at the N- and C-terminal regions. Residues 2–7 all show a small proportion of the locally disordered state between 6% and 12%. Residues 66–75 show 3–16% of disordered states, while the terminal residues 76–80 show 9−43% of disordered state. This is consistent with the idea of a hierarchical organization in the amyloid core of Ure2 fibrils,25 which suggests that the packing of the amyloid core is not uniform. Overall, the center of the core packs more tightly than the outer residues, and the N-terminal region is more stable than the C-terminal region in the amyloid core of the Ure2 prion domain.
Figure 5.
Local structural stability as indicated by the percentage of disordered components in the EPR spectra. For EPR spectra at sites 2–7 and 66–80, two spectral components representing a structured state and a locally disordered state were used in spectral simulation and fitting. The individual spectral components are shown in (A), and the percentage of the disordered component is shown in (B). The presence of disordered components at N- and C-terminal regions suggests a lower structural stability at these residue positions compared to center residues.
Seeded Aggregation of the Ure2 Prion Domain
The Ure2 construct we used for structural studies in this work is a fusion protein of the Ure2 prion domain (residues 1–89) at the N-terminus and the M domain of the Sup35 protein at the C-terminus. This construct was originally created by Alberti et al.38 in a systematic effort to identify potential prions in yeast. Due to poor solubility of the Ure2 prion domain by itself, the Sup35M domain was used to aid in vitro protein purifications. This is particularly helpful when a large number of mutants need to be purified for spin-labeling studies. We have previously shown that the aggregation kinetics of the Ure2p1–89–Sup35M construct show a sigmoidal curve,39 consistent with a nucleation-dependent polymerization model. Here, we performed a seeded aggregation experiment to investigate if pre-formed Ure2 fibril seeds can promote the aggregation of Ure2p1–89–Sup35M. Figure 6 shows that the presence of 10% Ure2 fibril seeds promotes the aggregation of Ure2p1–89–Sup35M. The difference between seeded and non-seeded aggregation is small but notable. The ability to self-seed provides the biochemical basis for the Ure2 construct used in this study to propagate its conformation as a yeast prion. However, it has not been demonstrated that this Ure2 construct can infect and propagate yeast cells from in vitro prepared fibrils. Spin labeling at various residue positions of the Ure2 prion domain may have unpredictable effects on its ability to propagate the prion phenotype in vivo. These are some of the limitations that may affect the relevance of the spin-labeling studies in the context of yeast prion biology.
Figure 6.
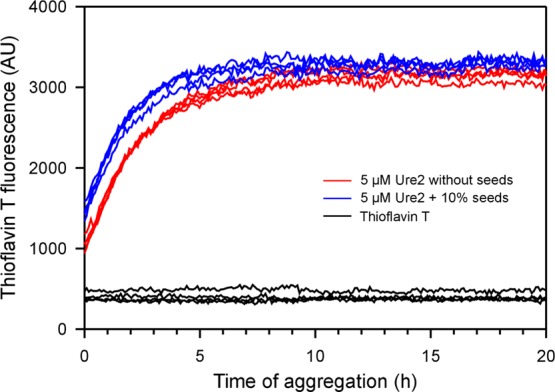
Seeded aggregation kinetics of the Ure2 prion domain. The aggregation of the Ure2 prion domain was followed with thioflavin T fluorescence at 37 °C without agitation. Four repeats of Ure2 in the absence of fibril seeds (red traces) and in the presence of 10% pre-formed fibril seeds (blue traces) are shown. Note that Ure2 fibril seeds caused a small but notable leftward shift of the aggregation curve, suggesting that fibril seeds promoted Ure2 fibril formation. AU, arbitrary units.
Discussion
In this work, we used site-directed spin labeling and EPR to study the structure of the amyloid fibrils formed by the prion domain of Ure2 protein. All residue positions from 2 to 80 were studied to achieve a single-residue resolution in our EPR analysis (Figure 2). The quantitative analysis of the spin–exchange interactions revealed that the amyloid core of Ure2 fibrils covers residues 8–68 (Figure 3). Residues 69–80 may also adopt β-sheet structures but with a lower local structural stability (Figure 5). Previous solid-state NMR studies have shown that the Ure2 prion domain forms fibrils of a parallel in-register β-sheet structure, but the amyloid core has not been well defined.17,23 Our results are consistent with a proteinase K digestion study of Ure2 fibrils, which put the boundary of the prion domain at residues 6–9 at the N-terminus and residues 63–70 at the C-terminus.40
Spin labeling at every residue position between 2 and 80 of the Ure2 prion domain allows us to identify potential β-strand and turn regions. We assigned 7 potential β-strands at residues 8–11, 15–21, 24–30, 33–41, 44–46, and 48–68 (Figure 3). The EPR studies in this work help explain some of the previous mutagenesis studies on the Ure2 protein. Jiang et al.41 showed that the deletion of residues 1–41 completely abolished the amyloid formation of Ure2 in vitro, and the deletion of 15–41 also dramatically reduced the rate of aggregation. In vivo, residues 2–44 were shown to be important for prion induction and curing.42 These studies suggest that the minimal region for the formation of the Ure2 fibril core covers the first four β-strands: 8–11, 15–21, 24–30, and 33–41. Meanwhile, the deletion of residues 2–8 shows little effect on the curing ability of the Ure2 prion domain, while the deletion of residues 2–10 dramatically reduces the curing effect,42 suggesting that the formation of the first β-strand at residues 8–11 is critical for the amyloid formation of the Ure2 prion domain. A point mutation in the first β-strand, V9C, has been shown to slow down the aggregation of Ure2, supporting the critical role of this N-terminal strand in Ure2 fibrillization.43
A special feature of amyloid fibrils is polymorphism. Unlike globular proteins, whose most stable structures consist of mostly a single conformation, amyloid fibrils can adopt multiple confirmations. Polymorphic fibril structures may be the basis for yeast prion strains. In structural studies, there is a concern on how fibril polymorphism may affect our EPR analysis. In this work, we prepared Ure2 fibrils all at 37 °C under quiescent conditions, controlling two important variables (temperature and agitation) that may affect fibril polymorphism. In addition, EPR spectra are sensitive to heterogeneity in the sample. Therefore, the EPR data themselves are indicators of the extent of fibril polymorphism. To illustrate this point, we showed a mixing of two EPR spectra: one with a strong spin–exchange interaction (spin–exchange frequency of 200 MHz) and another with a weak spin–exchange interaction (spin–exchange frequency of 50 MHz), at various ratios (Figure 7). The characteristic of the strong spin–exchange interaction is a completely smoothed-out single-line spectrum, and no apparent bumps are observed at the left shoulder of the center peak. If there are two structural polymorphs of Ure2 at equal populations—one gives a strong spin–exchange interaction and the other gives a weak spin–exchange interaction—then it is easy to detect the existence of such a mixture (Figure 7). Therefore, when an EPR spectrum of a strong spin–exchange interaction is observed, it can be safely concluded that the majority of the structure at the labeling site is homogeneous. The same can be said for an EPR spectrum of a weak spin–exchange interaction. It can be ambiguous when an EPR spectrum representing spin–exchange interactions of intermediate strength is observed. Based on the abundance of EPR spectra corresponding to strong spin–exchange interactions (Figure 2), we believe that a major homogeneous fibril polymorph dominates the fibril samples of this study. However, we acknowledge that this analysis is solely based on the spin–exchange interactions at each labeling site, and polymorphism may still exist at the level of tertiary folding of β-strands and protofilament packing. Future experiments, such as yeast prion assays, may help provide a more stringent test on the formation of different prion strains from these spin-labeled fibrils.
Figure 7.
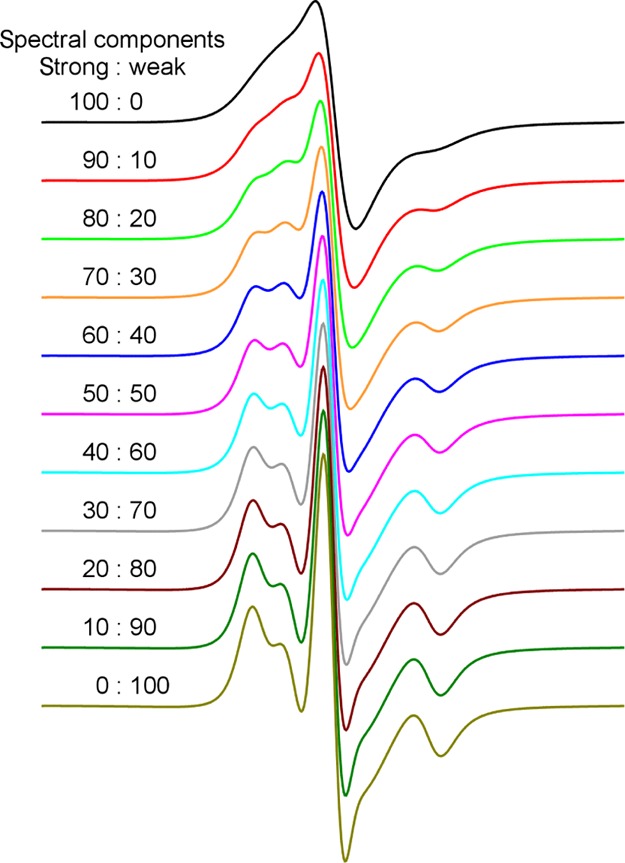
EPR spectra with two spectral components of strong and weak spin–exchange interactions at various ratios. The EPR spectrum of the strong spin–exchange interaction is simulated using a spin–exchange frequency of 200 MHz and for the weak spin–exchange interaction using 50 MHz.
One common feature of yeast prion domains is the enrichment of glutamine and asparagine residues. Therefore, the driving force of aggregation for the prion domain appears to be polar interactions. Particularly, the formation of glutamine and asparagine ladders has been proposed as a major stabilizing interaction in prion fibrils.44,45 In the first 80 residues of Ure2 protein, 33 are asparagines and 5 are glutamines. Particularly, residues 44–57 have the sequence NNNNNNNSSSNNNN, in which 79% of the residues are asparagine. Previously, a solid-state NMR study suggested that this stretch may be disordered in the Ure2 fibrils.23 Here, the EPR data show strong spin–exchange interactions for all residue positions with the exception of 47, suggesting that this stretch of residues adopts β-sheet structures. Consistent with our findings, the asparagine ladder has been found to be a stabilizing feature in β-helix proteins.44,46 Poly-asparagine peptides have been shown to form amyloid fibrils readily.47
The role of charged residues has been thought to be destabilizing in amyloid fibrils. In a previous modeling work of Ure2 fibrils, the charged residues were deliberately placed at turns.48 There are 8 charged residues in the 1–80 region, and these residues are R17, R24, D31, E38, R65, D72, E74, and K78. Within the amyloid core of 8–68, strong spin–exchange interactions at residues R17, R24, E38, and R65 suggest that they adopt β-strand structures. D31 has a weaker spin–exchange interaction and is next to Q32, which also has a weaker spin–exchange interaction. Therefore, we assigned D31 to a turn structure. Three charged residues, D72, E74, and K78, are located outside the amyloid core. These three charged residues account for 25% of the 12-residue stretch from residue 69 to 80, suggesting that the higher density of charged residues may underlie the poor packing of this region in the Ure2 fibrils. We would also like to point out a caveat of our analysis. When we replace a charged residue with the spin label, the charged residue no longer exists at that residue position. Our assumption is that the replacement of the charged residue does not change the overall structure of the Ure2 fibrils. Therefore, we assume that the EPR spectrum represents the local structure of the charged residue position. Our analysis is also aided by considering the neighboring positions of these charged residues. If the charged residues are located on turns, the turn structure would likely weaken the spin–exchange interaction at its neighboring sites. This is based on the observation that a turn typically consists of two residues or more with weaker spin–exchange interactions, although a single residue can show a non-β structure with little effect on adjacent residues (e.g., G42 and D47). For R17, the neighboring mutations L16R1 and Q18R1 both give strong spin–exchange interactions. Furthermore, the EPR spectral lineshapes of A15R1, L16R1, Q18R1, V19R1, N20R1, and I21R1 are very similar, suggesting that their EPR spectra reflect the backbone feature of this region. For R24, N25R1 has a strong spin–exchange interaction, but G22R1 and N23R1 have weak spin–exchange interactions, and these two residues are assigned to a turn structure. Therefore, it is likely that R24 is also part of this turn structure. For E38, N36R1 and F37R1 are on one side of the β-sheet, while F39R1 and S40R1 are on the other side: all have relatively strong spin–exchange interactions, suggesting that E38 is located in the middle of a β-strand. R65 has a similar situation as E38. The neighboring residues on both sides have similar EPR lineshapes and relatively strong interactions, suggesting that R65 is located in the middle of a β-strand.
There are 12 hydrophobic amino acids in the region 1–80, and these residues are V9, L12, A15, L16, V19, I21, I35, F37, F39, V43, V58, and I77. Most of these hydrophobic residues are branched or aromatic and are located on β-strands. This is consistent with the β-sheet propensity of these residue types.49 I77 is located outside the amyloid core. Residues I35, F37, and F39 point to the same side of the β-strand (consisting of residues 33–41), likely providing strong hydrophobic interactions with their stacking in the β-sheet. Similarly, A15, V19, and I21 also point to the same side of the β-strand (consisting of residues 15–21, with an arginine at position 17), and their stacking in the β-sheet may also stabilize the Ure2 fibril through hydrophobic interactions.
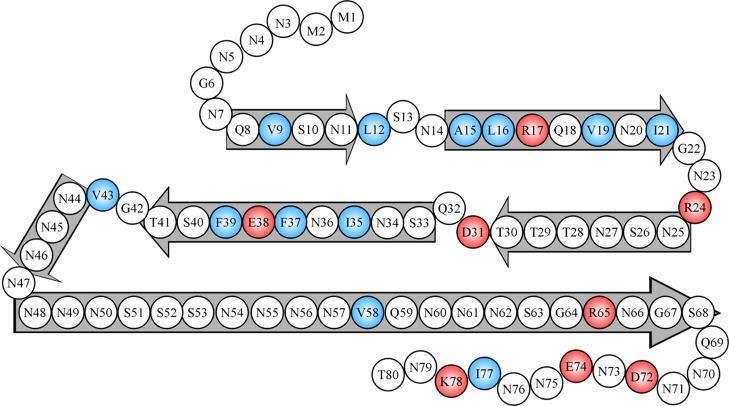
Overall, the structure of Ure2 fibrils appears to involve a balance of stabilizing interactions, both polar and hydrophobic, and destabilizing interactions from stacking of charged residues (Figure 8). Such a balance may be important both for maintaining the solubility of the Ure2 protein to perform its gene regulation activity and for the strong aggregation propensity to form prions.
Figure 8.
A schematic model showing likely locations of β-strands and turns in Ure2 fibrils. Block arrows represent likely β-strands or ordered turns, consisting of residues with strong spin–exchange interactions, as shown in Figure 3. Charged residues are colored in red, and hydrophobic residues are colored in blue. Note that the long β-strand of residues 48–68 likely involves highly ordered turns, which were not distinguishable in our EPR analysis.
Experimental Procedures
Ure2 Protein Purification and Spin Labeling
The construct of the Ure2 prion domain used in this work is a fusion protein consisting of residues 1–89 of the Ure2 protein and the M domain (residues 125–253) of the yeast prion protein Sup35.38 This construct has been designated as Ure2p1–89–M in our previous work.25,26,50 Single cysteine mutations were introduced at every residue position from residue 2 to 80 using the QuikChange site-directed mutagenesis kit (Agilent). The EPR spectra at labeling sites 2–15 were taken from a previous study26 and re-analyzed together with the rest of the mutants. All other previously reported mutants25,26 were re-purified and labeled together with newly made mutants. Protein expression and purification was performed as previously described25 with some modifications. Briefly, each Ure2 mutant was transformed into E. coli C41 (DE3) cells (Lucigen) for expression. The cells were collected using centrifugation and then resuspended in PSU buffer (50 mM phosphate, 0.5 M NaCl, 8 M urea; pH 10.0). The cells were sonicated and the cell debris was removed with centrifugation. The supernatant was then loaded on a 5 mL HisTrap column (GE Healthcare) equilibrated with a PSU buffer. Proteins were eluted with a linear imidazole gradient (50–500 mM). The protein concentration was determined by absorbance at 280 nm using an extinction coefficient of 6970 M–1 cm–1.51
For spin labeling, tris(2-carboxyethyl)phosphine was added to the Ure2 solution at 10 mM and the mixture was incubated at room temperature for 20 min. Then, the sample was buffer exchanged to the spin-labeling buffer (20 mM 3-(N-morpholino)propanesulfonic acid, 7 M guanidine hydrochloride, pH 6.8) with a HiTrap desalting column (GE Healthcare). Immediately after buffer exchange, MTSSL, (1-oxyl-2,2,5,5-tetramethylpyrroline-3-methyl)methanethiosulfonate (Enzo Life Sciences), was added at a 10-fold molar excess. Spin labeling was performed at room temperature for 1 h on a nutating mixer. The sample was then buffer exchanged to 30 mM ammonium acetate (pH 10.0), lyophilized, and stored at −80 °C.
Fibril Preparation
To prepare spin-labeled Ure2 fibrils, one tube of spin-labeled Ure2 mutant protein powder was dissolved in PG buffer (15 mM sodium phosphate, 7 M guanidine hydrochloride; pH 6.8) to a concentration of 1 mM. Then, the Ure2 sample was diluted 20-fold with PBS buffer (50 mM sodium phosphate, 140 mM NaCl; pH 7.4). The sample was then incubated at room temperature (∼22 °C) for approximately 5–10 days. The fibril formation was monitored with thioflavin T fluorescence. When thioflavin T fluorescence reached plateau, the fibrils were pelleted with centrifugation at 20,000g for 20 min and then surface-washed with the PBS buffer.
EPR Spectroscopy and Spectral Simulation
For EPR studies, the spin-labeled Ure2 fibrils were loaded in glass capillaries (VitroCom) sealed at one end. EPR spectroscopy was performed at an X-band frequency on a Bruker EMX spectrometer fitted with the ER4102ST cavity at room temperature using a microwave power of 20 mW. The modulation amplitude was optimized to the natural linewidth of each individual spectrum and was typically set at 4 G.
To quantify the strength of spin–exchange interactions in the Ure2 fibrils, the EPR spectra were simulated using the MultiComponent program, which is written by Dr. Christian Altenbach at the University of California, Los Angeles, and can be freely downloaded from the website of Dr. Wayne Hubbell’s research group.52 The EPR spectra at labeling positions 2–15 were previously published in Ngo et al.26 but were simulated again here to ensure consistency in the spectral fitting across all spectra. A microscopic order, macroscopic disorder model53 was used to describe the motion of the spin label. For all the fits, the magnetic tensor A and g were set as Axx = 6.2, Ayy = 5.9, Azz = 37.0, and gxx = 2.0078, gyy = 2.0058, gzz = 2.0023, as described previously.54 An anisotropic model of motion was used for R1 by including an order parameter (S). For anisotropic simulations, the diffusion tilt angles were fixed to (α, β, γ) = (0, 36°, 0) for the z-axis anisotropy, as previously described.54 Only three parameters were allowed to vary during the spectral fitting: the rotational diffusion constant, order parameter, and Heisenberg exchange frequency. The Heisenberg spin–exchange interaction as integrated in the MultiComponent program describes interactions between multiple spins, not just two spin labels. For the EPR spectra at residues 2–7 and 66–80, a second spectral component without spin–exchange interactions was used to account for a disordered structural state. An isotropic model of motion was used for the second spectral component. The two spectral components for residues 2–7 and 66–80 are shown in Figure 5A. The percentage of the disordered component is shown in Figure 5B. Only one spectral component was used for the simulations of all other EPR spectra, and the best fits for all spectra are shown in Figure 2. All the fitted parameters are shown in Table S1.
Seeded Aggregation Kinetics
A Ure2 stock solution was prepared by dissolving one tube of lyophilized Ure2 powder in the PG buffer to 100 μM concentration. For the seeded aggregation, 2.5 μL of the Ure2 stock was mixed with 37.5 μL of PBS, 5 μL of thioflavin T (500 μM), and 5 μL of sonicated Ure2 fibril seeds (5 μM). For the non-seeded aggregation, 2.5 μL of the Ure2 stock solution was mixed with 42.5 μL of PBS and 5 μL of thioflavin T (500 μM). Four repeats of each condition were prepared. To initiate aggregation, all 50 μL of the aggregation samples was transferred to a black 384-well nonbinding surface microplate with a clear bottom (Corning product# 3655) and sealed with a sealing film (Corning product# PCR-SP). The microplate was then put in a Victor 3V plate reader (PerkinElmer) and incubated at 37 °C without agitation. The thioflavin T fluorescence was measured through the bottom of the plate approximately every 5 min with an excitation filter of 450 nm and emission filter of 490 nm. Ure2 fibril seeds were prepared by sonication of a pre-formed Ure2 fibril sample (5 μM) for 200 s using a Branson Digital Sonifier model 450 (microtip, 10% amplitude) with intermittent pause to avoid overheating.
Acknowledgments
We thank members of the Guo laboratory for helpful discussions and technical assistance in protein expression and purification. This work was supported by the National Institutes of Health (grant R01GM110448).
Supporting Information Available
The Supporting Information is available free of charge at https://pubs.acs.org/doi/10.1021/acsomega.9b04358.
Values and fitting errors of the Heisenberg exchange frequency and rotational correlation time and order parameter from spectral simulations of spin-labeled Ure2 fibrils (PDF)
The authors declare no competing financial interest.
Supplementary Material
References
- Scheckel C.; Aguzzi A. Prions, Prionoids and Protein Misfolding Disorders. Nat. Rev. Genet. 2018, 19, 405–418. 10.1038/s41576-018-0011-4. [DOI] [PubMed] [Google Scholar]
- Collinge J. Mammalian Prions and Their Wider Relevance in Neurodegenerative Diseases. Nature 2016, 539, 217–226. 10.1038/nature20415. [DOI] [PubMed] [Google Scholar]
- Tee B. L.; Longoria Ibarrola E. M.; Geschwind M. D. Prion Diseases. Neurol. Clin. 2018, 36, 865–897. 10.1016/j.ncl.2018.07.005. [DOI] [PubMed] [Google Scholar]
- Diack A. B.; Head M. W.; McCutcheon S.; Boyle A.; Knight R.; Ironside J. W.; Manson J. C.; Will R. G. Variant CJD. 18 Years of Research and Surveillance. Prion 2014, 8, 286–295. 10.4161/pri.29237. [DOI] [PMC free article] [PubMed] [Google Scholar]
- Moreno J. A.; Telling G. C. Molecular Mechanisms of Chronic Wasting Disease Prion Propagation. Cold Spring Harbor Perspect. Med. 2018, 8, a024448. 10.1101/cshperspect.a024448. [DOI] [PMC free article] [PubMed] [Google Scholar]
- Wickner R. B.; Edskes H. K.; Son M.; Bezsonov E. E.; DeWilde M.; Ducatez M. Yeast Prions Compared to Functional Prions and Amyloids. J. Mol. Biol. 2018, 430, 3707–3719. 10.1016/j.jmb.2018.04.022. [DOI] [PubMed] [Google Scholar]
- Liebman S. W.; Chernoff Y. O. Prions in Yeast. Genetics 2012, 191, 1041–1072. 10.1534/genetics.111.137760. [DOI] [PMC free article] [PubMed] [Google Scholar]
- Ghaemmaghami S. Biology and Genetics of PrP Prion Strains. Cold Spring Harbor Perspect. Med. 2017, 7, a026922. 10.1101/cshperspect.a026922. [DOI] [PMC free article] [PubMed] [Google Scholar]
- Coschigano P. W.; Magasanik B. The URE2 Gene Product of Saccharomyces Cerevisiae Plays an Important Role in the Cellular Response to the Nitrogen Source and Has Homology to Glutathione S-Transferases. Mol. Cell. Biol. 1991, 11, 822–832. 10.1128/mcb.11.2.822. [DOI] [PMC free article] [PubMed] [Google Scholar]
- Bousset L.; Belrhali H.; Janin J.; Melki R.; Morera S. Structure of the Globular Region of the Prion Protein Ure2 from the Yeast Saccharomyces Cerevisiae. Structure 2001, 9, 39–46. 10.1016/s0969-2126(00)00553-0. [DOI] [PubMed] [Google Scholar]
- Umland T. C.; Taylor K. L.; Rhee S.; Wickner R. B.; Davies D. R. The Crystal Structure of the Nitrogen Regulation Fragment of the Yeast Prion Protein Ure2p. Proc. Natl. Acad. Sci. U.S.A. 2001, 98, 1459–1464. 10.1073/pnas.98.4.1459. [DOI] [PMC free article] [PubMed] [Google Scholar]
- Bai M.; Zhou J.-M.; Perrett S. The Yeast Prion Protein Ure2 Shows Glutathione Peroxidase Activity in Both Native and Fibrillar Forms. J. Biol. Chem. 2004, 279, 50025–50030. 10.1074/jbc.M406612200. [DOI] [PubMed] [Google Scholar]
- Zhang Z.-R.; Perrett S. Novel Glutaredoxin Activity of the Yeast Prion Protein Ure2 Reveals a Native-like Dimer within Fibrils. J. Biol. Chem. 2009, 284, 14058–14067. 10.1074/jbc.M901189200. [DOI] [PMC free article] [PubMed] [Google Scholar]
- Cooper T. G. Transmitting the Signal of Excess Nitrogen in Saccharomyces Cerevisiae from the Tor Proteins to the GATA Factors: Connecting the Dots. FEMS Microbiol. Rev. 2002, 26, 223–238. 10.1111/j.1574-6976.2002.tb00612.x. [DOI] [PMC free article] [PubMed] [Google Scholar]
- Masison D. C.; Wickner R. B. Prion-Inducing Domain of Yeast Ure2p and Protease Resistance of Ure2p in Prion-Containing Cells. Science 1995, 270, 93–95. 10.1126/science.270.5233.93. [DOI] [PubMed] [Google Scholar]
- Taylor K. L.; Cheng N.; Williams R. W.; Steven A. C.; Wickner R. B. Prion Domain Initiation of Amyloid Formation in Vitro from Native Ure2p. Science 1999, 283, 1339–1343. 10.1126/science.283.5406.1339. [DOI] [PubMed] [Google Scholar]
- Kryndushkin D. S.; Wickner R. B.; Tycko R. The Core of Ure2p Prion Fibrils Is Formed by the N-Terminal Segment in a Parallel Cross-β Structure: Evidence from Solid-State NMR. J. Mol. Biol. 2011, 409, 263–277. 10.1016/j.jmb.2011.03.067. [DOI] [PMC free article] [PubMed] [Google Scholar]
- Brachmann A.; Baxa U.; Wickner R. B. Prion Generation in Vitro: Amyloid of Ure2p Is Infectious. EMBO J. 2005, 24, 3082–3092. 10.1038/sj.emboj.7600772. [DOI] [PMC free article] [PubMed] [Google Scholar]
- Gremer L.; Schölzel D.; Schenk C.; Reinartz E.; Labahn J.; Ravelli R. B. G.; Tusche M.; Lopez-Iglesias C.; Hoyer W.; Heise H.; et al. Fibril Structure of Amyloid-ß(1-42) by Cryo-Electron Microscopy. Science 2017, 358, 116–119. 10.1126/science.aao2825. [DOI] [PMC free article] [PubMed] [Google Scholar]
- Guerrero-Ferreira R.; Taylor N. M.; Mona D.; Ringler P.; Lauer M. E.; Riek R.; Britschgi M.; Stahlberg H. Cryo-EM Structure of Alpha-Synuclein Fibrils. Elife 2018, 7, e36402 10.7554/eLife.36402. [DOI] [PMC free article] [PubMed] [Google Scholar]
- Fitzpatrick A. W. P.; Falcon B.; He S.; Murzin A. G.; Murshudov G.; Garringer H. J.; Crowther R. A.; Ghetti B.; Goedert M.; Scheres S. H. W. Cryo-EM Structures of Tau Filaments from Alzheimer’s Disease. Nature 2017, 547, 185–190. 10.1038/nature23002. [DOI] [PMC free article] [PubMed] [Google Scholar]
- Falcon B.; Zhang W.; Murzin A. G.; Murshudov G.; Garringer H. J.; Vidal R.; Crowther R. A.; Ghetti B.; Scheres S. H. W.; Goedert M. Structures of Filaments from Pick’s Disease Reveal a Novel Tau Protein Fold. Nature 2018, 561, 137–140. 10.1038/s41586-018-0454-y. [DOI] [PMC free article] [PubMed] [Google Scholar]
- Baxa U.; Wickner R. B.; Steven A. C.; Anderson D. E.; Marekov L. N.; Yau W.-M.; Tycko R. Characterization of β-Sheet Structure in Ure2p1-89 Yeast Prion Fibrils by Solid-State Nuclear Magnetic Resonance. Biochemistry 2007, 46, 13149–13162. 10.1021/bi700826b. [DOI] [PubMed] [Google Scholar]
- Ross E. D.; Baxa U.; Wickner R. B. Scrambled Prion Domains Form Prions and Amyloid. Mol. Cell. Biol. 2004, 24, 7206–7213. 10.1128/MCB.24.16.7206-7213.2004. [DOI] [PMC free article] [PubMed] [Google Scholar]
- Ngo S.; Gu L.; Guo Z. Hierarchical Organization in the Amyloid Core of Yeast Prion Protein Ure2. J. Biol. Chem. 2011, 286, 29691–29699. 10.1074/jbc.M111.269092. [DOI] [PMC free article] [PubMed] [Google Scholar]
- Ngo S.; Chiang V.; Guo Z. Quantitative Analysis of Spin Exchange Interactions to Identify β Strand and Turn Regions in Ure2 Prion Domain Fibrils with Site-Directed Spin Labeling. J. Struct. Biol. 2012, 180, 374–381. 10.1016/j.jsb.2012.08.008. [DOI] [PubMed] [Google Scholar]
- Gorkovskiy A.; Thurber K. R.; Tycko R.; Wickner R. B. Locating Folds of the In-Register Parallel β-Sheet of the Sup35p Prion Domain Infectious Amyloid. Proc. Natl. Acad. Sci. U.S.A. 2014, 111, E4615–E4622. 10.1073/pnas.1417974111. [DOI] [PMC free article] [PubMed] [Google Scholar]
- Eisenberg D. S.; Sawaya M. R. Structural Studies of Amyloid Proteins at the Molecular Level. Annu. Rev. Biochem. 2017, 86, 69–95. 10.1146/annurev-biochem-061516-045104. [DOI] [PubMed] [Google Scholar]
- Margittai M.; Langen R. Fibrils with Parallel In-Register Structure Constitute a Major Class of Amyloid Fibrils: Molecular Insights from Electron Paramagnetic Resonance Spectroscopy. Q. Rev. Biophys. 2008, 41, 265–297. 10.1017/S0033583508004733. [DOI] [PubMed] [Google Scholar]
- Wang H.; Lee Y. K.; Xue C.; Guo Z. Site-Specific Structural Order in Alzheimer’s Aβ42 Fibrils. R. Soc. Open Sci. 2018, 5, 180166. 10.1098/rsos.180166. [DOI] [PMC free article] [PubMed] [Google Scholar]
- Agopian A.; Guo Z. Structural Origin of Polymorphism of Alzheimer’s Amyloid β-Fibrils. Biochem. J. 2012, 447, 43–50. 10.1042/BJ20120034. [DOI] [PubMed] [Google Scholar]
- Gu L.; Tran J.; Jiang L.; Guo Z. A New Structural Model of Alzheimer’s Aβ42 Fibrils Based on Electron Paramagnetic Resonance Data and Rosetta Modeling. J. Struct. Biol. 2016, 194, 61–67. 10.1016/j.jsb.2016.01.013. [DOI] [PMC free article] [PubMed] [Google Scholar]
- Xiao Y.; Ma B.; McElheny D.; Parthasarathy S.; Long F.; Hoshi M.; Nussinov R.; Ishii Y. Aβ(1-42) Fibril Structure Illuminates Self-Recognition and Replication of Amyloid in Alzheimer’s Disease. Nat. Struct. Mol. Biol. 2015, 22, 499–505. 10.1038/nsmb.2991. [DOI] [PMC free article] [PubMed] [Google Scholar]
- Wälti M. A.; Ravotti F.; Arai H.; Glabe C. G.; Wall J. S.; Böckmann A.; Güntert P.; Meier B. H.; Riek R. Atomic-Resolution Structure of a Disease-Relevant Aβ(1-42) Amyloid Fibril. Proc. Natl. Acad. Sci. U.S.A. 2016, 113, E4976–E4984. 10.1073/pnas.1600749113. [DOI] [PMC free article] [PubMed] [Google Scholar]
- Colvin M. T.; Silvers R.; Ni Q. Z.; Can T. V.; Sergeyev I.; Rosay M.; Donovan K. J.; Michael B.; Wall J.; Linse S.; et al. Atomic Resolution Structure of Monomorphic Aβ42 Amyloid Fibrils. J. Am. Chem. Soc. 2016, 138, 9663–9674. 10.1021/jacs.6b05129. [DOI] [PMC free article] [PubMed] [Google Scholar]
- Petkova A. T.; Yau W.-M.; Tycko R. Experimental Constraints on Quaternary Structure in Alzheimer’s β-Amyloid Fibrils. Biochemistry 2006, 45, 498–512. 10.1021/bi051952q. [DOI] [PMC free article] [PubMed] [Google Scholar]
- Paravastu A. K.; Leapman R. D.; Yau W.-M.; Tycko R. Molecular Structural Basis for Polymorphism in Alzheimer’s Beta-Amyloid Fibrils. Proc. Natl. Acad. Sci. U.S.A. 2008, 105, 18349–18354. 10.1073/pnas.0806270105. [DOI] [PMC free article] [PubMed] [Google Scholar]
- Alberti S.; Halfmann R.; King O.; Kapila A.; Lindquist S. A Systematic Survey Identifies Prions and Illuminates Sequence Features of Prionogenic Proteins. Cell 2009, 137, 146–158. 10.1016/j.cell.2009.02.044. [DOI] [PMC free article] [PubMed] [Google Scholar]
- Xue C.; Lin T. Y.; Chang D.; Guo Z. Thioflavin T as an Amyloid Dye: Fibril Quantification, Optimal Concentration and Effect on Aggregation. R. Soc. Open Sci. 2017, 4, 160696. 10.1098/rsos.160696. [DOI] [PMC free article] [PubMed] [Google Scholar]
- Baxa U.; Taylor K. L.; Wall J. S.; Simon M. N.; Cheng N.; Wickner R. B.; Steven A. C. Architecture of Ure2p Prion Filaments: The N-Terminal Domains Form a Central Core Fiber. J. Biol. Chem. 2003, 278, 43717–43727. 10.1074/jbc.M306004200. [DOI] [PubMed] [Google Scholar]
- Jiang Y.; Li H.; Zhu L.; Zhou J.-M.; Perrett S. Amyloid Nucleation and Hierarchical Assembly of Ure2p Fibrils. Role of Asparagine/Glutamine Repeat and Nonrepeat Regions of the Prion Domains. J. Biol. Chem. 2004, 279, 3361–3369. 10.1074/jbc.M310494200. [DOI] [PubMed] [Google Scholar]
- Edskes H. K.; Wickner R. B. Conservation of a Portion of the S. Cerevisiae Ure2p Prion Domain That Interacts with the Full-Length Protein. Proc. Natl. Acad. Sci. U.S.A. 2002, 99, 16384–16391. 10.1073/pnas.162349599. [DOI] [PMC free article] [PubMed] [Google Scholar]
- Yang J.; Dear A. J.; Michaels T. C. T.; Dobson C. M.; Knowles T. P. J.; Wu S.; Perrett S. Direct Observation of Oligomerization by Single Molecule Fluorescence Reveals a Multistep Aggregation Mechanism for the Yeast Prion Protein Ure2. J. Am. Chem. Soc. 2018, 140, 2493–2503. 10.1021/jacs.7b10439. [DOI] [PMC free article] [PubMed] [Google Scholar]
- Yoder M. D.; Lietzke S. E.; Jurnak F. Unusual Structural Features in the Parallel β-Helix in Pectate Lyases. Structure 1993, 1, 241–251. 10.1016/0969-2126(93)90013-7. [DOI] [PubMed] [Google Scholar]
- Tuttle M. D.; Comellas G.; Nieuwkoop A. J.; Covell D. J.; Berthold D. A.; Kloepper K. D.; Courtney J. M.; Kim J. K.; Barclay A. M.; Kendall A.; et al. Solid-State NMR Structure of a Pathogenic Fibril of Full-Length Human α-Synuclein. Nat. Struct. Mol. Biol. 2016, 23, 409–415. 10.1038/nsmb.3194. [DOI] [PMC free article] [PubMed] [Google Scholar]
- Jenkins J.; Pickersgill R. The Architecture of Parallel β-Helices and Related Folds. Prog. Biophys. Mol. Biol. 2001, 77, 111–175. 10.1016/s0079-6107(01)00013-x. [DOI] [PubMed] [Google Scholar]
- Perutz M. F.; Pope B. J.; Owen D.; Wanker E. E.; Scherzinger E. Aggregation of Proteins with Expanded Glutamine and Alanine Repeats of the Glutamine-Rich and Asparagine-Rich Domains of Sup35 and of the Amyloid Beta-Peptide of Amyloid Plaques. Proc. Natl. Acad. Sci. U.S.A. 2002, 99, 5596–5600. 10.1073/pnas.042681599. [DOI] [PMC free article] [PubMed] [Google Scholar]
- Kajava A. V.; Baxa U.; Wickner R. B.; Steven A. C. A Model for Ure2p Prion Filaments and Other Amyloids: The Parallel Superpleated β-Structure. Proc. Natl. Acad. Sci. U.S.A. 2004, 101, 7885–7890. 10.1073/pnas.0402427101. [DOI] [PMC free article] [PubMed] [Google Scholar]
- Fujiwara K.; Toda H.; Ikeguchi M. Dependence of α-Helical and β-Sheet Amino Acid Propensities on the Overall Protein Fold Type. BMC Struct. Biol. 2012, 12, 18. 10.1186/1472-6807-12-18. [DOI] [PMC free article] [PubMed] [Google Scholar]
- Ngo S.; Chiang V.; Ho E.; Le L.; Guo Z. Prion Domain of Yeast Ure2 Protein Adopts a Completely Disordered Structure: A Solid-Support EPR Study. PLoS One 2012, 7, e47248 10.1371/journal.pone.0047248. [DOI] [PMC free article] [PubMed] [Google Scholar]
- Gill S. C.; von Hippel P. H. Calculation of Protein Extinction Coefficients from Amino Acid Sequence Data. Anal. Biochem. 1989, 182, 319–326. 10.1016/0003-2697(89)90602-7. [DOI] [PubMed] [Google Scholar]
- Altenbach C.MultiComponent—A LabVIEW program for fitting multicomponent EPR spectra of nitroxide spin labels. http://www.biochemistry.ucla.edu/Faculty/Hubbell/.
- Budil D. E.; Lee S.; Saxena S.; Freed J. H. Nonlinear-Least-Squares Analysis of Slow-Motion EPR Spectra in One and Two Dimensions Using a Modified Levenberg-Marquardt Algorithm. J. Magn. Reson., Ser. A 1996, 120, 155–189. 10.1006/jmra.1996.0113. [DOI] [Google Scholar]
- Columbus L.; Hubbell W. L. Mapping Backbone Dynamics in Solution with Site-Directed Spin Labeling: GCN4–58 bZip Free and Bound to DNA. Biochemistry 2004, 43, 7273–7287. 10.1021/bi0497906. [DOI] [PubMed] [Google Scholar]
Associated Data
This section collects any data citations, data availability statements, or supplementary materials included in this article.


