Abstract
Study Objectives:
To explore and analyze diversity and abundance of oropharyngeal microbiota in patients with obstructive sleep apnea (OSA).
Methods:
This was a cross-sectional study. Middle-aged men, suspected to have OSA, referred to full-night polysomnography, and willing to provide oropharyngeal swab samples, were consecutively enrolled. OSA severity was assessed by apnea-hypopnea index (AHI) as non-OSA (AHI < 5 events/h) and OSA (AHI ≥ 15 events/h). Bacterial DNA of oropharyngeal samples was extracted and quality test performed. Oropharyngeal microbiota was analyzed using 16S ribosomal DNA (rDNA) sequencing, and bioinformatic analysis carried out after sequencing.
Results:
Samples from 51 men (25 in the non-OSA group and 26 in the OSA group) were sent for examination. Of these, 40 samples were found to have sufficient concentration of DNA and were analyzed for bioinformatics. In alpha diversity analysis, the OSA group exhibited significantly lower sobs (198.33 ± 21.71 versus 216.57 ± 26.21, P = .022), chao (221.30 ± 26.62 versus 243.86 ± 26.20, P = .014), ace (222.17 ± 27.15 versus 242.42 ± 25.81, P = .028) and shannon index (3.14 ± 0.23 versus 3.31 ± 0.26, P = .035), suggesting a reduction in microbial species diversity. We further divided participants into non-OSA, moderate OSA, and severe OSA groups and observed a significant decrease in the bacterial biodiversity of OSA groups compared with the non-OSA group, with the most significant decrease occurring in the moderate OSA group. Principal coordinate analysis showed two extremely different oropharyngeal microbial communities in non-OSA and OSA groups. More interestingly, proportion of Neisseria was slightly higher in the severe OSA group (20.64%), followed by the moderate OSA and non-OSA groups (12.57% and 9.69%, respectively). Glaciecola was not detected in the OSA groups compared to the non-OSA group (0 versus 0.772 ± 0.4754, P < .001).
Conclusions:
Middle-aged men with OSA showed less oropharyngeal species diversity and altered abundance, on which further confirmation is warranted.
Citation:
Yang W, Shao L, Heizhati M, Wu T, Yao X, Wang Y, Wang L, Li N. Oropharyngeal microbiome in obstructive sleep apnea: decreased diversity and abundance. J Clin Sleep Med. 2019;15(12):1777–1788.
Keywords: microbiome, obstructive sleep apnea, oropharyngeal, 16S rDNA
BRIEF SUMMARY
Current Knowledge/Study Rationale: The underlying mechanism of obstructive sleep apnea (OSA) is not fully understood yet, although the role of airway inflammation in OSA was widely discussed. Recent studies suggest that changes in local microecology, especially local microbial diversity, can cause local immune system imbalance. It is still not clear in the pharyngeal inflammation whether there is a dissonance of local microbiota.
Study Impact: We found that oropharyngeal microbiota is disturbed in conditions of OSA, characterized by lowered diversity and abundance. The findings may shed new light on a possible association between oropharynx microbiota and OSA. We hope the results could provide useful information for further understanding the microbiological mechanism of OSA.
INTRODUCTION
Obstructive sleep apnea (OSA) is a common disorder of repetitive pharyngeal collapse during sleep, which is a risk factor of cardiovascular, metabolic, and neurocognitive diseases. Moderate to severe OSA has an estimated prevalence of 23.4% in women and 49.7% in men.1,2 Although craniofacial abnormalities play a clear role in the pathogenesis of OSA, these defects may only account for one-third of the variability in OSA and its severity,3 leaving neuromuscular responses accounting for much of the balance of OSA variability. Elevations in circulating inflammatory chemokines may account for the decreases in neuromuscular activity in some patients with OSA.4 Similarly, mucosal inflammation may blunt local afferents and neuromuscular responses to upper airway obstruction, leading to worsening of upper airway obstruction during sleep.5 Nonetheless, the pathogenesis behind this airway inflammation is partially comprehended, although the suggested mechanisms include mechanical stress damage, and the pharyngeal cavity fat accumulation due to obesity, smoking, and esophageal reflux.6–10
In the past two decades, the relationship between immunity and microbiota has attracted considerable attention in the field of systemic and local inflammation. The oral cavity, harboring trillions of microorganisms with numerous functions and capabilities closely aligned with human health,11 is one of the main ecological habitats of the human body. Interaction of variable oral microorganisms helps the human body against invasion of undesirable stimulation outside. Imbalance of microbial flora contributes to oral diseases such as dental caries, periodontitis,12–14 oral mucosal diseases,15 and systemic diseases, such as gastrointestinal and nervous systemic diseases.16–18 However, whether there is microbiome imbalance in OSA is still unknown. The oropharynx, as the middle part of the upper airway, is the site of repeated collapse during sleep in patients with OSA, and is also confirmed to have a wide range of inflammation.5,9,19 Observing the relationship between OSA and local flora, measuring the diversity and abundance of local flora, may provide a new dimension for the analysis of local inflammation in OSA, and a new clue and viewpoint for the pathogenesis of OSA. However, the first step is to be able to accurately detect the oropharynx flora and determine whether the diversity and abundance has actually changed.
16S ribosomal DNA (rDNA) sequencing is a method that is used to detect the abundance and diversity of microorganisms in many environments efficiently and accurately.20,21 Therefore, we used 16S rDNA sequencing method to detect the diversity and abundance of local flora in patients with OSA and those without OSA, in order to determine whether the oropharynx flora of patients with OSA has been altered.
METHODS
Participants
This was a cross-sectional study. Males aged 30 to 65 years, in whom OSA was suspected and who agreed to full-night attended polysomnography (PSG) and to provide oropharyngeal swab samples, were consecutively enrolled as part of a previous study,22 at the People’s Hospital of Xinjiang Uygur Autonomous Region China from April to December 2013. The people included are permanent residents in the same area, who have relatively similar living environments and diet. Exclusion criteria of the current study was consistent with the previous study,22 encompassing history of atherosclerotic disease (myocardial infarction or stroke < 6 months), congestive heart failure, diabetes, thyroid disease, acute and chronic respiratory diseases, systemic infections, and with therapy for 4 weeks prior to study entry with inhaled, oral, or nasal steroids or usage of other anti-inflammatory drugs and central sleep apnea. Patients who had productive dust, poisonous gas, and substance abuse were also excluded by personal history. In addition, alcohol abusers and those in whom mild OSA was diagnosed were also excluded from the current study. A complete physical examination was performed, including neurologic, cardiopulmonary, abdominal, and ear, nose, and throat examinations. For a flow chart of participants, see Figure S1 in the supplemental material. The Ethics’ Committee of the aforementioned hospital approved the study protocol. Written informed consent was obtained from all participants.
OSA Evaluation
All participants underwent full-night attended PSG. As in a previous study,22 all participants were required to refrain from coffee, alcohol, and sedative hypnotic drugs prior to sleep study. PSG evaluation included airflow monitoring with thermocouple and/or nasal pressure, respiratory effort using piezo belts at the chest and abdominal positions, oxygen saturation using pulse oximetry, surface electrodes attached using standard techniques to obtain an electrooculogram, and electromyogram of the chin. Sleep stages were defined according to Rechtshaffen and Kales’ criteria by a professional polysomnographic technologist. For the current study, a reduction in the amplitude of airflow of at least 30% for ≥ 10 seconds followed by either a decrease in oxygen saturation of 4% or a reduction in the amplitude of airflow of at least 50% for ≥ 10 seconds followed by either a decrease in oxygen saturation of 3% or signs of physiologic arousal compose the definition of hypopnea. OSA severity was assessed by apnea-hypopnea index (AHI) as non (AHI < 5 events/h) and OSA (AHI ≥ 15 events/h). We first compared the oropharyngeal microbial diversity of the two groups; second, patients with OSA were grouped by severity (moderate OSA, severe OSA) and compared with the non-OSA group. The purpose was to further identify the diversity differences in OSA levels and to determine whether there was a dose-response relationship between these differences and OSA severity.
Laboratory Assessment
Samples of peripheral venous blood were collected in the morning after PSG. Biochemical evaluation was measured by hospital laboratories using standard techniques.
Collection of Throat Swab Sample
Oropharyngeal swab samples were collected from all participants in the morning between 8:00–9:00 am (Beijing time) after PSG by the same staff before oral washes, tooth brushing, and breakfast. Microbial samples were obtained from the posterior wall of the oropharynx using standard swabs. The swab samples were immersed in phosphate-buffered saline, transferred to the laboratory, shaken, and were stored at −80°C until use. The sampling methods used in the current study were similar to that of a recent study.23
DNA Isolation and Sequencing of 16S rDNA Genes
DNA was extracted from the swabs. A quality test was done first. Detection of DNA sample concentration was performed with Qubit Fluorometer (Thermo Fisher Scientific, Waltham, Massachusetts, United States); agarose gel electrophoresis was conducted for sample integrity and fragment distribution. NanoDrop (Thermo Fisher Scientific) was tested for OD260/280 and OD260/230, then all the qualified DNA is used to construct a library. For polymerase chain reaction product, the jagged ends of DNA fragment were converted into blunt ends by using T4 DNA polymerase, Klenow fragment, and T4 polynucleotide kinase. Then an ′A′ base to each 3′ end was added to make it easier to add adapters. Next, fragments too short were removed by Ampure beads. For genomics DNA, we used fusion primer with dual index and adapters for polymerase chain reaction, and fragments too short were removed by Ampure beads. In both cases, only the qualified library was used for sequencing. In order to obtain more accurate and reliable results in subsequent bioinformatics analysis, the raw data were preprocessed to obtain clean data. Paired-end reads were generated with Illumina platform, then the reads with sequencing adapters, N base, poly base, low quality etc., were filtered out with default parameters. If the two paired-end reads overlapped, the consensus sequence was generated by FLASH (Fast Length Adjustment of Short reads, v1.2.11).24 The tags were clustered into operational taxonomic units (OTUs) with a 97% threshold by using the software USEARCH (v7.0.1090),25 OTU representative sequences were taxonomically classified using Ribosomal Database Project Classifier v.2.2 trained on the Greengenes database. Alpha diversity was applied for analyzing complexity of species diversity for a sample through several indices,26 including observed species, chao, ace, shannon, and simpson. The complexity of sample is proportional with the first four values, whereas with a negative correlation with simpson value. Observed species value, chao value, and ace value can reflect the species richness of the community. Shannon and simpson values can reflect the species diversity of the community, affected by both species richness and species evenness, that is, the two values also consider the abundance of each species. With the same species richness, the greater the species evenness and the greater the community diversity. The calculation formula of each indice can be found at http://www.mothur.org/wiki/Calculators.
Relative abundance refers to the relative abundance of OTU and species. The OTU were used for species diversity indices (shannon, simpson), species richness (sob, ace, chao), the indices were calculated by Mothur (v1.31.2), and one-way analysis of variance was used for multigroup comparison. Blotbox, Venn diagram, and rarefaction curve were drawn, the the aforementioned analysis is done by R software version 3.0.3 (The R Foundation for Statistical Computing, Vienna, Austria). Principal component analysis (PCA) was used to construct a two-dimensional graph to summarize factors mainly responsible for this difference. Based on the OTU abundance information, the relative abundance of each OTU in each sample will be calculated, and the PCA of OTU was done with the relative abundance value. The software used in this step was package ′ade4′ of R software version 3.0.3. The OTU in different samples were summarized in a histogram, and the histogram was drawn with R software version 3.0.3. Kruskal-Wallis tests (Metastats; http://cbcb.umd.edu/software/metastats) were used to determine which taxonomic groups were significantly different between groups of samples. We adjusted the obtained P value by a Benjamini-Hochberg false discovery rate correction (function ′p.adjust′ in the stats package of R software version 3.0.3).27
Statistical Analysis
The measurement data were used to describe the central tendency of the data, or median, (quartile spacing), which describes discrete trends. Prior to analysis of all data, the normality test was carried out, data were expressed as mean ± standard deviation, and comparison among groups were performed using analysis of variance. The quantitative data of the case and control groups were tested for the homogeneity of variance in the three groups, so as to decide whether to use variance analysis or Wilcoxon rank sum test. Nonparametric tests were used for nonnormal distribution of data. SPSS 22 software (IBM Corp., Armonk, New York, United States) was used for statistical analysis.
RESULTS
Fifty-one middle-aged men underwent full-night attended PSG and provided oropharyngeal samples; 40 of them were classified to have quality samples. The 40 participants were divided into a non-OSA group (n = 14) and an OSA group (n = 26).
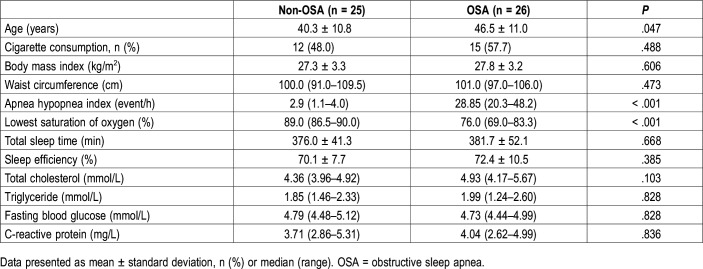
As shown in Table 1, no significant differences were observed in terms of cigarette consumption, body mass index, abdominal circumference, total sleep time, sleep efficiency, total cholesterol, triglyceride, fasting blood glucose and C-reactive protein. The OSA group showed significantly higher age than in the non-OSA group (46.5 ± 11.0 years versus 40.3 ± 10.8 years, P = .047). OSA assessed by AHI and lowest saturation of oxygen were significantly worse in the non-OSA group compared to the severe OSA group.
Table 1.
Anthropometric and clinical characteristics between non-OSA and OSA groups.
Sequencing Summary
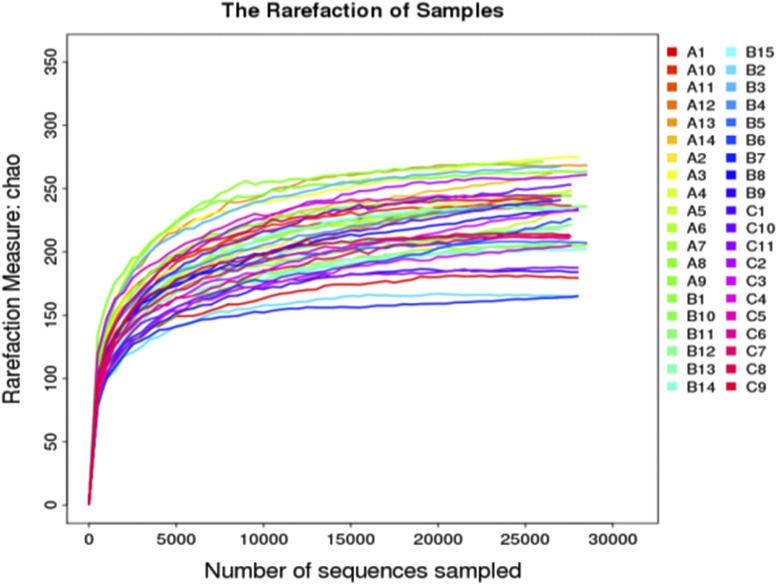
A total of 1,307,037 high-quality reads were generated after quality testing in 40 samples with a mean of 32,675 reads per sample. As shown in Figure 1, the mean number of observed OTUs reached a plateau at ∼10,000 sequence reads, and did not increase with the number of sequencing samples. This indicates that the result of sample sequencing is sufficient to capture the diversity of microorganisms. The tags were clustered into OTUs with a 97% threshold and 461 OTUs representative sequences were generated for 40 samples.
Figure 1. Sample-based rarefaction analysis of the three groups.
A = non-OSA, B = moderate OSA, C = severe OSA, OSA = obstructive sleep apnea.
The Alpha Diversity Analyses Between OSA and Non-OSA Groups
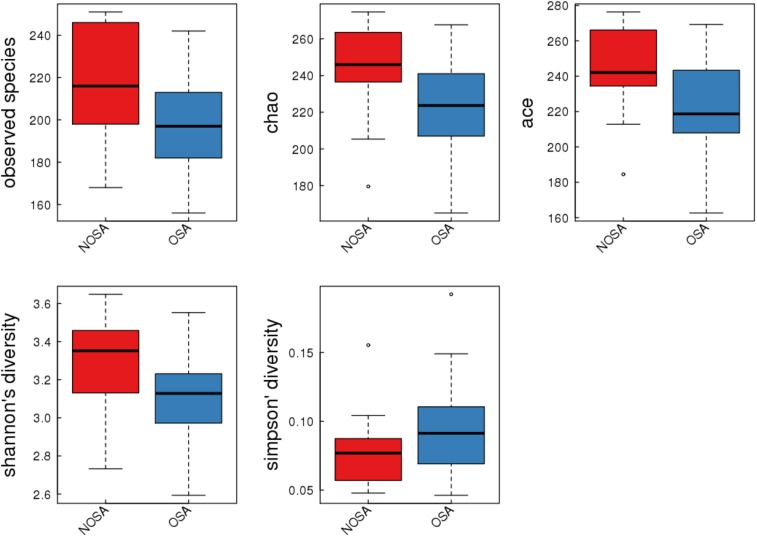
The alpha diversity analyses between OSA and non-OSA groups are outlined in Table 2 and Figure 2. Compared to those in the non-OSA group, those in the OSA group were observed to exhibit significantly lower bacterial biodiversity, reflected in a lower diversity indexes such as sobs index (198.33 ± 21.71 versus 216.57 ± 26.21, P = .022), chao index (221.30 ± 26.62 versus 243.86 ± 26.20, P = .014), ace index (222.17 ± 27.15 versus 242.42 ± 25.81, P = .028), and shannon index (3.14 ± 0.23 versus 3.31 ± 0.26, P = .035). In order to observe the changes in the microbial diversity with the severity of OSA, we further divided participants into non-, moderate, and severe OSA groups and compared the microbial diversity, abundance of bacteria, and taxonomic differences in each group.
Table 2.
Comparison of alpha diversity between non-OSA and OSA groups.
Figure 2. Alpha diversity indices boxplot in NOSA and OSA groups.
NOSA = non-OSA, OSA = obstructive sleep apnea.
Overall Structural Changes of Oropharynx Microbiota Among Groups
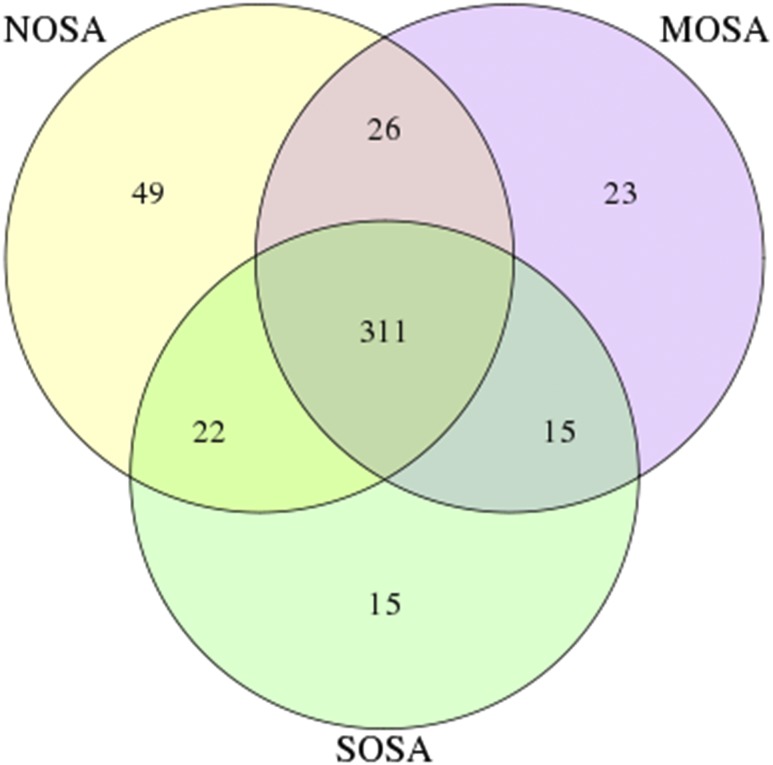
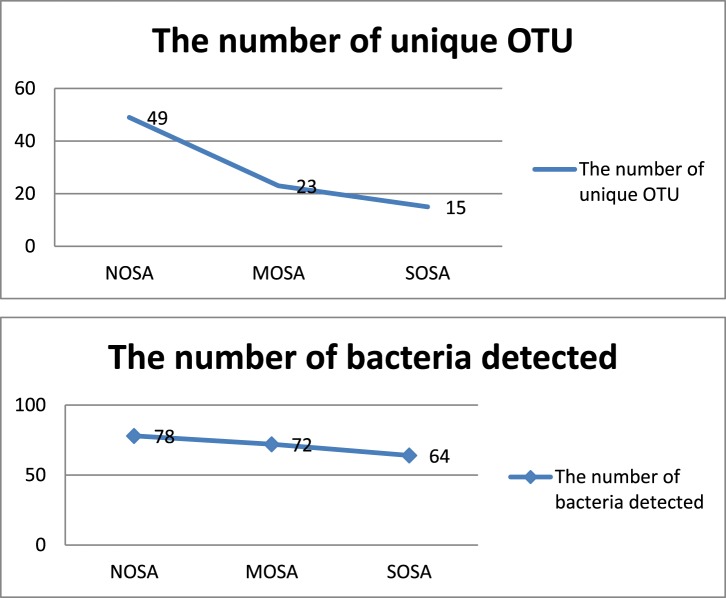
As shown in Figure 3, a Venn diagram was generated to visualize the overlapped and unique OTUs in non-, moderate and severe OSA groups. The number of total OTUs decreased from 408 in non-OSA to 375 in moderate OSA and to 363 in the severe OSA group. There were 49 unique OTU in the non-OSA group, 23 in the moderate OSA group, and 15 in the severe OSA group. The two observations indicate that the number of total and unique OTUs decreased from non-OSA to moderate OSA and to severe OSA. As shown in Figure 4, the number of detected bacteria also decreased from 78 in the non-OSA group to 72 in the moderate OSA group, and to 64 in the severe OSA group.
Figure 3. Venn diagram to visualize the shared and unique out across NOSA, MOSA, and SOSA groups.
MOSA = moderate OSA, NOSA = non-OSA, OSA = obstructive sleep apnea, SOSA = severe OSA.
Figure 4. Changes in the number of detected bacteria and unique OTUs in the NOSA, MOSA, and SOSA groups.
MOSA = moderate OSA, NOSA = non-OSA, OSA = obstructive sleep apnea, OTU = operational taxonomic unit, SOSA = severe OSA.
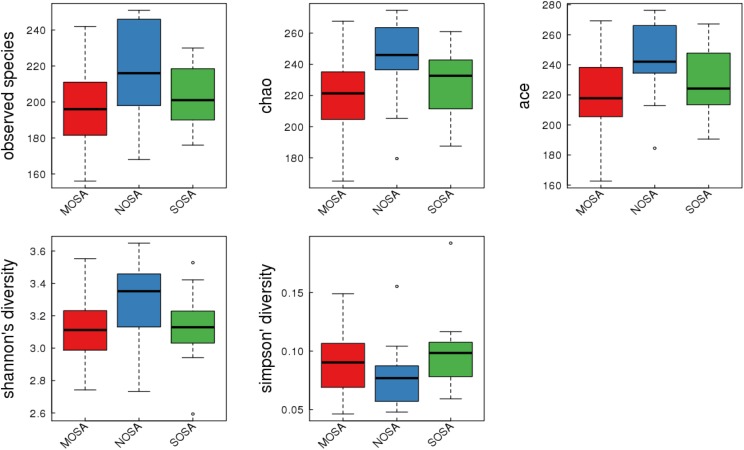
The alpha diversity analyses between non-OSA, moderate OSA, and severe OSA groups are provided in Table 3 and Figure 5. Compared to those in the non-OSA group, those with moderate OSA were observed to exhibit significantly lower bacterial biodiversity, reflected in lower diversity indexes such as sobs index (195.20 ± 23.44 versus 216.57 ± 26.21, P = .018), chao index (216.80 ± 28.93 versus 243.86 ± 26.20, P = .009), and ace index (217.53 ± 29.33 versus 242.42 ± 25.81, P = .016). Those with severe OSA displayed a decreasing (not significant) trend in bacterial biodiversity, reflected by lowering sobs, chao, and ace index, compared to those with non-OSA.
Table 3.
Comparison of alpha diversity among non-, moderate, and severe OSA groups.
Figure 5. Alpha diversity indices boxplot in NOSA, MOSA, and SOSA groups.
MOSA = moderate OSA, NOSA = non-OSA, OSA = obstructive sleep apnea, SOSA = severe OSA.
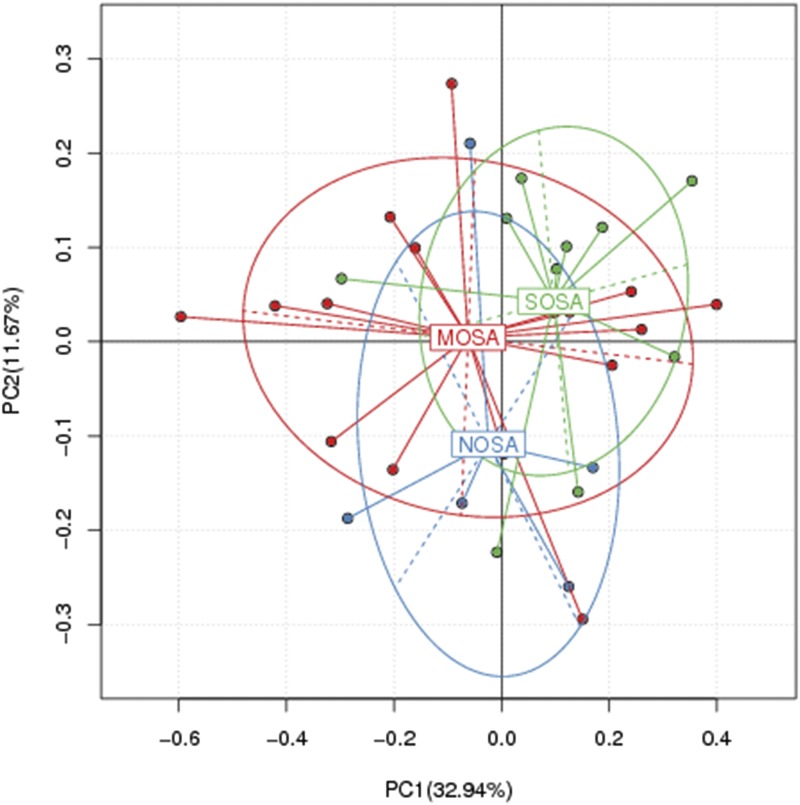
As in Figure 6, PCA of non-OSA, moderate OSA, and severe OSA groups was performed and two-dimensional scatterplots were generated to visualize whether the groups have different microbial communities. This method allows us to present dissimilarities of the data in terms of distance. Each axis percentage describes the amount for which one dimension can account. The composition of the oropharynx microbial communities of the non-OSA and OSA groups were found to be distinct, as presented in Figure 6. A clear separation was observed between non-OSA and moderate and severe OSA in the PCA between the two clusters (Adonis, Euclidean, P = .0635, R2 = .09821), representing the microbial compositions of non-OSA and moderate and severe OSA groups and possibly indicating two extremely different oropharynx environments. However, moderate and severe OSA groups were seen to have similar oropharynx environment.
Figure 6. Principal coordinate analysis in NOSA, MOSA, and SOSA groups.
MOSA = moderate OSA, NOSA = non-OSA, OSA = obstructive sleep apnea, SOSA = severe OSA.
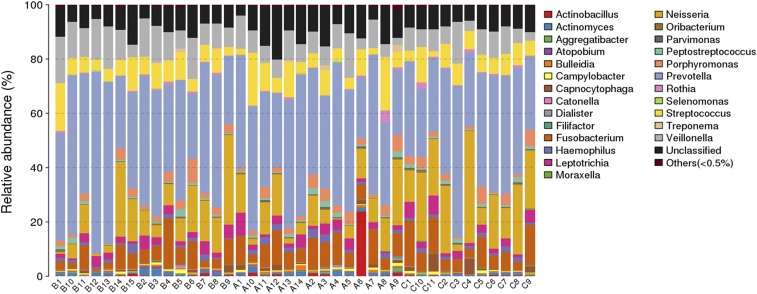
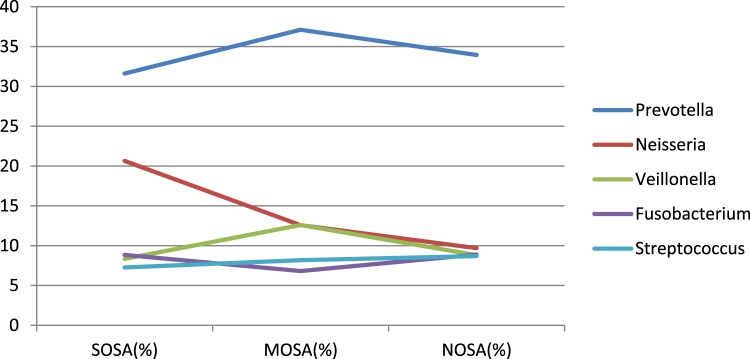
As shown in Figure 7 and Figure 8, the number of detected bacteria in non-OSA, moderate OSA, and severe OSA groups was 78, 72, and 64, respectively. The main detected bacteria in three groups included Prevotella, Neisseria, Veillonella, Fusobacterium, Streptococcus, and unclassified ones. The unclassified bacteria accounted for about 10% of the bacteria in each group. After excluding the unclassified bacteria, Prevotella, Neisseria, Veillonella, Fusobacterium, and Streptococcus made up more than 70% of the bacteria in each group, whereas their distribution in each group was also different. The main bacteria in the three groups were Prevotella, which accounted for 31.61% in non-OSA and 37.11% in moderate OSA groups and 33.95% in the severe OSA group of the detected bacteria. More interestingly, the proportion of Neisseria was significantly higher in the severe OSA group (20.64%), followed by the moderate OSA group (12.58%), and the lowest in the non-OSA group (9.69%).
Figure 7. The taxonomic composition distribution in samples of genus level.
The species of which abundance is less than 0.5% in all samples were classified into “others.” A = non-OSA, B = moderate OSA, C = severe OSA, OSA = obstructive sleep apnea.
Figure 8. The distribution of five main bacteria in NOSA, MOSA, and SOSA groups.
MOSA = moderate OSA, NOSA = non-OSA, OSA = obstructive sleep apnea, SOSA = severe OSA.
Comparison of Oropharynx Microbiota Between Non-, Moderate, and Severe OSA Groups on Genus Level
While analyzing the detected bacteria at genus level, results showed that Glaciecola was not detected in moderate and severe OSA groups, compared to the non-OSA group (0.772 ± 0.4754, P < .001). In addition, distribution of Tannerella (9.9426 ± 1.5577 versus 2.9283 ± .5628, false discovery rate [FDR] = 0.027), Anaerovorax (3.73 ± 0.7971 versus 0.9486 ± 0.3347, FDR = 0.027), and Halomonas (1.3922 ± 0.3513 versus 0.2206 ± 0.1, FDR = 0.040) in the severe OSA group was significantly lowered, compared to the non-OSA group (Table 4).
Table 4.
Difference in the composition of bacteria at genus level among groups.
DISCUSSION
To our knowledge, this is the first preliminary exploration to explore the changes in oropharynx microbiota in OSA using a currently accepted method (16S rDNA genes)28 in middle-aged men with similar body mass index and other characteristics in order to establish the role of OSA on the topic of interest.
The main results included a significant decrease in the bacterial biodiversity of the OSA group compared with the non-OSA group, with the most significant decrease occurring in the moderate OSA group. Total and unique OTUs decreased from non-OSA to severe OSA. There were two extremely different oropharyngeal microbial communities in the non-OSA and moderate and severe OSA groups. More interestingly, the proportion of Neisseria was the highest in the severe OSA group, followed by the moderate OSA group. Glaciecola was not detected in moderate and severe OSA. Distribution of Tannerella, Anaerovorax, and Halomonas in the severe OSA group was significantly lowered. These results may indicate that oropharynx microbiota is disturbed in those with OSA, characterized by lowered diversity and abundance.
Over 700 bacterial species have been identified in the human mouth.29,30 In individuals with OSA, oral self-cleaning is decreased and function of salivary glands is impaired.31–34 Furthermore, dramatic changes in airway pressure at night and decreased air flow, moisture, and oxygen content and changed pH are well established in OSA. Therefore, it is reasonable to believe that the aforementioned changes in OSA may explain the dysbiosis of oropharynx microbiota in moderate to severe OSA. In terms of diversity, the diversity indexes are lowered in OSA groups (moderate to severe). Indeed, low diversity of microorganisms is associated with a plethora of diseases, including diabetes, obesity, and chronic respiratory diseases such as asthma and chronic obstructive pulmonary disease,35–42 some of which are risk factors for or coexist with OSA.43–46 In fact, lower bacterial diversity in asthma is associated with airflow obstruction,39,40 which is also a hallmark of OSA.47 A decrease in the diversity of bronchial microbiome is paralleled by advanced chronic obstructive pulmonary disease.38,41 Similarly, low diversity in gut microbiota is associated with or cause obesity and inflammatory bowel disease.35,37 In the present study, the different patient groups were designed with the hypothesis that there is a “dose-dependent relationship” between the detected microorganisms and the severity of OSA, but in reality, this may not be the case. With the aggravation of OSA, only moderate OSA showed a statistically significant decrease in diversity, whereas severe OSA showed no significant decrease. We speculate that there may be a compensation mechanism in patients with severe OSA. When the degree of OSA is very serious, the self-protection of the body makes the harmful bacteria such as Tannerella and Cloacibacterium decrease, and then makes the diversity index of the OSA population increase slightly, which reduces this difference. This result may also be due to the study’s small sample size or inclusion of smokers. A larger sample size may show a greater difference. The influencing factors of flora in the oral cavity have not yet been clarified as well as in the intestinal tract. There may be some unknown confounding factors that affect the changes of oral microorganisms. The confounders we considered in the design of our study had no effect on our results.
With the aggravation of the severity in OSA, the species of detected microbiota decreased from 78 species of non-OSA to 72 species of moderate OSA, and then to 64 species of severe OSA. The changes of total OTU and unique OTU shown in the Venn diagram showed the same downward trend. These changes may cause local immune disorders to induce inflammation.48
Another interesting observation is that Glaciecola was not detected in the moderate and severe OSA groups. Glaciecola is a Gram-negative, aerobic, nonmotile and ovoid or rod-shaped bacterial strain isolated from marine environments.49 Glaciecola polaris, acting as an antioxidant, protects oxidatively injured mouse macrophages from oxidatively modified low-density lipoprotein,50 which is a marker for atherosclerosis51 and is increased in OSA and decreased after continuous positive airway pressure treatment.52 Furthermore, the presence of airway and systemic inflammation in OSA is confirmed.53–57 Therefore, we speculate changes in local microenvironment make the oropharyngeal stabilization of Glaciecola gradually decline, or the local microenvironment of oropharyngeal loses its protection from oxidative damage, thus inducing or aggravating local inflammation of the upper airway in OSA.
Specific sites in the respiratory tract contain specialized bacterial communities.36,58 When in equilibrium, the airway microbiome can restrict the growth of multiple invading pathogens, whereas when disrupted, it can have adverse consequences.59 The oropharynx is characterized by streptococcal species, Neisseria spp, Rothia spp. and anaerobes, including Veillonella spp., Prevotella spp., and Leptotrichia spp.58,60–62 In the current study, Neisseria is increased dramatically with the worsening of OSA, which may have adverse effects on the dynamic balance of local microenvironment. Overgrowth of pathogenic bacteria Neisseria flavescens in ex vivo duodenal mucosal explants of healthy control patients and in the oral cavity63 and duodenum64 of adult patients with celiac disease could lead to aberrant activation of the immune system to induce inflammation in dendritic cells. Therefore, it may be feasible that the inflammatory conditions occurring in the oral cavity of patients with OSA may favor the colonization of Neisseria strains and promote the maintenance of a proinflammatory status. However, our results in this aspect are suggestive and warrant further confirmation.
Currently, there is no relevant report about Tannerella in an OSA population. Previous studies reported that Tannerella forsythia is a Gram-negative anaerobic organism with proinflammatory effects that increases in the presence of periodontal disease, and in those who smoke.65–67 We observed that Tannerella was lower in the OSA group. This also suggests that Tannerella involvement in OSA may be a mechanism other than proinflammatory action, whereas the results need to be confirmed in larger samples.
No studies have been reported for Anaerovorax regarding human disease or health.
Halomonas species are Gram-negative, catalase-positive bacteria. A novel lipid A fraction from the lipopolysaccharide of Halomonas magadiensis can significantly inhibit the synthesis of tumor necrosis factor alpha (TNF-α) by human monocytes activated, which may play an anti-inflammatory role.68 Although TNF-α was not involved in this study, numerous studies have demonstrated increased circulating TNF-α levels in patients with OSA.69,70 Therefore, we speculate that the abundance of Halomonas may be lower as the severity of OSA increases. However, few studies have been conducted on the relationship between Halomonas and health or disease, and further studies are required to confirm our findings.
Cloacibacteria is Gram-negative bacteria that had recently been shown to be more abundant in inflamed sites than noninflamed sites in patients with irritable bowel disease, which may act as proinflammatory property when microbial diversity is low.71,72 However, it shows a declining trend in oropharynx microbiota in patients with OSA, was not detected in the moderate OSA group, and the difference was statistically significant compared with the non-OSA group. There was no significant difference between the non-OSA and severe OSA groups. We speculated that the upper airway environment is different from the intestinal in terms of anatomy, epithelial cell type, and oxygen content.73,74 These microbes play a proinflammatory role in the development of intestinal diseases,75 but are not necessarily suitable for the upper airway. These taxa may require further investigation using animal models to determine whether these bacteria can actually induce inflammation under specific conditions of OSA.
Nevertheless, the current study contains several limitations. First, the cross-sectional nature precludes investigations of the underlying mechanisms and of causal association. Second, the low power of this study due to the small sample size, and exclusion of patients with mild OSA and female patients may hamper the generalization of the current observation and may also account for the smaller number of genera identified as differing between groups in the analyses. However, strict inclusion and exclusion criteria to generate the sole effects of OSA, strict sampling procedure by the same staff, and data analysis by blinded staff may have powered our results and it is at least sufficient for hypothesis generation. Third, we did not exclude smokers. There was no statistical difference in smoking rate among the three groups, which may indicate that our results were not disturbed by smoking. Nonetheless, the smoking factor needs to be taken seriously in future studies. Finally, we failed to assess microbial metabolic and functional pathways of these communities to determine the relationship between microorganisms and local microenvironment and metabolites, and thus some of the conclusions are based on speculations.
CONCLUSIONS
The current study provides evidence that changes in oral microbiota are associated with OSA, which may shed new light on explanation for the pathogenesis. The associations between distinct taxa and OSA require further longitudinal, interventional, and experimental investigations to evaluate causal relationships.
DISCLOSURE STATEMENT
The project was supported by Xinjiang Uygur Autonomous Region Medical Joint Fund project (2016D01C114). The authors report no conflicts of interest.
ACKNOWLEDGMENTS
The authors thank Professor Nanfang Li for providing the idea for us and for regulating all the procedures of the experiment. The authors thank Dr. Liang Shao and Xiaoguang Yao for the great help in data analysis and interpretation. The authors thank all the staff of the sleep monitoring center for the great help on data collection and PSG analysis. The authors thank all of the participants of the study.
ABBREVIATIONS
- AHI
apnea-hypopnea index
- FDR
false discovery rate
- OSA
obstructive sleep apnea
- OTU
operational taxonomic unit
- PSG
polysomnography
- PCA
principal coordinate analysis
REFERENCES
- 1.Jordan AS, McSharry DG, Malhotra A. Adult obstructive sleep apnoea. Lancet. 2014;383(9918):736–747. doi: 10.1016/S0140-6736(13)60734-5. [DOI] [PMC free article] [PubMed] [Google Scholar]
- 2.Heinzer R, Vat S, Marques-Vidal P, et al. Prevalence of sleep-disordered breathing in the general population: THE HypnoLaus study. Lancet Respir Med. 2015;3(4):310–318. doi: 10.1016/S2213-2600(15)00043-0. [DOI] [PMC free article] [PubMed] [Google Scholar]
- 3.Younes M. Contributions of Upper Airway Mechanics and Control Mechanisms to Severity of Obstructive Apnea. Am J Respir Crit Care Med. 2003;168(6):645–658. doi: 10.1164/rccm.200302-201OC. [DOI] [PubMed] [Google Scholar]
- 4.Pham LV, Schwartz AR. The pathogenesis of obstructive sleep apnea. J Thorac Dis. 2015;7(8):1358–1372. doi: 10.3978/j.issn.2072-1439.2015.07.28. [DOI] [PMC free article] [PubMed] [Google Scholar]
- 5.Kimoff RJ, Hamid Q, Divangahi M, et al. Increased upper airway cytokines and oxidative stress in severe obstructive sleep apnoea. Eur Respir J. 2011;38(1):89–97. doi: 10.1183/09031936.00048610. [DOI] [PubMed] [Google Scholar]
- 6.White DP. The pathogenesis of obstructive sleep apnea: advances in the past 100 years. Am J Respir Cell Mol Biol. 2006;34(1):1–6. doi: 10.1165/rcmb.2005-0317OE. [DOI] [PubMed] [Google Scholar]
- 7.Shepherd K, Hillman D, Holloway R, Eastwood P. Mechanisms of nocturnal gastroesophageal reflux events in obstructive sleep apnea. Sleep Breath. 2011;15(3):561–570. doi: 10.1007/s11325-010-0404-x. [DOI] [PubMed] [Google Scholar]
- 8.Kim KS, Kim JH, Park SY, et al. Smoking induces oropharyngeal narrowing and increases the severity of obstructive sleep apnea syndrome. J Clin Sleep Med. 2012;8(4):367–374. doi: 10.5664/jcsm.2024. [DOI] [PMC free article] [PubMed] [Google Scholar]
- 9.Dantas DA, Mauad T, Silva LF, Lorenzi-Filho G, Formigoni GG, Cahali MB. The extracellular matrix of the lateral pharyngeal wall in obstructive sleep apnea. Sleep. 2012;35(4):483–490. doi: 10.5665/sleep.1730. [DOI] [PMC free article] [PubMed] [Google Scholar]
- 10.Almendros I, Carreras A, Ramirez J, Montserrat JM, Navajas D, Farre R. Upper airway collapse and reopening induce inflammation in a sleep apnoea model. Eur Respir J. 2008;32(2):399–404. doi: 10.1183/09031936.00161607. [DOI] [PubMed] [Google Scholar]
- 11.Zhang Y, Wang X, Li H, Ni C, Du Z, Yan F. Human oral microbiota and its modulation for oral health. Biomed Pharmacother. 2018;99:883–893. doi: 10.1016/j.biopha.2018.01.146. [DOI] [PubMed] [Google Scholar]
- 12.Holt SC, Ebersole J, Felton J, Brunsvold M, Kornman KS. Implantation of Bacteroides gingivalis in nonhuman primates initiates progression of periodontitis. Science. 1988;239(4835):55–57. doi: 10.1126/science.3336774. [DOI] [PubMed] [Google Scholar]
- 13.Costalonga M, Herzberg MC. The oral microbiome and the immunobiology of periodontal disease and caries. Immunol Lett. 2014;162(2 Pt A):22–38. doi: 10.1016/j.imlet.2014.08.017. [DOI] [PMC free article] [PubMed] [Google Scholar]
- 14.Liu B, Faller LL, Klitgord N, et al. Deep sequencing of the oral microbiome reveals signatures of periodontal disease. PLoS One. 2012;7(6):e37919. doi: 10.1371/journal.pone.0037919. [DOI] [PMC free article] [PubMed] [Google Scholar]
- 15.Saikaly SK, Saikaly TS, Saikaly LE. Recurrent aphthous ulceration: a review of potential causes and novel treatments. J Dermatolog Treat. 2018;29(6):542–552. doi: 10.1080/09546634.2017.1422079. [DOI] [PubMed] [Google Scholar]
- 16.Blod C, Schlichting N, Schülin S, et al. The oral microbiome—the relevant reservoir for acute pediatric appendicitis? Int J Colorectal Dis. 2018;33(2):209–218. doi: 10.1007/s00384-017-2948-8. [DOI] [PubMed] [Google Scholar]
- 17.Atarashi K, Suda W, Luo C, et al. Ectopic colonization of oral bacteria in the intestine drives TH1 cell induction and inflammation. Science. 2017;358(6361):359–365. doi: 10.1126/science.aan4526. [DOI] [PMC free article] [PubMed] [Google Scholar]
- 18.Roszyk E, Puszczewicz M. Role of human microbiome and selected bacterial infections in the pathogenesis of rheumatoid arthritis. Reumatologia. 2017;55(5):242–250. doi: 10.5114/reum.2017.71641. [DOI] [PMC free article] [PubMed] [Google Scholar]
- 19.Inancli HM, Enoz M. Obstructive sleep apnea syndrome and upper airway inflammation. Recent Pat Inflamm Allergy Drug Discov. 2010;4(1):54–57. doi: 10.2174/187221310789895568. [DOI] [PubMed] [Google Scholar]
- 20.Suárez Moya A. Microbiome and next generation sequencing. Rev Esp Quimioter. 2017;30(5):305–311. [PubMed] [Google Scholar]
- 21.Claesson MJ, Qiong W, Orla OS, et al. Comparison of two next-generation sequencing technologies for resolving highly complex microbiota composition using tandem variable 16S rRNA gene regions. Nucleic Acids Res. 2010;38(22):e200. doi: 10.1093/nar/gkq873. [DOI] [PMC free article] [PubMed] [Google Scholar]
- 22.Liang S, Li N, Heizhati M, et al. What do changes in concentrations of serum surfactant proteins A and D in OSA mean? Sleep Breath. 2015;19(3):955–962. doi: 10.1007/s11325-014-1106-6. [DOI] [PubMed] [Google Scholar]
- 23.Lu H, Qian G, Ren Z, et al. Alterations of Bacteroides sp., Neisseria sp., Actinomyces sp., and Streptococcus sp. populations in the oropharyngeal microbiome are associated with liver cirrhosis and pneumonia. BMC Infect Dis. 2015;15:239. doi: 10.1186/s12879-015-0977-x. [DOI] [PMC free article] [PubMed] [Google Scholar]
- 24.Tanja M, Salzberg SL. FLASH: fast length adjustment of short reads to improve genome assemblies. Bioinformatics. 2011;27(21):2957–2963. doi: 10.1093/bioinformatics/btr507. [DOI] [PMC free article] [PubMed] [Google Scholar]
- 25.Edgar RC. UPARSE: highly accurate OTU sequences from microbial amplicon reads. Nat Methods. 2013;10(10):996–998. doi: 10.1038/nmeth.2604. [DOI] [PubMed] [Google Scholar]
- 26.Schloss PD, Westcott SL, Ryabin T, et al. Introducing mothur: open-source, platform-independent, community-supported software for describing and comparing microbial communities. Appl Environ Microbiol. 2009;75(23):7537–7541. doi: 10.1128/AEM.01541-09. [DOI] [PMC free article] [PubMed] [Google Scholar]
- 27.White JR, Nagarajan N, Pop M. Statistical methods for detecting differentially abundant features in clinical metagenomic samples. PLOS Comput Biol. 2009;5(4):e1000352. doi: 10.1371/journal.pcbi.1000352. [DOI] [PMC free article] [PubMed] [Google Scholar]
- 28.Arnold JW, Roach J, Azcarate-Peril MA. Emerging technologies for gut microbiome research. Trends Microbiol. 2016;24(11):887–901. doi: 10.1016/j.tim.2016.06.008. [DOI] [PMC free article] [PubMed] [Google Scholar]
- 29.Paster BJ, Olsen I, Aas JA, Dewhirst FE. The breadth of bacterial diversity in the human periodontal pocket and other oral sites. Periodontol 2000. 2006;42:80–87. doi: 10.1111/j.1600-0757.2006.00174.x. [DOI] [PubMed] [Google Scholar]
- 30.He J, Li Y, Cao Y, Xue J, Zhou X. The oral microbiome diversity and its relation to human diseases. Folia Microbiol (Praha) 2015;60(1):69–80. doi: 10.1007/s12223-014-0342-2. [DOI] [PubMed] [Google Scholar]
- 31.Roffel S, Nazmi K, Gibbs S, Boink MA, Veerman ECI, Bolscher JGM. Saliva-derived host defense peptides histatin1 and ll-37 increase secretion of antimicrobial skin and oral mucosa chemokine ccl20 in an il-1α-independent manner. J Immunol Res. 2017;2017:3078194. doi: 10.1155/2017/3078194. [DOI] [PMC free article] [PubMed] [Google Scholar]
- 32.Ginsburg I, Kohen R, Koren E. Saliva: a ‘solubilizer’ of lipophilic antioxidant polyphenols. Oral Dis. 2013;19(3):321–322. doi: 10.1111/odi.12038. [DOI] [PubMed] [Google Scholar]
- 33.Frenkel ES, Ribbeck K. Salivary mucins promote the coexistence of competing oral bacterial species. ISME J. 2017;11(5):1286–1290. doi: 10.1038/ismej.2016.200. [DOI] [PMC free article] [PubMed] [Google Scholar]
- 34.Frenkel ES, Ribbeck K. Salivary mucins in host defense and disease prevention. J Oral Microbiol. 2015;7(1):29759. doi: 10.3402/jom.v7.29759. [DOI] [PMC free article] [PubMed] [Google Scholar]
- 35.Turnbaugh P, Hamady M, Yatsunenko T, et al. A core gut microbiome in obese and lean twins. Nature. 2009;457(7228):480–484. doi: 10.1038/nature07540. [DOI] [PMC free article] [PubMed] [Google Scholar]
- 36.Thomas S, Izard J, Walsh E, et al. The host microbiome regulates and maintains human health: a primer and perspective for non-microbiologists. Cancer Res. 2017;77(8):1783–1812. doi: 10.1158/0008-5472.CAN-16-2929. [DOI] [PMC free article] [PubMed] [Google Scholar]
- 37.Qin J, Li R, Raes J, et al. A human gut microbial gene catalogue established by metagenomic sequencing. Nature. 2010;464(7285):59–65. doi: 10.1038/nature08821. [DOI] [PMC free article] [PubMed] [Google Scholar]
- 38.Garcia-Nuñez M, Millares L, Pomares X, et al. Severity-related changes of bronchial microbiome in chronic obstructive pulmonary disease. J Clin Microbiol. 2014;52(12):4217–4223. doi: 10.1128/JCM.01967-14. [DOI] [PMC free article] [PubMed] [Google Scholar]
- 39.Huang YJ, Nelson CE, Brodie EL, et al. Airway microbiota and bronchial hyperresponsiveness in patients with suboptimally controlled asthma. Allergy Clin Immunol. 2011;127(2):372–381.e1-3. doi: 10.1016/j.jaci.2010.10.048. [DOI] [PMC free article] [PubMed] [Google Scholar]
- 40.Goldman DL, Chen Z, Shankar V, Tyberg M, Vicencio A, Burk R. Lower airway microbiota and mycobiota in children with severe asthma. J Allergy Clin Immunol. 2018;141(2):808–881.e7. doi: 10.1016/j.jaci.2017.09.018. [DOI] [PubMed] [Google Scholar]
- 41.Galiana A, Aguirre E, Rodriguez JC, et al. Sputum microbiota in moderate versus severe patients with COPD. Eur Respir J. 2014;43(6):1787–1790. doi: 10.1183/09031936.00191513. [DOI] [PubMed] [Google Scholar]
- 42.Denner DR, Sangwan N, Becker JB, et al. Corticosteroid therapy and airflow obstruction influence the bronchial microbiome, which is distinct from that of bronchoalveolar lavage in asthmatic airways. J Allergy Clin Immunol. 2016;137(5):1398–1405.e3. doi: 10.1016/j.jaci.2015.10.017. [DOI] [PMC free article] [PubMed] [Google Scholar]
- 43.Davies SE, Bishopp A, Wharton S, Turner AM, Mansur AH. The association between asthma and obstructive sleep apnea (OSA): a systematic review. J Asthma. 2019;56(2):118–129. doi: 10.1080/02770903.2018.1444049. [DOI] [PubMed] [Google Scholar]
- 44.Owens RL, Macrea MM, Teodorescu M. The overlaps of asthma or COPD with OSA: a focused review. Respirology. 2017;22(6):1073–1083. doi: 10.1111/resp.13107. [DOI] [PubMed] [Google Scholar]
- 45.Choi KM, Thomas RJ, Kim J, Lee SK, Yoon DW, Shin C. Overlap syndrome of COPD and OSA in Koreans. Medicine (Baltimore) 2017;96(27):e7241. doi: 10.1097/MD.0000000000007241. [DOI] [PMC free article] [PubMed] [Google Scholar]
- 46.Fitzgibbons C, Goldstein R, Gottlieb D, Moy M. 0451 Overlap syndrome of COPD and OSA: metabolic risk factors and systemic inflammation. Sleep. 2017;40(suppl_1):A168. [Google Scholar]
- 47.Jonassen T, Eagan TML, Lehmann S. Associations between obstructive sleep apnea syndrome (OSAS) and chronic airflow limitation in a general Norwegian population. Eur Respir J. 2012;40:467. [Google Scholar]
- 48.Shamriz O, Mizrahi H, Werbner M, Shoenfeld Y, Avni O, Koren O. Microbiota at the crossroads of autoimmunity. Autoimmun Rev. 2016;15(9):859–869. doi: 10.1016/j.autrev.2016.07.012. [DOI] [PubMed] [Google Scholar]
- 49.Zhang YG, Zhang XY, Mi ZH, et al. Glaciecola arctica sp. nov., isolated from Arctic marine sediment. Int J Syst Evol Microbiol. 2011;61(Pt 10):2338–2341. doi: 10.1099/ijs.0.027326-0. [DOI] [PubMed] [Google Scholar]
- 50.Qian G, Xu Z. Effect of polysaccharide extracted from Glaciecola polaris on the protection of mouse macrophages from oxidative injury. Bioresour Technol. 2007;98(1):202–206. doi: 10.1016/j.biortech.2005.12.004. [DOI] [PubMed] [Google Scholar]
- 51.Siennicka A, Zapolska-Downar D. The role of modified oxidation of low density lipoprotein in pathognesis of atherosclerosis. Postepy Hig Med Dosw. 2003;57(2):219–237. [PubMed] [Google Scholar]
- 52.Kizawa T, Nakamura Y, Takahashi S, Sakurai S, Yamauchi K, Inoue H. Pathogenic role of angiotensin II and oxidised LDL in obstructive sleep apnoea. Eur Respir J. 2009;34(6):1390–1398. doi: 10.1183/09031936.00009709. [DOI] [PubMed] [Google Scholar]
- 53.Wu J, Sun X, Wu Q, et al. Disrupted intestinal structure in a rat model of intermittent hypoxia. Mol Med Rep. 2016;13(5):4407–4413. doi: 10.3892/mmr.2016.5068. [DOI] [PubMed] [Google Scholar]
- 54.Lu D, Li N, Yao X, Zhou L. Potential inflammatory markers in obstructive sleep apnea-hypopnea syndrome. Bosn J Basic Med Sci. 2017;17(1):47–53. doi: 10.17305/bjbms.2016.1579. [DOI] [PMC free article] [PubMed] [Google Scholar]
- 55.Lu D, Abulimiti A, Wu T, Abudureyim A, Li N. Pulmonary surfactant-associated proteins and inflammatory factors in obstructive sleep apnea. Sleep Breath. 2018;22(1):99–107. doi: 10.1007/s11325-017-1536-z. [DOI] [PubMed] [Google Scholar]
- 56.Fleming WE, Ferouz-Colborn A, Samoszuk MK, et al. Blood biomarkers of endocrine, immune, inflammatory, and metabolic systems in obstructive sleep apnea. Clin Biochem. 2016;49(12):854–861. doi: 10.1016/j.clinbiochem.2016.05.005. [DOI] [PubMed] [Google Scholar]
- 57.Unnikrishnan D, Jun J, Polotsky V. Inflammation in sleep apnea: an update. Rev Endocr Metab Disord. 2015;16(1):25–34. doi: 10.1007/s11154-014-9304-x. [DOI] [PMC free article] [PubMed] [Google Scholar]
- 58.Human Microbiome Project Consortium Structure, function and diversity of the healthy human microbiome. Nature. 2012;486(7402):207–214. doi: 10.1038/nature11234. [DOI] [PMC free article] [PubMed] [Google Scholar]
- 59.Gomez C, Chanez P. The lung microbiome: the perfect culprit for COPD exacerbations? Eur Respir J. 2016;47(4):1034–1036. doi: 10.1183/13993003.00270-2016. [DOI] [PubMed] [Google Scholar]
- 60.de Steenhuijsen Piters WA, Huijskens EG, Wyllie AL, et al. Dysbiosis of upper respiratory tract microbiota in elderly pneumonia patients. ISME J. 2016;10(1):97–108. doi: 10.1038/ismej.2015.99. [DOI] [PMC free article] [PubMed] [Google Scholar]
- 61.Stearns JC, Davidson CJ, Mckeon S, et al. Culture and molecular-based profiles show shifts in bacterial communities of the upper respiratory tract that occur with age. ISME J. 2015;9(5):1268. doi: 10.1038/ismej.2015.49. [DOI] [PMC free article] [PubMed] [Google Scholar]
- 62.Segata N, Haake SK, Mannon P, et al. Composition of the adult digestive tract bacterial microbiome based on seven mouth surfaces, tonsils, throat and stool samples. Genome Biol. 2012;13(6):R42. doi: 10.1186/gb-2012-13-6-r42. [DOI] [PMC free article] [PubMed] [Google Scholar]
- 63.Iaffaldano L, Granata I, Pagliuca C, et al. Oropharyngeal microbiome evaluation highlights Neisseria abundance in active celiac patients. Sci Rep. 2018;8(1):11047. doi: 10.1038/s41598-018-29443-1. [DOI] [PMC free article] [PubMed] [Google Scholar]
- 64.D’Argenio V, Casaburi G, Precone V, et al. Metagenomics reveals dysbiosis and a potentially pathogenic N. flavescens strain in duodenum of adult celiac patients. Am J Gastroenterol. 2016;111(6):879–890. doi: 10.1038/ajg.2016.95. [DOI] [PMC free article] [PubMed] [Google Scholar]
- 65.Kubota M, Tanno-Nakanishi M, Yamada S, Okuda K, Ishihara K. Effect of smoking on subgingival microflora of patients with periodontitis in Japan. BMC Oral Health. 2011;11(1):1. doi: 10.1186/1472-6831-11-1. [DOI] [PMC free article] [PubMed] [Google Scholar]
- 66.Heikkinen AM, Pitkäniemi J, Kari K, et al. Effect of teenage smoking on the prevalence of periodontal bacteria. Clin Oral Investig. 2012;16(2):571–580. doi: 10.1007/s00784-011-0521-3. [DOI] [PubMed] [Google Scholar]
- 67.Chukkapalli SS, Rivera MF, Velsko IM, et al. Chronic oral infection with major periodontal bacteria Tannerella forsythia modulates systemic atherosclerosis risk factors and inflammatory markers. Pathog Dis. 2015;73(3):ftv009. doi: 10.1093/femspd/ftv009. [DOI] [PMC free article] [PubMed] [Google Scholar]
- 68.Ialenti A, Di Meglio P, Grassia G, et al. A novel lipid A from Halomonas magadiensis inhibits enteric LPS-induced human monocyte activation. Eur J Immunol. 2006;36(2):354–360. doi: 10.1002/eji.200535305. [DOI] [PubMed] [Google Scholar]
- 69.DeSantis S, Cambi J, Tatti P, Bellussi L, Passali D. Changes in ghrelin, leptin and pro-inflammatory cytokines after therapy in obstructive sleep apnea syndrome (OSAS) patients. Otolaryngol Pol. 2015;69(2):1–8. doi: 10.5604/00306657.1147029. [DOI] [PubMed] [Google Scholar]
- 70.Alexopoulos EI, Theologi V, Malakasioti G, et al. Obstructive sleep apnea, excessive daytime sleepiness, and morning plasma TNF-α levels in Greek children. Sleep. 2013;36(11):1633–1638. doi: 10.5665/sleep.3114. [DOI] [PMC free article] [PubMed] [Google Scholar]
- 71.Hirano A, Umeno J, Okamoto Y, et al. Comparison of the microbial community structure between inflamed and non-inflamed sites in patients with ulcerative colitis. J Gastroenterol Hepatol. 2018;33(9):1590–1597. doi: 10.1111/jgh.14129. [DOI] [PubMed] [Google Scholar]
- 72.Allen TD, Lawson PA, Collins MD, Enevold F, Tanner RS. Cloacibacterium normanense gen. nov., sp. nov., a novel bacterium in the family Flavobacteriaceae isolated from municipal wastewater. Int J Syst Evol Microbiol. 2006;56(Pt 6):1311–1316. doi: 10.1099/ijs.0.64218-0. [DOI] [PubMed] [Google Scholar]
- 73.Man WH, de Steenhuijsen Piters WA, Bogaert D. The microbiota of the respiratory tract: gatekeeper to respiratory health. Nat Rev Microbiol. 2017;15(5):259–270. doi: 10.1038/nrmicro.2017.14. [DOI] [PMC free article] [PubMed] [Google Scholar]
- 74.Okumura R, Takeda K. Maintenance of intestinal homeostasis by mucosal barriers. Inflamm Regen. 2018;38(1):5. doi: 10.1186/s41232-018-0063-z. [DOI] [PMC free article] [PubMed] [Google Scholar]
- 75.Zhao M, Tang S, Xin J, Wei Y, Liu D. Reactive oxygen species induce injury of the intestinal epithelium during hyperoxia. Int J Mol Med. 2018;41(1):322–330. doi: 10.3892/ijmm.2017.3247. [DOI] [PMC free article] [PubMed] [Google Scholar]
Associated Data
This section collects any data citations, data availability statements, or supplementary materials included in this article.


