Abstract
Arrestin proteins bind to active, phosphorylated G protein coupled receptors (GPCRs), thereby preventing G protein coupling, triggering receptor internalization, and affecting various downstream signaling pathways1,2. While there exists a wealth of structural information delineating the interactions between GPCRs and G proteins, less is known about how arrestins engage GPCRs. Here we report a cryoEM structure of full-length human neurotensin receptor 1 (NTSR1) in complex with truncated human β-arrestin 1 (βarr1ΔCT). We found that phosphorylation of NTSR1 was critical for obtaining a stable complex with βarr1ΔCT, and identified phosphorylated sites in both the third intracellular loop and the C-terminus that may promote this interaction. In addition, we observed a phosphatidylinositol-4,5-bisphosphate (PI(4,5)P2) molecule forming a bridge between the membrane side of NTSR1 transmembrane segments 1 and 4 and the C-lobe of arrestin. Compared to a structure of rhodopsin-arrestin-1, our structure displays an ~85° rotation of arrestin relative to the receptor. These findings highlight both conserved aspects but also the plasticity of arrestin-receptor interactions.
Upon activation, G protein-coupled receptors (GPCRs) signal through G protein pathways and arrestin pathways to regulate downstream cellular events. Recent studies suggest that drugs directing signaling through only one of these signaling pathways (known as biased drugs) may have fewer side effects3–5. There are four arrestin isoforms. Arrestin 1 (Arr1) and arrestin 4 (Arr4), also known as visual arrestins, are expressed in retinal rods and cones, respectively, and are important in turning off activated rhodopsin and color opsins, respectively. The non-visual arrestins, arrestin-2 and arrestin-3, also known as β-arrestin 1 (βarr1) and β-arrestin 2 (βarr2), are important in suppressing G protein signaling for most other GPCRs. In addition to their role in desensitization, non-visual arrestins regulate GPCR endocytosis through interactions with the clathrin-dependent endocytic machinery, and can act as scaffolds for a variety of other cytosolic signaling molecules downstream of GPCR activation, such as Src family tyrosine kinases and MAP kinases1,2,6,7. Recent breakthroughs in structural biology have generated class A GPCR - G protein complex structures for the three major classes of G proteins (Gs, Gi/o and Gq/11)8–13; yet the only available GPCR-arrestin complex structure is of rhodopsin-Arr114. Despite the structural similarities between rhodopsin and other class A GPCRs, there are fundamental differences in activation kinetics, phosphorylation and arrestin coupling15. To better understand the molecular details of the arrestin pathway, and how arrestins can interact with a diverse array of GPCRs, we initiated efforts to obtain structures of non-rhodopsin GPCR-β-arrestin complexes.
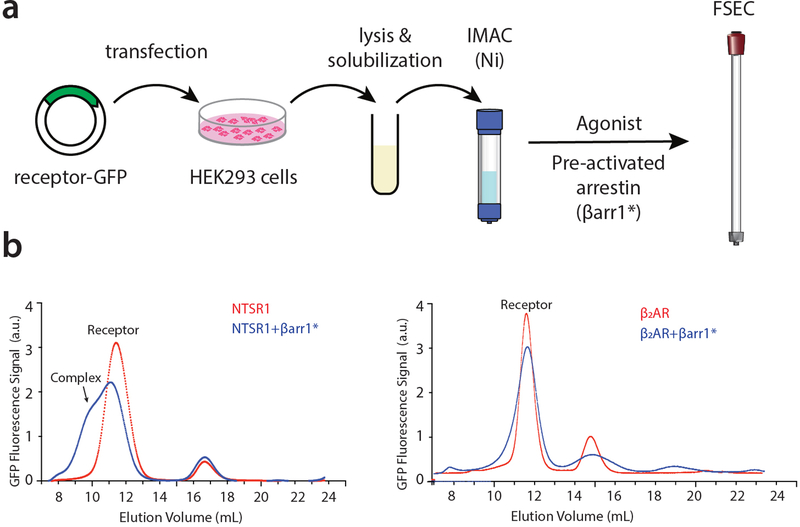
βarr1 was first identified as a regulator of β2 adrenergic receptor (β2AR) signaling16. While the β2AR has been one of the most extensively studied model systems for Family A GPCRs, initial efforts to form a stable β2AR-βarr1 complex for structural studies failed. In order to identify a more stable GPCR-β-arrestin complex, we devised a fluorescence-based screen where various candidate Family A receptors were expressed in HEK293 cells and evaluated for their ability to couple to activated βarr1 in a receptor-phosphorylation-independent manner (Extended Data Fig. 1). This screen revealed that the neurotensin receptor 1 (NTSR1) complexed with βarr1 in vitro and showed promise as a candidate for structural studies.
The NTSR1 mediates responses to neurotensin (NTS) and neuromedin N, both derived from the same precursor peptide17. NTS regulates a broad spectrum of physiologic processes including blood pressure, ileum contraction or relaxation, analgesia, and hypothermia, referenced in18. While there are three neurotensin receptor subtypes, most of the physiologic responses of NTS are mediated by NTSR1. NTSR1 is a promiscuous GPCR, coupling to Gs, Gq/11, Gi/o and G12/1318. Both active- and inactive-state structures of NTSR1 have been determined by crystallography19–21, and recently structures of the NTSR1-Gi complex have been determined by cryo-electron microscopy (cryoEM)9. Of interest, the cryoEM analysis revealed two distinct conformations of the NTSR1-Gi1 complex, termed C-state (canonical state) and NC-state (non-canonical state). The C-state is similar to other GPCR-G protein complexes, while the NC-state may represent an intermediate along the activation pathway9. Recent studies showed that an arrestin-biased positive allosteric modulator for NTSR1 suppressed self-administration of methamphetamine in rats5, providing further incentive to elucidate the structure of the NTSR1-βarr1 complex.
Preparation of the NTSR1-βarr1 complex
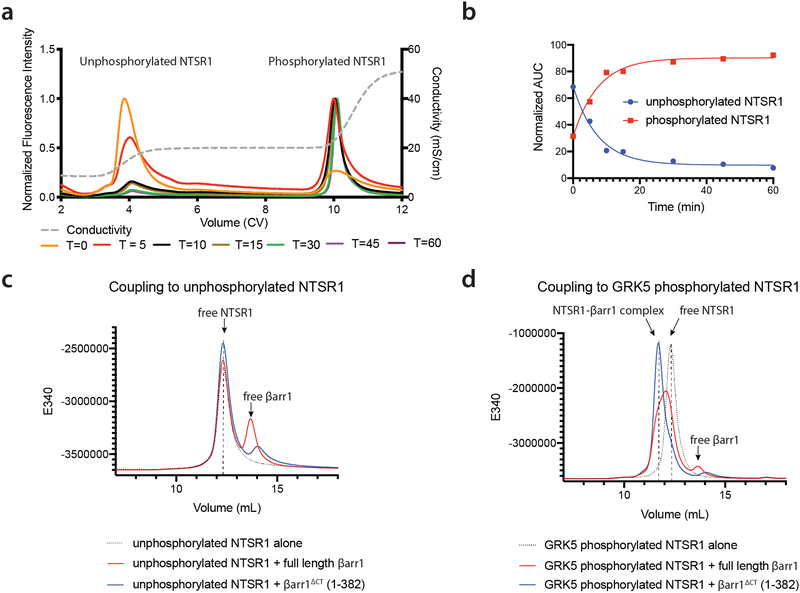
Given the importance of receptor phosphorylation for arrestin coupling, we chose to use full-length, native NTSR1 bound to the agonist NTS8–13 (amino acids 8–13 of NTS), and phosphorylated the receptor in vitro by G protein coupled receptor kinase subtype 5 (GRK5) using a protocol established for the β2 adrenergic receptor22. GPCR kinases (GRKs) facilitate arrestin-mediated desensitization and signaling by phosphorylating the receptor on its intracellular loops and C-terminus, which increases the receptor’s ability to bind and activate arrestins23. Previous analysis of GRK-mediated phosphorylation of NTSR1 indicated that while both GRK2 and GRK5 phosphorylate the C-terminus, GRK5 uniquely phosphorylates the third intracellular loop (ICL3)24. The extent of phosphorylation was monitored by analytical ion-exchange chromatography (Extended Data Fig. 2a,b, Extended Data Fig. 3a). Unphosphorylated receptor did not complex to full-length βarr1, while GRK5 phosphorylated NTSR1 did (Extended Data Fig.2c,d). Moreover, pre-activated βarr1, truncated at residue 38225, enhanced this coupling (Extended Data Fig. 2c,d), and we chose to use this construct, referred to as βarr1ΔCT, for subsequent experiments.
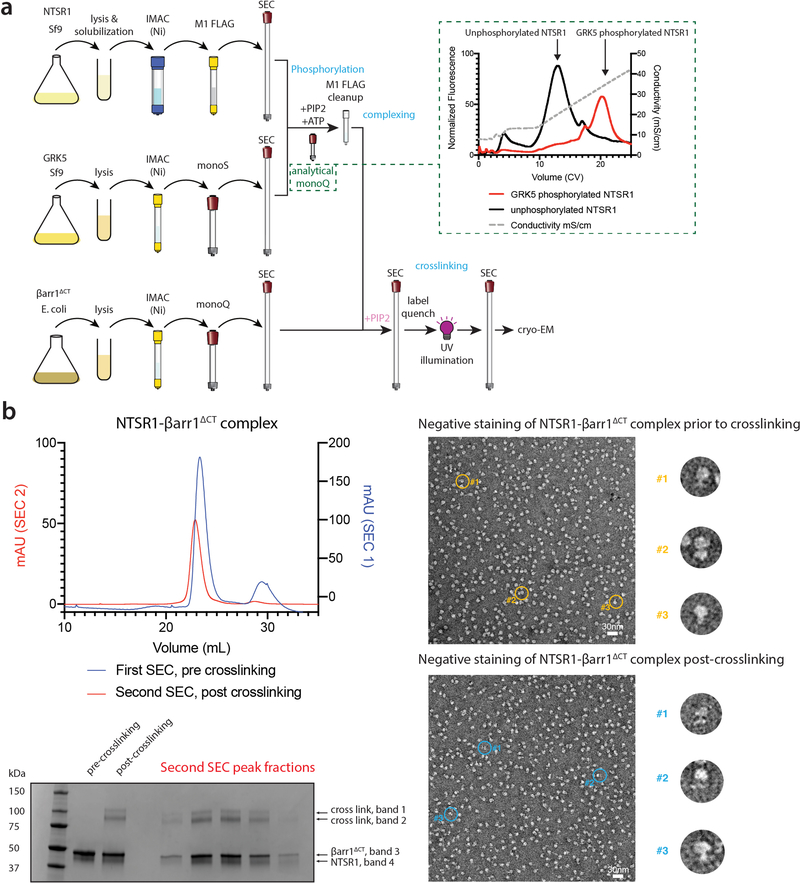
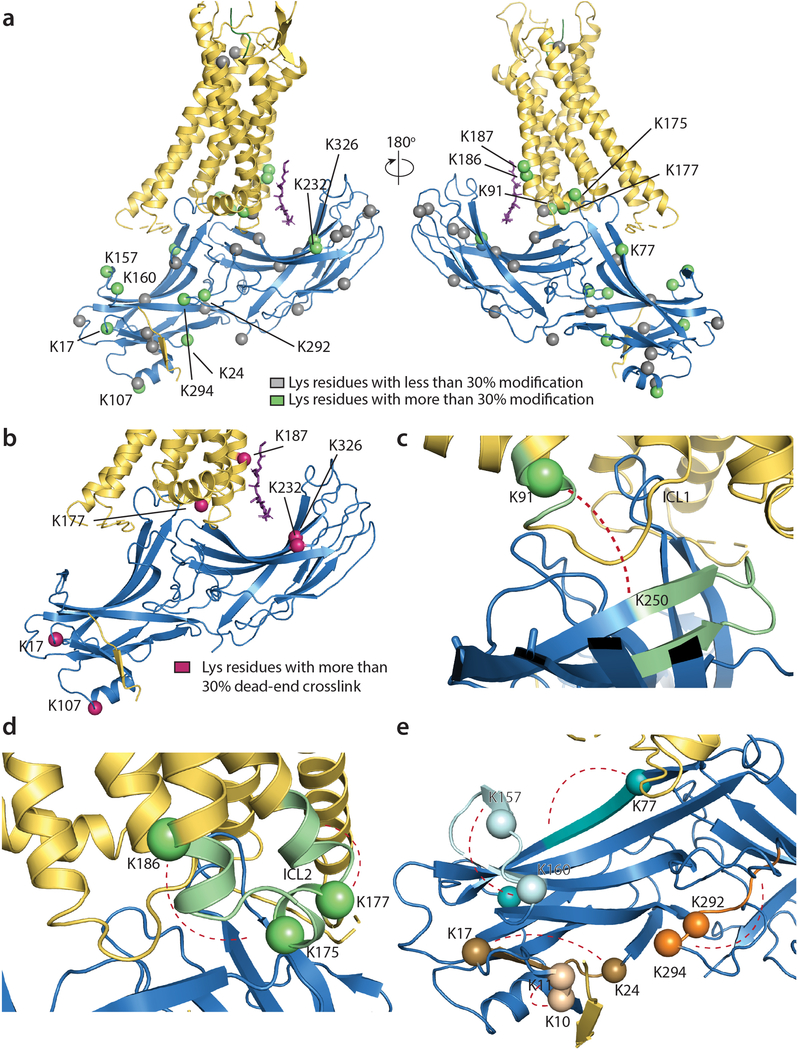
Negative stain electron microscopy (NS-EM) images of the purified complex26 showed particles wherein arrestin was tightly engaged with the core of the receptor, but much of the complex dissociated during vitrification. To address this challenge, we treated the purified complex with a heterobifunctional crosslinker, sulfosuccinimidyl 6-(4,4’-azipentanamido)hexanoate (sulfo-LC-SDA), bearing an amine reactive group on one end and a diazirine moiety on the other. After labeling accessible lysine residues, the complex was exposed to UV light to activate the crosslinker, followed by complex purification through a second round of size-exclusion chromatography (Extended Data Fig. 3a). Qualitatively the sample appeared unchanged by NS-EM (Extended Data Fig. 3b), and though we observe a relatively small fraction of crosslinked complex by SDS-PAGE, the photo-crosslinked sample remained intact during sample vitrification and afforded homogeneously dispersed particles suitable for cryoEM. Using mass spectrometry, we probed the effect of the photo-crosslinker on the NTSR1-βarr1ΔCT complex and found that while several lysine residues on the N-lobe of βarr1ΔCT as well as in the ICL1 and ICL2 region of NTSR1 reacted with the crosslinker, they largely resulted in dead-end crosslinks during photo-illumination (Extended Data Fig. 4, Supplementary Tables 1–7). The majority of observed crosslinks were intramolecular and largely confined to ICL2 of the NTSR1 and the loops of the N-lobe of βarr1ΔCT. Only a single intermolecular crosslink consistent with our structural model was identified between the cytoplasmic end of receptor transmembrane helix 1 (TM1) and a β-strand of βarr1ΔCT (Extended Data Fig. 4c), although its density is not observed in our map. It is thus possible that the main effect of crosslinking was to stabilize βarr1ΔCT in a native conformation with enhanced affinity for NTSR1, thereby allowing the complex to survive during cryoEM grid preparation.
CryoEM of the NTSR1-βarr1ΔCT complex
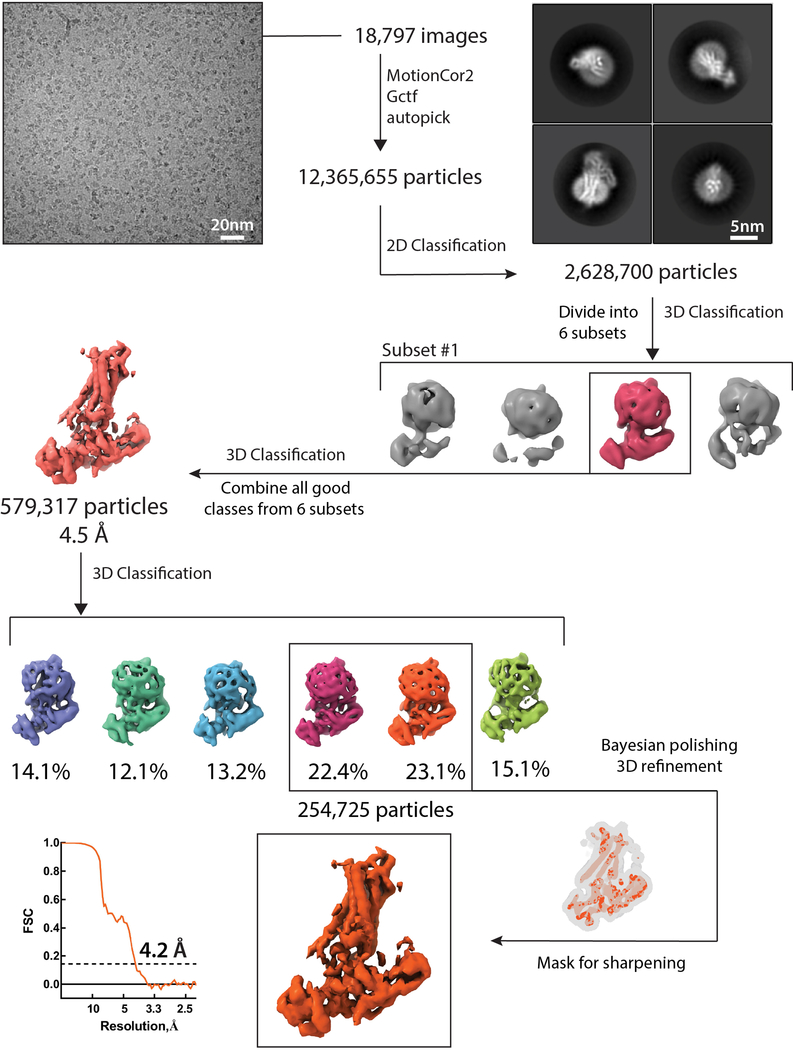
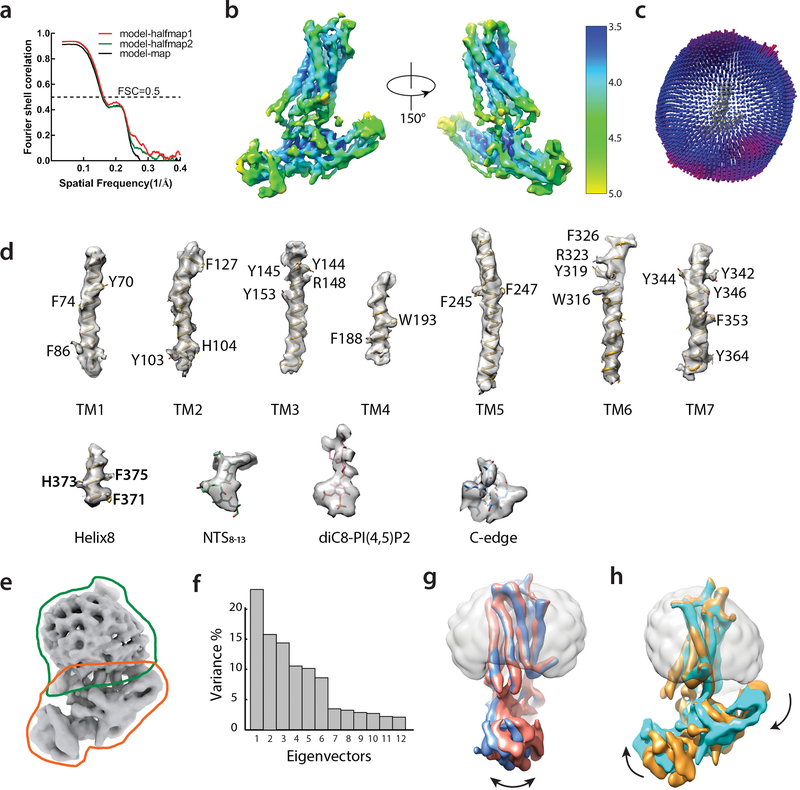
A large dataset of 18,000 micrographs of the photo-crosslinked NTSR1-βarr1ΔCT complex was processed in subsets and combined to yield about 600,000 particles from well-defined 3D classes, which were reconstructed to an overall 4.5 Å map. Further 3D classification using a smaller angular step enabled us to identify a subset of about 260,000 particle projections that were used to obtain a map with global indicated resolution of 4.2 Å (Extended Data Figs. 5 and 6a–d, Extended Data Table 1). Conformational heterogeneity in this subset was probed using multi-body refinement27, which showed that approximately 40% of the variance in the rotations and translations between NTSR1 and βarr1ΔCT is accounted for by two eigenvectors (Extended Data Fig. 6e–h). However, local resolution could not be further improved.
Structure of the NTSR1-βarr1ΔCT complex
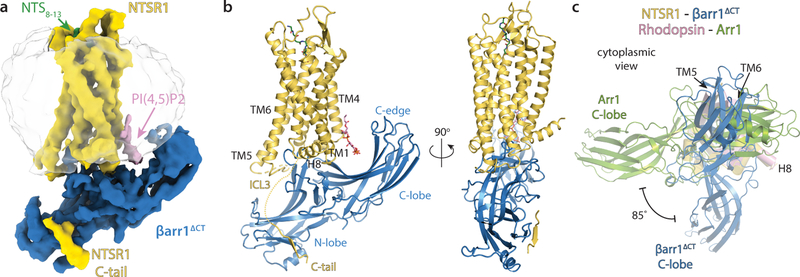
The 4.2 Å map (Fig.1a) was sufficient to build a model of the complex (Fig. 1b), with the exception of the receptor N-terminus (residues 1–49), parts of ICL3 (residues 273–285) and part of the receptor C-terminus. The NTSR1 TMs have well-defined density, and most regions of βarr1ΔCT were well resolved, with the exception of the flexible end of the truncated C-terminus (residues 352–382) and parts of the C-edge loops (residues 332–340). The receptor engages βarr1ΔCT through a portion of its C-terminus, the transmembrane core, and the C-terminal end of ICL3. The C-terminus of NTSR1 binds the N-lobe groove of βarr1ΔCT, which contains basic residues known to interact with phosphorylated receptor residues28. The receptor core engages the βarr1ΔCT finger loop, a critical determinant of arrestin coupling. We also observe a strong density above the βarr1ΔCT C-lobe, in the region which previously was shown to be an inositol phosphate binding site29–31. Given that we added dioctyl-PI(4,5)P2 (diC8-PI(4,5)P2) during the phosphorylation step and its presence was confirmed by mass spectroscopy of the intact complex (Supplementary Fig. 1), we conclude that this density corresponds to diC8-PI(4,5)P2. The functional role of phosphatidylinositol-bisphosphate (PIP2) binding is discussed below.
Figure 1 – The NTSR1-βarr1ΔCT complex features a distinct arrestin orientation and unique interaction sites.
a) CryoEM map and b) model of phosphorylated Neurotensin Receptor 1 (yellow) bound to the peptide agonist NTS8–13 (green) in complex with β-arrestin 1ΔCT (blue). Interactions between receptor and βarr1ΔCT are mediated by the phosphorylated C-terminus of NTSR1, the C-terminal part of the phosphorylated ICL3, the receptor core and a PIP2 molecule (pink). The βarr1ΔCT C-edge is in contact with the detergent micelle (translucent grey). c) Overlay of the NTSR1-βarr1ΔCT structure with the Rhodopsin-arrestin-1 structure (with Rho and Arr1 colored pink and green, respectively), viewed from the cytoplasmic side. The structures were aligned based on the receptor chains (helices shown as cylinders). Compared to βarr1ΔCT, Arr1 is rotated by ~85°. Additional views of this overlay are shown in Extended Data Fig. 7a.
We also observe that the C-edge, i.e. parts of the 340-loop (residues 330–340) and 191-loop (residues 186–198), appears to be in contact with the detergent micelle. In Arr1, these loops, named 344-loop and 197-loop, have been shown to interact with the membrane upon arrestin activation32. Interestingly, and as previously discussed32,33, only Arr1, Arr4 and the long splice variant of βarr1 have the 344/340-loop, while βarr2 and the short splice variant of βarr1 do not possess this loop region. No significant difference in the ability of these isoforms to bind to the β2AR and M2 receptors was observed34, but it may be important in regulating the strength of engagement of arrestin upon activation, and appears to play an important role in stabilizing our complex. The interaction between the micelle and the C-edge leads to a tilt of βarr1ΔCT relative to the receptor (Fig. 1a,b) that may be exaggerated by virtue of the small size of a detergent micelle compared to a planar bilayer. The implications of this flexibility and the role of membrane curvature are discussed below.
Strikingly, βarr1ΔCT engages NTSR1 in a relative orientation that is rotated by approximately 85° in the membrane plane compared to how Arr1 engages rhodopsin (Fig. 1c and Extended Data Fig. 7a). As discussed below, even though both complexes use the same GPCR-arrestin interface, differences in the phosphorylation-mediated interactions, receptor core engagement and PIP2 binding could explain this dramatic difference. We believe this highlights the exceptional plasticity of arrestin and illustrates the spectrum of conceivable receptor-arrestin assemblies. It should be noted that Gurevich and Gurevich anticipated that arrestins may adopt distinct, receptor-specific orientations28.
Conformational changes in NTSR1
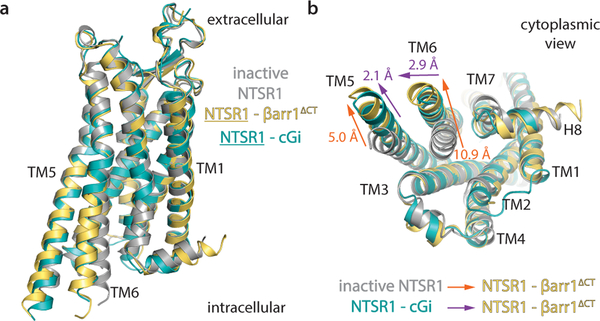
The hallmark feature of family A GPCR activation, i.e. the outward movement of TM6 is clearly observed in NTSR1 (Fig. 2). Compared to the previously published inactive NTSR1 structure, both TM6 and TM5 in the NTSR1-βarr1ΔCT structure move away from the core by 10.9 Å and 5.0 Å, respectively (Fig. 2b), adopting an active conformation similar to that seen in the C-state of the Gi-coupled NTSR1 structure (discussed above)9, with a RMSD of 0.67 Å. While the TM6 displacement was similar to that seen in both Gi-bound C-state, TM5 is moved further outward, by 2.1 Å (by measuring the Cα of A270) (Fig. 2b).
Figure 2 – βarr1ΔCT-bound NTSR1 adopts a conformation similar to Gi-bound states.
a) Side view and b) cytoplasmic view showing the overlay of βarr1ΔCT-bound NTSR1 (yellow) with inactive NTSR1 (grey), and the canonical Gi-bound NTSR1 structures (cGi, teal). TM5 in the NTSR1-βArr1ΔCT complex has a larger outward displacement than in either NTSR1-Gi complexes, while TM6 adopts a conformation similar to the canonical NTSR1-Gi complex. Outward motions in NTSR1 TMs 5 and 6 from the inactive to the βarr1ΔCT-bound state and from the cGi-bound to the βarr1ΔCT-bound state are indicated by orange and purple arrows, respectively.
Conformational changes in βarr1ΔCT
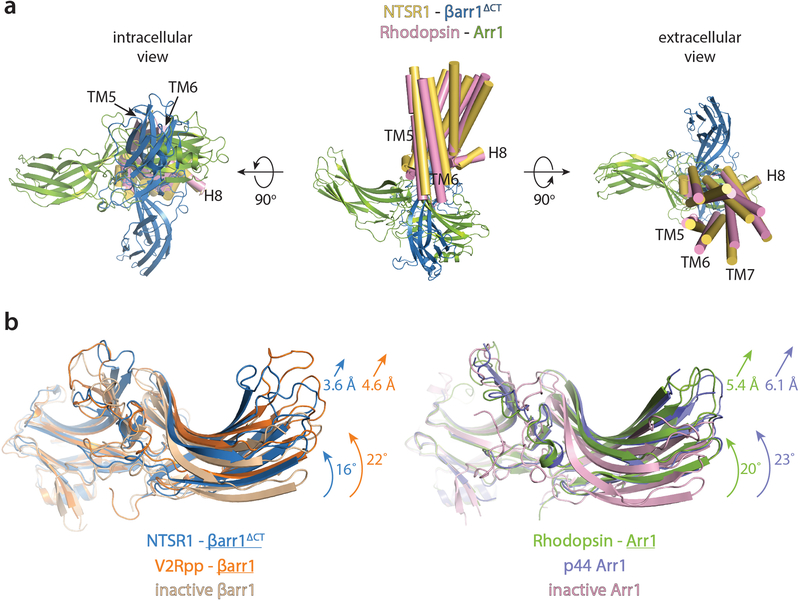
βarr1ΔCT bound to NTSR1 adopts a structure that contains the conformational hallmarks of arrestin activation1 based on a comparison with crystal structures of the inactive βarr135, the active-state βarr1 bound to a phosphopeptide derived from vasopressin receptor C-tail and a stabilizing Fab36 (referred to as V2Rpp-βarr1), and the active-state Arr1 bound to rhodopsin14 (referred to as Rho-Arr1). First, we observe an interdomain twist, i.e. a rotation of the C-lobe relative to the N-lobe (Fig. 3a), of ~16°, which is smaller than the ~22° twist observed for the V2Rpp-βarr1 and the Rho-Arr1 structures (Extended Data Fig. 7b). Second, the finger, gate and middle loops, which form the central crest and are essential in receptor coupling, adopt active-state conformations (Fig. 3a). Third, we observe that the polar core is disrupted, as evidenced by the backbone position of residue D297 in the gate loop being moved away from R169, abrogating a key contact that stabilizes the inactive state (Fig. 3b). Moreover, as βarr1ΔCT is truncated at residue 382, residue R393 is no longer present to contribute to polar core formation. Interestingly, the gate loop and middle loop backbones in our structure overlay remarkably well with the Rho-Arr1 and V2Rpp-βarr1 structures, while the finger and C-loops adopt distinct conformations (Fig. 3c).
Figure 3 – NTSR1-bound βarr1ΔCT shows activation hallmarks, with some loops in distinct conformations.
a) Overlay of NTSR1-bound βarr1ΔCT (blue) with inactive βarr1 (wheat). NTSR1-bound βarr1ΔCT undergoes a 16° interdomain twist, a feature observed to varying degrees in all active-state arrestin structures (Fig S8a) and substantial rearrangements of the central crest loops (highlighted in purple and orange, respectively). b) The position of residue D297 (shown as Cα sphere) in the gate loop of the NTSR1-βarr1ΔCT complex is too far away from R169 (shown as Cα sphere) to stabilize the polar core in the inactive state. c) Compared to the active state Rho-bound Arr1 (green) and V2Rpp-bound βarr1 (orange), the middle loop (ML), gate loop (GL) and lariat loop (LL) adopt similar conformations, while the finger loop (FL) and the C-loop (CL) adopt more distinct conformations, likely due to the unique receptor-arrestin orientation we observe.
NTSR1-βarr1ΔCT interaction interface
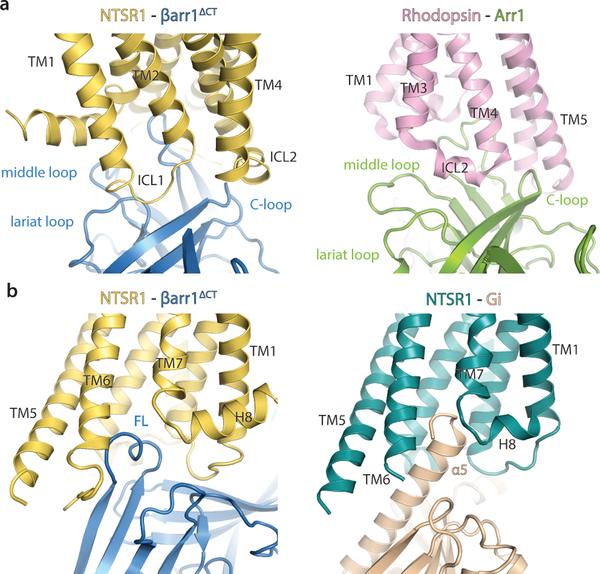
Multiple interaction elements stabilize the NTSR1-βarr1ΔCT complex and likely explain the unique orientation we observe compared to Rho-Arr1 (Fig. 1c). While the finger-loop, C-loop, lariat-loop and middle-loop of Arr1 and βarr1ΔCT are part of the interface, they interact with different regions of Rho and NTSR1, respectively, resulting in very different orientations of arrestin (Fig. 4a). In the NTSR1-βarr1ΔCT complex, the finger loop adopts a helical structure, which is also seen for Arr137 and inserts into the receptor intracellular cavity, but it is extended farther away from the N-lobe of arrestin relative to the finger loop of Arr1 in the rhodopsin complex14 (Figs. 3c and 4a). The finger loop of βarr1ΔCT occupies a position similar to that of the α5-helix of Gi in the NTSR1-Gi complex (Fig. 4b). In the NTSR1-βarr1ΔCT complex, ICL2 forms a helix and is located on the outer side of the C-loop, while in the Rho-Arr1 complex ICL2 is sandwiched between the C-loop, middle-loop and lariat-loop (Figs. 4a and 5a). Of note, for rhodopsin ICL2 does not form a helix in the Gi-bound structure, while it does in the Arr1-bound structure, which is in contrast to NTSR1 where ICL2 adopts a very similar conformation between its Gi-bound and βarr1ΔCT-bound states.
Figure 4 – Comparison of receptor-Arrestin and receptor-G protein interfaces.
a) A comparison of the NTSR1-βarr1ΔCT interaction interface (left panel) with the Rho-Arr1 interaction interface (right panel) highlights the conformational plasticity of arrestin and the 85° rotation between how Arr1 and βarr1ΔCT engage Rhodopsin and NTSR1, respectively. The same arrestin elements interact with distinct receptor regions to form a unique interface. b) Receptor core engagement by the arrestin finger loop (left panel) and the Gai α5-helix (right panel).
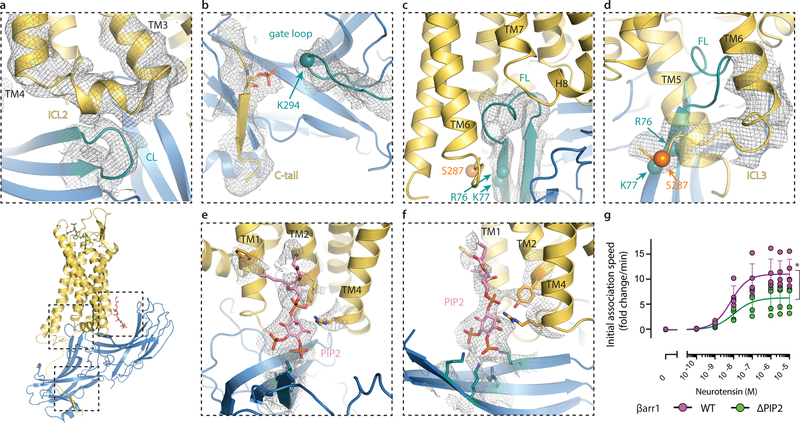
Figure 5 – The NTSR1-βarr1ΔCT interface comprises several distinct types of interactions.
Multiple interaction interfaces (dashed boxes) stabilize the NTSR1-βarr1ΔCT complex. a-f) Close-up view of distinct interaction interfaces, with local EM-map density shown as grey mesh. a) The C-loop (CL, teal) is in close proximity with ICL2, possibly interacting through hydrophobic contacts. b) The gate loop is in close proximity with part of the NTSR1 C-tail. A bulge in the map density suggests a phosphate residue would be positioned as shown to interact with K294, thus disrupting the polar core. c) The finger loop (FL, teal) inserts into the receptor cavity formed by outward motion of TM6. d) The C-terminal part of ICL3 adopts a distinct orientation, forming a sharp angle with the intracellular end of TM6. A charge-charge interaction between a phosphorylated residue, such as S287, and positively charged residues at the base of the finger loop (R76 and K77) may explain this unusual loop conformation. e,f) A PIP2 molecule interacts with basic residues of the βarr1ΔCT C-lobe groove and residues on the membrane-facing side of TMs 1, 2 and 4. g) NanoBiT-based proximity assay between NTSR1-Sm and Lg-βarr1 shows that a triple mutant of βarr1, ΔPIP2 (K232Q, R236Q and K250Q), is recruited to activated NTSR1 to a lesser extent (*P=0.02) than wild-type βarr1. Plots and error bars represent data from individual experiments and SD, respectively. Emax for wild type is 11.2±2.8 and for ΔPIP2 is 6.4±2.4. One-way ANOVA, n=5 biologically independent experiments.
NTSR1 phosphorylation stabilizes complex
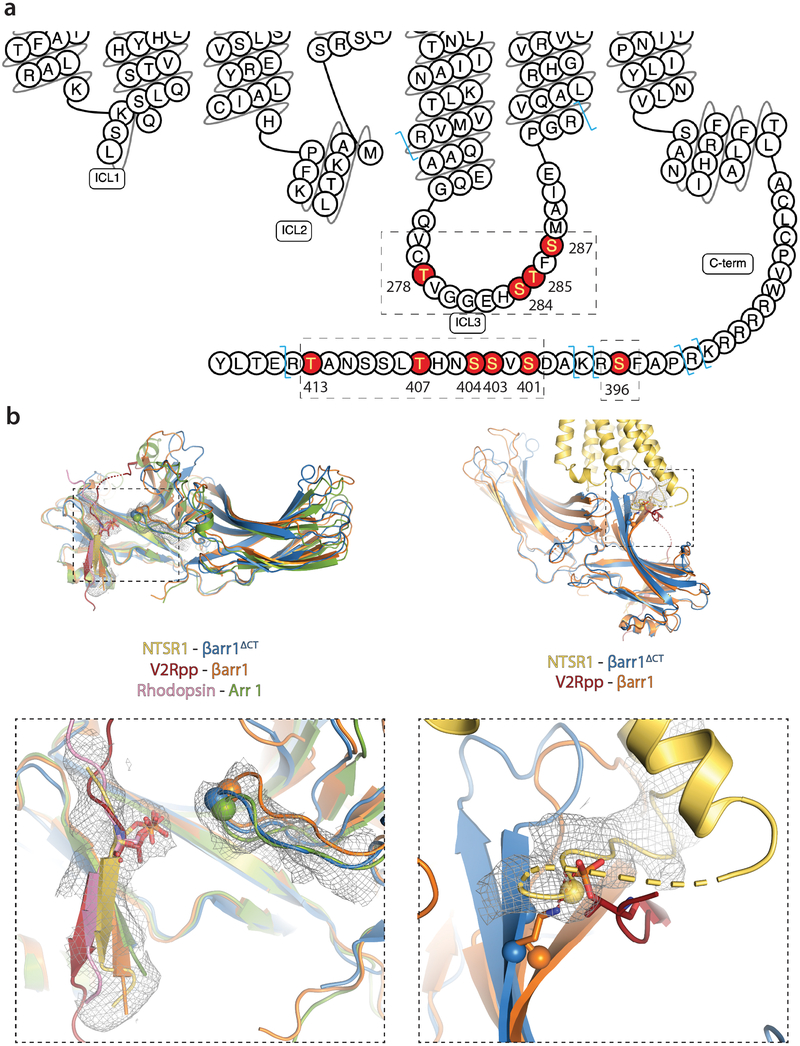
As noted above, receptor phosphorylation is essential for the formation of a stable complex (Extended Data Fig. 2). Phosphoproteomics experiments on pre-formed NTSR1-βarr1ΔCT complex identified 4 phosphorylation sites in ICL3 and 6 in the C-terminus (Extended Data Fig. 8a, Supplementary Figs. 2–5, Supplementary Tables 8–39), with less than full occupancy of each position. We hypothesize that the heterogeneity we observe is the result of distributive phosphorylation by GRK5 in vitro, consistent with literature that GRKs have limited sequence recognition constraints23, and may even be important to allow arrestin to adopt a range of conformational states.
We observed density corresponding to part of the NTSR1 C-terminus in the βarr1ΔCT N-lobe (Fig. 5b), with a distinct bulge in the density adjacent to K294 of βarr1ΔCT consistent with a phosphate; however, due to the resolution we cannot definitively determine the register of NTSR1 C-terminus within this density. Based on the distance between the last amino acid observed for H8 and the density observed for the C-terminal peptide we can likely exclude S396, S401, S403 and S404 from being at this position. As such, it is possible that our structure represents pT407 making a contact to K294 and have modeled it as such in Fig. 5b. Both the V2Rpp-βarr1 structure and the Rho-Arr1 structure have a phosphate in the same position, interacting with the gate loop lysine and thereby stabilizing arrestin in the active conformation14,36 (Extended Data Fig. 8b).
We also observe strong density for the C-terminal end of ICL3, which turns sharply at the end of TM6 and extends behind TM5 to the base of the finger loop (Fig. 5c,d). The density for ICL3 residue S287, which is phosphorylated in our complex, is adjacent to βarr1ΔCT residues R76 and K77 at the base of the finger loop. We speculate that phosphorylation of S287, but potentially any phosphorylated residue in the inherently flexible ICL3, may serve to disrupt the contact between K77 and E313 that maintains arrestin in the inactive conformation38. Of interest, in the V2Rpp-βarr1 structure K77 is stabilized in the active state by pT347 of the V2Rpp36 (Extended Data Fig. 8b).
PIP2 stabilizes NTSR1-βarr1ΔCT complex
In the NTSR1-βarr1ΔCT structure, arrestin is strongly tilted towards the membrane, at an angle of about 40° relative to the membrane plane (Fig. 1a,b); this same angle is only about 15° for Rho-Arr1. The difference in tilt may be attributed to the C-edge interaction with the detergent micelle, as well as to the presence of PIP2 bridging the membrane surface of TMs 1 and 4 with the top of the arrestin C-lobe. While the observation of a PIP2 molecule bridging NTSR1 and βarr1ΔCT was unexpected, this region of βarr1 and βarr2 was previously shown to bind inositol phosphates29–31, and native mass spectrometry experiments had shown that NTSR1 was capable of binding to PIP2 through contacts between positively charged residues on the membrane-facing side of TMs 1 and 439. We confirmed the presence of PIP2 in our complex by mass spectrometry and determined that a fluorescent PIP2 analog could bind to both NTSR1 (Kd = 0.3 μM) and βarr1ΔCT (Kd = 0.9 μM) (Supplementary Fig. 1). PIP2 fits well into the density observed between the detergent micelle and the βarr1ΔCT C-lobe (Fig. 5e,f). Though the precise orientation of the phosphatidylinositol head group is ambiguous at the resolution of our map, the modeled position places the phosphates at positions 4 and 5 within range to interact with R236, K250, K324 and K326 of βarr1ΔCT. The hydroxyl group at position 3 of the PIP2 head group can form a hydrogen bond with R182 on TM4 of the receptor, and the bridging phosphate can form a hydrogen bond with Y103 on TM2 (Fig. 5f). We examined the effect of mutating residues involved in PIP2 binding29,38 on arrestin in cells using a NanoBiT assay40. The ΔPIP2 βarr1 mutant (K232Q, R236Q and K250Q) showed an approximately 40% reduction in arrestin recruitment to NTSR1 when stimulated by agonist, consistent with arrestin binding to PIP2 being important for complex formation with NTSR1 (Fig. 5g).
Diversity of GPCR-arrestin interactions
We present the structure of the NTSR1-βarr1ΔCT complex using native receptor phosphorylated in vitro by GRK5. A comparison with the Rho-Arr1 structure and the M2 muscarinic receptor(M2R)-βarr1 structure in lipid nanodiscs, published in this issue (Staus et al.), highlights the plasticity and diversity of interactions that comprise the receptor-arrestin interface.
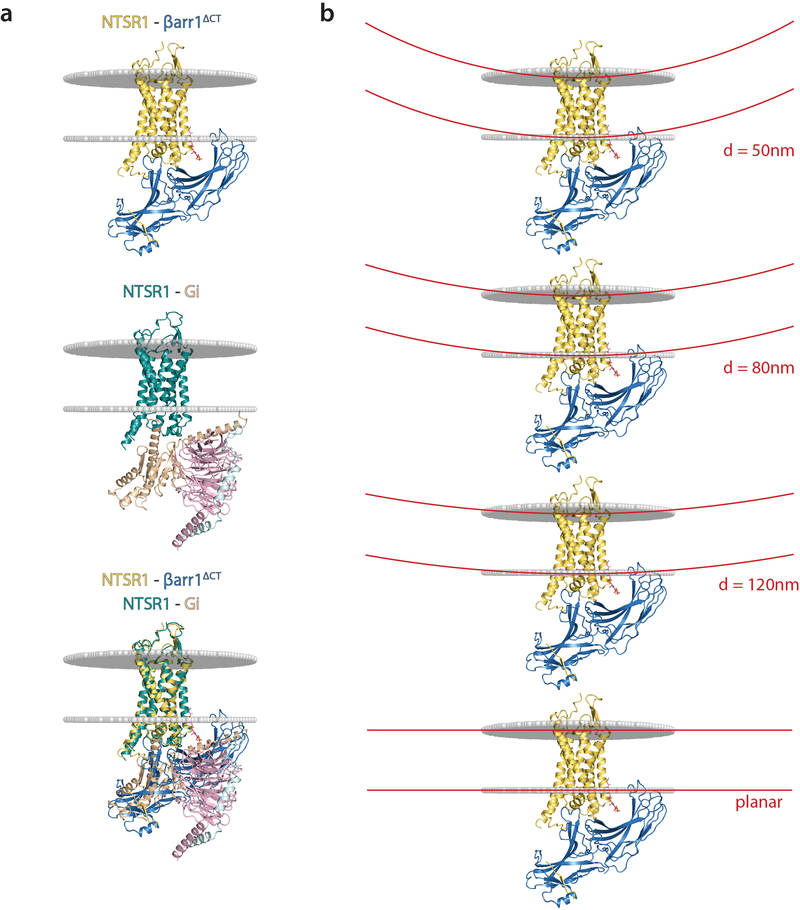
We found that PIP2 binding at the NTSR1-βarr1ΔCT interface stabilizes the complex and may impose a stronger arrestin tilt relative to the membrane plane compared to M2R-βarr1 and Rho-Arr1. This tilt may be exaggerated by the smaller hydrophobic interface a detergent micelle provides compared to a planar lipid bilayer. Conformational analysis of the cryoEM projections indicates the least inclined state captured is comparably tilted to that seen in Rho-Arr1 and M2R-βarr1. However, even the most titled orientation may be meaningful in the context of non-planar membrane structures that can feature high degrees of curvature, such as endosomes, from which GPCR-arrestin signaling can also occur41 (Extended Data Fig. 9). The observations that interactions with membrane phosphoinositides allow arrestins to maintain signaling-competent conformations after dissociating from GPCRs (referred to as ‘action at a distance’) and that these dissociated arrestins, as well as GPCR-arrestin complexes, can signal from clathrin-coated structures38,42 further supports the notion that PIP2 and membrane curvature may play a role in arrestin function. As such, once arrestin is activated by receptor core, C-tail and/or ICL3 engagement, the binding of specific lipids such as PIP2 and the insertion of the C-edge into the lipid bilayer may contribute to maintaining an active conformation that no longer requires the presence of the receptor. Of interest, it has been shown that NTSR1-Gq mediated signaling activates phospholipase C, and the production of inositol phosphate and diacylglycerol from PIP2, as detailed in Besserer et al.18. Thus, NTSR1 signaling through Gq can change the membrane content of PIP2 and possibly influence interactions between NTSR1 and βarr1.
Compared to both Rho-Arr1 and M2R-βarr1, the relative orientation between the receptor and arrestin observed for NTSR1-βarr1ΔCT is unique. This suggests that the same arrestin regions can engage receptors in different ways, and that the orientation is modulated by the nature of interactions present. For example, the interaction with the phosphorylated ICL3 as well as binding to PIP2, observed only in the NTSR1-βarr1ΔCT complex, may only be satisfied by adopting a different relative orientation of arrestin. Within arrestin we observe different finger loop conformations between NTSR1-βarr1ΔCT, M2Rpp-βarr1 and Rho-Arr1, suggesting that this loop can be ordered in different ways, which may be important when recognizing different receptors. The ability of arrestin to assume multiple conformations43,44, including different twist angles and relative orientations may be important for allowing binding to differently phosphorylated receptors. Taken together, this high degree of conformational plasticity and the multiplicity of interface contacts may be what allows only two β-arrestin isoforms to interact with a large number of GPCRs that share little sequence homology at the arrestin-receptor interface.
METHODS
Data Analysis and Figure Preparation
Figures were created using the PyMOL 2.3.2 Molecular Graphics System (Schrödinger, LLC), and the UCSF Chimera X 0.9 package45. Data were plotted with GraphPad Prism 8.3.0. Mass spectrometry data were analyzed with Byonic v3.4 and Byologic v.3.4–55 (Protein Metrics Inc.), DataAnalysis v5.2 (Bruker Daltonics) and Excalibur v4.1 (Thermo Fischer Scientific).
Screening GPCRs for strong arrestin coupling
GPCRs with an N-terminal flag tag and a C-terminal eGFP followed by deca-his and Rho1D4 tags were constructed to pCDNA3.1(+) and expressed in HEK293T cells. Cells were transfected with Lipofectamine 2000 (Invitrogen) and incubated for 72 hours before being harvested. Cell pellets were solubilized in solubilization buffer (1% LMNG, 0.1% CHS, 500 mM NaCl, 20 mM HEPES 7.4, 25% glycerol, protease inhibitors and 1 μM ligand) for 2 hours at 4°C. After centrifugation, the supernatant was incubated with Ni-NTA for 30 mins at 4 °C. The resin was washed in batch with 5 column volumes of wash buffer (0.01% LMNG, 0.001% CHS, 20 mM HEPES pH 7.4, 500 mM NaCl, 10 mM imidazole and 1 μM ligand). The receptor was eluted in wash buffer supplemented with 200 mM imidazole. To test arrestin coupling, rat βarr1(1–392) was activated by incubating with V2Rpp and Fab30 prior to the addition of receptor. The V2Rpp peptide: ARGRpTPPpSLGPQDEpSCpTpTApSpSpSLAKDTSS was obtained by custom peptide synthesis (Tufts University Core Facility). Fab30 was expressed and purified as previously described36. Pre-activated βarr1 (5 μM) was then added to each receptor and incubated for 30 min at room temperature. Samples were then subjected to size-exclusion chromatography (SEC) using a Superdex 200 10/300 GL column (GE healthcare) and monitored by eGFP fluorescence (λ(EX) of 480 nm and λ(EM) of 512 nm).
NTSR1 expression and purification
Full length wild-type human NTSR1 was modified with an N-terminal Flag tag followed by an octa-histidine tag, and cloned into pFastBac1 vector. NTSR1 was expressed in Sf9 insect cells (Expression Systems) using a FastBac-derived baculovirus. Cells were infected at a density of 4×10⁶ cells/mL and harvested 60 hrs post infection. Cells were lysed in hypotonic buffer (10 mM HEPES, pH 7.4, and protease inhibitors) and solubilized at 4 °C for 2 hours in a buffer containing 1% lauryl maltose neopentyl glycol (LMNG, Anatrace), 0.1% cholesteryl hemisuccinate tris salt (CHS, Steraloids), 0.3% sodium cholate (Sigma), 20 mM HEPES 7.4, 500 mM NaCl, 25% glycerol, iodoacetamide (to cap cysteine residues) and protease inhibitors. Insoluble debris was removed by centrifugation and the supernatant was incubated with Ni-NTA (Qiagen) resin for 1 hour at 4 °C. The resin was washed in batch with buffer containing 0.01% LMNG, 0.001% CHS, 0.003% sodium cholate, 20 mM HEPES pH 7.4, 500 mM NaCl, 10 mM imidazole and eluted with the same buffer supplemented with 200 mM imidazole, 2 mM CaCl2 and 10 μM NTS8–13 (Acetate salt, Sigma). The eluate was loaded onto M1 FLAG immunoaffinity resin and washed with buffer containing 0.01% LMNG, 0.001% CHS, 0.003% sodium cholate, 20 mM HEPES pH 7.4, 500 mM NaCl, 10 mM imidazole, 0.1 μM NTS8–13 and 2 mM CaCl2. The receptor was eluted with buffer containing 100 mM NaCl, 20 mM HEPES pH 7.4, 0.005% LMNG, 0.005% CHS, 1 μM NTS8–13, 0.2 mg/mL flag peptide (DYKDDDDK) and 5 mM EDTA. Elution fractions containing receptor were pooled and subjected to polishing by SEC on a Superdex 200 Increase 10/300 GL column (GE Healthcare) in 20 mM HEPES, pH 7.4, 100 mM NaCl, 0.0025% LMNG, 0.00025% CHS, and 0.1 μM NTS8–13. Peak fractions were pooled and concentrated to 200 μM and aliquots were flash-frozen and stored at −80 °C until use.
GRK5 expression and purification
Full length wild-type human GRK5 was modified with a C-terminal hexa-histidine tag and cloned into pVL1392 vector for baculovirus production. GRK5 was expressed and purified as previously published46. Briefly, Sf9 insect cells (Expression Systems) were infected with a BestBac-derived baculovirus at a density of 3.5 × 10⁶ cells/mL and harvested 48 hours post infection. Cells were resuspended, lysed by sonication and the supernatant was applied to Ni-NTA resin. The resin was washed with lysis buffer and GRK5 eluted with lysis buffer supplemented with 200 mM imidazole. The combined eluate was then subjected to cation-exchange chromatography using a MonoS 10/100 column (GE healthcare) and eluted with a linear gradient of NaCl. Fractions containing GRK5 were combined and run on a Superdex 200 10/300 GL column (GE healthcare). GRK5 was aliquoted, flash frozen, and stored at −80 ˚C until use.
Arrestin expression and purification
The long splice variant of human, cysteine-free (C59V, C125S, C140L, C150V, C242V, C251V, C269S) β-arrestin-1 was used as full-length arrestin for these studies, and modified with an N-terminal 6x Histidine tag, followed by a 3C protease site, a GG linker, AviTag and GGSGGS linker. The sequence was codon-optimized for expression in E. coli and cloned into a pET-15b vector. βarr1ΔCT was prepared by using a βarr1 construct truncated at residue 382. All arrestin constructs used were prepared as follows: NiCo21(DE3) competent E. coli (NEB) were transformed and large-scale cultures were grown in TB + ampicillin at 37°C until an OD600 of 1.0. Cells were then transferred to room temperature and induced with 25 μM IPTG when the OD600 reached 2.0. Cells were harvested 20 h post induction and resuspended in lysis buffer (50 mM Hepes pH 7.4, 500 mM NaCl, 15% glycerol, 7.13 mM BME) to a final volume of 40 mL/L of cells. Cells were lysed by sonication and the clarified lysate applied to nickel sepharose and batch incubated for 1.5h at 4 °C. The resin was washed with 10 column volumes of wash buffer (20 mM HEPES pH 7.4, 500 mM NaCl, 10% glycerol, 7.13 mM BME) + 20 mM imidazole, followed by 10 column volumes of wash buffer + 40 mM imidazole. The protein was then eluted with 5 column volumes of wash buffer + 200mM imidazole and dialyzed overnight in 100x volume of dialysis buffer (20 mM Hepes 7.4, 200 mM NaCl, 2 mM BME, 10% glycerol) in the presence of 1:10 (w:w) of 3C protease. The digested protein was then subjected to reverse-Nickel purification and diluted with dialysis buffer containing no NaCl to bring the NaCl concentration to 75mM. The protein was then purified by ion exchange chromatography (mono Q 10/100 GL, GE Healthcare), followed by SEC using a Superdex 200 increase 10/300 GL column (GE Healthcare) with SEC buffer (20 mM HEPES pH 7.4, 300 mM NaCl, 10% glycerol). The purified protein was then concentrated to 200–300 μM using a 30 kDa spin concentrator and aliquots were flash-frozen in liquid nitrogen and stored at −80 °C until use.
NTSR1 phosphorylation
NTSR1 (2.5 μM) was equilibrated in phosphorylation buffer (20 mM bis-tris propane (BTP) pH 7.5, 35 mM NaCl, 5 mM MgCl2, 20 μM NTS8–13, 20 μM C8-PI(4,5)P2, 0.05 mM TCEP, 0.002% MNG, 0.0002% CHS) at 25 °C with gentle mixing for 1 h. GRK5 was added to the reaction to a final concentration of 200 nM, and briefly incubated while the reaction was warmed from 25 °C to 30 °C. ATP was added to a final concentration of 1 mM. The reaction was sampled at various time points by removing a small volume, mixing it with EDTA (to 50 mM final) to halt phosphorylation and evaluated by ion-exchange chromatography (IEX). IEX was performed as follows: 10 μL of reaction mixture was added to 40 μL of buffer A (20 mM BTP pH 8.6, 50 mM NaCl, 0.004% LMNG) and injected onto an equilibrated (100% buffer A) monoQ (5/50) cation exchange column (GE healthcare). The column was washed with 1 column volume (CV) of a linear gradient from 0 to 10% buffer B (20 mM BTP pH 8.6, 1 M NaCl, 0.004% LMNG), 6 CV at 10% B, 1 CV from 10 to 40% B then 6 CV at 40% B before being re-equilibrated into buffer A. In some cases, a longer linear gradient was used instead of a stepped elution. This involved 1 CV from 0% B to 5% B, 5 CV 5% B then 20 CV from 5 to 40% B. Protein elution was monitored by tracking tryptophan fluorescence at λ(EX) of 280 nm and λ(EM) of 340 nm. Upon completion, the reaction was supplemented with CaCl2 to a final concentration of 2 mM and applied to an equilibrated M1 FLAG immunoaffinity resin and washed with buffer containing 0.004% LMNG, 0.004% CHS, 20 mM HEPES pH 7.4, 100 mM NaCl, 0.2 μM NTS8–13, 2 mM CaCl2. The receptor was eluted with buffer containing 100 mM NaCl, 20 mM HEPES pH 7.4, 0.004% LMNG, 0.004% CHS, 0.2 μM NTS8–13, 0.2 mg/mL 1x flag peptide (DYKDDDDK), 5 mM EDTA. Elution fractions containing receptor were pooled and used for arrestin complexing.
Analytical FSEC for construct screening
In a final volume of 20 μL, NTSR1 (4.5 μM), the respective arrestin construct (9 μM) and NTS8–13 peptide (50 μM) were incubated in buffer containing 20 mM HEPES pH 7.4, 100 mM NaCl, 0.004% LMNG, 0.0004% CHS and 0.2 μM NTS8–13. Using a Prominence-i LC autosampler (Shimadzu), 10 μL was injected onto a ENrich size-exclusion chromatography 650 10 × 300 column (Bio-rad) pre-equilibrated in 20 mM HEPES pH 7.4 100 mM NaCl, 0.004 % LMNG, 0.004% CHS and 0.2 μM NTS8–13, and run at a flow rate of 0.8 ml/min. Tryptophan fluorescence was monitored at λ(EX) of 280 nm and λ(EM) of 340 nm.
Formation and purification of NTSR1-βarr1ΔCT complex
For cryo-EM, phosphorylated NTSR1 was mixed in an equimolar ratio of βarr1ΔCT at a concentration of ~5 μM, supplemented with NTS8–13 to 10 μM final and incubated at 25 °C for 30 minutes before being concentrated with a 50 kDa MWCO concentrator (Amicon or Vivaspin) to ~350 μL and purified by size-exclusion chromatography using two tandem Superdex 200 increase 10/300 GL columns (GE healthcare). The mobile phase used was 20 mM HEPES pH 7.4, 100 mM NaCl, 0.00075% LMNG, 0.00025% GDN 0.0001% CHS and 0.2 μM NTS8–13. Fractions containing complex were combined and diluted to 1 μM final and sulfo-LC-SDA (sulfo-NHS-LC-Diazirine) (sulfosuccinimidyl 6-(4,4’-azipentanamido)hexanoate) (Thermo Fisher), as a solution in DMSO, was added to 250 μM final and such that the final DMSO concentration was below 4%. The reaction was allowed to proceed for 45 minutes at 25°C in the dark, before hydroxylamine was added to a final concentration of 3 mM and incubated for an additional 15 minutes. The sample was distributed into a clear 96-well plate (90 μL/well), put on ice and irradiated for 45 minutes using a UVL-56 lamp. The sample was then pooled and concentrated to ~500 μL then re-run by SEC, again using two tandem Superdex 200 increase 10/300 GL columns (GE healthcare). Peak fractions were combined and concentrated with a 100 kDa MWCO concentrator (Amicon) to a final concentration of 4.5 mg/mL.
CryoEM sample preparation and image acquisition
An aliquot of 3.5 μL NTSR1-βarr1ΔCT sample was deposited onto glow-discharged 200 mesh grids (Quantifoil R1.2/1.3) and plunge-frozen into liquid ethane using an FEI Vitrobot Mark IV (Thermo Fisher Scientific). Several sessions of data collection were conducted on the same Titan Krios equipped with an energy filter and operated at 300 keV using a nominal magnification of 130,000x. Movies were captured using a Gatan K2 Summit direct electron detector in counted mode, which resulted in a pixel size of 1.06 Å. Movie stacks were obtained with a defocus range of −1.0 to −2.0 μm, using SerialEM 3.7.10 47 with a set of customized scripts enabling automated low-dose image acquisition. Each movie stack was recorded for a total of 8 seconds with 0.2 s per frame. The exposure rate was 7 electrons per pixel per second. Initial datasets were collected by one exposure per hole per single stage movement but subsequent collections used 9-hole exposures per single stage movement with beam-tilt compensated by Multi-record strategy implemented in SerialEM 3.7.10.
CryoEM data processing
A total of 18,797 image stacks were subjected to beam-induced motion correction using MotionCor248. Contrast transfer function parameters for each micrograph were estimated from the exposure-weighted averages of all frames by Gctf v1.0649. The following processes were all performed using RELION 3.050, except those mentioned specifically. After 2D classification 2,628,700 particles were divided into 6 subsets for 3D classification. A reference map for 3D classification was generated by the “3D initial model” script in RELION 3.0 using default stochastic gradient descent parameters. All stable classes were then combined for 3D refinement, which led to a 4.5 Å map. Further 3D classification of this particle set resulted in two best classes with a total of 263,965 particles. The resulting bayesian polished particles were used to build the final map with an overall resolution of 4.2 Å, as determined by Fourier shell correlation (FSC) using a cutoff of 0.143. To probe the conformational dynamics, multi-body refinement was performed on the 4.2 Å map with two bodies corresponding to NTSR1 and βarr1. Local resolution was estimated with the Bsoft 2.0.6 package51 (Extended Data Fig. 6b).
Model building and refinement
The initial template for NTSR1-βarr1ΔCT was built from the receptor coordinates of NTSR1-NTS8–13 crystal structure (PDB ID: 4GRV) and arrestin coordinates from the V2Rpp-βarr1 structure (PDB ID: 4jQI). The initial coordinates for the NTS8–13 ligand were taken from the NTSR1-NTS8–13 crystal structure (PDB ID: 4GRV). Models were docked into the EM density map using UCSF Chimera 1.14 52, then refined by several iterations of automated refinement in Phenix interspersed with manual adjustments in Coot 0.8.953. The NTSR1 C-terminus was built based on the structure of V2Rpp bound to βarr1 (PDB ID: 4JQI). The final model was subjected to global refinement and minimization in real space using phenix.real_space_refine in Phenix 1.1654. Molprobity 4.5 was used to evaluate model geometry55 (Extended Data Table 1). FSC curves were calculated between the resulting model and the half map used for refinement as well as between the resulting model and the other half map for cross-validation (Extended Data Fig. 6a).
Phosphoproteomics experiments
Receptor samples were denatured, reduced, alkylated and digested according to manufacturer protocols (Protifi). Briefly, 5–10 μg of receptor sample in 0.004% LMNG/0.0004% CHS buffer was diluted two-fold with buffer containing ~10% SDS and 100 mM triethylammonium bicarbonate (TEAB, Sigma) pH 7.6. Cysteine residues were reduced by addition of freshly dissolved dithiothreitol (DTT, Sigma) to 20 mM final and heated to 95 °C for 10 min. Samples were cooled to room temperature and iodoacetamide (Sigma) was added to 40 mM final. Samples were incubated for 30 minutes with light was excluded at 25 °C with gentle agitation using a Thermomixer. 12% phosphoric acid was added to lower the pH for binding to the S-trap column, followed by binding buffer: 90% methanol, 100 mM TEAB pH 7.1. The sample was then added to the S-trap and sequentially spun at 4,000xg until all material was loaded discarding the flow-through. The column was washed three times with binding buffer, as above. Freshly reconstituted Trypsin/LysC (Promega) was diluted into 50 mM TEAB pH 8 supplemented with 0.02% protease max (Promega) and added to the S-trap (Protifi). The column was placed inside a clean microcentrifuge tube and incubated at 47 °C in a Thermomixer, without agitation, for one hour. After digestion peptides were sequentially eluted by spinning through, 40 μL of 50 mM TEAB pH 8, 40 μL of 0.1% formic acid and 35 μL of 50% aqueous acetonitrile with 0.2% formic acid. The resulting solution was combined and evaporated with a speedvac overnight.
Dried peptides were reconstituted in 0.1% formic acid and injected onto a reverse phase C18 IonOpticks 25 cm Aurora column using a nanoElute (Bruker Daltonics). Target on-column load was 200 ng total peptide per injection. The flow rate was 400 nL/min. Mobile phase A was 0.1% formic acid, 2% acetonitrile and 97.9% water; mobile phase B was 0.1% formic acid and 99.9% acetonitrile. The gradient was linear from 4 %B to 36 %B over 30 min. The mass spectrometer was a timsTOF Pro (Bruker Daltonics) set to acquire data in PASEF (Parallel Accumulation SErial Fragmentation) mode. The TIMS accumulation time was set to 100 ms and precursors were pushed at 2.7 ms. The dynamic exclusion settings were set to exclude the same precursor masses for 0.4 min where charge states of 0–5 were allowed. For each sample three technical replicates were run and analyzed independently.
Raw .d files from the timsTOF Pro were searched with Byonic v3.4 (Protein Metrics Inc) using a custom FASTA database which included the sequences of the human NTSR1 and human βarr1. The enzyme was Trypsin (KR) and set to fully specific, allowing for 2 missed cleavages and constrained to <1% false-discovery rate (FDR). The precursor mass tolerance was set to 20 ppm and the fragment ion tolerance at 40 ppm. A maximum of 6 common and 1 rare modification were allowed per peptide, and the following modifications were included in the search: C carbamidomethyl (+57.021464) as a fixed modification; N-term acetyl (+42.010565) as rare 1; N and Q deamidated (+0.984016), as rare 1; M oxidation, (+15.994915) as common 1, ST phosphorylation (+79.966331) as common 4; Y phosphorylation (+79.966331) as rare 1; C palmitoyl (+238.229666) as rare 1. The resulting Byonic results were imported into Byologic v.3.4–55 for quantitative analysis.
Lipidomics analysis of PIP2
Measurements of dioctyl (4,5)-PIP2 were performed using a q-Exactive FT-mass spectrometer (Thermo) equipped with Vanquish Split Sampler FT uHPLC. Samples were diluted in 50% aqueous methanol and injected onto a Dionex Acclaim® 120 C8 column (5 μm particle size 120 Å 2.1 mm ID, 50 mm length). The column compartment was maintained at 29 °C. The flow rate was 0.3 mL/min. Mobile phase A was 1:1 (v/v%) MeOH/water, 5 mM ammonium acetate; mobile phase B was pure acetone. Each run was five minutes; the gradient employed was as follows: 0–0.5 min 0% B, 0.5 to 2 min linear from 0 to 50% B, 2 to 3.5 min hold at 50% B, 3.5 to 3.6 min from 50% B to 0% B and 3.6 to 5 min at 0% B to re-equilibrate the column. The first minute of the run was diverted to waste and minutes 1 through 4.8 were sent to the mass spectrometer for analysis. Detection on the q-Exactive was performed in negative mode between 200–2000 m/z, using an acquisition target of 3E6, maximum IT of 100 ms at a resolution of 70,000 for MS and 17,500 for MS/MS data. For MS/MS analysis, dynamic exclusion was set to 10 seconds and a global inclusion list was used to target the 745.2 m/z species. Automatic gain control (AGC) target was set to 1E5, Maximum IT was 100 ms for MS1 and 50 ms for MS2. A stepped collision energy from 25 to 35 eV (N)CE and an isolation window of 4 m/z was used for higher-energy collision-induced dissociation (HCD).
Crosslinking Mass Spectrometry
Excised SDS-PAGE slices corresponding to protein or crosslinked proteins of interest were destained and diced to 1 mm pieces prior to reduction with 5 mM DTT for 30 mins, followed by alkylation with 10 mM acrylamide and finally digestion with Trypsin/LysC (Promega). Digestion was performed at an estimated 1:100 enzyme: substrate ratio overnight at 37 °C. After proteolysis, the reaction was quenched with 1% formic acid. Peptides were extracted and dried by speed vac before dissolving in 12 μl of reconstitution buffer (2% acetonitrile with 0.1% Formic acid); 3 μl of this solution was injected onto the LCMS. In a typical mass spectrometry experiment, an Orbitrap Fusion Tribrid mass spectrometer (Thermo Scientific, San Jose, CA) with liquid chromatography using a Nanoacquity UPLC (Waters Corporation, Milford, MA) was used at a flow rate of 450 nL/min. Reverse-phase chromatographic separations consisted of a mobile phase A that is 0.2% formic acid in water and a mobile phase B that is 0.2% formic acid in acetonitrile. Stationary phase consisted of pulled and packed in-house fused silica columns with an I.D. of 100 microns packed with Magic 1.8 micron 120 Å UChrom C18 (nanoLCMS Solutions) at a length of ~25 cm. Peptides were directly injected onto the analytical column using a gradient (2–45% B, followed by a high-B wash) of 80 min. The mass spectrometer was operated in a data-dependent fashion using either CID fragmentation or HCD/ETD decision tree fragmentation for MS/MS spectra. For CID and ETD, MS/MS spectra were detected in the ion trap and for HCD, MS/MS spectra were detected in the orbitrap. For data analysis, RAW data files were processed using Byonic v3.2.0 (Protein Metrics, Cupertino, CA) to identify peptides from a limited database of protein target sequences (as described for phosphoproteomics, above). Peptides were assumed to be fully specific, allowing for common modifications (e.g. oxidation of met), allowing for up to two missed cleavages and were constrained to a <2% FDR. Mass accuracies for precursor and peptide fragments detected in the orbitrap were held within 12 ppm, with 0.4 Da mass accuracies in the ion trap. Potential crosslinked peptides were validated using Byologic v.3.4–55 (Protein Metrics). Search results were evaluated in Byologic and evaluated relative to the structural model of the NTSR1- βarr1 complex.
Fluorescence anisotropy measurements
BODIPY® TMR Phosphatidylinositol 4,5-bisphosphate (Echelon Biosciences) was dissolved to a stock concentration of 1 mM in 50 mM Hepes pH 7.4 and used at a final concentration of 4 nM in the assay. For the arrestin measurements, a two-fold dilution series of was made from a 311 μM stock of βarr1ΔCT, yielding fourteen samples with final concentrations ranging from 150 μM to 0.02 μM. For the NTSR1 measurements, a two-fold dilution series was made from a 140 μM stock of NTSR1, yielding fourteen samples with final concentrations ranging from 67 μM to 0.01 μM. For each, a control sample containing buffer only was included to measure the free anisotropy of BODIPY-PIP2. After mixing the BODIPY-PIP2 with the receptor, arrestin or buffer, samples were incubated for 1h at room temperature prior to measurements. Samples were measured in five 20 μL (arrestin) or three 10 μL (receptor) replicates in a 384-well plate on a Tecan Infinite M1000 (Tecan Life Sciences), using an excitation wavelength of 530 nm, an emission wavelength of 573 nm and bandwidths of 5 nm. The obtained data was fit using “One Site Total” nonlinear regression using Graphpad Prism 8.3.0.
NanoBiT βarr1 recruitment assay
Recruitment of βarr1 to NTSR1 was measured by a NanoBiT PPI assay (Dixon 2016). Human full-length βarr1 was N-terminally fused to a large fragment (LgBiT) of the NanoBiT luciferase with a 15-amino acid flexible linker (GGSGGGGSGGSSSGG). N-terminally FLAG epitope (DYKDDDDK)-tagged human NTSR1 was C-terminally fused to a small fragment (SmBiT) with the 15-amino acid flexible linker. The Lg-βarr1 and the NTSR1-Sm constructs were inserted into a pCAGGS expression plasmid vector. HEK293A cells (Thermo Fisher Scientific) were seeded in a 6-well culture plate at a concentration of 2 × 10⁵ cells mL-1 (2 mL per well in DMEM (Nissui Pharmaceutical) supplemented with 10% fetal bovine serum (Gibco), glutamine, penicillin and streptomycin) 1-day before transfection. Transfection solution was prepared by combining 4 μL (per well in a 6-well plate, hereafter) of polyethylenimine solution (Polysciences; 1 mg mL-1) and a plasmid mixture consisting of 100 ng Lg-βarr1 and 500 ng NTSR1-Sm in 200 μL of Opti-MEM (ThermoFisher Scientific). After incubation for 1 day, transfected cells were harvested with 0.5 mM EDTA-containing Dulbecco’s PBS, centrifuged and suspended in 2 mL of HBSS containing 0.01% bovine serum albumin (BSA; fatty acid-free grade; SERVA) and 5 mM HEPES (pH 7.4) (assay buffer). The cell suspension was dispensed in a white 96-well plate at a volume of 80 μL per well and loaded with 20 μL of 50 μM coelenterazine (Carbosynth) diluted in the assay buffer. After 2-h incubation at room temperature, the plate was measured for baseline luminescence (Spectramax L, Molecular Devices) and 20 μL of 6X neurotensin (Peptide Institute; final concentrations ranging from 0.1 nM to 10 μM) diluted in the assay buffer or the assay buffer alone (vehicle) were manually added. The plate was read for 15 min with an interval of 20 sec at room temperature. Luminescence counts were normalized to the initial count and arrestin association kinetics were calculated by fitting the normalized luminescent data to a one-phase association model built in Prism 8 software (GraphPad Prism). When luminescent kinetics were bell-shaped, data points over increasing luminescence were used for the fitting. Association speed was calculated by a formula of (Plateau – Y0)*K where “Plateau” and “Y0” represent saturated and initial luminescent counts, respectively, and K denotes a rate constant in units that are the reciprocal of time (min). The resulting association speed data were fitted to a four-parameter sigmoidal concentration-response curve, from which pEC50 values (negative logarithmic values of EC50 values) and Emax values (“Top”-“Bottom”) were used to calculate mean and SD.
Extended Data
Extended Data Figure 1 – Screening for GPCR-βarr1 complexes.
A fluorescence-detection size-exclusion chromatography (FSEC) approach was used to identify GPCRs that display strong coupling to βarr1 in vitro. a) Overview of screening strategy. Small-scale transfection and purification of candidate GFP-tagged GPCRs was followed by complexing with activated βarr1, denoted by “βarr1*”. βarr1 was activated in situ by mixing with Fab30 and V2Rpp (see Methods Section) prior to being added (in excess) to agonist-bound receptor. Complex formation was assessed by FSEC. b) Representative FSEC traces. NTSR1 (left panel) stands out as displaying a shoulder peak, indicating substantial complex formation while the β2 adrenergic receptor (β2AR, right panel) shows little or no complex formation. Experiments were performed independently twice, with similar results.
Extended Data Figure 2 – Phosphorylation of NTSR1 is crucial for βarr1 coupling.
a) The phosphorylation state of NTSR1 was assessed using ion-exchange chromatography (IEX). Overlaid chromatograms of aliquots taken at various time point (shown in minutes), the relative amounts of unphosphorylated and phosphorylated species were measured using an optimized stepped elution profile. This experiment was performed independently once. b) Graphical representation of normalized relative ratio of phosphorylated and unphosphorylated receptor from data shown in (a). FSEC chromatogram for screening βarr1 constructs for forming stable complex with either unphosphorylated (c), or GRK5-phosphorylated NTSR1 (d). Elution volumes for free receptor, free βarr1 and receptor-βarr1 complex are noted. Unphosphorylated receptor does not complex to any of the βarr1 constructs tested, while phosphorylated receptor couples moderately to full-length βarr1 and strongly to the pre-activated βarr1ΔCT construct. Experiments were performed independently twice, with similar results.
Extended Data Figure 3: Overview of sample preparation and representative cryoEM preparation.
a) Workflow for NTSR1-βarr1ΔCT assembly. Receptor, GRK5 and βarr1ΔCT were purified separately. Phosphorylation of NTSR1 by GRK5 in the presence of diC8-PI(4,5)P2 was monitored by analytical IEX (shown in inset as gradient IEX elution from a representative preparation; a stepped elution IEX run is shown in Extended Data Fig. 2a), followed by M1 affinity purification. Phosphorylated receptor was combined with βarr1ΔCT and additional diC8-PI(4,5)P2 and separated by SEC to isolate NTSR1-βarr1ΔCT complex. Complex was labeled with sulfo-LC-SDA and UV irradiated. Following a second round of SEC to re-isolate complex, the sample was concentrated and used for cryo-EM. b) Representative sample preparation: phosphorylated NTSR1 was mixed with βarr1ΔCT and purified by SEC (blue curve, SEC1). Complex fractions were combined and treated with crosslinker, quenched, then UV irradiated. Lanes 2 and 3 of SDS-PAGE show pooled samples before and after crosslinking and UV irradiation; about 25% of sample is crosslinked (based on densitometry, top two bands relative to total). Crosslinked sample was re-run by SEC (red curve, SEC2) and SDS-PAGE of peak fractions is shown. Peak fractions were combined, concentrated and used for cryo-EM. Representative negative stain EM images of NTSR1-βarr1ΔCT complex show similar homogeneity, pre- and post-crosslinking. Enlarged views of rotated representative particles (denoted by yellow and blue circles) are shown. Four sample preparations, which all gave similar results by SEC, SDS-PAGE and negative stain analysis, were used to generate the cryoEM dataset.
Extended Data Figure 4: Mass spectrometry analysis of crosslinks in NTSR1-βarr1ΔCT complex.
a) Lysine residues modified within the NTSR1-βarr1ΔCT complex after treatment with sulfo-LC-SDA were identified by MS. Though MS data was collected for each band observed by SDS-PAGE separately (see Extended Data Fig. 3b), data were combined for analysis as the overall sample was imaged by cryo-EM. For each lysine residue in the complex the degree of modification was approximated as the percent of times a lysine was found to be modified relative to the number of total times that lysine is observed across all peptides. The Cα for Lysine residues which were observed to be modified less than 30% of the time are shown as gray spheres, while those found to be modified more than 30% of the time are shown as green spheres. A tabulated analysis is presented in Supplementary Tables 1–7. b) Of the modified lysine residues, several largely formed dead-end crosslinks (reaction of the activated diazirene with water), those with >30% of the lysine residues resulting in dead-end crosslinks are shown as maroon spheres (Cα). c) Only one intermolecular crosslink is observed that is consistent with the structural model obtained from cryo-EM. This crosslink was localized to ICL1 (K91) and a β-strand (shown in green) in the arrestin C-lobe. d) Several intramolecular crosslinks within ICL2 and the adjacent helices are observed. Reactive lysine residues shown as green spheres (for Cα) and crosslinks were localized to the region shown in green. e) Multiple Intramolecular crosslinks within arrestin were observed. Each reactive lysine residue (shown as a Cα sphere) that forms an intrapeptide crosslink, or an intramolecular (within arrestin) crosslink is colored to match the region where the observed crosslink could be localized. Each band was analyzed once by MS from a representative cryoEM preparation.
Extended Data Figure 5: CryoEM workflow.
Flow-chart of cryoEM data analysis. Global resolution was determined by Fourier shell coefficient (FSC) with cut-off 0.143. The mask used for sharpening was also used for global resolution determination.
Extended Data Figure 6: CryoEM map resolution and model validation, with multi-body analysis revealing structural heterogeneity within the NTSR1-βarr1ΔCT complex.
a) Map-model cross validation. The model was refined against one half map after displacement of atoms by 0.2 Å, and FSC curves were calculated between this model and the working half1 map (red), the free half2 map (green) and the final cryoEM map (full dataset, black) by Mtriage implemented in Phenix. b) Local resolution of the final 4.2 Å map was estimated by Bsoft. c) Euler angle distribution of particle set used in the final map. d) Representative sections of the model with accompanying regions of density from the EM map. e) Masks employed for multi-body refinement. f) The contributions of each of the twelve eigenvectors (numbered along x-axis) to the variance of the overall final map. g) Maps corresponding to the 2nd and 9th components of the first eigenvector (panel f) are aligned, showing swing-like motion of βarr1ΔCT with respect to NTSR1. h) Maps corresponding to 1st and 10th components of the second eigenvector (panel f) are superimposed, indicating tilt-like motion of βarr1ΔCT with respect to NTSR1.
Extended Data Figure 7: Arrestin orientation and interdomain twist.
a) Additional views of Fig. 1c, showing an overlay between NTSR1-βarr1ΔCT and Rho-Arr1: cytoplasmic (intracellular) view (left panel), side view (middle panel) and extracellular view (right panel). b) Compared to the inactive structure, βarr1ΔCT in complex with NTSR1 displays an additional interdomain twist between its N- and C-lobe, a hallmark of activation. Comparison of interdomain twist between NTSR1-βarr1ΔCT (blue, present structure) and V2Rpp-βarr1 (orange, PDB ID: 4JQI) relative to inactive βarr1 (wheat, PDB ID: 1G4M). A smaller interdomain twist and displacement between respective C-lobes is observed for NTSR1-bound βarr1 (16°, 3.6 Å) compared to V2Rpp-bound βarr1 (22°, 4.6 Å), indicated by arrows drawn to relative scale. A similar comparison for rhodopsin-bound arrestin-1 (green, PDB ID: 5W0P) and pre-activated p44 arrestin-1 (purple, PDB ID: 4J2Q) relative to inactive arrestin-1 (pink, PDB ID: 1CF1) yields interdomain twist and displacement values of 20°, 5.4 Å and 23°, 6.1 Å respectively.
Extended Data Figure 8: Identification of GRK5 phosphorylation sites in human NTSR1 and comparison of phosphate-specific contacts in NTSR1-βarr1ΔCT to Rho-Arr1 and V2Rpp-βarr1.
a) Snake diagram of human NTSR1 showing identified phosphosites in ICL3 and the receptor C-terminus. The Trypsin/LysC digestion sites are shown in light blue. All four phosphosites for ICL3 are in a single peptide QAA…PGR. Phosphosites in the C-terminus occur on two peptides, one containing S396, RPAFSR, as well as several missed cleavage variants; and one containing S401, S403, S404, T407 and T413. Tabulated fragment ions are presented in Supplementary Tables 8–39 and spectra are shown in Supplementary Figs. 2–5. Any post translational modifications outside of these two discussed regions are not shown for clarity. These experiments were performed independently twice, and analyzed by two or three technical replicates each time, all with similar results. b) Overlay of arrestin structures, where binding of phosphorylated receptor residues contributes to stabilizing the active state of arrestin. Left panel: equivalent phosphoresidues on different receptor C-tails (shown in stick representation and colored accordingly: NTSR1, yellow; V2Rpp, red; rhodopsin, pink) contribute to arrestin activation by interacting with a lysine residue on the gate loop (shown as spheres), thereby breaking the polar core. Right panel: phosphoresidue pT347 in the V2Rpp interacts with residue K77 at the base of the finger loop. A similarly positioned phosphoresidue in the NTSR1 ICL3 (pS287) likely interacts with arrestin residues R76/K77 in a similar fashion.
Extended Data Figure 9: Membrane context and curvature for NTSR1-βarr1ΔCT.
a) Comparison of NTSR1-βarr1ΔCT and NTSR1-cGi structures, for which membrane-embedded regions were computed using the Orientations of Proteins in Membranes server (https://opm.phar.umich.edu/). The membrane is indicated by grey spheres to show the extent to which the C-edge would insert into the membrane. b) The extent of arrestin tilt observed in the NTSR1-βarr1ΔCT structure could also be relevant to the increased membrane curvature observed in endocytic vesicles. As an example, several membrane bilayers are drawn (in red) to scale, comparing the degree of curvature for vesicles ranging from 120 nm to 50 nm in diameter relative to a planar bilayer.
Extended Data Table 1.
CryoEM data collection, refinement and validation statistics
| #1 name (EMDR-20836) (PDB 6UP7) | |
|---|---|
| Data collection and processing | |
| Magnification | 130,000 |
| Voltage (kV) | 300 |
| Electron exposure (e-/Å2) | 56 |
| Defocus range (μm) | −1.0~−2.0 |
| Pixel size (Å) | 1.06 |
| Symmetry imposed | Cl |
| Initial particle images (no.) | 12,365,655 |
| Final particle images (no.) | 254,725 |
| Map resolution (Å) | 4.2 |
| FSC threshold | 0.143 |
| Map resolution range (Å) | 3.5~5.0 |
| Refinement | |
| Initial model used (PDB code) | 4GRV,4JQI |
| Map sharpening B factor (Å2) | −164 |
| Model composition | |
| Non-hydrogen atoms | 4166 |
| Protein residues | 685 |
| Ligands | 1 |
| B factors (Å2) | |
| Protein | 69.94 |
| Ligand | 130.87 |
| R.m.s. deviations | |
| Bond lengths (Å) | 0.009 |
| Bond angles (°) | 1.362 |
| Validation | |
| MolProbity score | 2.09 |
| Clashscore | 8.44 |
| Poor rotamers (%) | 0 |
| Ramachandran plot | |
| Favored (%) | 86.81 |
| Allowed (%) | 13.19 |
| Disallowed (%) | 0 |
Supplementary Material
Acknowledgements
We thank Michael Krawitzky and Christopher Adams (Bruker) for instrument and software access; Ryan Leib, Fang Liu (Vincent Coates Foundation Mass Spectrometry Laboratory, Stanford University) and Marshall Bern (Protein Metrics Inc.) for helpful discussions pertaining to MS data analysis; Grace Lam and Bill Fitch (Stanford University) for assistance with lipidomics analysis; Kayo Sato, Yuko Sugamura and Ayumi Inoue (Tohoku University) for plasmid construction and cell-based GPCR assays; and Daniel Mayer for helpful suggestions on arrestin purification. This work was supported in part by National Institutes of Health grants R01NS028471 (B.K.K.), 1U19AI109662 (J.S.G), and P30 CA124435 (for utilizing the Stanford Cancer Institute Proteomics/Mass Spectrometry Shared Resource). Additional support to G.S. and B.K.K. was provided by the Mathers Foundation. B.K.K. is a Chan-Zuckerberg Biohub Investigator. M.M. was supported by an American Heart Association postdoctoral fellowship (17POST33410958). J.J. is a Damon Runyon Fellow supported by the Damon Runyon Cancer Research Foundation (DRG-2318-18). A.I. was funded by the PRIME 18gm5910013 and the LEAP 18gm0010004 from the Japan Agency for Medical Research and Development (AMED) and KAKENHI 17K08264 from the Japan Society for the Promotion of Science (JSPS). H.E.K. was funded by KAKENHI 19H03163 from JSPS and The Naito Foundation.
Footnotes
Competing Interests
B.K.K. is a co-founder of and consultant for ConfometRx.
Data Availability
The cryoEM density map for the NTSR1-βarr1ΔCT complex has been deposited in the Electron Microscopy Data Bank (EMDB) under accession code EMD-20836. The coordinates for the model of NTSR1-βarr1ΔCT have been deposited in the PDB under accession number 6UP7. Proteomics data have been deposited in the ProteomeXchange Consortium via the PRIDE partner repository (https://www.ebi.ac.uk/pride/) with the dataset identifier PXD016224 and 10.6019/PXD016224. We declare that the data supporting findings for this study are available as Supplementary Information (Supplementary Tables 1–39 and Supplementary Figs. 2–5). All other data are available upon request to the corresponding authors.
References
- 1.Scheerer P. & Sommer ME Structural mechanism of arrestin activation. Curr Opin Struct Biol 45, 160–169 (2017). [DOI] [PubMed] [Google Scholar]
- 2.Hilger D, Masureel M. & Kobilka BK Structure and dynamics of GPCR signaling complexes. Nat Struct Mol Biol 25, 4–12 (2018). [DOI] [PMC free article] [PubMed] [Google Scholar]
- 3.Rankovic Z, Brust TF & Bohn LM Biased agonism: An emerging paradigm in GPCR drug discovery. Bioorg Med Chem Lett 26, 241–250 (2016). [DOI] [PMC free article] [PubMed] [Google Scholar]
- 4.Luttrell LM, Maudsley S. & Bohn LM Fulfilling the Promise of “Biased” G Protein-Coupled Receptor Agonism. Mol Pharmacol 88, 579–88 (2015). [DOI] [PMC free article] [PubMed] [Google Scholar]
- 5.Barak LS et al. ML314: A Biased Neurotensin Receptor Ligand for Methamphetamine Abuse. ACS Chem Biol 11, 1880–90 (2016). [DOI] [PMC free article] [PubMed] [Google Scholar]
- 6.Peterson YK & Luttrell LM The Diverse Roles of Arrestin Scaffolds in G Protein-Coupled Receptor Signaling. Pharmacol Rev 69, 256–297 (2017). [DOI] [PMC free article] [PubMed] [Google Scholar]
- 7.Laporte SA & Scott MGH beta-Arrestins: Multitask Scaffolds Orchestrating the Where and When in Cell Signalling. Methods Mol Biol 1957, 9–55 (2019). [DOI] [PubMed] [Google Scholar]
- 8.Krishna Kumar K. et al. Structure of a Signaling Cannabinoid Receptor 1-G Protein Complex. Cell 176, 448–458 e12 (2019). [DOI] [PMC free article] [PubMed] [Google Scholar]
- 9.Kato HE et al. Conformational transitions of a neurotensin receptor 1-Gi1 complex. Nature 572, 80–85 (2019). [DOI] [PMC free article] [PubMed] [Google Scholar]
- 10.Maeda S, Qu Q, Robertson MJ, Skiniotis G. & Kobilka BK Structures of the M1 and M2 muscarinic acetylcholine receptor/G-protein complexes. Science 364, 552–557 (2019). [DOI] [PMC free article] [PubMed] [Google Scholar]
- 11.Gao Y. et al. Structures of the Rhodopsin-Transducin Complex: Insights into G-Protein Activation. Mol Cell (2019). [DOI] [PMC free article] [PubMed] [Google Scholar]
- 12.Garcia-Nafria J. & Tate CG Cryo-EM structures of GPCRs coupled to Gs, Gi and Go. Mol Cell Endocrinol 488, 1–13 (2019). [DOI] [PubMed] [Google Scholar]
- 13.Glukhova A. et al. Rules of Engagement: GPCRs and G Proteins. ACS Pharmacology & Translational Science 1, 73–83 (2018). [DOI] [PMC free article] [PubMed] [Google Scholar]
- 14.Zhou XE et al. Identification of Phosphorylation Codes for Arrestin Recruitment by G Protein-Coupled Receptors. Cell 170, 457–469 e13 (2017). [DOI] [PMC free article] [PubMed] [Google Scholar]
- 15.Yang F. et al. Phospho-selective mechanisms of arrestin conformations and functions revealed by unnatural amino acid incorporation and (19)F-NMR. Nat Commun 6, 8202 (2015). [DOI] [PMC free article] [PubMed] [Google Scholar]
- 16.Lohse MJ, Benovic JL, Codina J, Caron MG & Lefkowitz RJ beta-Arrestin: a protein that regulates beta-adrenergic receptor function. Science 248, 1547–50 (1990). [DOI] [PubMed] [Google Scholar]
- 17.Rostene WH & Alexander MJ Neurotensin and neuroendocrine regulation. Front Neuroendocrinol 18, 115–73 (1997). [DOI] [PubMed] [Google Scholar]
- 18.Besserer-Offroy E. et al. The signaling signature of the neurotensin type 1 receptor with endogenous ligands. Eur J Pharmacol 805, 1–13 (2017). [DOI] [PubMed] [Google Scholar]
- 19.White JF et al. Structure of the agonist-bound neurotensin receptor. Nature 490, 508–13 (2012). [DOI] [PMC free article] [PubMed] [Google Scholar]
- 20.Egloff P. et al. Structure of signaling-competent neurotensin receptor 1 obtained by directed evolution in Escherichia coli. Proc Natl Acad Sci U S A 111, E655–62 (2014). [DOI] [PMC free article] [PubMed] [Google Scholar]
- 21.Krumm BE, White JF, Shah P. & Grisshammer R. Structural prerequisites for G-protein activation by the neurotensin receptor. Nat Commun 6, 7895 (2015). [DOI] [PMC free article] [PubMed] [Google Scholar]
- 22.Komolov KE et al. Structural and Functional Analysis of a beta2-Adrenergic Receptor Complex with GRK5. Cell 169, 407–421 e16 (2017). [DOI] [PMC free article] [PubMed] [Google Scholar]
- 23.Komolov KE & Benovic JL G protein-coupled receptor kinases: Past, present and future. Cell Signal 41, 17–24 (2018). [DOI] [PMC free article] [PubMed] [Google Scholar]
- 24.Inagaki S. et al. G Protein-Coupled Receptor Kinase 2 (GRK2) and 5 (GRK5) Exhibit Selective Phosphorylation of the Neurotensin Receptor in Vitro. Biochemistry 54, 4320–9 (2015). [DOI] [PMC free article] [PubMed] [Google Scholar]
- 25.Vishnivetskiy SA et al. An additional phosphate-binding element in arrestin molecule. Implications for the mechanism of arrestin activation. J Biol Chem 275, 41049–57 (2000). [DOI] [PubMed] [Google Scholar]
- 26.Peisley A. & Skiniotis G. 2D Projection Analysis of GPCR Complexes by Negative Stain Electron Microscopy. Methods Mol Biol 1335, 29–38 (2015). [DOI] [PubMed] [Google Scholar]
- 27.Nakane T, Kimanius D, Lindahl E. & Scheres SH Characterisation of molecular motions in cryo-EM single-particle data by multi-body refinement in RELION. Elife 7(2018). [DOI] [PMC free article] [PubMed] [Google Scholar]
- 28.Gurevich VV & Gurevich EV The structural basis of arrestin-mediated regulation of G-protein-coupled receptors. Pharmacol Ther 110, 465–502 (2006). [DOI] [PMC free article] [PubMed] [Google Scholar]
- 29.Gaidarov I, Krupnick JG, Falck JR, Benovic JL & Keen JH Arrestin function in G protein-coupled receptor endocytosis requires phosphoinositide binding. EMBO J 18, 871–81 (1999). [DOI] [PMC free article] [PubMed] [Google Scholar]
- 30.Chen Q. et al. Structural basis of arrestin-3 activation and signaling. Nat Commun 8, 1427 (2017). [DOI] [PMC free article] [PubMed] [Google Scholar]
- 31.Milano SK, Kim YM, Stefano FP, Benovic JL & Brenner C. Nonvisual arrestin oligomerization and cellular localization are regulated by inositol hexakisphosphate binding. J Biol Chem 281, 9812–23 (2006). [DOI] [PubMed] [Google Scholar]
- 32.Lally CC, Bauer B, Selent J. & Sommer ME C-edge loops of arrestin function as a membrane anchor. Nat Commun 8, 14258 (2017). [DOI] [PMC free article] [PubMed] [Google Scholar]
- 33.Kang DS et al. Structure of an arrestin2-clathrin complex reveals a novel clathrin binding domain that modulates receptor trafficking. J Biol Chem 284, 29860–72 (2009). [DOI] [PMC free article] [PubMed] [Google Scholar]
- 34.Gurevich VV et al. Arrestin interactions with G protein-coupled receptors. Direct binding studies of wild type and mutant arrestins with rhodopsin, beta 2-adrenergic, and m2 muscarinic cholinergic receptors. J Biol Chem 270, 720–31 (1995). [DOI] [PubMed] [Google Scholar]
- 35.Han M, Gurevich VV, Vishnivetskiy SA, Sigler PB & Schubert C. Crystal Structure of β-Arrestin at 1.9 Å. Structure 9, 869–880 (2001). [DOI] [PubMed] [Google Scholar]
- 36.Shukla AK et al. Structure of active beta-arrestin-1 bound to a G-protein-coupled receptor phosphopeptide. Nature 497, 137–41 (2013). [DOI] [PMC free article] [PubMed] [Google Scholar]
- 37.Szczepek M. et al. Crystal structure of a common GPCR-binding interface for G protein and arrestin. Nat Commun 5, 4801 (2014). [DOI] [PMC free article] [PubMed] [Google Scholar]
- 38.Eichel K. et al. Catalytic activation of beta-arrestin by GPCRs. Nature 557, 381–386 (2018). [DOI] [PMC free article] [PubMed] [Google Scholar]
- 39.Yen HY et al. PtdIns(4,5)P2 stabilizes active states of GPCRs and enhances selectivity of G-protein coupling. Nature 559, 423–427 (2018). [DOI] [PMC free article] [PubMed] [Google Scholar]
- 40.Inoue A. et al. Illuminating G-Protein-Coupling Selectivity of GPCRs. Cell 177, 1933–1947 e25 (2019). [DOI] [PMC free article] [PubMed] [Google Scholar]
- 41.Eichel K. & von Zastrow M. Subcellular Organization of GPCR Signaling. Trends Pharmacol Sci 39, 200–208 (2018). [DOI] [PMC free article] [PubMed] [Google Scholar]
- 42.Eichel K, Jullie D. & von Zastrow M. beta-Arrestin drives MAP kinase signalling from clathrin-coated structures after GPCR dissociation. Nat Cell Biol 18, 303–10 (2016). [DOI] [PMC free article] [PubMed] [Google Scholar]
- 43.Lee MH et al. The conformational signature of beta-arrestin2 predicts its trafficking and signalling functions. Nature 531, 665–8 (2016). [DOI] [PMC free article] [PubMed] [Google Scholar]
- 44.Nuber S. et al. beta-Arrestin biosensors reveal a rapid, receptor-dependent activation/deactivation cycle. Nature 531, 661–4 (2016). [DOI] [PMC free article] [PubMed] [Google Scholar]
Methods References
- 45.Goddard TD et al. UCSF ChimeraX: Meeting modern challenges in visualization and analysis. Protein Sci 27, 14–25 (2018). [DOI] [PMC free article] [PubMed] [Google Scholar]
- 46.Beyett TS et al. Perturbation of the interactions of calmodulin with GRK5 using a natural product chemical probe. Proc Natl Acad Sci U S A 116, 15895–15900 (2019). [DOI] [PMC free article] [PubMed] [Google Scholar]
- 47.Schorb M, Haberbosch I, Hagen WJH, Schwab Y. & Mastronarde DN Software tools for automated transmission electron microscopy. Nat Methods 16, 471–477 (2019). [DOI] [PMC free article] [PubMed] [Google Scholar]
- 48.Zheng SQ et al. MotionCor2: anisotropic correction of beam-induced motion for improved cryo-electron microscopy. Nat Methods 14, 331–332 (2017). [DOI] [PMC free article] [PubMed] [Google Scholar]
- 49.Zhang K. Gctf: Real-time CTF determination and correction. J Struct Biol 193, 1–12 (2016). [DOI] [PMC free article] [PubMed] [Google Scholar]
- 50.Zivanov J. et al. New tools for automated high-resolution cryo-EM structure determination in RELION-3. Elife 7(2018). [DOI] [PMC free article] [PubMed] [Google Scholar]
- 51.Heymann JB & Belnap DM Bsoft: image processing and molecular modeling for electron microscopy. J Struct Biol 157, 3–18 (2007). [DOI] [PubMed] [Google Scholar]
- 52.Pettersen EF et al. UCSF Chimera--a visualization system for exploratory research and analysis. J Comput Chem 25, 1605–12 (2004). [DOI] [PubMed] [Google Scholar]
- 53.Emsley P. & Cowtan K. Coot: model-building tools for molecular graphics. Acta Crystallogr D Biol Crystallogr 60, 2126–32 (2004). [DOI] [PubMed] [Google Scholar]
- 54.Adams PD et al. The Phenix software for automated determination of macromolecular structures. Methods 55, 94–106 (2011). [DOI] [PMC free article] [PubMed] [Google Scholar]
- 55.Williams CJ et al. MolProbity: More and better reference data for improved all-atom structure validation. Protein Sci 27, 293–315 (2018). [DOI] [PMC free article] [PubMed] [Google Scholar]
Associated Data
This section collects any data citations, data availability statements, or supplementary materials included in this article.


