Abstract
While it is well-established that alterations in the portal vein insulin/glucagon ratio play a major role in causing dysregulated hepatic glucose metabolism in type 2 diabetes (T2D)1–3, the mechanisms by which glucagon alters hepatic glucose production and mitochondrial oxidation remain poorly understood. Here we show that glucagon stimulates hepatic gluconeogenesis by increasing hepatic adipose triglyceride lipase activity, intrahepatic lipolysis, hepatic acetyl-CoA content, and pyruvate carboxylase flux, while also increasing mitochondrial fat oxidation, mediated by stimulation of the inositol triphosphate receptor-1 (InsP3R-I). Chronic physiological increases in plasma glucagon concentrations increased mitochondrial hepatic fat oxidation and reversed diet-induced hepatic steatosis and insulin resistance in rats and mice; however, the effect of chronic glucagon treatment to reverse hepatic steatosis and glucose intolerance was abrogated in InsP3R-I knockout mice. These results provide new insights into glucagon biology and suggest that InsP3R-I may be a novel therapeutic target to reverse nonalcoholic fatty liver disease and T2D.
Based on the clear role for glucagon in the pathogenesis of diabetes, glucagon-blocking therapies have been pursued as adjuncts to therapy. Glucagon antagonism4–9 and knockdown of the glucagon receptor10,11 have shown glucose-lowering effects; however, these agents increase liver enzymes7,8 by an unknown mechanism. Conversely, a dual glucagon-like peptide-1/glucagon receptor agonist lowers blood glucose, associated with increased energy expenditure and weight loss12. Together, these data suggest a role for glucagon to promote hepatic mitochondrial fat oxidation in addition to hepatic gluconeogenesis.
Glucagon stimulates hepatic glycogenolysis and gluconeogenesis, the latter believed to occur largely through transcriptional regulation. Hepatic calcium signaling is integral to transcriptional regulation of gluconeogenesis: inhibition or deletion of liver Ca2+/calmodulin-dependent protein kinase II (CAMKII) results in reduced gluconeogenic protein expression in mouse livers and associated reductions in plasma glucose and insulin concentrations13–15. Type I InsP3R is the isoform primarily responsible for mitochondrial calcium signaling in hepatocytes16. Wang et al. showed that knocking down InsP3R-I reduced glucose production in isolated hepatocytes14; however, no studies have fully characterized the role of InsP3R signaling in glucagon-stimulated hepatic gluconeogenesis in vivo.
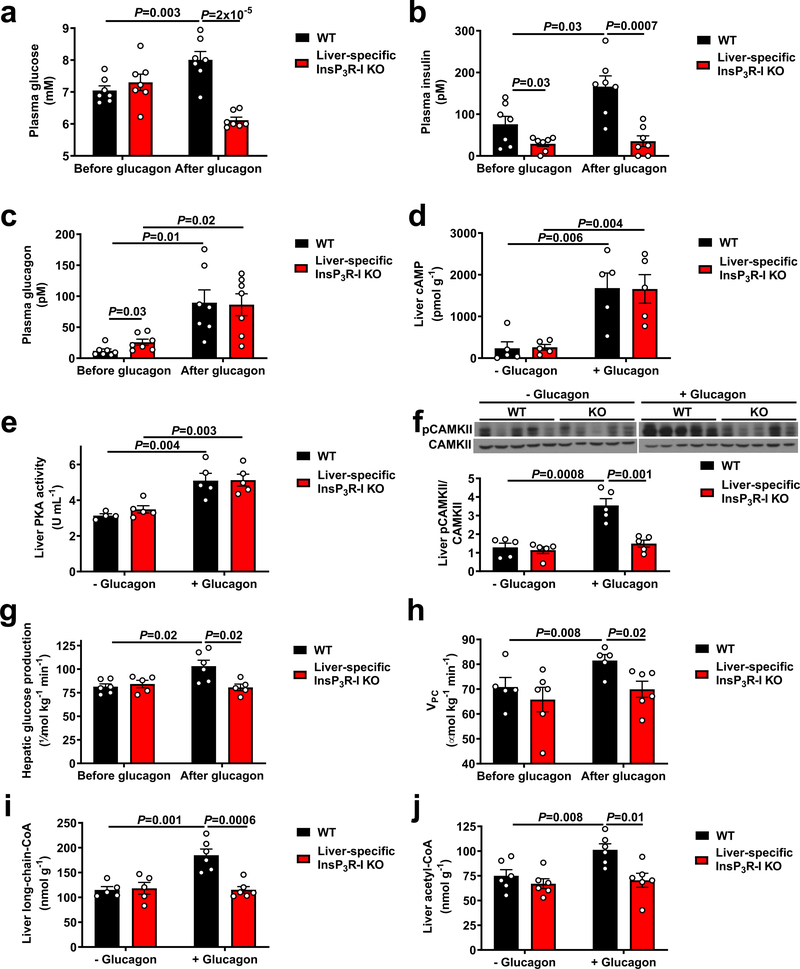
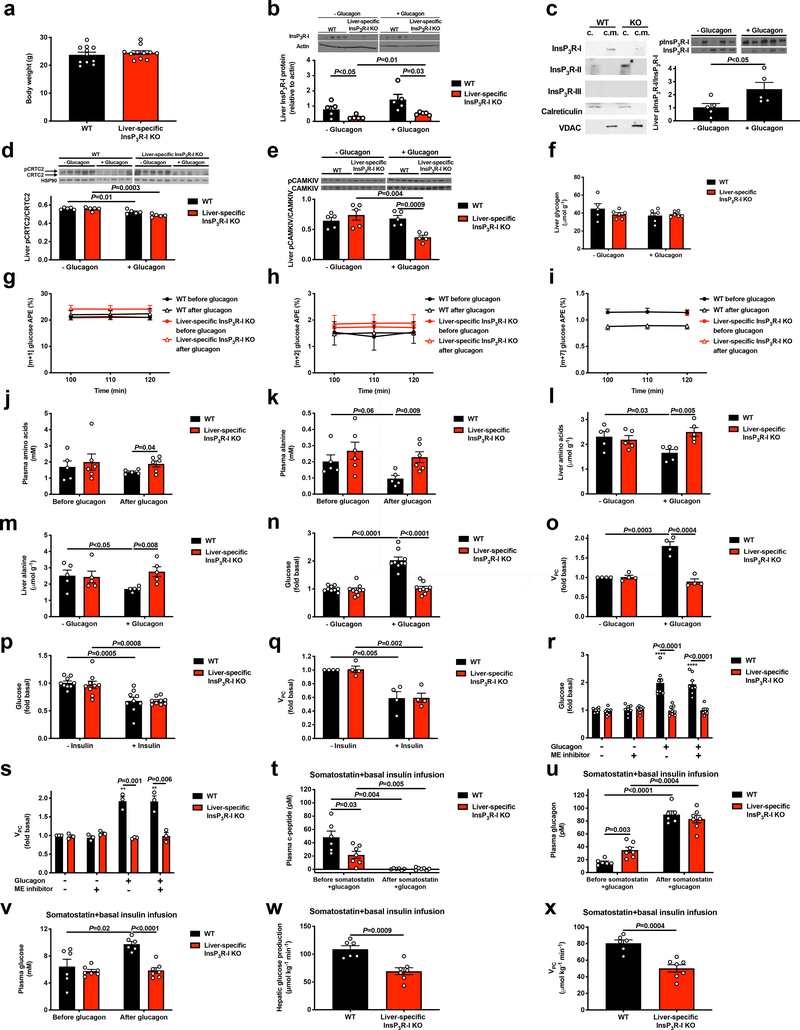
In order to examine the potential calcium dependence of the acute response to glucagon, we studied overnight-fasted, glycogen-depleted, liver-specific InsP3R-I knockout (InsP3R-I KO) mice and their weight-matched wild-type (WT) littermates (Extended Data Figure 1a). InsP3R-I KO mice exhibited a marked reduction in hepatic InsP3R-I protein expression (Extended Data Figure 1b; full gels for all blots in Supplementary Figure 1). We examined subcellular fractions in primary hepatocytes and found that InsP3R-I was associated with mitochondria, while InsP3R-II was not, and InsP3R-III was not detected (Extended Data Figure 1c), consistent with prior data showing that InsP3R-I is primarily responsible for mitochondrial calcium signals16. We then treated mice with an acute infusion of glucagon, which modestly increased plasma glucose and insulin concentrations in WT but not KO mice, associated with increased InsP3R-I phosphorylation (Figure 1a–c, Extended Data Figure 1c). CREB-regulated transcriptional coactivator-2 (CRTC2) phosphorylation was decreased with glucagon in both genotypes (Extended Data Figure 1d), consistent with previous literature14. Glucagon increased cAMP concentrations and protein kinase A (PKA) activity in both genotypes, dissociating these mediators from glucagon-induced changes in plasma glucose (Figure 1d–e). Consistent with a previous report13, glucagon stimulated CAMKII but not CAMKIV phosphorylation in an InsP3R-I-dependent manner (Figure 1f, Extended Data Figure 1e). These data imply that InsP3R-I activation and CAMKII activity are required for glucagon’s acute effect to stimulate hepatic glucose production (HGP), which can be attributed almost entirely to gluconeogenesis in this glycogen-depleted state17. Indeed, we measured ~25% increases in in vivo HGP, which could be attributed to increased hepatic VPC flux associated with amino acid depletion without alterations in hepatic glycogen content (Figure 1g–h, Extended Data Figure 1f–m, Supplementary Table 1–2). The in vivo HGP data were mirrored by two-fold increases in both HGP and VPC flux in isolated hepatocytes from WT but not KO mice incubated with glucagon (Extended Data Figure 1n–o). Insulin’s ability to suppress HGP and VPC flux was unaltered in KO hepatocytes, and malic enzyme activity was dissociated from HGP by treatment with a malic enzyme inhibitor (Extended Data Figure 1p–s). Finally, in vivo studies with somatostatin and replacement insulin infusion to mimic basal portal vein insulin concentrations (~85–90 pM in both genotypes) revealed that changes in plasma insulin could not explain glucagon’s effect to stimulate HGP and VPC only in WT mice (Extended Data Figure 1t–x).
Figure 1.
Glucagon acutely stimulates hepatic gluconeogenesis by increasing hepatic acetyl-CoA content and VPC. (a)-(c) Plasma glucose, insulin, and glucagon concentrations before and at the end of a 2 hr intravenous infusion of glucagon (n=7). (d)-(f) Hepatic cAMP concentrations, protein kinase A activity, and CAMKII phosphorylation (n=5, with the exception of WT –glucagon in panel (e), in which n=4). Blots in Figures 1f and 2a, and Extended Data Figures 1b, 1d, 1f, 3f, 3g, and 4a were stripped and re-probed for all proteins of interest. (g)-(h) HGP (n=6 WT and 5 KO) and VPC (n=5 WT and 6 KO). (i)-(j) Hepatic long-chain- (n=5 WT-glucagon, 6 WT+glucagon, and 6 KO) and acetyl-CoA content (n=6). In all panels, the mean±S.E.M. is shown. Groups were compared before and after glucagon (panels a-c, g, and h) by the 2-tailed paired Student’s t-test, and separate animals (+/− glucagon in panels d-f, i, and j, and WT vs. KO animals in all panels) were compared by the 2-tailed unpaired Student’s t-test.
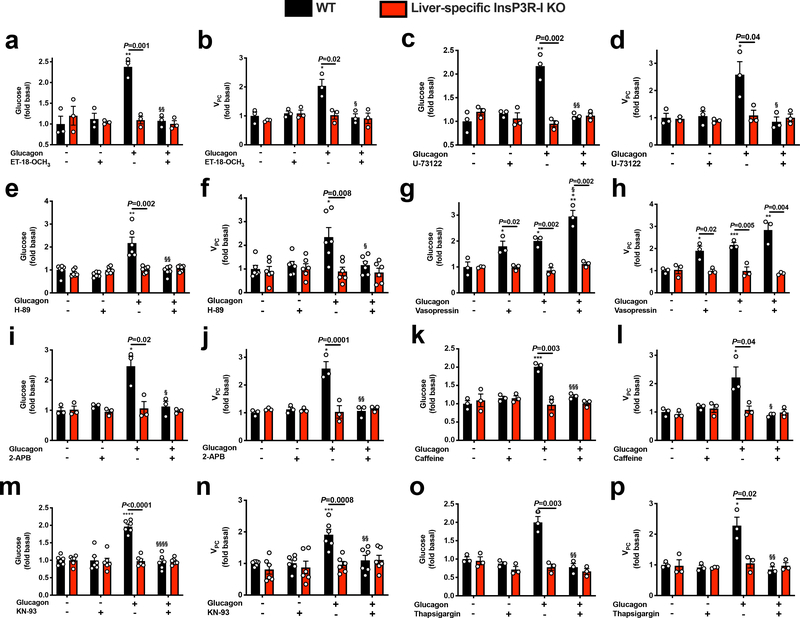
To further explore the calcium-dependent mechanism by which glucagon stimulates HGP and VPC flux, we treated hepatocytes with ET-18-OCH3 or U-73122, two phospholipase C (PLC) antagonists, and found that both agents inhibited glucose production and VPC flux in WT but not InsP3R-I KO hepatocytes (Extended Data Figure 2a–d). Similarly, a PKA inhibitor, H-89, abrogated glucagon’s ability to stimulate glucose production and VPC only in WT hepatocytes, demonstrating that both the PLC and PKA pathways are required to activate gluconeogenesis in response to glucagon via InsP3R-I signaling (Extended Data Figure 2e–f). Next to specifically confirm the role of InsP3R-I to promote HGP, we treated hepatocytes with vasopressin, an activator of the InsP3 receptor, and found that this agent recapitulated the effect of glucagon to increase HGP and VPC (Extended Data Figure 2g–h). However, small molecule inhibitors of InsP3 (2-aminoethoxydiphenyl borate [2-ABP] and caffeine), CAMKII/IV (KN-93), and the SERCA pump (thapsigargin), inhibited glucagon’s effect to stimulate HGP and VPC (Extended Data Figure 2i–p), suggesting that maintaining a normal balance of calcium throughout the cell is required for normal InsP3R-I signaling. None of these agents had any effect in InsP3R-I KO mice, indicating that InsP3R-II and -III do not restore glucose production in the absence of InsP3R-I in liver.
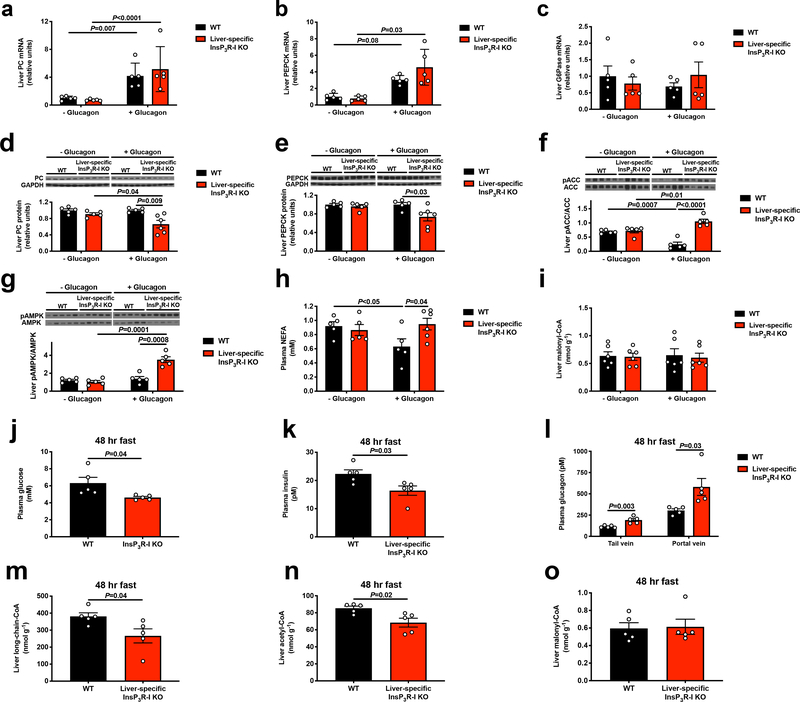
Surprisingly the observed increases in rates of HGP occurred in the absence of any effect of glucagon to acutely increase hepatic gluconeogenic mRNA or protein expression in vivo. However, glucagon infusion increased hepatic long-chain acyl-CoA and acetyl-CoA content by 35–60% (Figure 1i–j, Extended Data Figure 3a–e). These increases in hepatic long-chain- and acetyl-CoA concentrations were dissociated from phosphorylation of both acetyl-CoA carboxylase and 5’ AMP-activated protein kinase (AMPK), both of which were increased in InsP3R-I KO mice but not in WT mice (Extended Data Figure 3f–g), likely reflecting the interplay between glucagon’s ability to promote the phosphorylation of both enzymes and the ability of hyperinusulinemia, which was observed only in WT mice infused with glucagon, to suppress it. Hepatic long-chain acyl-CoA and acetyl-CoA content increased in WT mice infused with glucagon despite reduced plasma NEFA concentrations in glucagon-treated WT mice (Extended Data Figure 3h), consistent with glucagon stimulation of intrahepatic but not white adipose tissue (WAT) lipolysis. As acetyl-CoA is an allosteric activator of PC18, the increase in hepatic acetyl-CoA content observed with glucagon infusion could explain the increases in VPC and HGP rates that occurred following glucagon treatment in WT mice. These changes occurred independently of any changes in hepatic malonyl-CoA content (Extended Data Figure 3i), indicating that malonyl-CoA suppression of carnitine palmitoyl transferase-I was not responsible for glucagon stimulation of hepatic mitochondrial β-oxidation under these conditions.
To further understand the physiologic role of glucagon-induced HGP, we fasted WT and InsP3R-I KO mice for 48 hr. In the starved state, despite 70–90% increases in plasma glucagon concentrations in the tail vein and portal vein, KO mice manifested relative reductions in plasma glucose and insulin concentrations associated with reductions in hepatic long-chain CoA and acetyl-CoA content without any changes in hepatic malonyl-CoA content (Extended Data Figure 3j–o). These data demonstrate a critical role for InsP3R-I in maintenance of euglycemia during starvation.
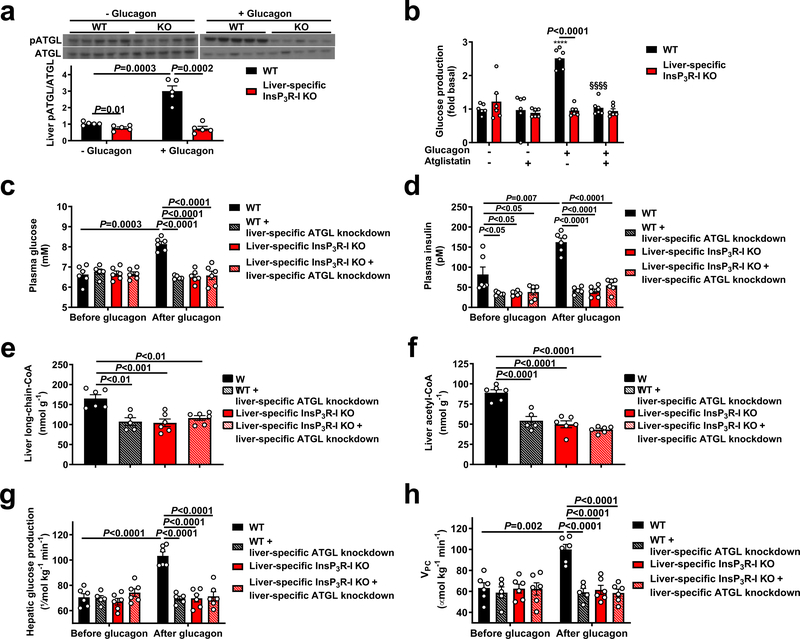
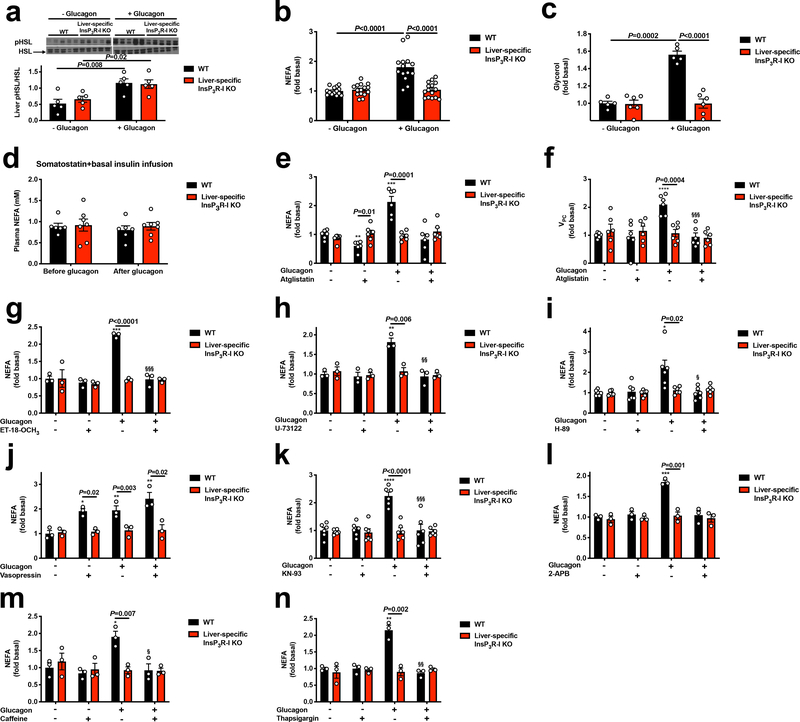
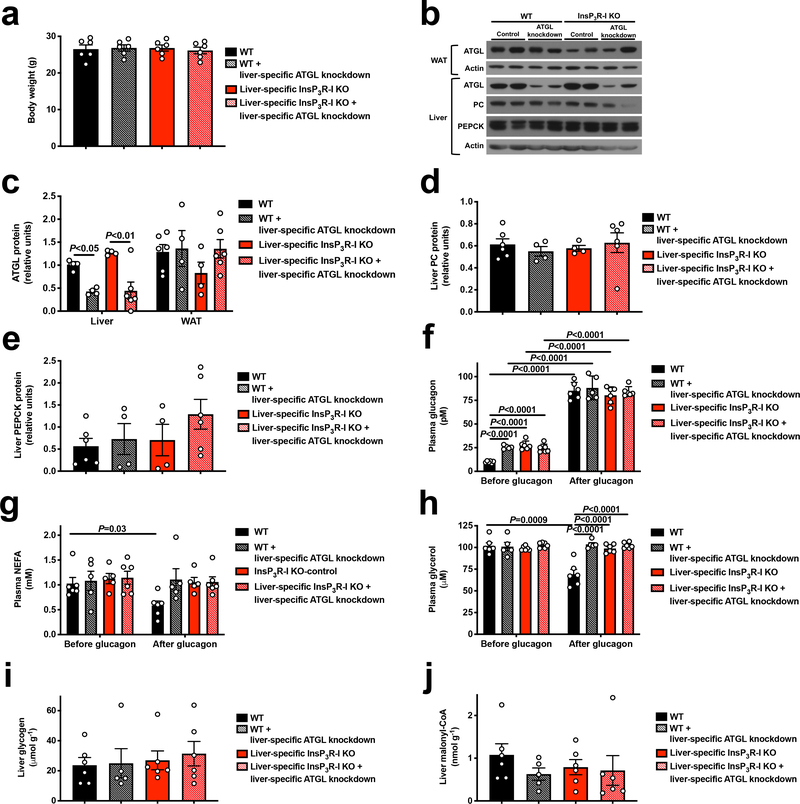
We next hypothesized that InsP3R-I stimulation of intrahepatic lipolysis may explain the observed increases in hepatic acetyl-CoA content and VPC flux following glucagon treatment. Consistent with this hypothesis, hepatic adipose triglyceride lipase (ATGL) S406 phosphorylation, which has been shown to regulate ATGL activity19, was increased three-fold by glucagon in WT but not KO mouse livers (Figure 2a). In contrast, hormone-sensitive lipase (HSL) phosphorylation was increased by glucagon in both genotypes, dissociating HSL activity from glucagon activation of HGP and VPC (Extended Data Figure 4a). In vitro studies revealed 60–100% increases in NEFA and glycerol production with glucagon treatment in WT but not InsP3R-I deficient hepatocytes (Extended Data Figure 4b–c). Plasma NEFA concentrations were unchanged by glucagon infusion in mice treated with somatostatin (Extended Data Figure 4d). These data suggest that, while glucagon may promote lipolysis when infused at markedly supraphysiologic doses20, under physiologic conditions (intact β-cell function, physiologic concentrations of glucagon), glucagon does not directly affect WAT lipolysis21–23. Confirming the requirement for glucagon-stimulated intrahepatic lipolysis to promote gluconeogenesis, glucagon had no effect in hepatocytes treated with atglistatin, a small molecule inhibitor of ATGL. Similarly, InsP3 agonism recapitulated the effect of glucagon to stimulate intrahepatic lipolysis, while inhibitors of InsP3, CAMKII/IV, PLC, PKA, and the SERCA pump inhibited the effects of glucagon to stimulate intrahepatic lipolysis and HGP/VPC (Figure 2b, Extended Data Figure 4e–n). To examine the impact of glucagon stimulation of intrahepatic lipolysis in vivo, we knocked down ATGL in a liver-specific manner in WT and InsP3R-I knockout littermates (Extended Data Figure 5a–c). ATGL knockdown abrogated the effects of glucagon to stimulate HGP, VPC flux, and long-chain- and acetyl-CoA content in WT mice (Figure 2c–h), demonstrating a critical role for stimulation of intrahepatic lipolysis in mediating the increases in each parameter resulting from glucagon infusion. These alterations in hepatic gluconeogenesis were again dissociated from changes in hepatic glycogen content or hepatic gluconeogenic protein expression. In addition, the alterations in hepatic gluconeogenesis rates were dissociated from WAT lipolysis and from hepatic malonyl-CoA content (Extended Data Figures 5d–j). Taken together these data identify a novel mechanism by which glucagon stimulates hepatic gluconeogenesis by promoting intrahepatic lipolysis through stimulation of ATGL in an InsP3R-I/Ca2+/calcium-dependent manner, thereby increasing hepatic acetyl-CoA and gluconeogenesis via allosteric activation of pyruvate carboxylase.
Figure 2.
Glucagon requires InsP3-mediated intrahepatic lipolysis to promote VPC and HGP. (a) ATGL S406 phosphorylation (n=5). Blots in Figures 1f and 2a, and Extended Data Figures 1b, 1d, 1f, 5f, 5g, and 7a were stripped and re-probed for all proteins of interest. (b) Glucose production in hepatocytes (n=6 mice per group) incubated in the ATGL inhibitor atglistatin and/or glucagon. ****P<0.0001 vs. WT-glucagon-atglistatin, §§§§ vs. WT+gluagon-atglistatin. (c)-(d) Plasma glucose and insulin concentrations in mice treated with an adeno-associated virus to knock down ATGL in a liver-specific manner. In panels (c)-(h), n=6 WT, 5 WT+ATGL knockdown, 6 KO±ATGL knockdown). (e)-(f) Liver long-chain- and acetyl-CoA concentrations following a 2 hr glucagon infusion. (g)-(h) Hepatic glucose production and hepatic VPC. In all panels, the mean±S.E.M. is shown. Groups were compared before and after glucagon (panels c and d) by the 2-tailed paired Student’s t-test, and groups in all other panels (as well as the four separate groups in panels c and d) were compared by the 2-tailed unpaired Student’s t-test.
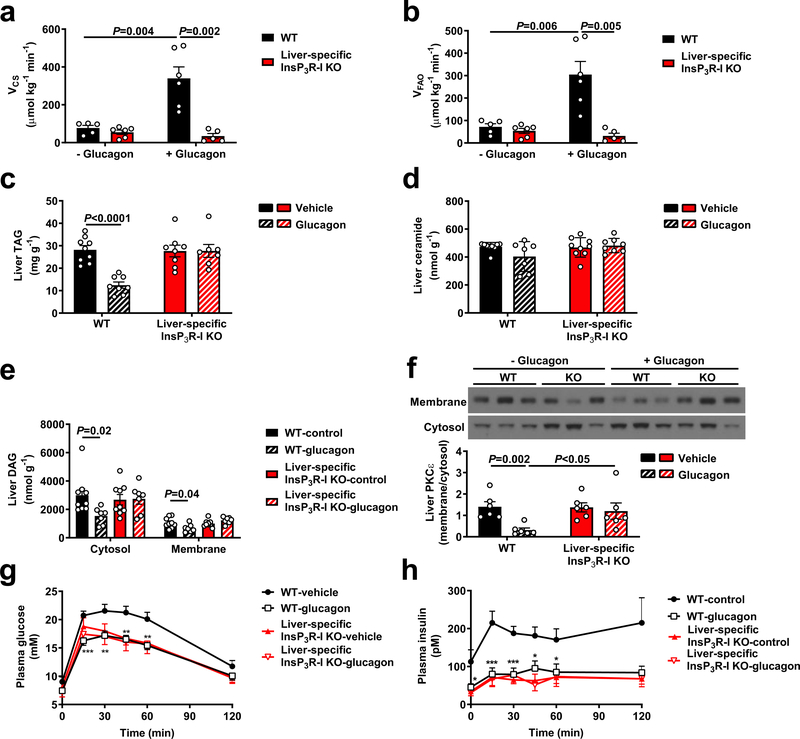
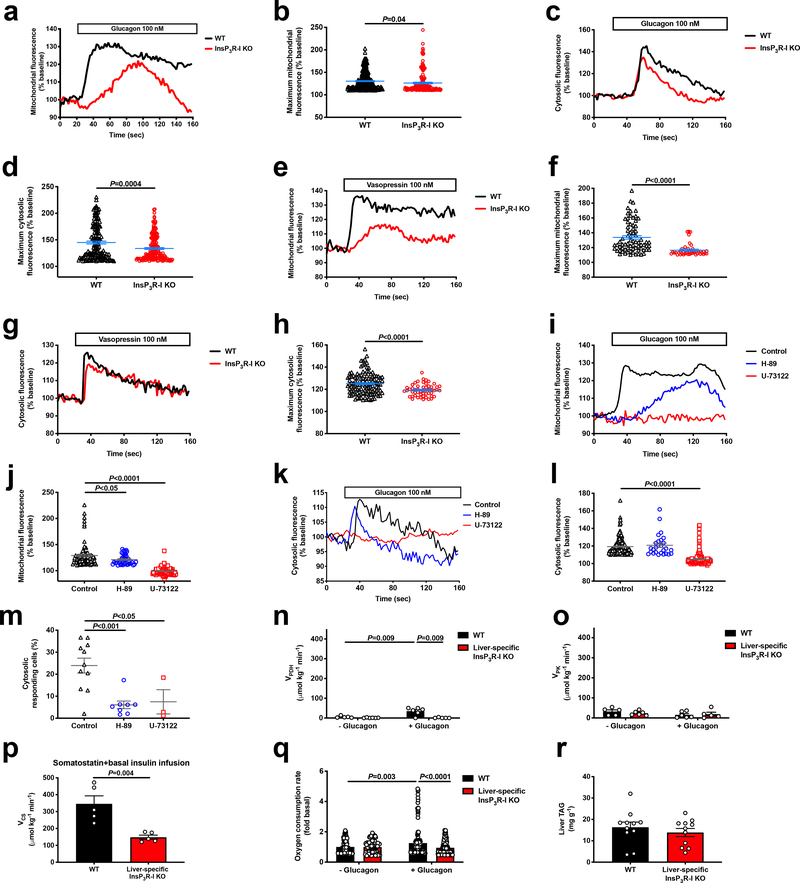
Next, we hypothesized that glucagon may also stimulate hepatic mitochondrial oxidation via InsP3R-I. Indeed, glucagon increased both mitochondrial and cytosolic calcium signaling in hepatocytes from WT mice, with InsP3R-I mice manifesting a reduced response to glucagon likely attributable to activity of the II and/or III isoforms of the InsP3 receptor. Vasopressin caused a similar increase in cytosolic and mitochondrial calcium signaling in WT but not InsP3R-I KO mice. However, incubation of WT hepatocytes with a PLC inhibitor completely abrogated the mitochondrial and cytosolic calcium responses to glucagon. PKA inhibition reduced the amplitude of the mitochondrial but not the cytosolic calcium response, but lowered the percentage of responding cells by 75% (Extended Data Figure 6a–m). Ex vivo Positional Isotopomer NMR Tracer Analysis (PINTA) revealed that glucagon-stimulated hepatic mitochondrial oxidation (VCS) in vivo, increasing VCS five-fold in WT mice, which could mostly be attributed to increased mitochondrial fat oxidation (Figure 3a–b). However, KO mice failed to increase hepatic mitochondrial oxidation in response to glucagon. Taken together these data suggest that glucagon stimulates hepatic mitochondrial oxidation through activation of InsP3R-I resulting in increased intra-mitochondrial calcium, which in turn stimulates mitochondrial dehydrogenases24. Consistent with this hypothesis, we observed a 7-fold increase in hepatic pyruvate dehydrogenase flux (VPDH) in WT but not KO mice infused with glucagon, without any difference in pyruvate kinase flux (VPK) (Extended Data Figure 6n–o). Glucagon stimulation of mitochondrial oxidation was not dependent on alterations in insulin: somatostatin-treated, basal insulin- and ~100 pM glucagon-infused WT mice exhibited similar increases in VCS which were not observed in KO littermates (Extended Data Figure 6p). In vitro studies confirmed an increase in oxygen consumption with glucagon stimulation in isolated hepatocytes from WT but not KO mice (Extended Data Figure 6q), demonstrating that glucagon mediates these effects in a cell-autonomous manner.
Figure 3.
Chronic increases in mitochondrial oxidation with a continuous 3.5 week glucagon infusion reverse of hepatic steatosis and improve glucose tolerance in an InsP3R-I-dependent manner. (a)-(b) Liver VCS and VFAO with acute glucagon infusion (n=5 WT-glucagon, 6 KO-glucagon, 6 WT+glucagon, 5 KO+glucagon). (c) Liver TAG concentrations in HFD mice chronically infused with glucagon (n=9 WT-glucagon, 8 WT+glucagon, 8 KO-glucagon, 7 KO+glucagon). (d) Liver ceramide (n=6). (e) Liver DAG (n=9 -glucagon, 7 +glucagon). (f) PKCε translocation (n=6). (g)-(h) Plasma glucose and insulin during a glucose tolerance test (n=10 WT-glucagon, 11 WT+glucagon, 8 KO-glucagon, 8 KO+glucagon). In all panels, the mean±S.E.M. is shown. Groups were compared using the 2-tailed unpaired Student’s t-test.
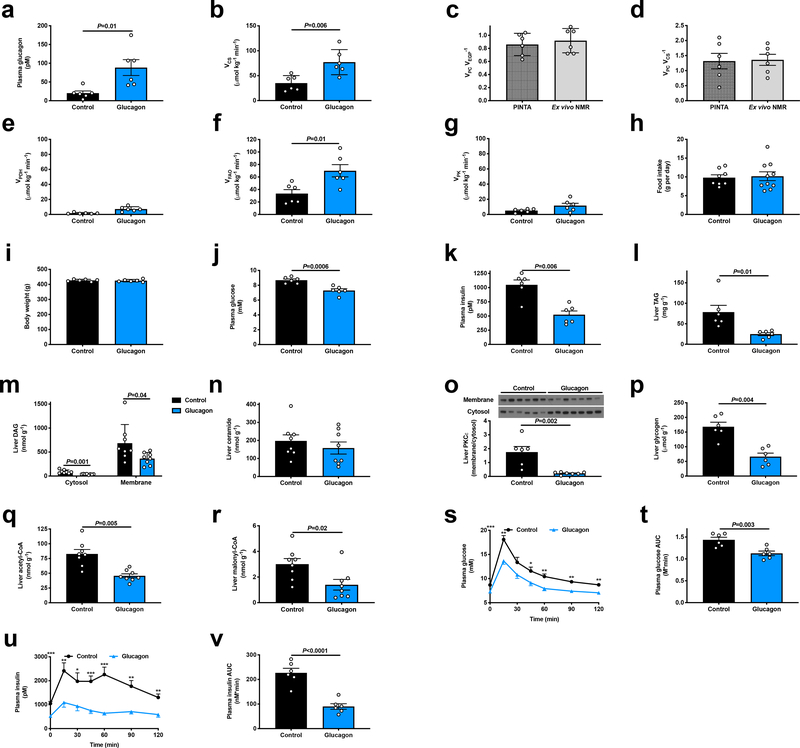
Surprisingly, liver triglyceride concentrations did not differ between chow-fed WT and KO mice (Extended Data Figure 6r), suggesting that physiologic glucagon may not promote sufficient mitochondrial fat oxidation in ad lib fed mice to alter hepatic triglyceride content. However, we hypothesized that chronic increases in hepatic mitochondrial oxidation induced by chronic glucagon treatment would reverse NAFLD and improve whole body insulin sensitivity. To that end, we performed chronic glucagon infusion studies in awake high fat fed (HFD) rats with diet-induced obesity, and found that after ten days of treatment, chronic glucagon infusion doubled rates of hepatic mitochondrial oxidation, which could be attributed to increased rates of hepatic fat oxidation (Extended Data Figure 7a–g). Two hours after withdrawal of glucagon, rats exhibited lower fasting plasma glucose and insulin concentrations associated with 50–90% reductions in hepatic triglyceride and diacylglycerol concentrations and marked reductions in protein kinase C-epsilon (PKCε) translocation despite similar food intake, body weight, and hepatic ceramide (Extended Data Figure 7h–o, Supplementary Table 3–4). Consistent with chronic increases in hepatic glycogenolysis, chronic glucagon infusion also resulted in reductions in liver glycogen content. In contrast to acute glucagon infusion, chronic glucagon infusion with withdrawal of glucagon treatment four hours before sacrifice lowered both hepatic acetyl- and malonyl-CoA content (Extended Data Figure 7p–r), with the reductions in malonyl-CoA potentially contributing to the observed reductions in hepatic lipid content due to suppression of hepatic lipogenesis25. Consistent with their lower hepatic lipid and acetyl-CoA content, chronic glucagon-infused rats manifested improved glucose tolerance and insulin sensitivity (Extended Data Figure 7s–v).
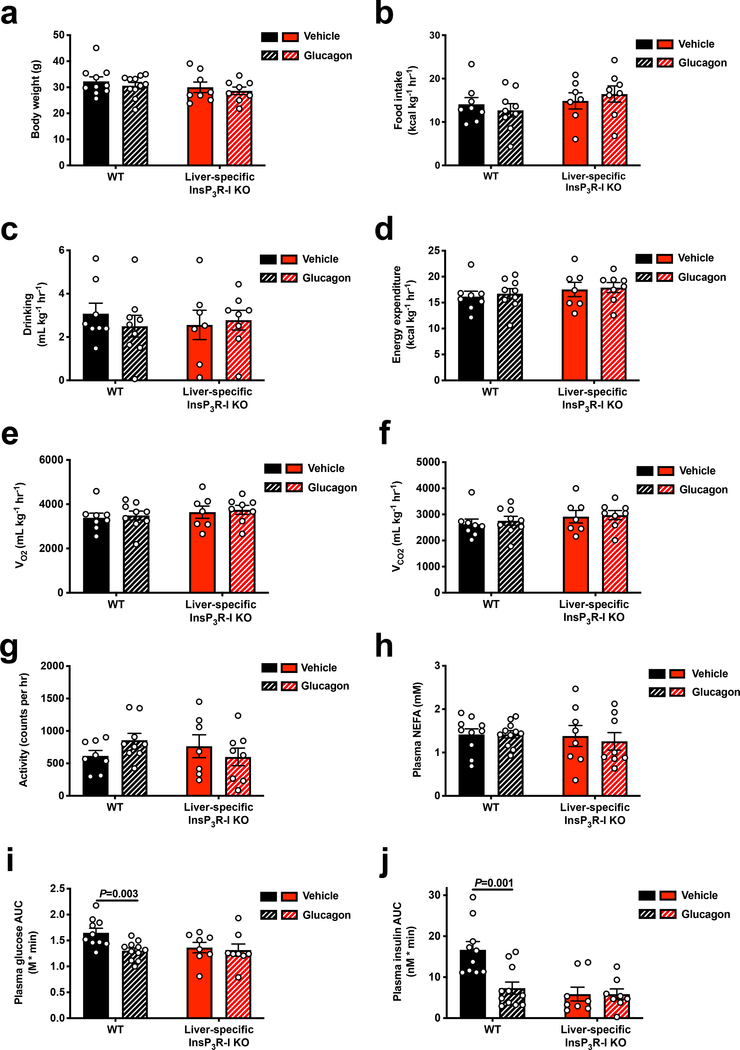
Finally, to determine whether InsP3R-I-dependent calcium signaling mediates the effect of chronic hyperglucagonemia to reverse NAFLD, we performed a four-week continuous infusion of glucagon in HFD WT and InsP3R-I KO mice. Despite unchanged body weight, food and water intake, and energetics, glucagon-treated WT mice exhibited 50–80% reductions in hepatic triglyceride/diacylglycerol – but not ceramide – content and PKCε translocation, resulting in a marked improvement in glucose tolerance, while each of these parameters was unchanged in KO mice (Figure 3a–h, Extended Data Figure 8a–j, Supplementary Table 5–6).
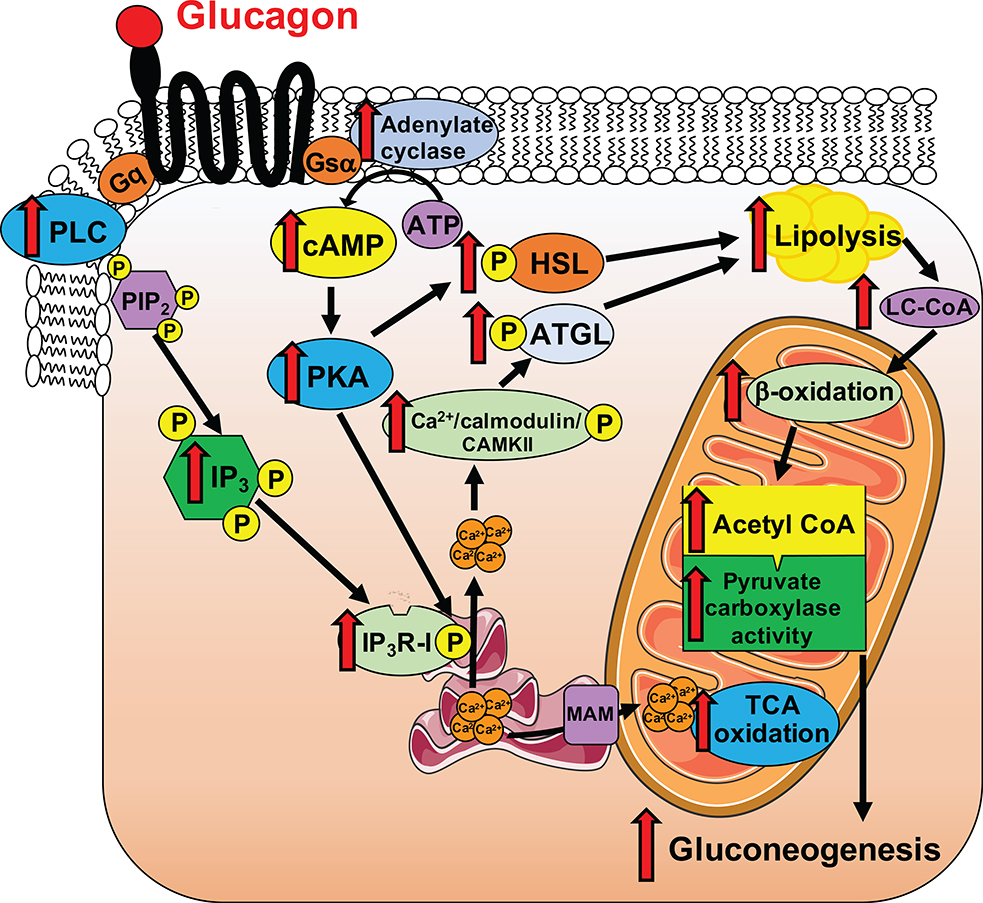
Collectively, these studies reveal that glucagon stimulates intrahepatic lipolysis through an InsP3R-I/CAMKII-dependent process, increasing hepatic acetyl-CoA content, which allosterically activates VPC flux18, and that this phenomenon explains its acute, transcription-independent effect to stimulate gluconeogenesis in vivo. In addition, glucagon stimulates hepatic mitochondrial oxidation through InsP3R-I-mediated calcium signaling, and this process can be exploited by reversing hepatic insulin resistance with short-term continuous glucagon treatment. Thus these data provide a transcription-independent alternative mechanism (Extended Data Figure 9) for glucagon action. Collectively these studies provide evidence in support of InsP3R-I as a potential target to treat NAFLD, NASH and T2D. Future clinical studies will be required to examine this possibility.
Online Methods
Animals
All protocols were approved by the Yale University Animal Care and Use Committee. Liver-specific InsP3R-I KO mice were generated as described16 and in all experiments, littermates were studied at 10–12 weeks of age. They were fed standard chow (Teklad #2018) and housed on a 12 hr light/dark cycle in the Yale Animal Resources Center. To knock down ATGL in a liver-specific manner, an adeno-associated virus targeting ATGL (Vector BioLabs, 1012 gc per mouse) was administered by retro-orbital injection four weeks prior to studies. Male mice were used for in vivo studies, while both sexes were used for in vitro studies, unless otherwise specified. One week prior to in vivo studies, mice underwent surgery under isoflurane anesthesia to place a catheter in the jugular vein. Post-surgical recovery was confirmed by regaining the pre-surgical body weight prior to any in vivo studies. They were fasted overnight, unless otherwise stated, prior to in vivo studies. In the acute glucagon infusion studies, mice were given an intravenous infusion of glucagon (5 ng kg−1 min−1) for two hours, with tissue and plasma samples obtained after two hours of infusion. Mice were euthanized using IV pentobarbital at the conclusion of the terminal study. In the somatostatin infusion study, a 90 min jugular venous infusion of somatostatin (4 μg/[kg-min], 1:1 mix of somatostatin-14 and −28 concurrently with [3-13C] lactate and [2H7] glucose, as described below, was administered for a total of 90 min. During the somatostatin infusion, mice were also infused with insulin (2 mU kg−1 min−1) and glucagon (6 ng kg−1 min). In the acute high-dose glucagon experiment, mice were injected with 600 μg/kg glucagon and sacrificed 20 min later after isoflurane anesthesia. Blood was collected by cardiac puncture and liver was excised and freeze-clamped.
Mice infused chronically with glucagon were fed a high fat diet (Research Diets D12492) for four weeks, after which they were implanted with an Alzet pump providing glucagon continuously (0.15 ng min−1) for another 3.5 weeks, during which time they were continued on a high fat diet. They underwent CLAMS metabolic cage analysis to assess energetics and food and water intake during the second week of glucagon infusion. After an overnight fast, 3 weeks after implantation of the glucagon pumps, mice underwent an intraperitoneal glucose tolerance test and were subsequently refed. 48 hr later, after a 6 hr fast, they were sacrificed under isoflurane anesthesia for measurement of hepatic lipid content as described below.
For the chronic glucagon infusion studies in rats, 300 g male Sprague-Dawley rats were obtained from Charles River Laboratories and fed a safflower oil-based high fat diet (HFD, 60% calories from fat, Dyets #112245) for 4 weeks. During week 3 of the diet, rats underwent surgery under isoflurane anesthesia to place catheters in the jugular vein and carotid artery, and recovery was confirmed by regaining the pre-surgical body weight prior to in vivo studies. After four weeks on HFD, rats were placed in a soft plastic harness to protect their catheters and infused continuously for 10 days with glucagon (5 ng kg−1 min−1), total volume 5 ml kg−1 day−1). The glucagon infusion was either continued throughout the terminal study (PINTA) or discontinued two hours before the start of the terminal study (GTT with hepatic lipid/acetyl-CoA/glycogen measurements), in separate groups of rats, as specified in the figure legends. Rats were fasted for 8 hr prior to sacrifice with IV pentobarbital.
In vivo studies
In all in vivo mouse studies, blood was collected from the tail vein, with the exception of portal vein glucagon measurements, in which a needle was inserted into the portal vein of anesthetized mice to collect blood. In the rat studies, blood was collected from the jugular venous catheter. In both species, samples were immediately centrifuged (12,000 rpm) to separate plasma from red blood cells. We employed PINTA analysis of hepatic mitochondrial fluxes in both rats and mice26. Briefly, mice were infused with a two- hour primed (5 min, 3X)-continuous infusion of [3–13C] lactate (40 μmol kg−1 min−1) and [1,2,3,4,5,6,6-2H7] glucose (0.1 mg kg−1 min−1). Rats were infused with lactate at the same rate, as well as [3–3H] glucose (0.1 μCi kg−1 min−1). At the conclusion of the study, animals were euthanized with IV pentobarbital.
In mice, hepatic glycogenolysis was assumed to be negligible due to their prolonged (16 hr) fasted state and their low hepatic glycogen content (Extended Data Figures 2a, 10d, and 14f). Total glucose turnover (i.e. hepatic glucose production) was measured by determining the specific activity of [3H] glucose in plasma using a scintillation counter, and the VPC/VHGP ratio was calculated using the equation , where G2 represents the [m+2] glucose enrichment corrected for any [m+2] glucose synthesized from 13C2-labeled trioses: , and XFE represents the fractional triose enrichment: , where G1 represents the measured [m+1] glucose and G2 as described above. To calculate absolute VPC flux, we multiplied the measured HGP by the ratio VPC/VHGP. The ratio of hepatic VPC/VCS flux was calculated as , and calculated absolute VCS by dividing VPC by VPC/VCS. The derivations of each equation are described in detail in our previous study26. We corrected for the possible contribution of [13C] bicarbonate to label the TCA cycle as we have described27.
We measured the ratio 28 and calculated absolute VPDH by multiplying this ratio by the measured VCS. Finally, the ratio of VPK – assuming minimal malic enzyme flux – to (VPC+VPDH) was calculated as 29. Absolute VPK fluxes were then determined by multiplying by the sum of VPC and VPDH. As we have described26, can be expanded to account for pyruvate recycling: . In this study we measured a maximum of 0.4, indicating that the maximal is 0.4. A at this maximal value would generate a 17% underestimation of . Ex vivo NMR analysis was used to confirm PINTA measurements of flux ratios as we have described26.
In rats, HGP was measured by measuring the plasma glucose [m+7] atom percent enrichment (APE) by gas chromatography/mass spectrometry (GC/MS) and using these data to calculate HGP according to the equation HGP = (Tracer APE/Plasma APE – 1) * infusion rate. All other flux ratios and absolute fluxes were measured using the equations given above.
In the glucose tolerance tests, rodents were injected with 1 g kg−1 50% dextrose (rats) or 10% dextrose (mice) intraperitoneally. Blood samples were taken through the venous catheter (rats) or by tail bleeding (mice) for measurement of plasma glucose and insulin concentrations as described below.
Biochemical analysis
Plasma glucose concentrations were measured using the YSI Glucose Analyzer. Plasma insulin was measured by ELISA (Mercodia), while glucagon was measured in samples immediately spiked with aprotinin (0.5 mg μL−1) whole blood by RIA by the Yale Diabetes Research Core. Plasma NEFA concentrations were measured using the Wako NEFA assay, while plasma glycerol30 and plasma and liver amino acid concentrations17 were measured by GC/MS. Liver acetyl- and malonyl-CoA18 (standard curve R2=0.999 and 0.999), long-chain CoA31, DAG31, and ceramide31 concentrations were measured by LC-MS/MS, hepatic glycogen content following amyloglucosidase digestion32, and TAG concentrations enzymatically33. cAMP concentrations were measured using the Enzo Life Sciences Direct cAMP ELISA. Protein concentrations were measured by Western blot, using antibodies from Santa Cruz (PC, PEPCK, CAMKII), Cell Signaling (ATGL, pCAMKIV, CAMKIV, pCRTC2, CRTC2, pACC, ACC, pAMPK, AMPK, pHSL, HSL, GAPDH, and β-actin), Novus Biologicals (pCAMKII), Abcam (pATGL), LSBio (pInsP3R-I), and BD Transduction Laboratories (InsP3R-III and PKCε). The antibody to pATGL was kindly provided by Dr. Hei Sook Sul, while the antibody to total InsP3R-I was custom-made using an epitope against the last 18 amino acids of InsP3R-I. The antibody to InsP3R-II was generously donated by the Wojcikiewicz Lab (SUNY Upstate Medical University). The antibody to CRTC2 as well as hepatocyte control samples (WT±glucagon and CRTC2 KO) for antibody validation were a kind gift of Dr. Marc Montminy. To measure protein expression in isolated hepatocytes, a Mitochondria Isolation Kit (Thermo Scientific) was used to separate cells into cytoplasmic (c.) and crude mitochondrial (c.m.) fractions, the latter containing both mitochondria and closely-apposed mitochondria-associated proteins. The final spin was conducted at 1000 rpm for 15 min at 4°C to obtain a cleaner mitochondrial fraction with reduced lysosomal contamination. Mitochondria were lysed in 2% CHAPS in tris-buffered saline (TBS), and the protein concentration was measured with the bicinchoninic acid assay (Thermo Scientific). Samples for all Western blot analyses were loaded on 4 to 12% gradient gels (NuPage gels, Life Technologies) and run with MOPS buffer. Protein was transferred to polyvinylidene difluoride membranes by wet transfer. After blocking with 5% milk in TBS with 0.1% Tween 20, primary antibodies were applied overnight. Gluconeogenic gene mRNA expression was measured by qPCR34 using primers with the following sequences:
β-actin: F, CCAGATCATGTTTGAGACCTTC, R, CATGAGGTAGTCTGTCAGGTCC
PEPCK: F, CAGGAAGTGAGGAAGTTTGTGG, R, ATGACACCCTCCTCCTGCAT
G6Pase: F, GAAGGCCAAGAGATGGTGTGA, R, TGCAGCTCTTGCGGTACATG
PC: F, AGATGCACTTCCATCCCAAG, R, CCTTGGTCACGTGAACCTTT
In vitro studies
Primary hepatocytes were isolated by the Yale Liver Center from wild-type and InsP3R-I KO mice and plated on glass coverslips coated with Rat Collagen Type I. Cells were loaded with the cytosolic Ca2+ indicator dye, Fluo-4 AM (Thermo Fisher Scientific), or the mitochondrial matrix-targeted Ca2+ indicator, Rhod-2 AM (Thermo Fisher Scientific) for 30 minutes at 37oC. Ca2+ imaging experiments were performed in 4-(2-hydroxyethyl)-1-piperazine ethanesulfonic acid (HEPES)-buffered balanced salt solution (25 mM HEPES, 121 mM NaCl, 4.7 mM KCl, 1.2 mM MgSO4, 1.2 mM KPO4, 5 mM NaHCO3, 2.0 mM CaCl2, 10 mM glucose, pH 7.4) with or without the PKA inhibitor H-89 (25 μM) or the PLC inhibitor U73122 (10 μM) two to four hr following initial plating. Coverslips were transferred to a custom-built perfusion chamber on the stage of a Zeiss LSM 710 confocal microscope (Carl Zeiss Microscopy, Thornwood, NY). Cytosolic and mitochondrial signals were monitored in Fluo-4 AM and Rhod-2-loaded cells, respectively using stimulation with 100 nM glucagon (Sigma-Aldrich) or 100 nM vasopressin (Sigma-Aldrich) with a 20x objective lens. Changes in fluorescence were normalized by the initial fluorescence before addition of agonist and were expressed as F/F0.
For in vitro glucose production and lipolysis studies, primary mouse hepatocytes were isolated by the Yale Liver Center. Following removal of cell debris by Percoll density gradient centrifugation, cells were plated on 6-well collagen-I coated dishes (4.0×10⁵ cells/well) in 2 ml recovery media (DMEM high glucose containing 10% FBS, 2% penicillin-streptomycin, 100 nM dexamethasone, 1 nM insulin, and 10 mM HEPES). After incubation for 6 hr at 37°C and 5% CO2, the attached cells were washed once in 1x PBS and then incubated overnight in 2 ml low glucose culture media (DMEM low glucose supplemented with 10% FBS, 2% penicillin-streptomycin and 10 mM HEPES for glucose production studies) or Serum Free Low Glucose Culture Media (DMEM low glucose supplemented with 0.5% fatty acid free BSA, 2% penicillin-streptomycin and 10 mM HEPES for lipolysis assays). The next morning, cells were washed twice in 1x PBS and culture media replaced with 2 mL glucose production media (DMEM base media supplemented with 0.5% fatty acid free BSA, 20 mM sodium lactate, 2 mM sodium pyruvate and 10 mM HEPES, pH 7.4) or serum-free low glucose culture media (lipolysis assay) in the presence of 100 nM glucagon or vehicle control. After incubation for 8 hr at 37°C and 5% CO2, cell culture media was collected for analysis of glucose, NEFA, and glycerol concentrations as described above. VPC was determined by measuring VPC/VEGP by PINTA as described above using 300 μL of the collected media and multiplying this ratio by the measured glucose production rate. In a subset of studies, cells were incubated for 8 hr during the glucose production assay in media containing one of the following agents (all dissolved in 0.5% DMSO), or 0.5% DMSO vehicle: 20 μM ET-18-OCH3 (Santa Cruz), 100 μM U-73122 (Sigma), 30 nM thapsigargin (Sigma), 100 nM vasopressin (Sigma), 50 μM 2-APB (R&D Systems), 70 μM caffeine (Sigma), 1 mM malic enzyme inhibitor hydroxymalonate (Sigma). To inhibit PKA, hepatocytes were incubated in H-89 dichloroacetate hydrate (Sigma, 25 μM) dissolved in media, or media lacking H-89 as a control. In the insulin treatment studies, hepatocytes were incubated in 1 nM insulin with 5% BSA and glucose production media for the duration of the glucose production assay. In the in vitro atglistatin study, hepatocytes were incubated in 10 μM atglistatin in 0.1% EtOH, or 0.1% EtOH vehicle. All values were normalized to total protein content determined from whole-cell lysates by a BCA protein assay (Thermo Fisher Scientific) according to the manufacturer’s instructions and expressed as fold change versus vehicle-treated cells.
To assess oxygen consumption, primary mouse hepatocytes were isolated as described above and plated on collagen-I coated XF24 V7 cell culture plates (1.2×10⁴ cells per well) in 2 mL recovery media as previously described35. Following incubation for 6 hr at 37°C and 5% CO2, the cells were washed twice with 1 ml low glucose culture media and incubated overnight in 250 μl low glucose culture media at 37°C and 5% CO2. The following morning, cells were washed with XF24 assay media (DMEM base media containing 1.0 mM pyruvate, 2 mM glutamine and 5.5 mM glucose, pH 7.4). 500 μL of XF24 assay media was added to each well and plates were equilibrated at 37°C for 1 h. Four measurements of basal oxygen consumption rates (picomoles per minute) were recorded on a Seahorse Bioscience XFe 24 Analyzer (Seahorse Biosciences) using an instrument protocol of 3-minute mix, 2-minute wait, and 3-minute measure. After baseline measurements, glucagon (or vehicle) was injected at a final concentration of 100 nM and oxygen consumption was recorded using the same instrument protocol. Ten measurements were taken following injection and the average of eight measurements were used for subsequent analyses. Oxygen consumption rates were normalized to total protein content and expressed as fold change compared to vehicle-treated cells. Experiments were repeated three times using 3–4 mice per genotype.
Statistics and reproducibility
Group sizes of 6–10 per group were chosen to detect moderate to large (>40%) differences with ~40% standard deviations. Comparisons were performed using GraphPad Prism 7. Each in vivo experiment was performed with the number of replicates specified in the figure legends. All data obtained are shown, with the exception of several western blots in which case one representative image is shown, but all data are shown in the quantification. The two-tailed paired (when comparing the same animals under multiple conditions) or unpaired Student’s t-test (when comparing different animals) was used to compare data sets. P-values less than 0.05 were considered significant. Comparisons were performed using GraphPad Prism 7.
Extended Data
Extended Data Figure 1.
Glucagon acutely stimulates hepatic gluconeogenesis by increasing hepatic acetyl-CoA content and pyruvate carboxylase flux. (a) Body weight (n=11). (b) Liver InsP3R-I protein expression (n=5). Blots in Figures 1f and 2a, and Extended Data Figures 1b, 1d, 1f, 3f, 3g, and 4a were stripped and re-probed for all proteins of interest. *P<0.05 vs. InsP3R-I KO mice not treated with glucagon. (c) InsP3R protein expression in cytosolic (“c.”) and crude mitochondrial (“c.m.”) fractions from primary hepatocytes, in which VDAC was examined as a marker for mitochondrial protein content, and calreticulin as a marker for non-mitochondria-associated membrane protein. On the right, Liver InsP3R-I phosphorylation in mice infused with glucagon (n=5). The blot for total InsP3R-I is duplicated from Extended Data Figure 1b. (d) Liver CRTC2 phosphorylation (n=5). The CRTC2 phosphorylation gel was stripped and re-probed to assess HSP90 (loading control). (e) Liver CAMKIV phosphorylation ± a 2 hr acute infusion of glucagon (n=5). (f) Liver glycogen content (n=5 WT–glucagon, otherwise n=6). No differences were observed using one-way ANOVA with Bonferroni’s multiple comparisons test. (g)-(i) Plasma [m+1], [m+2], and [m+7] plasma glucose enrichment during a 120 min infusion of [3-13C] lactate and [2H7] glucose (n=5 WT and 6 KO, with the exception of panel (i), in which n=4 WT+glucagon at 100 and 110 min). (j)-(k) Plasma total amino acid and alanine concentrations (n=5 WT and 6 KO). In panels j-k, groups were compared before and after glucagon by the 2-tailed paired Student’s t-test, and genotypes were compared by the 2-tailed unpaired Student’s t-test. (l)-(m) Liver total amino acid and alanine concentrations (n=5). (n)-(o) In vitro glucose production (n=9) and VPC flux (n=4) in isolated hepatocytes. (p)-(q) In vitro glucose production (n=9) and VPC flux (n=4) in isolated hepatocytes with and without 150 pM insulin. Basal data (no insulin) are duplicated from panels n and o. (r)-(s) In vitro glucose production (n=8) and VPC flux (n=3) in isolated hepatocytes with and without a malic enzyme inhibitor. **P<0.01, ****P<0.0001 vs. WT-glucagon-ME inhibitor. (t)-(v) Plasma c-peptide, glucagon, and glucose concentrations in mice (n=6 WT and 7 KO) treated with somatostatin, basal insulin, and glucagon. Comparisons before and after glucagon used the 2-tailed paired Student’s t-test. (w)-(x) Endogenous glucose production and VPC (n=6 WT and 7 KO). In all panels, unless otherwise stated, comparisons with and without glucagon, insulin, or malic enzyme inhibitor, and WT vs. KO were performed using the 2-tailed unpaired Student’s t-test. In all panels where comparisons were performed (i.e. all panels with the exception of g-i), if no p-value is shown, groups were not significantly different. In all panels, the mean±S.E.M. are shown.
Extended Data Figure 2.
Glucagon-stimulated glucose production requires activation of the PLC and PKA pathways, converging to activate InsP3 signaling. In vitro glucose production and VPC flux in isolated hepatocytes with and without ET-18-OCH3 (n=3), U-73122 (n=3, with the exception of KO-glucagon-U-73122, in which n=2), H-89 (n=6), vasopressin (n=3), 2-APB (n=3), caffeine (n=3), KN-93 (n=6), and thapsigargin (n=3). In all panels, *P<0.05, **P<0.01, ***P<0.001 vs. WT-glucagon-drug; §P<0.05, §§P<0.01, §§§P<0.001 vs. WT +glucagon -drug by the 2-tailed unpaired Student’s t-test. If no statistical comparison is denoted, the groups were not significantly different. The mean±S.E.M. is shown.
Extended Data Figure 3.
Glucagon stimulates hepatic glucose production independently of transcriptional regulation and plays a key role in maintenance of blood glucose during a prolonged fast. (a)-(c) Liver PC, PEPCK, and G6Pase mRNA expression (n=5). (d)-(e) Liver PC and PEPCK protein (n=5 with the exception of KO+glucagon, where n=6). (f)-(g) Liver pACC/ACC and pAMPK/AMPK (n=5). Blots in Figures 1f and 2a, and Extended Data Figures 1b, 1d, 1f, 3f, 3g, and 4a were stripped and re-probed for all proteins of interest. (h) Plasma NEFA (n=5, with the exception of KO+glucagon, where n=6). (i) Liver malonyl-CoA (n=6). (j)-(l) Plasma glucose, insulin, and glucagon concentrations in 48 hr fasted mice (in all panels j-o, n=5). (m)-(o) Liver long-chain-, acetyl-, and malonyl-CoA content. In all panels, genotypes and groups +/− glucagon were compared using the 2-tailed unpaired Student’s t-test. If no statistical comparison is denoted, the groups were not significantly different. In all panels, the mean±S.E.M.
Extended Data Figure 4.
Glucagon acutely stimulates gluconeogenesis by activating intrahepatic, but not white adipose tissue, lipolysis. (a) Liver HSL phosphorylation (n=5). Blots in Figures 1f and 2a, and Extended Data Figures 1b, 1d, 1f, 3f, 3g, and 4a were stripped and re-probed for all proteins of interest. In panels a-c, groups were compared using the 2-tailed unpaired Student’s t-test. (b)-(c) In vitro NEFA and glycerol production from isolated hepatocytes (n=14 WT and 15 KO). (d) Plasma NEFA concentrations in mice treated with somatostatin, replacement basal insulin, and glucagon (n=5 WT and 6 KO). No significant differences were observed between genotypes using the 2-tailed unpaired Student t-test, or before vs. after glucagon using the 2-tailed paired Student’s t-test. (e)-(f) NEFA production and VPC in isolated hepatocytes incubated in the ATGL inhibitor atglistatin (n=6). (g)-(n) NEFA production from isolated hepatocytes treated with ET-18-OCH3 (n=3), U-73122 (n=3), H-89 (n=6), vasopressin (n=3), KN-93 (n=6), 2-APB (n=3), caffeine (n=3), and thapsigargin (n=3). In all panels, *P<0.05, **P<0.01, ***P<0.001 versus the same genotype -glucagon -drug; §P<0.05, §§ P<0.01, §§§ P<0.001 versus the same genotype +glucagon -drug by the 2-tailed unpaired Student’s t-test. If no statistical comparison is denoted, the groups were not significantly different. Error bars represent the S.E.M.
Extended Data Figure 5.
Glucagon requires InsP3-mediated intrahepatic lipolysis to promote VPC and hepatic gluconeogenesis. (a) Body weight in mice treated with an adeno-associated virus to knock down liver ATGL (n=6). (b) Representative western blots. Blots from the same tissue (liver or WAT) were stripped and reprobed for all proteins shown. (c) WAT and liver ATGL protein expression (n=4, with the exception of KO+ATGL knockdown, in which n=6). (d)-(e) Hepatic PC and PEPCK protein expression (n=6 WT and KO+ATGL knockdown, in other groups, n=4). (f)-(h) Plasma glucagon, NEFA and glycerol concentrations in mice treated with an adeno-associated virus to knock down ATGL in a liver-specific manner (n=6, with the exception of WT+ATGL knockdown and KO, in which n=5). Groups were compared before and after glucagon by the 2-tailed unpaired Student’s t-test. (i)-(j) Liver glycogen and malonyl-CoA content (n=6 other than WT+ATGL knockdown, in which n=5). All comparisons were performed using the 2-tailed unpaired Student’s t-test, unless otherwise stated. If no statistical comparison is denoted, the groups were not significantly different. Error bars represent the S.E.M.
Extended Data Figure 6.
Glucagon stimulates mitochondrial oxidation through hepatocellular calcium signaling. (a) Representative mitochondrial response to glucagon, which was added where denoted by the “glucagon” bar. (b) Maximum mitochondrial response to glucagon (n=324 WT and 167 KO). Groups in panels b, d, f, and h were compared by the 2-tailed unpaired Student’s t-test. (c) Representative cytosolic response to glucagon. (d) Maximum cytosolic response to glucagon (n=146 WT and 175 KO). (e) Representative mitochondrial response to the InsP3R agonist vasopressin. (f) Amplitude of the cytosolic response to vasopressin (n=73 WT and 42 KO). (g) Representative cytosolic response to vasopressin. (h) Amplitude of the cytosolic response to vasopressin (n=119 WT and 53 KO). (i) Representative mitochondrial responses to glucagon (added where denoted by the bar) in WT hepatocytes incubated in the PKA inhibitor H-89 or the PLC inhibitor U-73122. (j) Amplitude of the mitochondrial response (n=79 control, 39 H-89, and 127 U-73122). Groups were compared to the control in panels j and l, and m using the 2-tailed unpaired Student’s t-test. (k) Representative cytosolic responses to glucagon±H-89 or U-73122. (l) Amplitude of the cytosolic response (n=182 control, 27 H-89, and 187 U-73122). (m) Percentage of cells with a cytosolic response (>110% baseline) to glucagon±H-89 or U-73122 (n=11 control, 8 H-89, and 3 U-73122). (n)-(o) Hepatic PDH and PK flux in vivo (n=5 WT-glucagon, 6 WT+glucagon, 6 KO-glucagon, 5 KO+glucagon). In panels n-o, groups were compared (with vs. without glucagon, and WT vs. KO) using the 2-tailed unpaired Student’s t-test. (p) Liver VCS in mice infused with somatostatin, basal insulin, and glucagon (n=5). (q) In vitro oxygen consumption in isolated hepatocytes incubated±100 nM glucagon (n=113 WT-glucagon, 144 KO-glucagon, 149 WT+glucagon, 210 KO+glucagon). (r) Liver triglyceride content (without glucagon infusion) (n=11). In all panels, if no statistical comparison is denoted, the groups were not significantly different. Error bars represent the S.E.M.
Extended Data Figure 7.
Chronic increases in mitochondrial oxidation with a 10-day glucagon infusion lead to reversal of NAFLD and improvements in glucose tolerance. (a) Plasma glucagon concentrations on the last day of infusion. In all panels in this figure, n=6. (b) Hepatic VCS flux. In panels (b)-(g), measurements were performed while the glucagon infusion continued. (c)-(d) VPC VEGP−1 and VPC VCS−1 ratios. (e)-(g) Hepatic VPDH, VFAO, and VPK rates. (h) Food intake during the glucagon infusion, determined twice during the 10 day infusion (days 4 and 9) by weighing the food in the cage; the data points are the averages of the two food intake measurements for each animal. (i) Body weight after 10 days of glucagon or saline infusion. (j)-(k) 6 hr fasted plasma glucose and insulin concentrations measured two hours after cessation of the glucagon infusion. (l)-(n) Liver TAG (n=6), DAG (n=8), and ceramide (n=8) concentrations. (o) Hepatic PKCε translocation (n=6 control and 7 glucagon). (p)-(r) Liver glycogen (n=6), acetyl-CoA (n=8), and malonyl-CoA content (n=8). (s)-(t) Plasma glucose concentrations and area under the curve during an intraperitoneal glucose tolerance test which began 2 hrs after completing a 10 day continuous infusion of glucagon or saline (n=6). In panels s and u, *P<0.05, **P<0.01, ***P<0.001. Data are the mean±S.E.M. (u)-(v) Plasma insulin and insulin area under the curve during the GTT. In all panels, error bars represent the S.E.M, and groups were compared using the 2-tailed unpaired Student’s t-test. If no statistical comparison is denoted, the groups are not significantly different.
Extended Data Figure 8.
Chronic glucagon treatment reverses NAFLD and glucose intolerance in WT but not InsP3R-I KO mice. (a) Body weight (n=10 WT-glucagon, 11 WT+glucagon, 8 KO-glucagon, and 8 KO+glucagon). (b)-(c) Food and water intake. In panels (b)-(g), n=8 WT-glucagon, 9 WT+glucagon, 7 KO-glucagon, 8 KO+glucagon. (d) Energy expenditure. (e)-(f) Oxygen consumption and carbon dioxide production. (g) Activity. (h) Plasma NEFA. In panels (h)-(j), n=10 WT-glucagon, 11 WT+glucagon, 8 KO-glucagon, 8 KO+glucagon. (i)-(j) Glucose and insulin area under the curve during an intraperitoneal glucose tolerance test. In all panels, the mean±S.E.M. is shown. Statistical comparisons were performed using the 2-tailed unpaired Student’s t-test. If no statistical comparison is denoted, the groups were not significantly different.
Supplementary Material
Acknowledgments
The authors thank Drs. Marc Montminy, Tim Sonntag, and Young-Sil Yoon for kindly providing the CRTC2 antibody and control samples and for their advice on the interpretation of the CRTC2 blots, Dr. Hei Sook Sui for generously providing the pATGL antibody, Dr. Daniel Vatner for his advice on these studies and Xiaoxian Ma, Jianying Dong, Wanling Zhu, Mario Kahn, Kathy Harry, and Maria Batsu for their expert technical assistance. These studies were funded by grants from the United States Public Health Service (R01 DK-113984, P30 DK-059635, P30 DK034989, T32 DK-101019, K99 CA-215315, R01 NS-087568, UL1TR000142, T32 DK-007058, F32 DK-114954). The content is solely the responsibility of the authors and does not necessarily represent the official views of the NIH.
Footnotes
The authors declare no competing interests.
Data availability
All data generated and analyzed in this study are available in this published article and its supplementary information files, which include a table containing all raw data.
Supplementary information
Supplementary Information is linked to the online version of the paper at www.nature.com/nature.
References
- 1.Unger RH Glucoregulatory hormones in health and disease. A teleologic model. Diabetes 15, 500–506, doi: 10.2337/diab.15.7.500 (1966). [DOI] [PubMed] [Google Scholar]
- 2.Unger RH Pancreatic glucagon in health and disease. Adv Intern Med 17, 265–288 (1971). [PubMed] [Google Scholar]
- 3.Muller TD, Finan B, Clemmensen C, DiMarchi RD & Tschop MH The New Biology and Pharmacology of Glucagon. Physiol Rev 97, 721–766, doi: 10.1152/physrev.00025.2016 (2017). [DOI] [PubMed] [Google Scholar]
- 4.Brand CL et al. Immunoneutralization of endogenous glucagon with monoclonal glucagon antibody normalizes hyperglycaemia in moderately streptozotocin-diabetic rats. Diabetologia 37, 985–993, doi: 10.1007/bf00400461 (1994). [DOI] [PubMed] [Google Scholar]
- 5.Sorensen H et al. Immunoneutralization of endogenous glucagon reduces hepatic glucose output and improves long-term glycemic control in diabetic ob/ob mice. Diabetes 55, 2843–2848, doi: 10.2337/db06-0222 (2006). [DOI] [PubMed] [Google Scholar]
- 6.Okamoto H et al. Glucagon receptor inhibition normalizes blood glucose in severe insulin-resistant mice. Proc Natl Acad Sci U S A 114, 2753–2758, doi: 10.1073/pnas.1621069114 (2017). [DOI] [PMC free article] [PubMed] [Google Scholar]
- 7.Kazda CM et al. Evaluation of Efficacy and Safety of the Glucagon Receptor Antagonist LY2409021 in Patients With Type 2 Diabetes: 12- and 24-Week Phase 2 Studies. Diabetes Care 39, 1241–1249, doi: 10.2337/dc15-1643 (2016). [DOI] [PubMed] [Google Scholar]
- 8.Guzman CB et al. Treatment with LY2409021, a glucagon receptor antagonist, increases liver fat in patients with type 2 diabetes. Diabetes Obes Metab 19, 1521–1528, doi: 10.1111/dom.12958 (2017). [DOI] [PubMed] [Google Scholar]
- 9.Kazda CM et al. Treatment with the glucagon receptor antagonist LY2409021 increases ambulatory blood pressure in patients with type 2 diabetes. Diabetes Obes Metab 19, 1071–1077, doi: 10.1111/dom.12904 (2017). [DOI] [PubMed] [Google Scholar]
- 10.Liang Y et al. Reduction in glucagon receptor expression by an antisense oligonucleotide ameliorates diabetic syndrome in db/db mice. Diabetes 53, 410–417, doi: 10.2337/diabetes.53.2.410 (2004). [DOI] [PubMed] [Google Scholar]
- 11.Sloop KW et al. Hepatic and glucagon-like peptide-1-mediated reversal of diabetes by glucagon receptor antisense oligonucleotide inhibitors. J Clin Invest 113, 1571–1581, doi: 10.1172/JCI20911 (2004). [DOI] [PMC free article] [PubMed] [Google Scholar]
- 12.Henderson SJ et al. Robust anti-obesity and metabolic effects of a dual GLP-1/glucagon receptor peptide agonist in rodents and non-human primates. Diabetes Obes Metab 18, 1176–1190, doi: 10.1111/dom.12735 (2016). [DOI] [PMC free article] [PubMed] [Google Scholar]
- 13.Ozcan L et al. Calcium signaling through CaMKII regulates hepatic glucose production in fasting and obesity. Cell Metab 15, 739–751, doi: 10.1016/j.cmet.2012.03.002 (2012). [DOI] [PMC free article] [PubMed] [Google Scholar]
- 14.Wang Y et al. Inositol-1,4,5-trisphosphate receptor regulates hepatic gluconeogenesis in fasting and diabetes. Nature 485, 128–132, doi: 10.1038/nature10988 (2012). [DOI] [PMC free article] [PubMed] [Google Scholar]
- 15.Ozcan L et al. Activation of calcium/calmodulin-dependent protein kinase II in obesity mediates suppression of hepatic insulin signaling. Cell Metab 18, 803–815, doi: 10.1016/j.cmet.2013.10.011 (2013). [DOI] [PMC free article] [PubMed] [Google Scholar]
- 16.Feriod CN et al. Hepatic Inositol 1,4,5 Trisphosphate Receptor Type 1 Mediates Fatty Liver. Hepatol Commun 1, 23–35, doi: 10.1002/hep4.1012 (2017). [DOI] [PMC free article] [PubMed] [Google Scholar]
- 17.Perry RJ et al. Leptin Mediates a Glucose-Fatty Acid Cycle to Maintain Glucose Homeostasis in Starvation. Cell 172, 234–248 e217, doi: 10.1016/j.cell.2017.12.001 (2018). [DOI] [PMC free article] [PubMed] [Google Scholar]
- 18.Perry RJ et al. Hepatic acetyl CoA links adipose tissue inflammation to hepatic insulin resistance and type 2 diabetes. Cell 160, 745–758, doi: 10.1016/j.cell.2015.01.012 (2015). [DOI] [PMC free article] [PubMed] [Google Scholar]
- 19.Pagnon J et al. Identification and functional characterization of protein kinase A phosphorylation sites in the major lipolytic protein, adipose triglyceride lipase. Endocrinology 153, 4278–4289, doi: 10.1210/en.2012-1127 (2012). [DOI] [PubMed] [Google Scholar]
- 20.Liljenquist JE et al. Effects of glucagon on lipolysis and ketogenesis in normal and diabetic men. J Clin Invest 53, 190–197, doi: 10.1172/JCI107537 (1974). [DOI] [PMC free article] [PubMed] [Google Scholar]
- 21.Gravholt CH, Moller N, Jensen MD, Christiansen JS & Schmitz O Physiological levels of glucagon do not influence lipolysis in abdominal adipose tissue as assessed by microdialysis. J Clin Endocrinol Metab 86, 2085–2089, doi: 10.1210/jcem.86.5.7460 (2001). [DOI] [PubMed] [Google Scholar]
- 22.Wu MS et al. Does glucagon increase plasma free fatty acid concentration in humans with normal glucose tolerance? J Clin Endocrinol Metab 70, 410–416, doi: 10.1210/jcem-70-2-410 (1990). [DOI] [PubMed] [Google Scholar]
- 23.Jensen MD, Heiling VJ & Miles JM Effects of glucagon on free fatty acid metabolism in humans. J Clin Endocrinol Metab 72, 308–315, doi: 10.1210/jcem-72-2-308 (1991). [DOI] [PubMed] [Google Scholar]
- 24.Nichols BJ & Denton RM Towards the molecular basis for the regulation of mitochondrial dehydrogenases by calcium ions. Mol Cell Biochem 149–150, 203–212, doi: 10.1007/bf01076578 (1995). [DOI] [PubMed] [Google Scholar]
- 25.Foster DW Malonyl-CoA: the regulator of fatty acid synthesis and oxidation. J Clin Invest 122, 1958–1959 (2012). [DOI] [PMC free article] [PubMed] [Google Scholar]
Methods-Only References
- 26.Perry RJ et al. Non-invasive assessment of hepatic mitochondrial metabolism by positional isotopomer NMR tracer analysis (PINTA). Nature Communications 8, 798, doi: 10.1038/s41467-017-01143-w (2017). [DOI] [PMC free article] [PubMed] [Google Scholar]
- 27.Petersen KF, Dufour S, Cline GW & Shulman GI Regulation of hepatic mitochondrial oxidation by glucose-alanine cycling during starvation in humans. J Clin Invest 129, 4671–4675, doi: 10.1172/JCI129913 (2019). [DOI] [PMC free article] [PubMed] [Google Scholar]
- 28.Perry RJ et al. Leptin reverses diabetes by suppression of the hypothalamic-pituitary-adrenal axis. Nat Med 20, 759–763, doi: 10.1038/nm.3579 (2014). [DOI] [PMC free article] [PubMed] [Google Scholar]
- 29.Perry RJ et al. Propionate Increases Hepatic Pyruvate Cycling and Anaplerosis and Alters Mitochondrial Metabolism. J Biol Chem 291, 12161–12170, doi: 10.1074/jbc.M116.720631 (2016). [DOI] [PMC free article] [PubMed] [Google Scholar]
- 30.Perry RJ et al. Mechanism for leptin’s acute insulin-independent effect to reverse diabetic ketoacidosis. J Clin Invest 127, 657–669, doi: 10.1172/JCI88477 (2017). [DOI] [PMC free article] [PubMed] [Google Scholar]
- 31.Yu C et al. Mechanism by which fatty acids inhibit insulin activation of insulin receptor substrate-1 (IRS-1)-associated phosphatidylinositol 3-kinase activity in muscle. J Biol Chem 277, 50230–50236, doi: 10.1074/jbc.M200958200 (2002). [DOI] [PubMed] [Google Scholar]
- 32.Jurczak MJ et al. SGLT2 deletion improves glucose homeostasis and preserves pancreatic beta-cell function. Diabetes 60, 890–898, doi: 10.2337/db10-1328 (2011). [DOI] [PMC free article] [PubMed] [Google Scholar]
- 33.Bligh EG & Dyer WJ A rapid method of total lipid extraction and purification. Can J Biochem Physiol 37, 911–917, doi: 10.1139/o59-099 (1959). [DOI] [PubMed] [Google Scholar]
- 34.Camporez JP et al. ApoA5 knockdown improves whole-body insulin sensitivity in high-fat-fed mice by reducing ectopic lipid content. J Lipid Res 56, 526–536, doi: 10.1194/jlr.M054080 (2015). [DOI] [PMC free article] [PubMed] [Google Scholar]
- 35.Camporez JP et al. Cellular mechanisms by which FGF21 improves insulin sensitivity in male mice. Endocrinology 154, 3099–3109, doi: 10.1210/en.2013-1191 (2013). [DOI] [PMC free article] [PubMed] [Google Scholar]
Associated Data
This section collects any data citations, data availability statements, or supplementary materials included in this article.


